Tinton Falls borough, NJ Map & Demographics
Tinton Falls borough Overview
$67,122
PER CAPITA INCOME
$168,047
AVG FAMILY INCOME
$107,959
AVG HOUSEHOLD INCOME
23.3%
WAGE / INCOME GAP [ % ]
76.7¢/ $1
WAGE / INCOME GAP [ $ ]
0.47
INEQUALITY / GINI INDEX
19,180
TOTAL POPULATION
9,265
MALE POPULATION
9,915
FEMALE POPULATION
93.44
MALES / 100 FEMALES
107.02
FEMALES / 100 MALES
47.4
MEDIAN AGE
3.0
AVG FAMILY SIZE
2.1
AVG HOUSEHOLD SIZE
10,200
LABOR FORCE [ PEOPLE ]
62.2%
PERCENT IN LABOR FORCE
6.2%
UNEMPLOYMENT RATE
Income in Tinton Falls borough
Income Overview in Tinton Falls borough
Per Capita Income in Tinton Falls borough is $67,122, while median incomes of families and households are $168,047 and $107,959 respectively.
| Characteristic | Number | Measure |
| Per Capita Income | 19,180 | $67,122 |
| Median Family Income | 4,796 | $168,047 |
| Mean Family Income | 4,796 | $199,512 |
| Median Household Income | 8,795 | $107,959 |
| Mean Household Income | 8,795 | $146,368 |
| Income Deficit | 4,796 | $0 |
| Wage / Income Gap (%) | 19,180 | 23.27% |
| Wage / Income Gap ($) | 19,180 | 76.73¢ per $1 |
| Gini / Inequality Index | 19,180 | 0.47 |
Earnings by Sex in Tinton Falls borough
Average Earnings in Tinton Falls borough are $68,281, $76,140 for men and $58,420 for women, a difference of 23.3%.
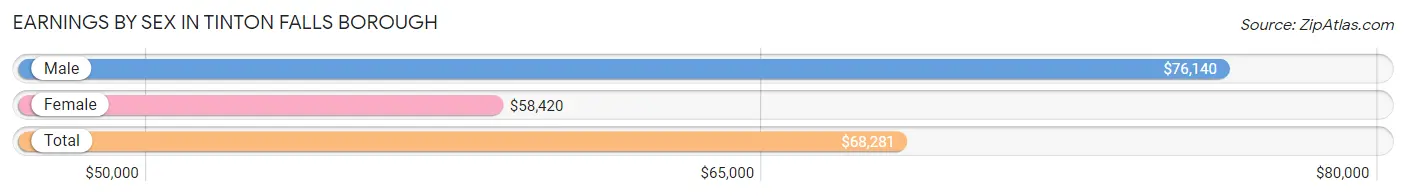
| Sex | Number | Average Earnings |
| Male | 5,366 (52.1%) | $76,140 |
| Female | 4,925 (47.9%) | $58,420 |
| Total | 10,291 (100.0%) | $68,281 |
Earnings by Sex by Income Bracket in Tinton Falls borough
The most common earnings brackets in Tinton Falls borough are $100,000+ for men (2,119 | 39.5%) and $75,000 to $99,999 for women (1,005 | 20.4%).
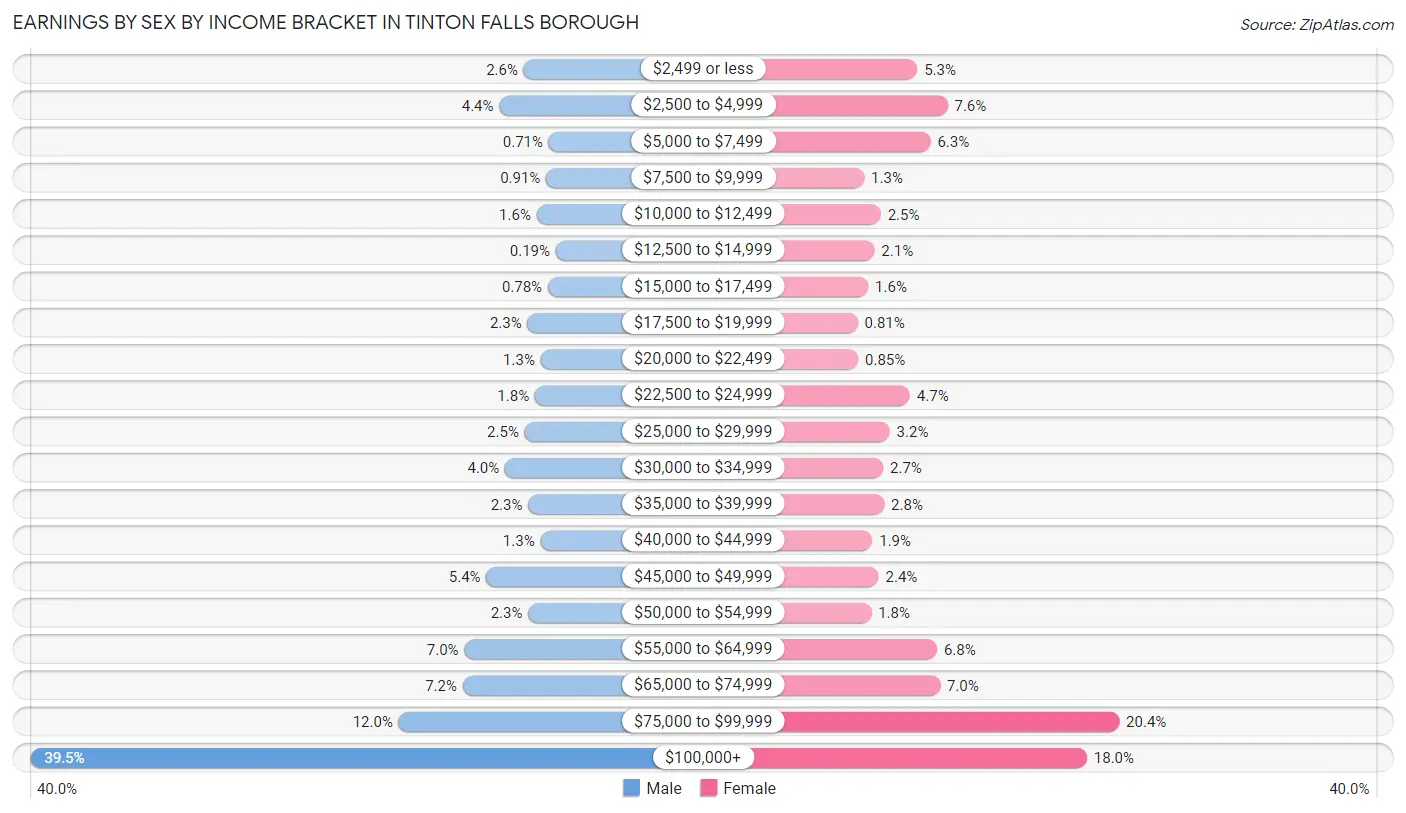
| Income | Male | Female |
| $2,499 or less | 139 (2.6%) | 260 (5.3%) |
| $2,500 to $4,999 | 237 (4.4%) | 372 (7.5%) |
| $5,000 to $7,499 | 38 (0.7%) | 309 (6.3%) |
| $7,500 to $9,999 | 49 (0.9%) | 64 (1.3%) |
| $10,000 to $12,499 | 87 (1.6%) | 125 (2.5%) |
| $12,500 to $14,999 | 10 (0.2%) | 102 (2.1%) |
| $15,000 to $17,499 | 42 (0.8%) | 79 (1.6%) |
| $17,500 to $19,999 | 124 (2.3%) | 40 (0.8%) |
| $20,000 to $22,499 | 71 (1.3%) | 42 (0.9%) |
| $22,500 to $24,999 | 94 (1.8%) | 233 (4.7%) |
| $25,000 to $29,999 | 135 (2.5%) | 158 (3.2%) |
| $30,000 to $34,999 | 214 (4.0%) | 134 (2.7%) |
| $35,000 to $39,999 | 121 (2.2%) | 138 (2.8%) |
| $40,000 to $44,999 | 72 (1.3%) | 94 (1.9%) |
| $45,000 to $49,999 | 289 (5.4%) | 117 (2.4%) |
| $50,000 to $54,999 | 121 (2.2%) | 90 (1.8%) |
| $55,000 to $64,999 | 378 (7.0%) | 333 (6.8%) |
| $65,000 to $74,999 | 384 (7.2%) | 344 (7.0%) |
| $75,000 to $99,999 | 642 (12.0%) | 1,005 (20.4%) |
| $100,000+ | 2,119 (39.5%) | 886 (18.0%) |
| Total | 5,366 (100.0%) | 4,925 (100.0%) |
Earnings by Sex by Educational Attainment in Tinton Falls borough
Average earnings in Tinton Falls borough are $88,651 for men and $70,250 for women, a difference of 20.8%. Men with an educational attainment of bachelor's degree enjoy the highest average annual earnings of $114,625, while those with high school diploma education earn the least with $49,233. Women with an educational attainment of graduate degree earn the most with the average annual earnings of $81,543, while those with high school diploma education have the smallest earnings of $35,865.
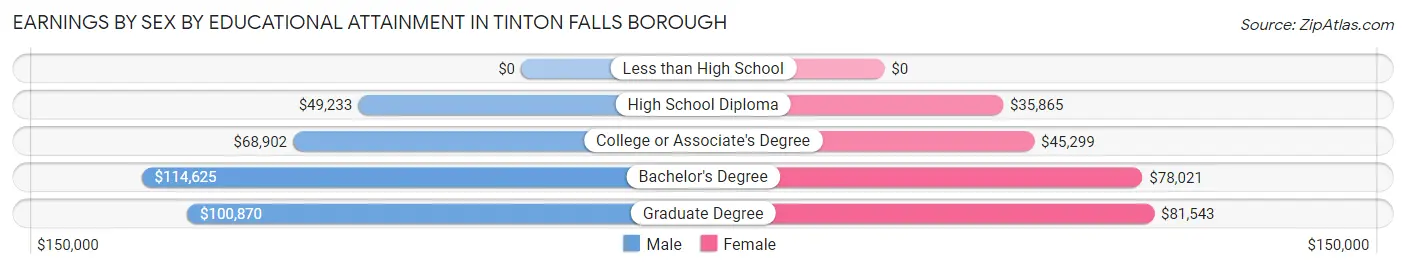
| Educational Attainment | Male Income | Female Income |
| Less than High School | - | - |
| High School Diploma | $49,233 | $35,865 |
| College or Associate's Degree | $68,902 | $45,299 |
| Bachelor's Degree | $114,625 | $78,021 |
| Graduate Degree | $100,870 | $81,543 |
| Total | $88,651 | $70,250 |
Family Income in Tinton Falls borough
Family Income Brackets in Tinton Falls borough
According to the Tinton Falls borough family income data, there are 1,981 families falling into the $200,000+ income range, which is the most common income bracket and makes up 41.3% of all families. Conversely, the less than $10,000 income bracket is the least frequent group with only 53 families (1.1%) belonging to this category.
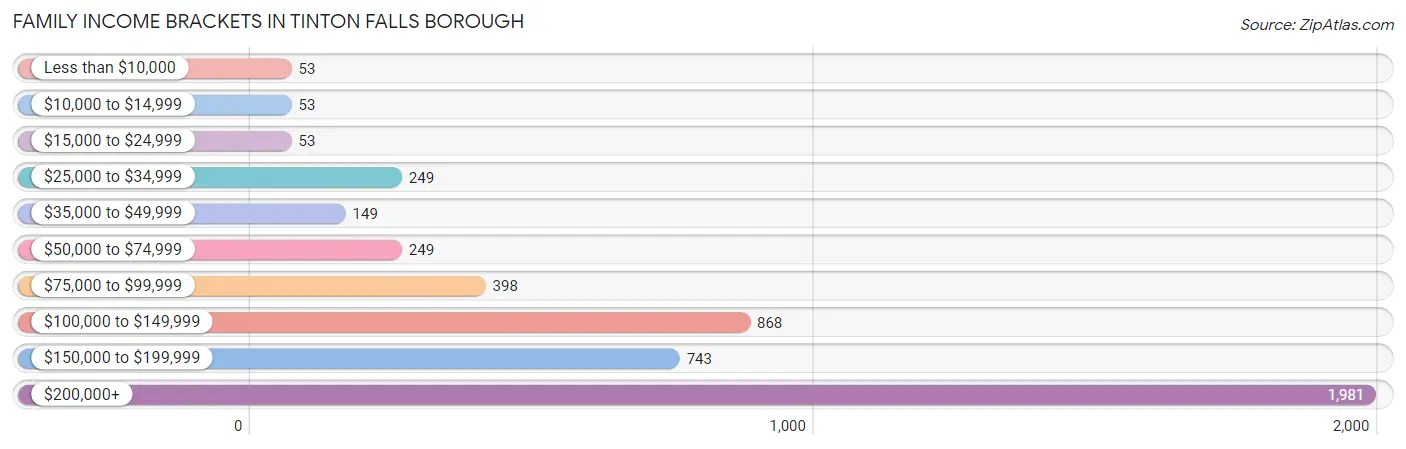
| Income Bracket | # Families | % Families |
| Less than $10,000 | 53 | 1.1% |
| $10,000 to $14,999 | 53 | 1.1% |
| $15,000 to $24,999 | 53 | 1.1% |
| $25,000 to $34,999 | 249 | 5.2% |
| $35,000 to $49,999 | 149 | 3.1% |
| $50,000 to $74,999 | 249 | 5.2% |
| $75,000 to $99,999 | 398 | 8.3% |
| $100,000 to $149,999 | 868 | 18.1% |
| $150,000 to $199,999 | 743 | 15.5% |
| $200,000+ | 1,981 | 41.3% |
Family Income by Famaliy Size in Tinton Falls borough
4-person families (1,091 | 22.8%) account for the highest median family income in Tinton Falls borough with $211,515 per family, while 2-person families (2,238 | 46.7%) have the highest median income of $73,166 per family member.
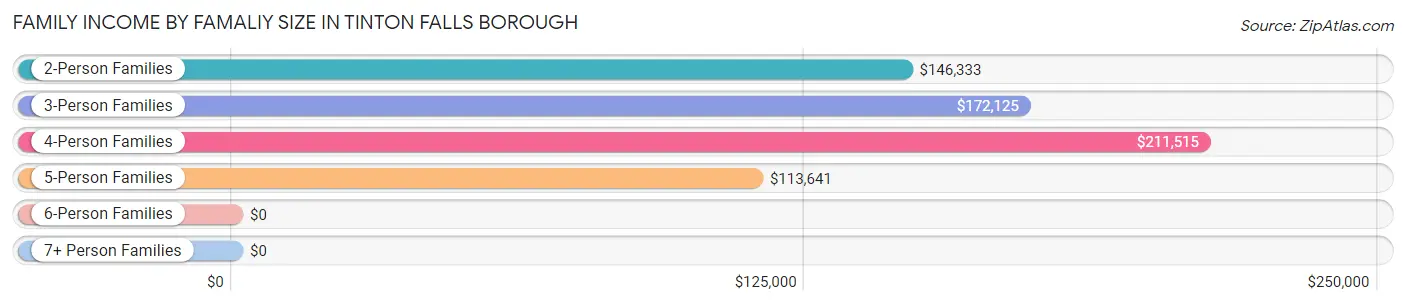
| Income Bracket | # Families | Median Income |
| 2-Person Families | 2,238 (46.7%) | $146,333 |
| 3-Person Families | 1,015 (21.2%) | $172,125 |
| 4-Person Families | 1,091 (22.8%) | $211,515 |
| 5-Person Families | 309 (6.4%) | $113,641 |
| 6-Person Families | 143 (3.0%) | $0 |
| 7+ Person Families | 0 (0.0%) | $0 |
| Total | 4,796 (100.0%) | $168,047 |
Family Income by Number of Earners in Tinton Falls borough
The median family income in Tinton Falls borough is $168,047, with families comprising 2 earners (2,174) having the highest median family income of $210,074, while families with 1 earner (976) have the lowest median family income of $104,524, accounting for 45.3% and 20.3% of families, respectively.
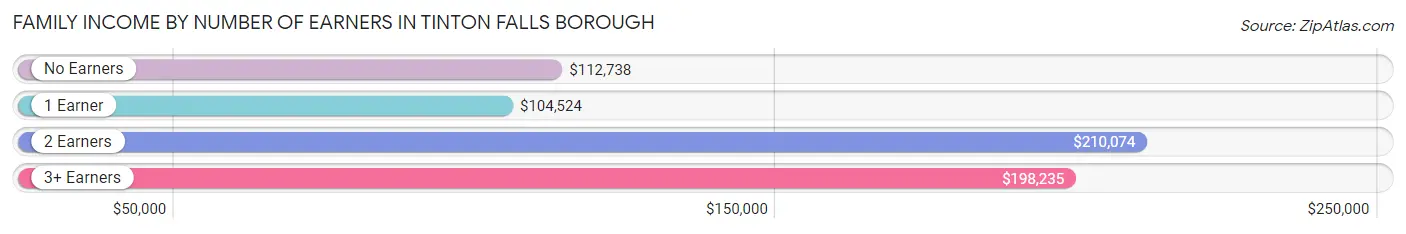
| Number of Earners | # Families | Median Income |
| No Earners | 806 (16.8%) | $112,738 |
| 1 Earner | 976 (20.3%) | $104,524 |
| 2 Earners | 2,174 (45.3%) | $210,074 |
| 3+ Earners | 840 (17.5%) | $198,235 |
| Total | 4,796 (100.0%) | $168,047 |
Household Income in Tinton Falls borough
Household Income Brackets in Tinton Falls borough
With 2,322 households falling in the category, the $200,000+ income range is the most frequent in Tinton Falls borough, accounting for 26.4% of all households. In contrast, only 193 households (2.2%) fall into the $10,000 to $14,999 income bracket, making it the least populous group.
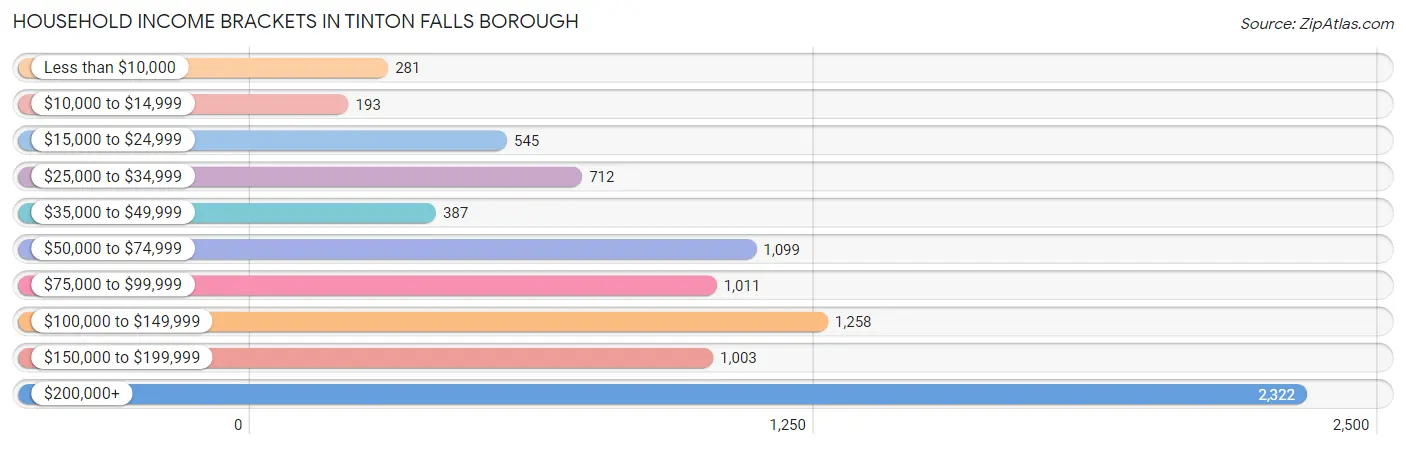
| Income Bracket | # Households | % Households |
| Less than $10,000 | 281 | 3.2% |
| $10,000 to $14,999 | 193 | 2.2% |
| $15,000 to $24,999 | 545 | 6.2% |
| $25,000 to $34,999 | 712 | 8.1% |
| $35,000 to $49,999 | 387 | 4.4% |
| $50,000 to $74,999 | 1,099 | 12.5% |
| $75,000 to $99,999 | 1,011 | 11.5% |
| $100,000 to $149,999 | 1,258 | 14.3% |
| $150,000 to $199,999 | 1,003 | 11.4% |
| $200,000+ | 2,322 | 26.4% |
Household Income by Householder Age in Tinton Falls borough
The median household income in Tinton Falls borough is $107,959, with the highest median household income of $165,438 found in the 25 to 44 years age bracket for the primary householder. A total of 1,906 households (21.7%) fall into this category. Meanwhile, the 15 to 24 years age bracket for the primary householder has the lowest median household income of $0, with 48 households (0.5%) in this group.
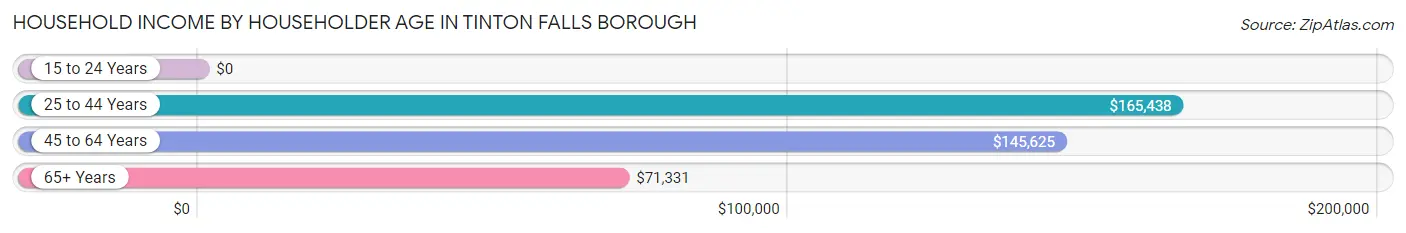
| Income Bracket | # Households | Median Income |
| 15 to 24 Years | 48 (0.5%) | $0 |
| 25 to 44 Years | 1,906 (21.7%) | $165,438 |
| 45 to 64 Years | 2,990 (34.0%) | $145,625 |
| 65+ Years | 3,851 (43.8%) | $71,331 |
| Total | 8,795 (100.0%) | $107,959 |
Poverty in Tinton Falls borough
Income Below Poverty by Sex and Age in Tinton Falls borough
With 9.2% poverty level for males and 9.1% for females among the residents of Tinton Falls borough, 18 to 24 year old males and 16 and 17 year old females are the most vulnerable to poverty, with 254 males (31.2%) and 135 females (31.3%) in their respective age groups living below the poverty level.
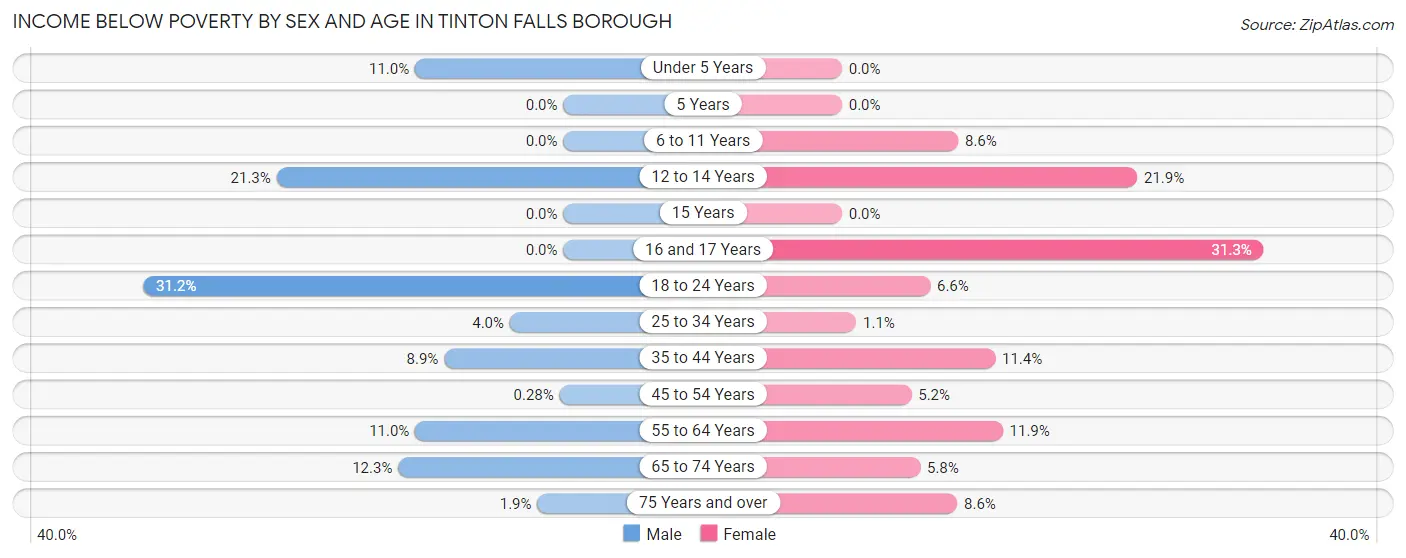
| Age Bracket | Male | Female |
| Under 5 Years | 48 (11.0%) | 0 (0.0%) |
| 5 Years | 0 (0.0%) | 0 (0.0%) |
| 6 to 11 Years | 0 (0.0%) | 27 (8.6%) |
| 12 to 14 Years | 89 (21.3%) | 96 (21.9%) |
| 15 Years | 0 (0.0%) | 0 (0.0%) |
| 16 and 17 Years | 0 (0.0%) | 135 (31.3%) |
| 18 to 24 Years | 254 (31.2%) | 51 (6.6%) |
| 25 to 34 Years | 35 (4.0%) | 7 (1.1%) |
| 35 to 44 Years | 113 (8.8%) | 129 (11.4%) |
| 45 to 54 Years | 3 (0.3%) | 68 (5.2%) |
| 55 to 64 Years | 155 (11.0%) | 139 (11.9%) |
| 65 to 74 Years | 136 (12.3%) | 67 (5.8%) |
| 75 Years and over | 16 (1.9%) | 170 (8.6%) |
| Total | 849 (9.2%) | 889 (9.1%) |
Income Above Poverty by Sex and Age in Tinton Falls borough
According to the poverty statistics in Tinton Falls borough, males aged 5 years and females aged under 5 years are the age groups that are most secure financially, with 100.0% of males and 100.0% of females in these age groups living above the poverty line.
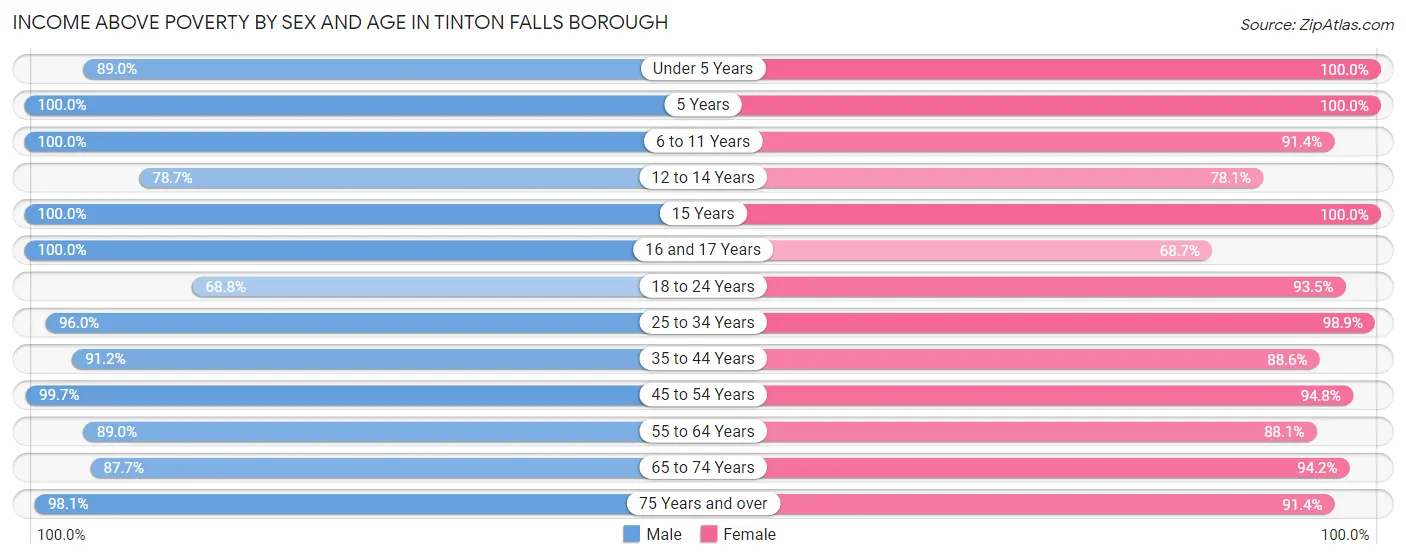
| Age Bracket | Male | Female |
| Under 5 Years | 388 (89.0%) | 366 (100.0%) |
| 5 Years | 63 (100.0%) | 56 (100.0%) |
| 6 to 11 Years | 379 (100.0%) | 286 (91.4%) |
| 12 to 14 Years | 329 (78.7%) | 342 (78.1%) |
| 15 Years | 296 (100.0%) | 5 (100.0%) |
| 16 and 17 Years | 235 (100.0%) | 296 (68.7%) |
| 18 to 24 Years | 560 (68.8%) | 728 (93.4%) |
| 25 to 34 Years | 847 (96.0%) | 653 (98.9%) |
| 35 to 44 Years | 1,164 (91.1%) | 1,005 (88.6%) |
| 45 to 54 Years | 1,061 (99.7%) | 1,250 (94.8%) |
| 55 to 64 Years | 1,254 (89.0%) | 1,025 (88.1%) |
| 65 to 74 Years | 973 (87.7%) | 1,087 (94.2%) |
| 75 Years and over | 813 (98.1%) | 1,817 (91.4%) |
| Total | 8,362 (90.8%) | 8,916 (90.9%) |
Income Below Poverty Among Married-Couple Families in Tinton Falls borough
The poverty statistics for married-couple families in Tinton Falls borough show that 5.0% or 202 of the total 4,072 families live below the poverty line. Families with 3 or 4 children have the highest poverty rate of 46.1%, comprising of 95 families. On the other hand, families with 1 or 2 children have the lowest poverty rate of 0.0%, which includes 0 families.
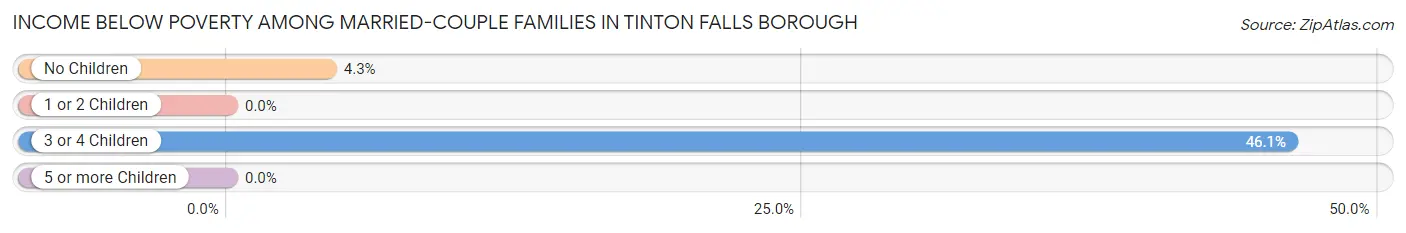
| Children | Above Poverty | Below Poverty |
| No Children | 2,381 (95.7%) | 107 (4.3%) |
| 1 or 2 Children | 1,378 (100.0%) | 0 (0.0%) |
| 3 or 4 Children | 111 (53.9%) | 95 (46.1%) |
| 5 or more Children | 0 (0.0%) | 0 (0.0%) |
| Total | 3,870 (95.0%) | 202 (5.0%) |
Income Below Poverty Among Single-Parent Households in Tinton Falls borough
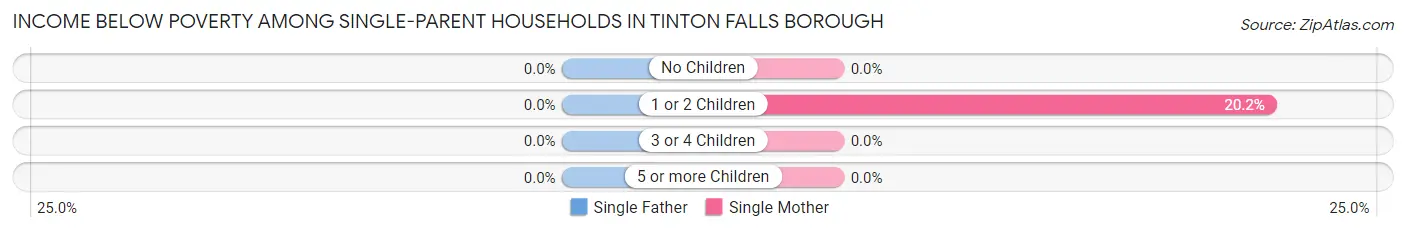
| Children | Single Father | Single Mother |
| No Children | 0 (0.0%) | 0 (0.0%) |
| 1 or 2 Children | 0 (0.0%) | 74 (20.2%) |
| 3 or 4 Children | 0 (0.0%) | 0 (0.0%) |
| 5 or more Children | 0 (0.0%) | 0 (0.0%) |
| Total | 0 (0.0%) | 74 (12.2%) |
Income Below Poverty Among Married-Couple vs Single-Parent Households in Tinton Falls borough
The poverty data for Tinton Falls borough shows that 202 of the married-couple family households (5.0%) and 74 of the single-parent households (10.2%) are living below the poverty level. Within the married-couple family households, those with 3 or 4 children have the highest poverty rate, with 95 households (46.1%) falling below the poverty line. Among the single-parent households, those with 1 or 2 children have the highest poverty rate, with 74 household (17.7%) living below poverty.
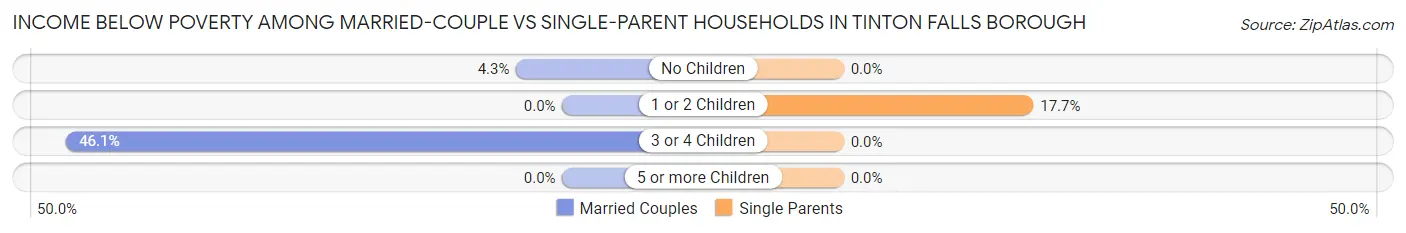
| Children | Married-Couple Families | Single-Parent Households |
| No Children | 107 (4.3%) | 0 (0.0%) |
| 1 or 2 Children | 0 (0.0%) | 74 (17.7%) |
| 3 or 4 Children | 95 (46.1%) | 0 (0.0%) |
| 5 or more Children | 0 (0.0%) | 0 (0.0%) |
| Total | 202 (5.0%) | 74 (10.2%) |
Race in Tinton Falls borough
The most populous races in Tinton Falls borough are White / Caucasian (15,221 | 79.4%), Black / African American (1,409 | 7.3%), and Hispanic or Latino (1,404 | 7.3%).
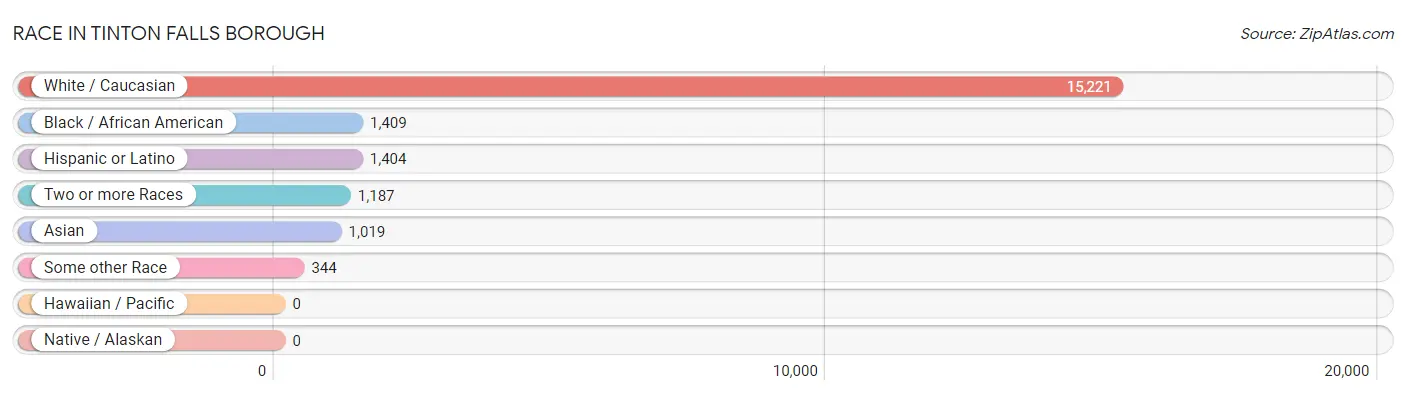
| Race | # Population | % Population |
| Asian | 1,019 | 5.3% |
| Black / African American | 1,409 | 7.3% |
| Hawaiian / Pacific | 0 | 0.0% |
| Hispanic or Latino | 1,404 | 7.3% |
| Native / Alaskan | 0 | 0.0% |
| White / Caucasian | 15,221 | 79.4% |
| Two or more Races | 1,187 | 6.2% |
| Some other Race | 344 | 1.8% |
| Total | 19,180 | 100.0% |
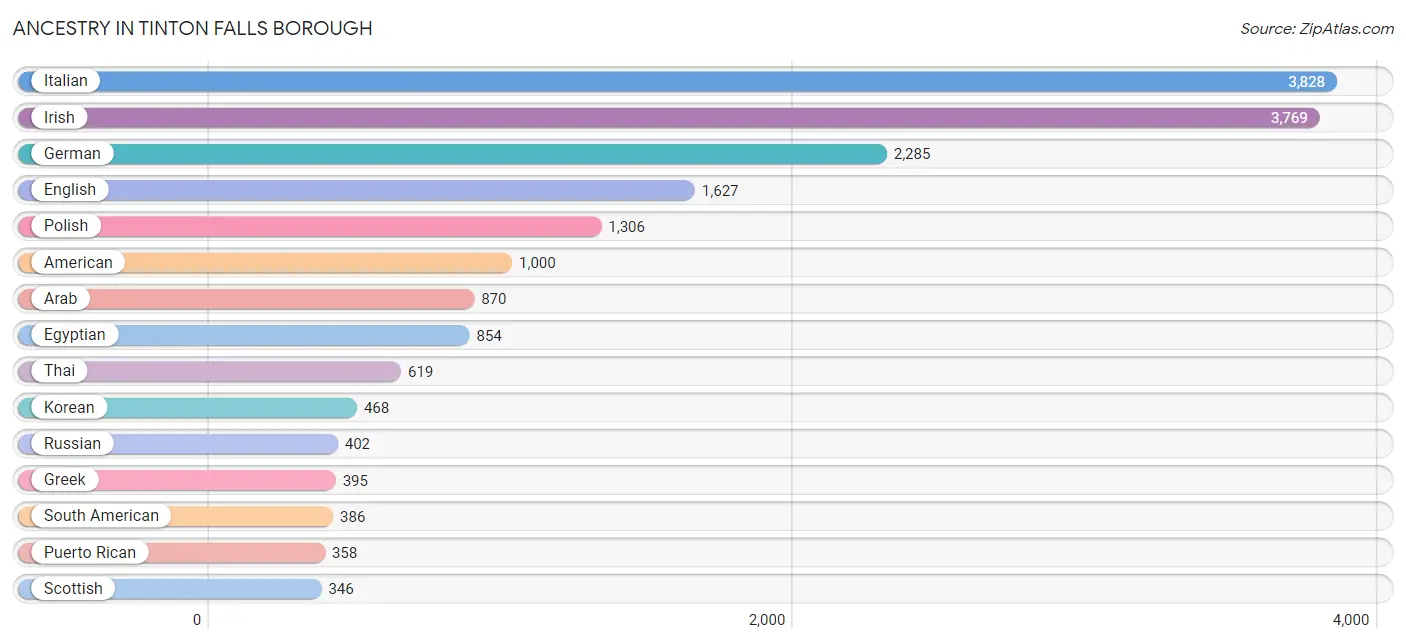
Ancestry in Tinton Falls borough
The most populous ancestries reported in Tinton Falls borough are Italian (3,828 | 20.0%), Irish (3,769 | 19.7%), German (2,285 | 11.9%), English (1,627 | 8.5%), and Polish (1,306 | 6.8%), together accounting for 66.8% of all Tinton Falls borough residents.
| Ancestry | # Population | % Population |
| African | 39 | 0.2% |
| Albanian | 28 | 0.2% |
| American | 1,000 | 5.2% |
| Arab | 870 | 4.5% |
| Argentinean | 67 | 0.4% |
| Australian | 22 | 0.1% |
| Austrian | 44 | 0.2% |
| Barbadian | 4 | 0.0% |
| Belgian | 8 | 0.0% |
| Blackfeet | 96 | 0.5% |
| Brazilian | 62 | 0.3% |
| British | 196 | 1.0% |
| Burmese | 160 | 0.8% |
| Canadian | 34 | 0.2% |
| Central American | 277 | 1.4% |
| Central American Indian | 34 | 0.2% |
| Cherokee | 91 | 0.5% |
| Chilean | 60 | 0.3% |
| Colombian | 151 | 0.8% |
| Costa Rican | 107 | 0.6% |
| Croatian | 38 | 0.2% |
| Cuban | 115 | 0.6% |
| Cypriot | 15 | 0.1% |
| Czech | 81 | 0.4% |
| Czechoslovakian | 3 | 0.0% |
| Danish | 24 | 0.1% |
| Dominican | 51 | 0.3% |
| Dutch | 110 | 0.6% |
| Eastern European | 41 | 0.2% |
| Egyptian | 854 | 4.4% |
| English | 1,627 | 8.5% |
| European | 182 | 0.9% |
| French | 77 | 0.4% |
| German | 2,285 | 11.9% |
| Greek | 395 | 2.1% |
| Guatemalan | 57 | 0.3% |
| Guyanese | 17 | 0.1% |
| Haitian | 20 | 0.1% |
| Hungarian | 94 | 0.5% |
| Indian (Asian) | 202 | 1.1% |
| Irish | 3,769 | 19.7% |
| Italian | 3,828 | 20.0% |
| Jamaican | 187 | 1.0% |
| Korean | 468 | 2.4% |
| Latvian | 62 | 0.3% |
| Lithuanian | 194 | 1.0% |
| Maltese | 29 | 0.2% |
| Mexican | 116 | 0.6% |
| Nicaraguan | 9 | 0.1% |
| Nigerian | 25 | 0.1% |
| Norwegian | 120 | 0.6% |
| Peruvian | 83 | 0.4% |
| Polish | 1,306 | 6.8% |
| Portuguese | 221 | 1.1% |
| Puerto Rican | 358 | 1.9% |
| Romanian | 12 | 0.1% |
| Russian | 402 | 2.1% |
| Salvadoran | 104 | 0.5% |
| Samoan | 9 | 0.1% |
| Scandinavian | 45 | 0.2% |
| Scotch-Irish | 119 | 0.6% |
| Scottish | 346 | 1.8% |
| Slavic | 10 | 0.1% |
| South American | 386 | 2.0% |
| Spaniard | 91 | 0.5% |
| Spanish | 7 | 0.0% |
| Sri Lankan | 20 | 0.1% |
| Subsaharan African | 106 | 0.5% |
| Swedish | 77 | 0.4% |
| Swiss | 79 | 0.4% |
| Syrian | 16 | 0.1% |
| Thai | 619 | 3.2% |
| Ukrainian | 108 | 0.6% |
| Venezuelan | 25 | 0.1% |
| Welsh | 89 | 0.5% |
| West Indian | 5 | 0.0% | View All 76 Rows |
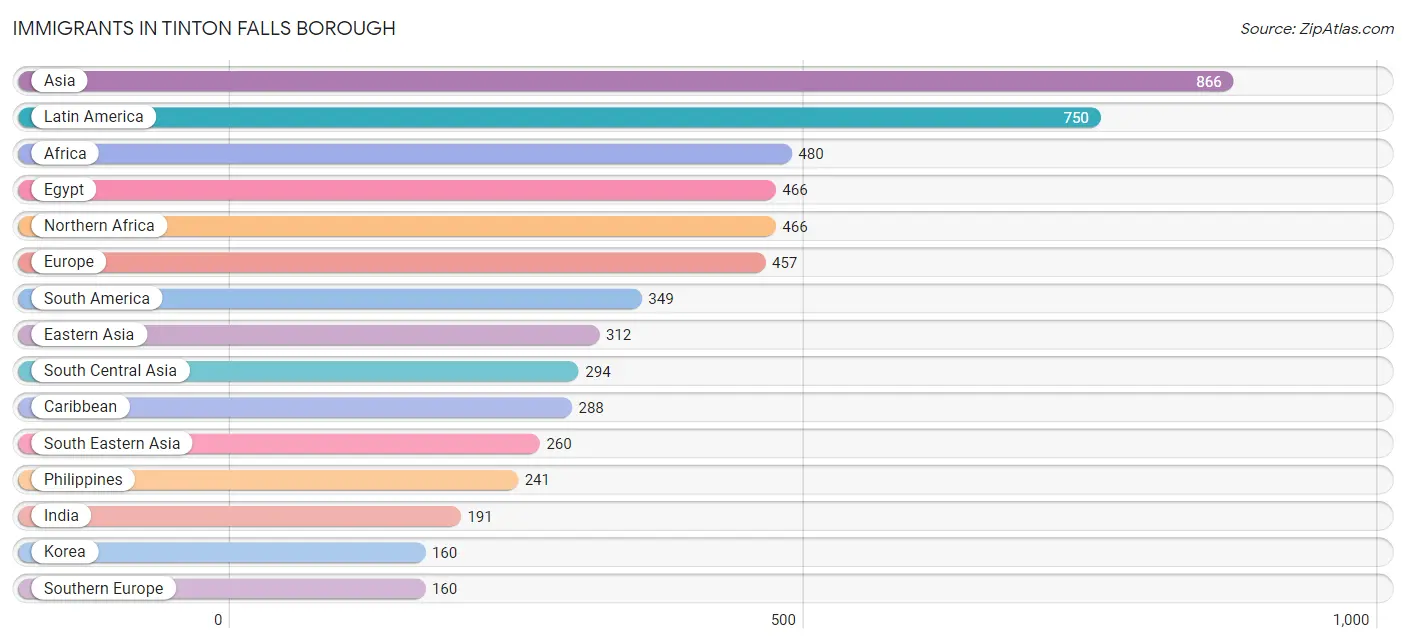
Immigrants in Tinton Falls borough
The most numerous immigrant groups reported in Tinton Falls borough came from Asia (866 | 4.5%), Latin America (750 | 3.9%), Africa (480 | 2.5%), Egypt (466 | 2.4%), and Northern Africa (466 | 2.4%), together accounting for 15.8% of all Tinton Falls borough residents.
| Immigration Origin | # Population | % Population |
| Africa | 480 | 2.5% |
| Argentina | 67 | 0.4% |
| Asia | 866 | 4.5% |
| Australia | 10 | 0.1% |
| Barbados | 4 | 0.0% |
| Brazil | 62 | 0.3% |
| Caribbean | 288 | 1.5% |
| Central America | 113 | 0.6% |
| Chile | 48 | 0.3% |
| China | 145 | 0.8% |
| Colombia | 47 | 0.3% |
| Costa Rica | 33 | 0.2% |
| Cuba | 100 | 0.5% |
| Czechoslovakia | 3 | 0.0% |
| Dominican Republic | 40 | 0.2% |
| Eastern Asia | 312 | 1.6% |
| Eastern Europe | 153 | 0.8% |
| Egypt | 466 | 2.4% |
| El Salvador | 43 | 0.2% |
| Europe | 457 | 2.4% |
| France | 5 | 0.0% |
| Germany | 82 | 0.4% |
| Greece | 43 | 0.2% |
| Guyana | 17 | 0.1% |
| Haiti | 20 | 0.1% |
| Hong Kong | 38 | 0.2% |
| Hungary | 6 | 0.0% |
| India | 191 | 1.0% |
| Italy | 26 | 0.1% |
| Jamaica | 124 | 0.6% |
| Japan | 7 | 0.0% |
| Korea | 160 | 0.8% |
| Latin America | 750 | 3.9% |
| Latvia | 89 | 0.5% |
| Mexico | 28 | 0.2% |
| Nepal | 103 | 0.5% |
| Nicaragua | 9 | 0.1% |
| Nigeria | 14 | 0.1% |
| Northern Africa | 466 | 2.4% |
| Northern Europe | 57 | 0.3% |
| Oceania | 10 | 0.1% |
| Peru | 83 | 0.4% |
| Philippines | 241 | 1.3% |
| Poland | 49 | 0.3% |
| Portugal | 35 | 0.2% |
| Romania | 6 | 0.0% |
| South America | 349 | 1.8% |
| South Central Asia | 294 | 1.5% |
| South Eastern Asia | 260 | 1.4% |
| Southern Europe | 160 | 0.8% |
| Spain | 27 | 0.1% |
| Taiwan | 20 | 0.1% |
| Venezuela | 25 | 0.1% |
| Vietnam | 19 | 0.1% |
| Western Africa | 14 | 0.1% |
| Western Europe | 87 | 0.4% | View All 56 Rows |
Sex and Age in Tinton Falls borough
Sex and Age in Tinton Falls borough
The most populous age groups in Tinton Falls borough are 15 to 19 Years (795 | 8.6%) for men and 85 Years and over (1,041 | 10.5%) for women.
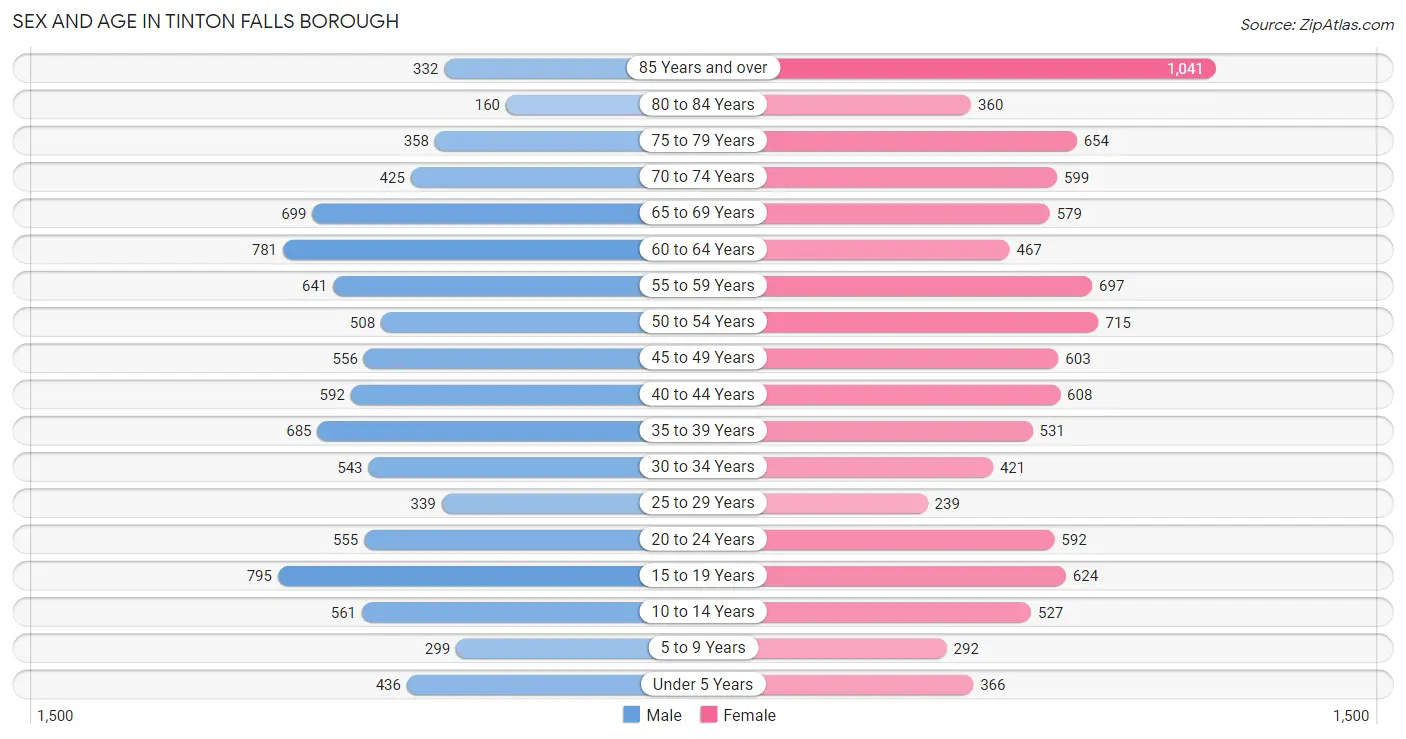
| Age Bracket | Male | Female |
| Under 5 Years | 436 (4.7%) | 366 (3.7%) |
| 5 to 9 Years | 299 (3.2%) | 292 (2.9%) |
| 10 to 14 Years | 561 (6.1%) | 527 (5.3%) |
| 15 to 19 Years | 795 (8.6%) | 624 (6.3%) |
| 20 to 24 Years | 555 (6.0%) | 592 (6.0%) |
| 25 to 29 Years | 339 (3.7%) | 239 (2.4%) |
| 30 to 34 Years | 543 (5.9%) | 421 (4.3%) |
| 35 to 39 Years | 685 (7.4%) | 531 (5.4%) |
| 40 to 44 Years | 592 (6.4%) | 608 (6.1%) |
| 45 to 49 Years | 556 (6.0%) | 603 (6.1%) |
| 50 to 54 Years | 508 (5.5%) | 715 (7.2%) |
| 55 to 59 Years | 641 (6.9%) | 697 (7.0%) |
| 60 to 64 Years | 781 (8.4%) | 467 (4.7%) |
| 65 to 69 Years | 699 (7.5%) | 579 (5.8%) |
| 70 to 74 Years | 425 (4.6%) | 599 (6.0%) |
| 75 to 79 Years | 358 (3.9%) | 654 (6.6%) |
| 80 to 84 Years | 160 (1.7%) | 360 (3.6%) |
| 85 Years and over | 332 (3.6%) | 1,041 (10.5%) |
| Total | 9,265 (100.0%) | 9,915 (100.0%) |
Families and Households in Tinton Falls borough
Median Family Size in Tinton Falls borough
The median family size in Tinton Falls borough is 3.00 persons per family, with married-couple families (4,072 | 84.9%) accounting for the largest median family size of 3.03 persons per family. On the other hand, single male/father families (117 | 2.4%) represent the smallest median family size with 2.04 persons per family.
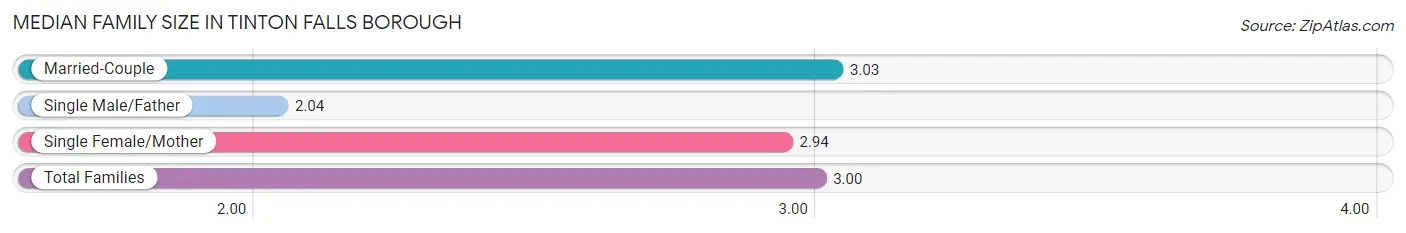
| Family Type | # Families | Family Size |
| Married-Couple | 4,072 (84.9%) | 3.03 |
| Single Male/Father | 117 (2.4%) | 2.04 |
| Single Female/Mother | 607 (12.7%) | 2.94 |
| Total Families | 4,796 (100.0%) | 3.00 |
Median Household Size in Tinton Falls borough
The median household size in Tinton Falls borough is 2.15 persons per household, with married-couple households (4,072 | 46.3%) accounting for the largest median household size of 3.03 persons per household. non-family households (3,999 | 45.5%) represent the smallest median household size with 1.12 persons per household.
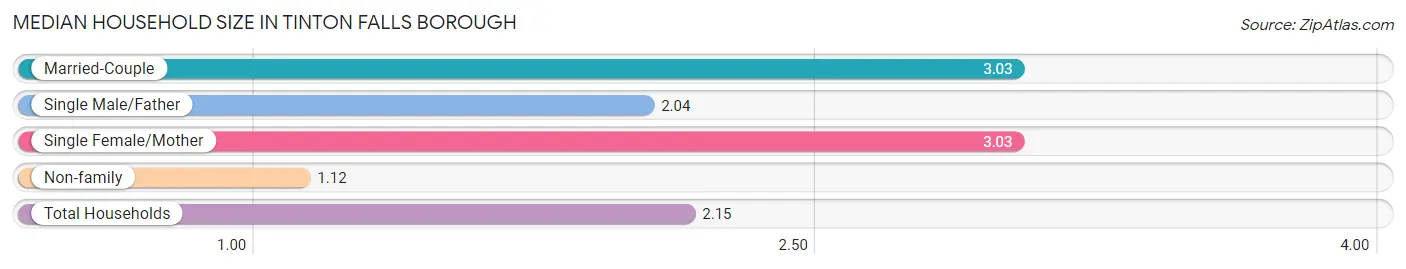
| Household Type | # Households | Household Size |
| Married-Couple | 4,072 (46.3%) | 3.03 |
| Single Male/Father | 117 (1.3%) | 2.04 |
| Single Female/Mother | 607 (6.9%) | 3.03 |
| Non-family | 3,999 (45.5%) | 1.12 |
| Total Households | 8,795 (100.0%) | 2.15 |
Household Size by Marriage Status in Tinton Falls borough
Out of a total of 8,795 households in Tinton Falls borough, 4,796 (54.5%) are family households, while 3,999 (45.5%) are nonfamily households. The most numerous type of family households are 2-person households, comprising 2,208, and the most common type of nonfamily households are 1-person households, comprising 3,665.
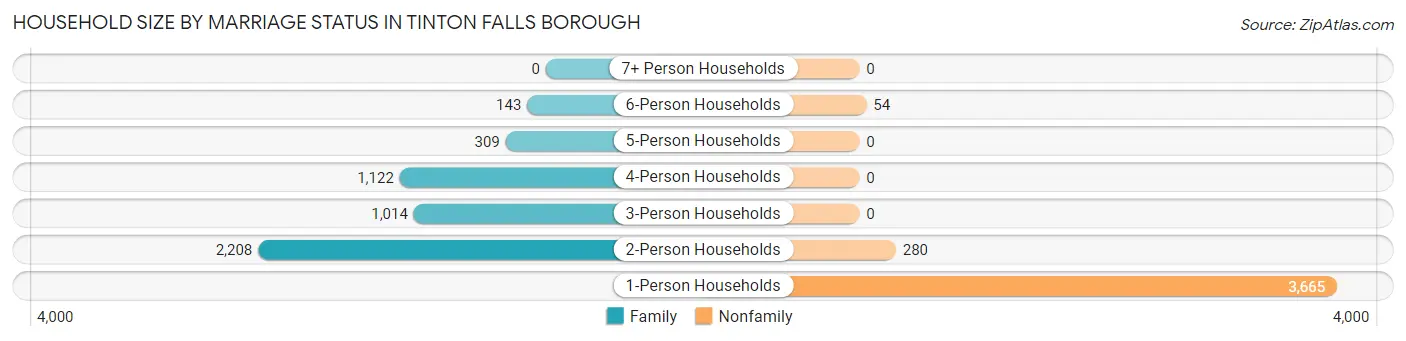
| Household Size | Family Households | Nonfamily Households |
| 1-Person Households | - | 3,665 (41.7%) |
| 2-Person Households | 2,208 (25.1%) | 280 (3.2%) |
| 3-Person Households | 1,014 (11.5%) | 0 (0.0%) |
| 4-Person Households | 1,122 (12.8%) | 0 (0.0%) |
| 5-Person Households | 309 (3.5%) | 0 (0.0%) |
| 6-Person Households | 143 (1.6%) | 54 (0.6%) |
| 7+ Person Households | 0 (0.0%) | 0 (0.0%) |
| Total | 4,796 (54.5%) | 3,999 (45.5%) |
Female Fertility in Tinton Falls borough
Fertility by Age in Tinton Falls borough
Average fertility rate in Tinton Falls borough is 89.0 births per 1,000 women. Women in the age bracket of 20 to 34 years have the highest fertility rate with 120.0 births per 1,000 women. Women in the age bracket of 35 to 50 years acount for 55.5% of all women with births.
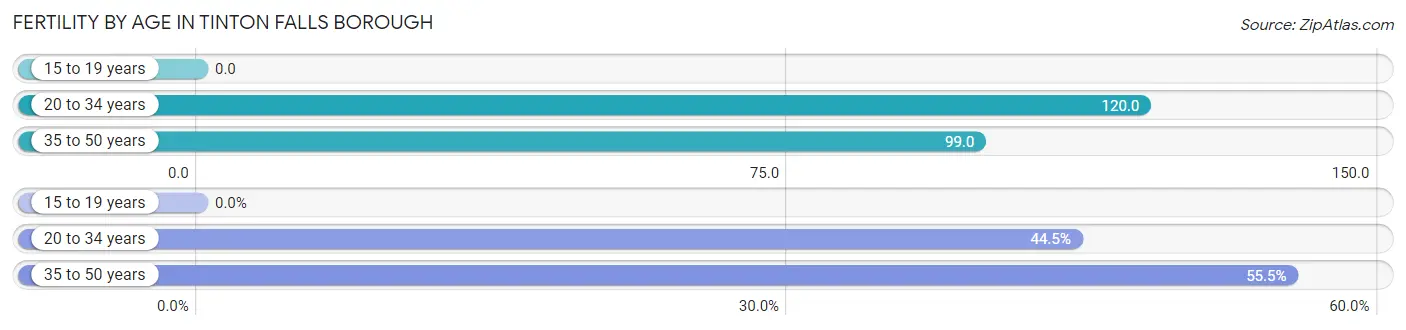
| Age Bracket | Women with Births | Births / 1,000 Women |
| 15 to 19 years | 0 (0.0%) | 0.0 |
| 20 to 34 years | 150 (44.5%) | 120.0 |
| 35 to 50 years | 187 (55.5%) | 99.0 |
| Total | 337 (100.0%) | 89.0 |
Fertility by Age by Marriage Status in Tinton Falls borough
84.9% of women with births (337) in Tinton Falls borough are married. The highest percentage of unmarried women with births falls into 20 to 34 years age bracket with 34.0% of them unmarried at the time of birth, while the lowest percentage of unmarried women with births belong to 35 to 50 years age bracket with 0.0% of them unmarried.
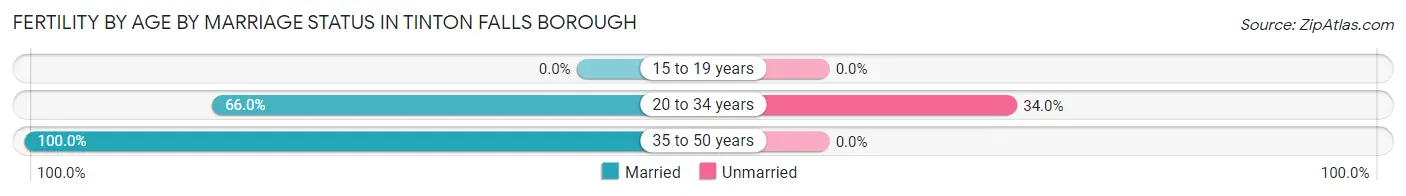
| Age Bracket | Married | Unmarried |
| 15 to 19 years | 0 (0.0%) | 0 (0.0%) |
| 20 to 34 years | 99 (66.0%) | 51 (34.0%) |
| 35 to 50 years | 187 (100.0%) | 0 (0.0%) |
| Total | 286 (84.9%) | 51 (15.1%) |
Fertility by Education in Tinton Falls borough
Average fertility rate in Tinton Falls borough is 89.0 births per 1,000 women. Women with the education attainment of graduate degree have the highest fertility rate of 162.0 births per 1,000 women, while women with the education attainment of less than high school have the lowest fertility at 31.0 births per 1,000 women. Women with the education attainment of graduate degree represent 38.0% of all women with births.
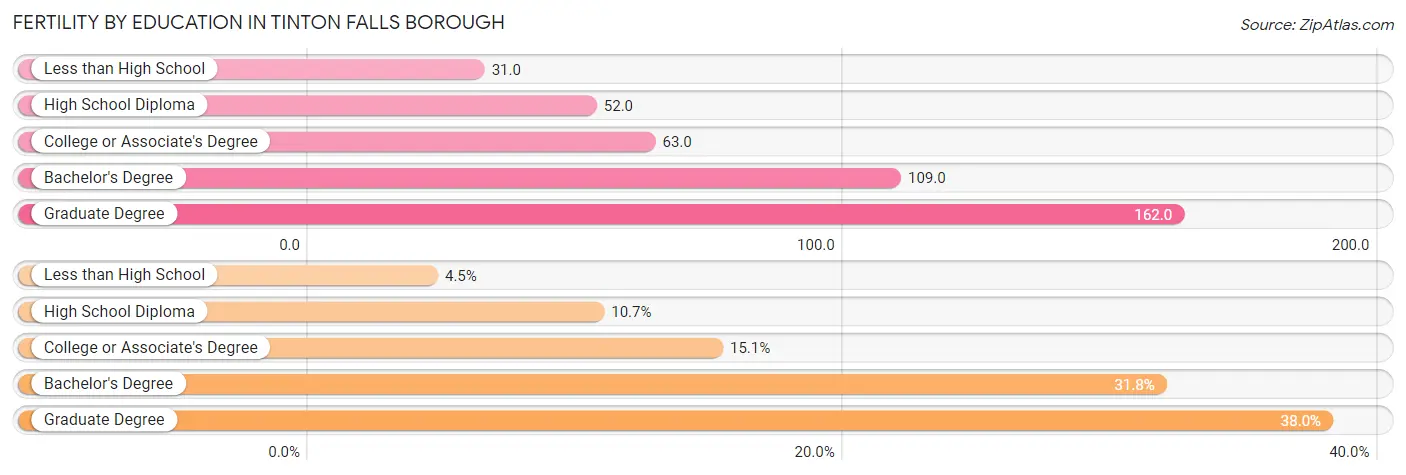
| Educational Attainment | Women with Births | Births / 1,000 Women |
| Less than High School | 15 (4.4%) | 31.0 |
| High School Diploma | 36 (10.7%) | 52.0 |
| College or Associate's Degree | 51 (15.1%) | 63.0 |
| Bachelor's Degree | 107 (31.8%) | 109.0 |
| Graduate Degree | 128 (38.0%) | 162.0 |
| Total | 337 (100.0%) | 89.0 |
Fertility by Education by Marriage Status in Tinton Falls borough
15.1% of women with births in Tinton Falls borough are unmarried. Women with the educational attainment of less than high school are most likely to be married with 100.0% of them married at childbirth, while women with the educational attainment of college or associate's degree are least likely to be married with 100.0% of them unmarried at childbirth.
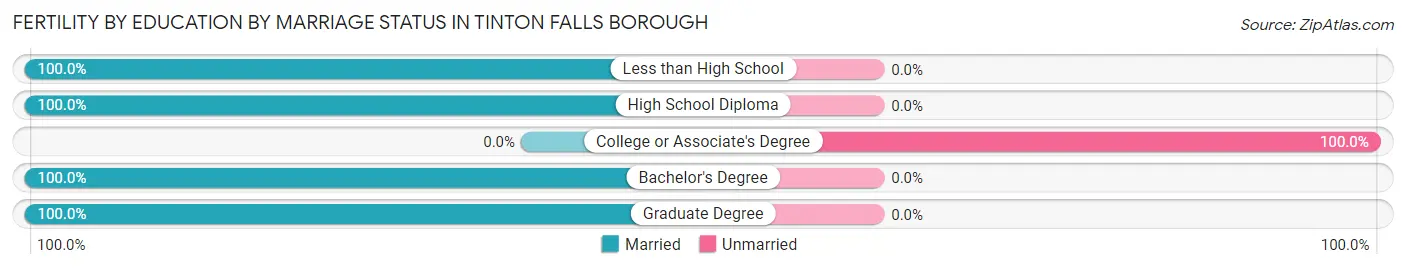
| Educational Attainment | Married | Unmarried |
| Less than High School | 15 (100.0%) | 0 (0.0%) |
| High School Diploma | 36 (100.0%) | 0 (0.0%) |
| College or Associate's Degree | 0 (0.0%) | 51 (100.0%) |
| Bachelor's Degree | 107 (100.0%) | 0 (0.0%) |
| Graduate Degree | 128 (100.0%) | 0 (0.0%) |
| Total | 286 (84.9%) | 51 (15.1%) |
Employment Characteristics in Tinton Falls borough
Employment by Class of Employer in Tinton Falls borough
Among the 9,348 employed individuals in Tinton Falls borough, private company employees (6,332 | 67.7%), local government employees (1,071 | 11.5%), and not-for-profit organizations (653 | 7.0%) make up the most common classes of employment.
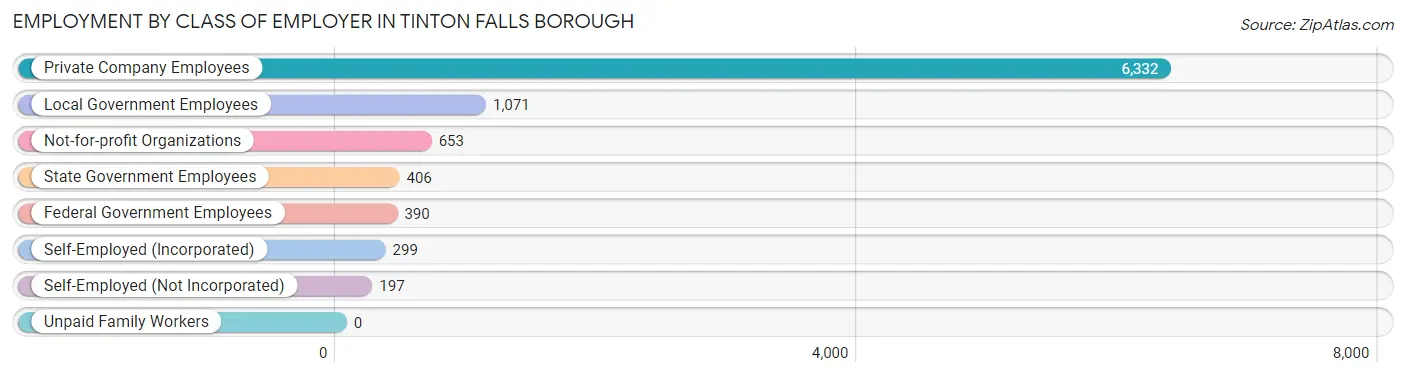
| Employer Class | # Employees | % Employees |
| Private Company Employees | 6,332 | 67.7% |
| Self-Employed (Incorporated) | 299 | 3.2% |
| Self-Employed (Not Incorporated) | 197 | 2.1% |
| Not-for-profit Organizations | 653 | 7.0% |
| Local Government Employees | 1,071 | 11.5% |
| State Government Employees | 406 | 4.3% |
| Federal Government Employees | 390 | 4.2% |
| Unpaid Family Workers | 0 | 0.0% |
| Total | 9,348 | 100.0% |
Employment Status by Age in Tinton Falls borough
According to the labor force statistics for Tinton Falls borough, out of the total population over 16 years of age (16,398), 62.2% or 10,200 individuals are in the labor force, with 6.2% or 632 of them unemployed. The age group with the highest labor force participation rate is 25 to 29 years, with 100.0% or 578 individuals in the labor force. Within the labor force, the 55 to 59 years age range has the highest percentage of unemployed individuals, with 17.5% or 195 of them being unemployed.
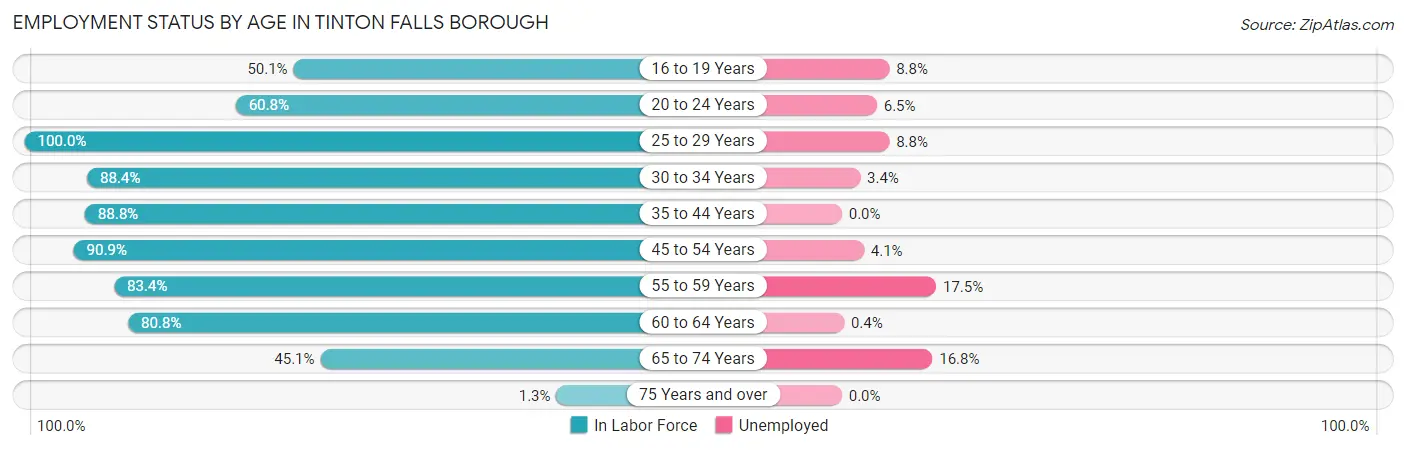
| Age Bracket | In Labor Force | Unemployed |
| 16 to 19 Years | 560 (50.1%) | 49 (8.8%) |
| 20 to 24 Years | 697 (60.8%) | 45 (6.5%) |
| 25 to 29 Years | 578 (100.0%) | 51 (8.8%) |
| 30 to 34 Years | 852 (88.4%) | 29 (3.4%) |
| 35 to 44 Years | 2,145 (88.8%) | 0 (0.0%) |
| 45 to 54 Years | 2,165 (90.9%) | 89 (4.1%) |
| 55 to 59 Years | 1,116 (83.4%) | 195 (17.5%) |
| 60 to 64 Years | 1,008 (80.8%) | 4 (0.4%) |
| 65 to 74 Years | 1,038 (45.1%) | 174 (16.8%) |
| 75 Years and over | 38 (1.3%) | 0 (0.0%) |
| Total | 10,200 (62.2%) | 632 (6.2%) |
Employment Status by Educational Attainment in Tinton Falls borough
According to labor force statistics for Tinton Falls borough, 88.1% of individuals (7,864) out of the total population between 25 and 64 years of age (8,926) are in the labor force, with 4.7% or 370 of them being unemployed. The group with the highest labor force participation rate are those with the educational attainment of bachelor's degree or higher, with 93.8% or 5,013 individuals in the labor force. Within the labor force, individuals with high school diploma education have the highest percentage of unemployment, with 13.3% or 138 of them being unemployed.
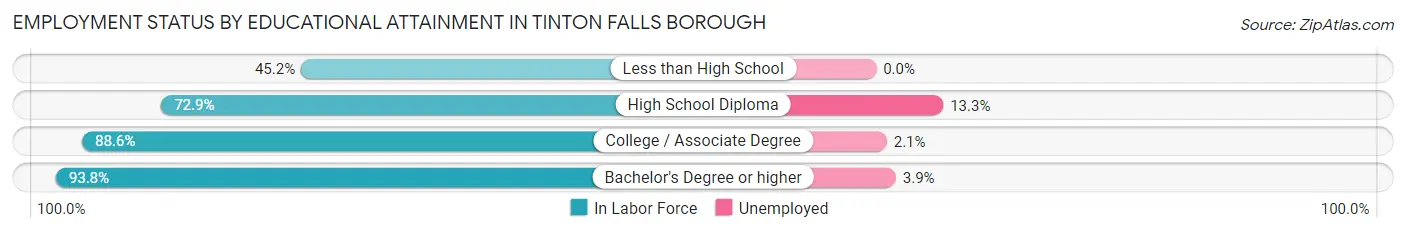
| Educational Attainment | In Labor Force | Unemployed |
| Less than High School | 104 (45.2%) | 0 (0.0%) |
| High School Diploma | 1,035 (72.9%) | 189 (13.3%) |
| College / Associate Degree | 1,712 (88.6%) | 41 (2.1%) |
| Bachelor's Degree or higher | 5,013 (93.8%) | 208 (3.9%) |
| Total | 7,864 (88.1%) | 420 (4.7%) |
Employment Occupations by Sex in Tinton Falls borough
Management, Business, Science and Arts Occupations
The most common Management, Business, Science and Arts occupations in Tinton Falls borough are Community & Social Service (1,552 | 16.4%), Management (1,244 | 13.1%), Computers, Engineering & Science (999 | 10.5%), Education Instruction & Library (866 | 9.1%), and Business & Financial (767 | 8.1%).
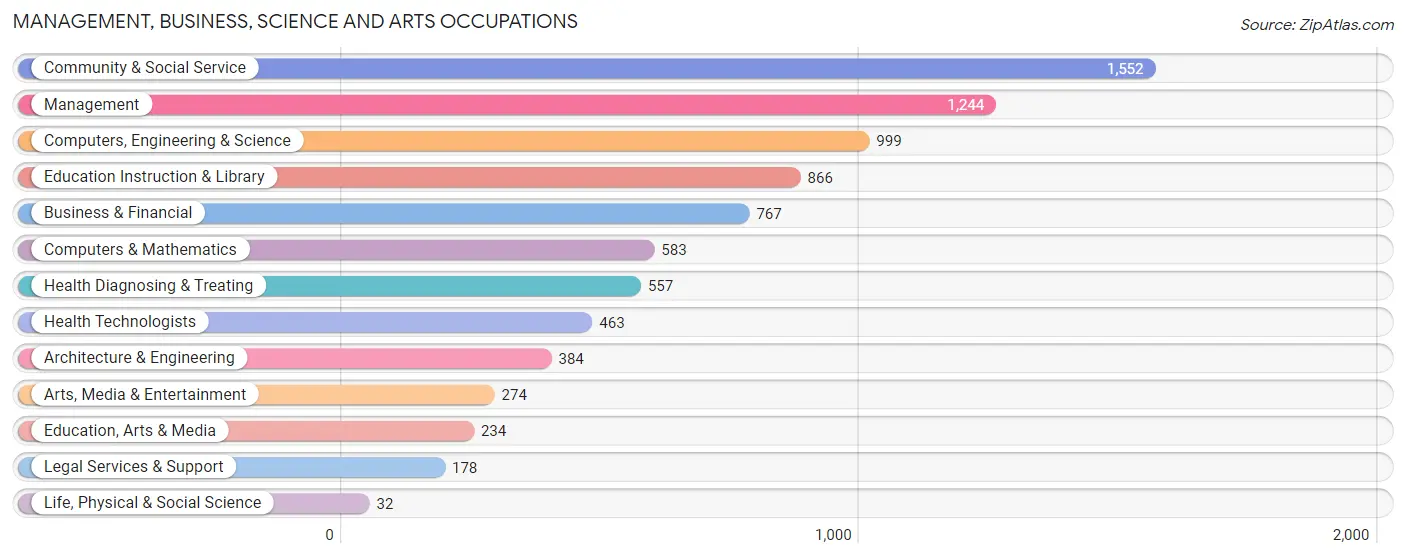
Management, Business, Science and Arts Occupations by Sex
Within the Management, Business, Science and Arts occupations in Tinton Falls borough, the most male-oriented occupations are Architecture & Engineering (97.1%), Computers, Engineering & Science (79.4%), and Arts, Media & Entertainment (76.6%), while the most female-oriented occupations are Health Diagnosing & Treating (93.2%), Health Technologists (91.8%), and Legal Services & Support (68.5%).
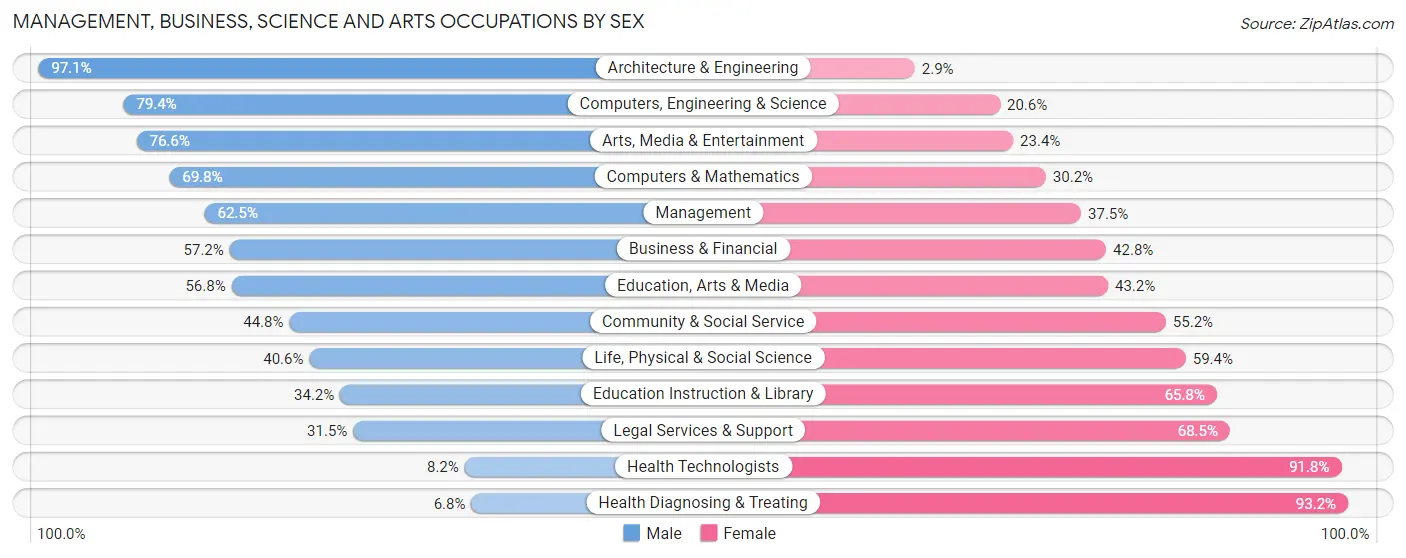
| Occupation | Male | Female |
| Management | 777 (62.5%) | 467 (37.5%) |
| Business & Financial | 439 (57.2%) | 328 (42.8%) |
| Computers, Engineering & Science | 793 (79.4%) | 206 (20.6%) |
| Computers & Mathematics | 407 (69.8%) | 176 (30.2%) |
| Architecture & Engineering | 373 (97.1%) | 11 (2.9%) |
| Life, Physical & Social Science | 13 (40.6%) | 19 (59.4%) |
| Community & Social Service | 695 (44.8%) | 857 (55.2%) |
| Education, Arts & Media | 133 (56.8%) | 101 (43.2%) |
| Legal Services & Support | 56 (31.5%) | 122 (68.5%) |
| Education Instruction & Library | 296 (34.2%) | 570 (65.8%) |
| Arts, Media & Entertainment | 210 (76.6%) | 64 (23.4%) |
| Health Diagnosing & Treating | 38 (6.8%) | 519 (93.2%) |
| Health Technologists | 38 (8.2%) | 425 (91.8%) |
| Total (Category) | 2,742 (53.6%) | 2,377 (46.4%) |
| Total (Overall) | 4,900 (51.6%) | 4,594 (48.4%) |
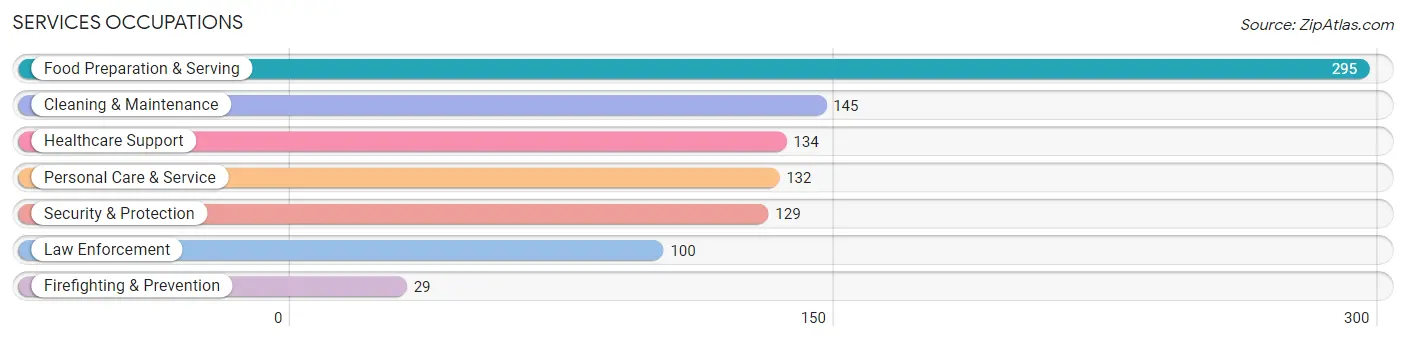
Services Occupations
The most common Services occupations in Tinton Falls borough are Food Preparation & Serving (295 | 3.1%), Cleaning & Maintenance (145 | 1.5%), Healthcare Support (134 | 1.4%), Personal Care & Service (132 | 1.4%), and Security & Protection (129 | 1.4%).
Services Occupations by Sex
Within the Services occupations in Tinton Falls borough, the most male-oriented occupations are Security & Protection (100.0%), Firefighting & Prevention (100.0%), and Law Enforcement (100.0%), while the most female-oriented occupations are Personal Care & Service (93.9%), Healthcare Support (79.1%), and Food Preparation & Serving (74.2%).
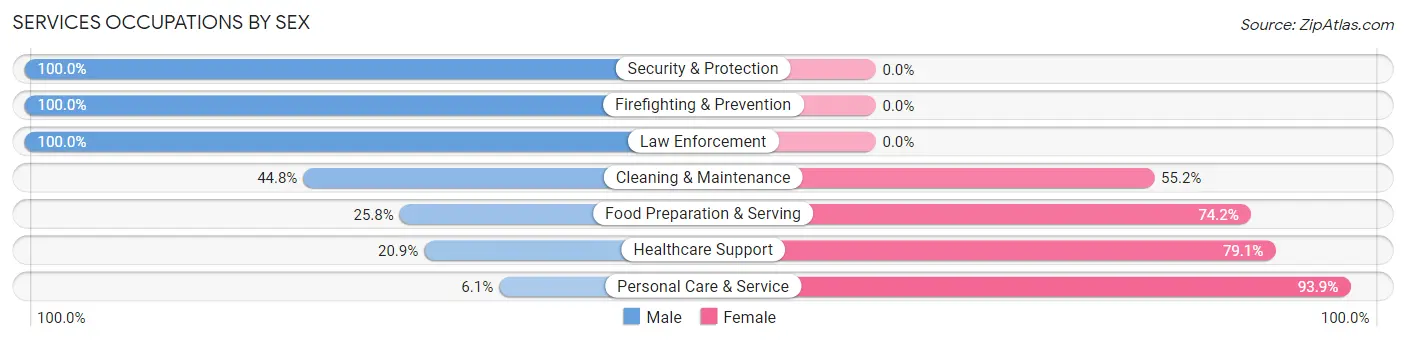
| Occupation | Male | Female |
| Healthcare Support | 28 (20.9%) | 106 (79.1%) |
| Security & Protection | 129 (100.0%) | 0 (0.0%) |
| Firefighting & Prevention | 29 (100.0%) | 0 (0.0%) |
| Law Enforcement | 100 (100.0%) | 0 (0.0%) |
| Food Preparation & Serving | 76 (25.8%) | 219 (74.2%) |
| Cleaning & Maintenance | 65 (44.8%) | 80 (55.2%) |
| Personal Care & Service | 8 (6.1%) | 124 (93.9%) |
| Total (Category) | 306 (36.6%) | 529 (63.3%) |
| Total (Overall) | 4,900 (51.6%) | 4,594 (48.4%) |
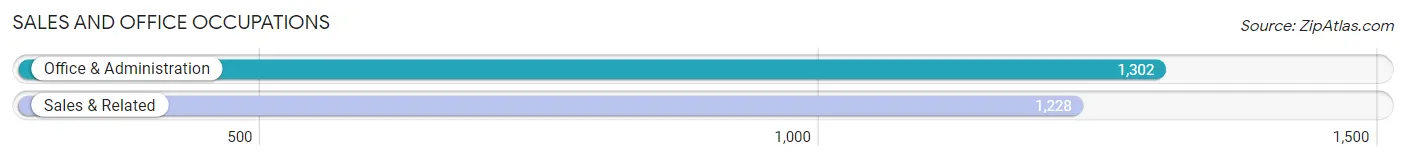
Sales and Office Occupations
The most common Sales and Office occupations in Tinton Falls borough are Office & Administration (1,302 | 13.7%), and Sales & Related (1,228 | 12.9%).
Sales and Office Occupations by Sex
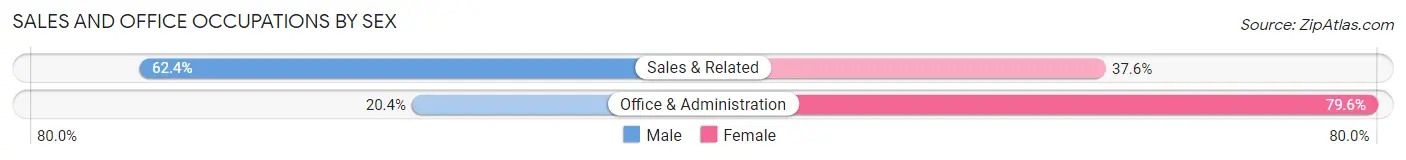
| Occupation | Male | Female |
| Sales & Related | 766 (62.4%) | 462 (37.6%) |
| Office & Administration | 266 (20.4%) | 1,036 (79.6%) |
| Total (Category) | 1,032 (40.8%) | 1,498 (59.2%) |
| Total (Overall) | 4,900 (51.6%) | 4,594 (48.4%) |
Natural Resources, Construction and Maintenance Occupations
The most common Natural Resources, Construction and Maintenance occupations in Tinton Falls borough are Construction & Extraction (221 | 2.3%), Installation, Maintenance & Repair (168 | 1.8%), and Farming, Fishing & Forestry (78 | 0.8%).
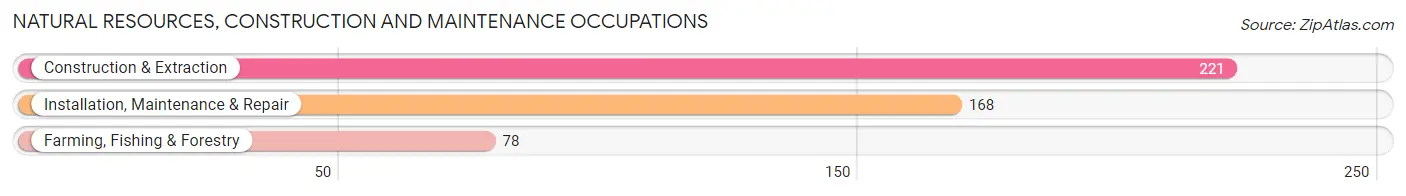
Natural Resources, Construction and Maintenance Occupations by Sex
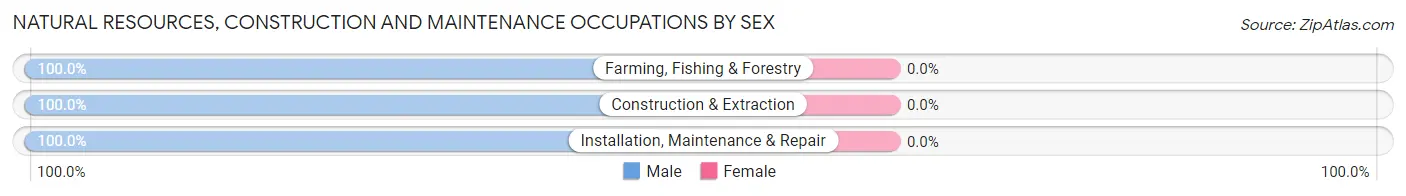
| Occupation | Male | Female |
| Farming, Fishing & Forestry | 78 (100.0%) | 0 (0.0%) |
| Construction & Extraction | 221 (100.0%) | 0 (0.0%) |
| Installation, Maintenance & Repair | 168 (100.0%) | 0 (0.0%) |
| Total (Category) | 467 (100.0%) | 0 (0.0%) |
| Total (Overall) | 4,900 (51.6%) | 4,594 (48.4%) |
Production, Transportation and Moving Occupations
The most common Production, Transportation and Moving occupations in Tinton Falls borough are Production (303 | 3.2%), Transportation (194 | 2.0%), and Material Moving (46 | 0.5%).
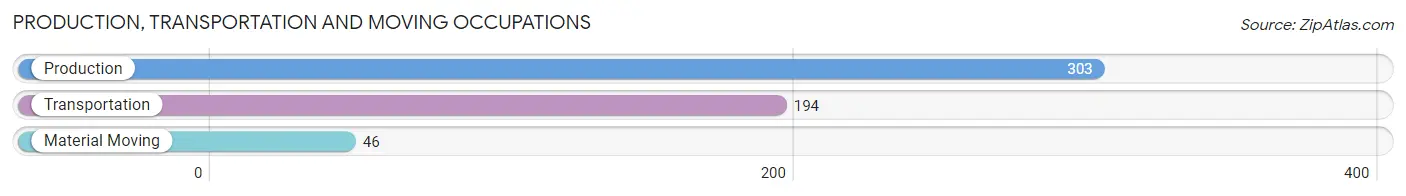
Production, Transportation and Moving Occupations by Sex
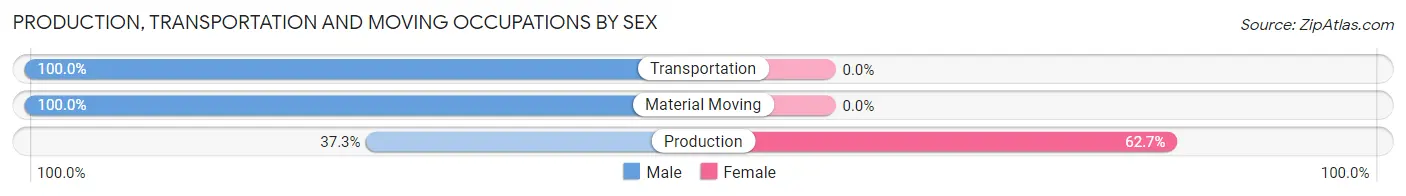
| Occupation | Male | Female |
| Production | 113 (37.3%) | 190 (62.7%) |
| Transportation | 194 (100.0%) | 0 (0.0%) |
| Material Moving | 46 (100.0%) | 0 (0.0%) |
| Total (Category) | 353 (65.0%) | 190 (35.0%) |
| Total (Overall) | 4,900 (51.6%) | 4,594 (48.4%) |
Employment Industries by Sex in Tinton Falls borough
Employment Industries in Tinton Falls borough
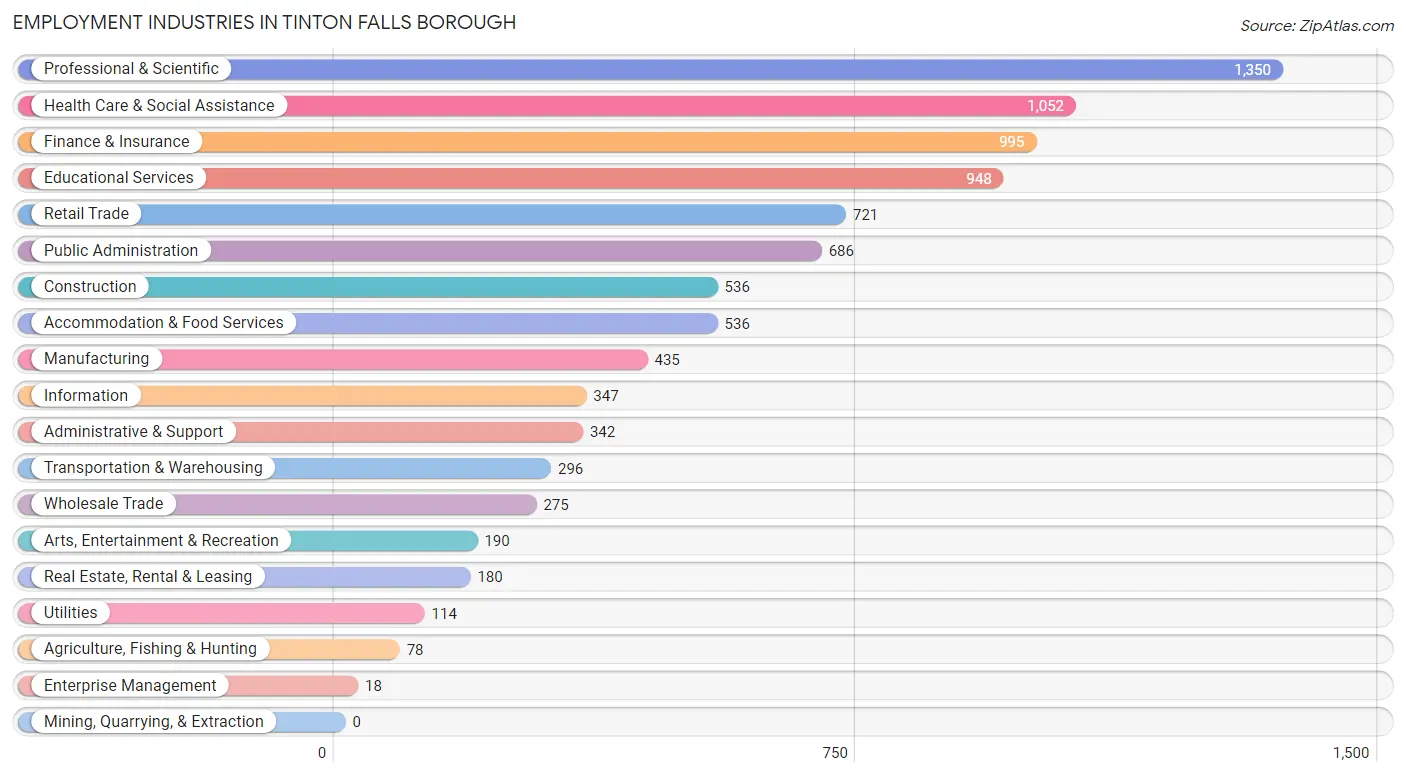
The major employment industries in Tinton Falls borough include Professional & Scientific (1,350 | 14.2%), Health Care & Social Assistance (1,052 | 11.1%), Finance & Insurance (995 | 10.5%), Educational Services (948 | 10.0%), and Retail Trade (721 | 7.6%).
Employment Industries by Sex in Tinton Falls borough
The Tinton Falls borough industries that see more men than women are Agriculture, Fishing & Hunting (100.0%), Enterprise Management (100.0%), and Information (85.3%), whereas the industries that tend to have a higher number of women are Health Care & Social Assistance (83.2%), Real Estate, Rental & Leasing (76.7%), and Administrative & Support (72.8%).
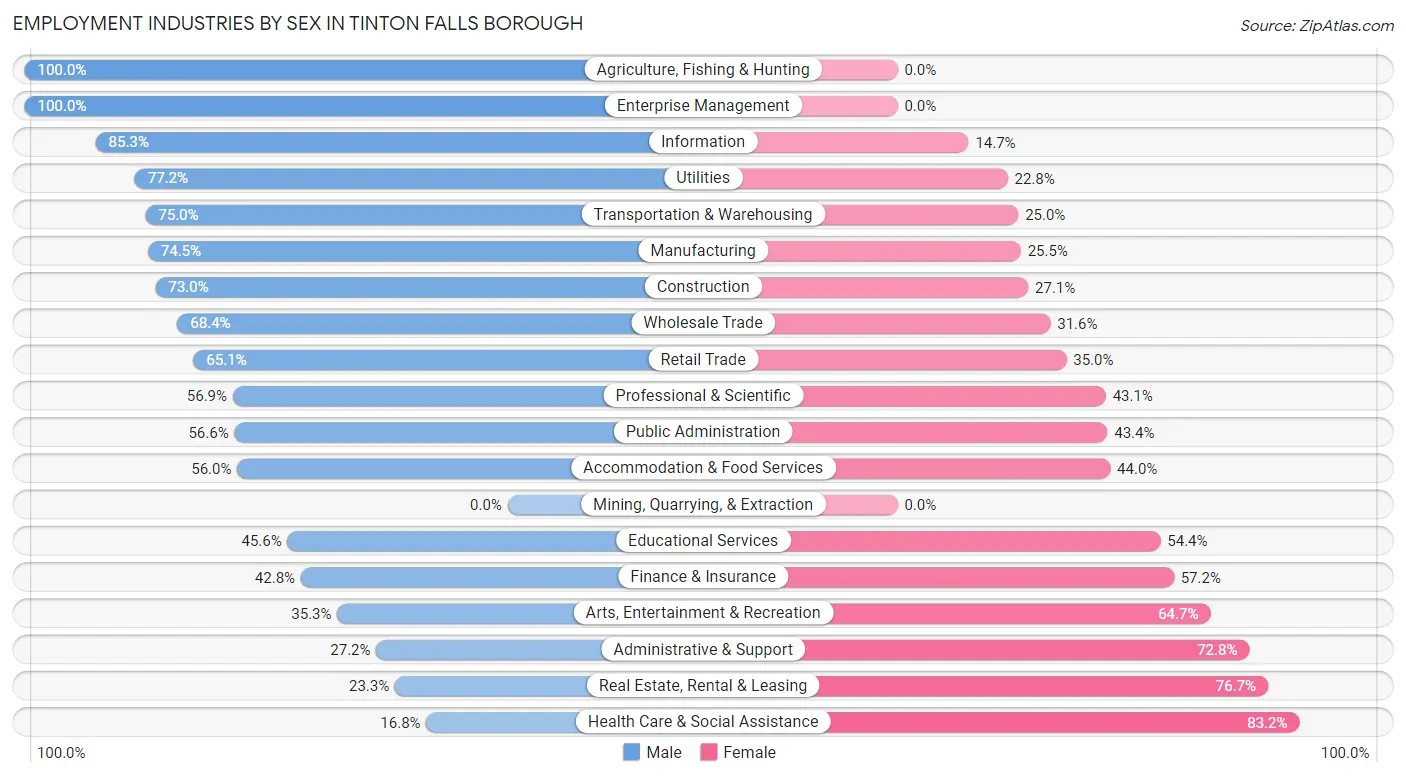
| Industry | Male | Female |
| Agriculture, Fishing & Hunting | 78 (100.0%) | 0 (0.0%) |
| Mining, Quarrying, & Extraction | 0 (0.0%) | 0 (0.0%) |
| Construction | 391 (73.0%) | 145 (27.1%) |
| Manufacturing | 324 (74.5%) | 111 (25.5%) |
| Wholesale Trade | 188 (68.4%) | 87 (31.6%) |
| Retail Trade | 469 (65.0%) | 252 (34.9%) |
| Transportation & Warehousing | 222 (75.0%) | 74 (25.0%) |
| Utilities | 88 (77.2%) | 26 (22.8%) |
| Information | 296 (85.3%) | 51 (14.7%) |
| Finance & Insurance | 426 (42.8%) | 569 (57.2%) |
| Real Estate, Rental & Leasing | 42 (23.3%) | 138 (76.7%) |
| Professional & Scientific | 768 (56.9%) | 582 (43.1%) |
| Enterprise Management | 18 (100.0%) | 0 (0.0%) |
| Administrative & Support | 93 (27.2%) | 249 (72.8%) |
| Educational Services | 432 (45.6%) | 516 (54.4%) |
| Health Care & Social Assistance | 177 (16.8%) | 875 (83.2%) |
| Arts, Entertainment & Recreation | 67 (35.3%) | 123 (64.7%) |
| Accommodation & Food Services | 300 (56.0%) | 236 (44.0%) |
| Public Administration | 388 (56.6%) | 298 (43.4%) |
| Total | 4,900 (51.6%) | 4,594 (48.4%) |
Education in Tinton Falls borough
School Enrollment in Tinton Falls borough
The most common levels of schooling among the 4,074 students in Tinton Falls borough are high school (1,381 | 33.9%), middle school (858 | 21.1%), and college / undergraduate (779 | 19.1%).
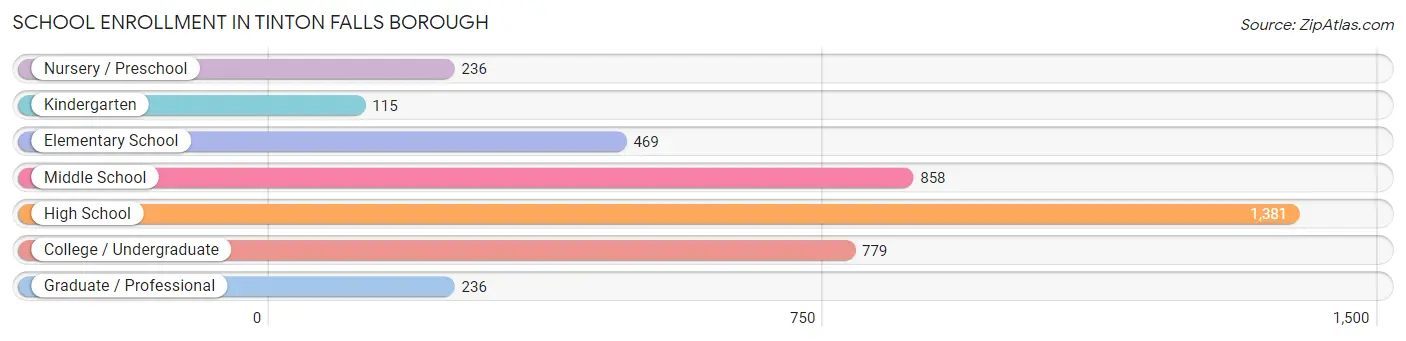
| School Level | # Students | % Students |
| Nursery / Preschool | 236 | 5.8% |
| Kindergarten | 115 | 2.8% |
| Elementary School | 469 | 11.5% |
| Middle School | 858 | 21.1% |
| High School | 1,381 | 33.9% |
| College / Undergraduate | 779 | 19.1% |
| Graduate / Professional | 236 | 5.8% |
| Total | 4,074 | 100.0% |
School Enrollment by Age by Funding Source in Tinton Falls borough
Out of a total of 4,074 students who are enrolled in schools in Tinton Falls borough, 949 (23.3%) attend a private institution, while the remaining 3,125 (76.7%) are enrolled in public schools. The age group of 3 to 4 year olds has the highest likelihood of being enrolled in private schools, with 176 (85.4% in the age bracket) enrolled. Conversely, the age group of 10 to 14 year olds has the lowest likelihood of being enrolled in a private school, with 1,024 (94.1% in the age bracket) attending a public institution.
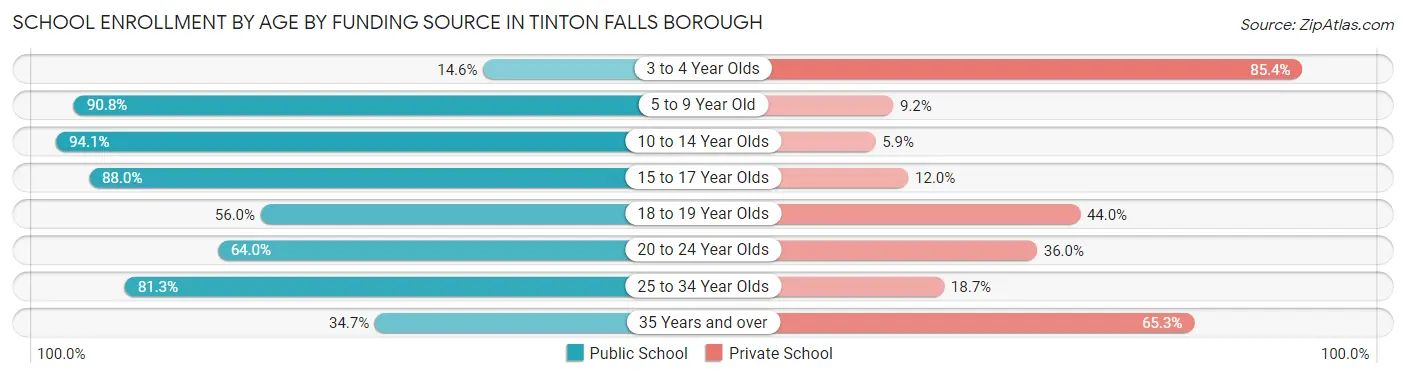
| Age Bracket | Public School | Private School |
| 3 to 4 Year Olds | 30 (14.6%) | 176 (85.4%) |
| 5 to 9 Year Old | 514 (90.8%) | 52 (9.2%) |
| 10 to 14 Year Olds | 1,024 (94.1%) | 64 (5.9%) |
| 15 to 17 Year Olds | 821 (88.0%) | 112 (12.0%) |
| 18 to 19 Year Olds | 243 (56.0%) | 191 (44.0%) |
| 20 to 24 Year Olds | 356 (64.0%) | 200 (36.0%) |
| 25 to 34 Year Olds | 61 (81.3%) | 14 (18.7%) |
| 35 Years and over | 75 (34.7%) | 141 (65.3%) |
| Total | 3,125 (76.7%) | 949 (23.3%) |
Educational Attainment by Field of Study in Tinton Falls borough
Business (1,992 | 23.3%), education (1,047 | 12.3%), social sciences (837 | 9.8%), literature & languages (609 | 7.1%), and communications (563 | 6.6%) are the most common fields of study among 8,540 individuals in Tinton Falls borough who have obtained a bachelor's degree or higher.
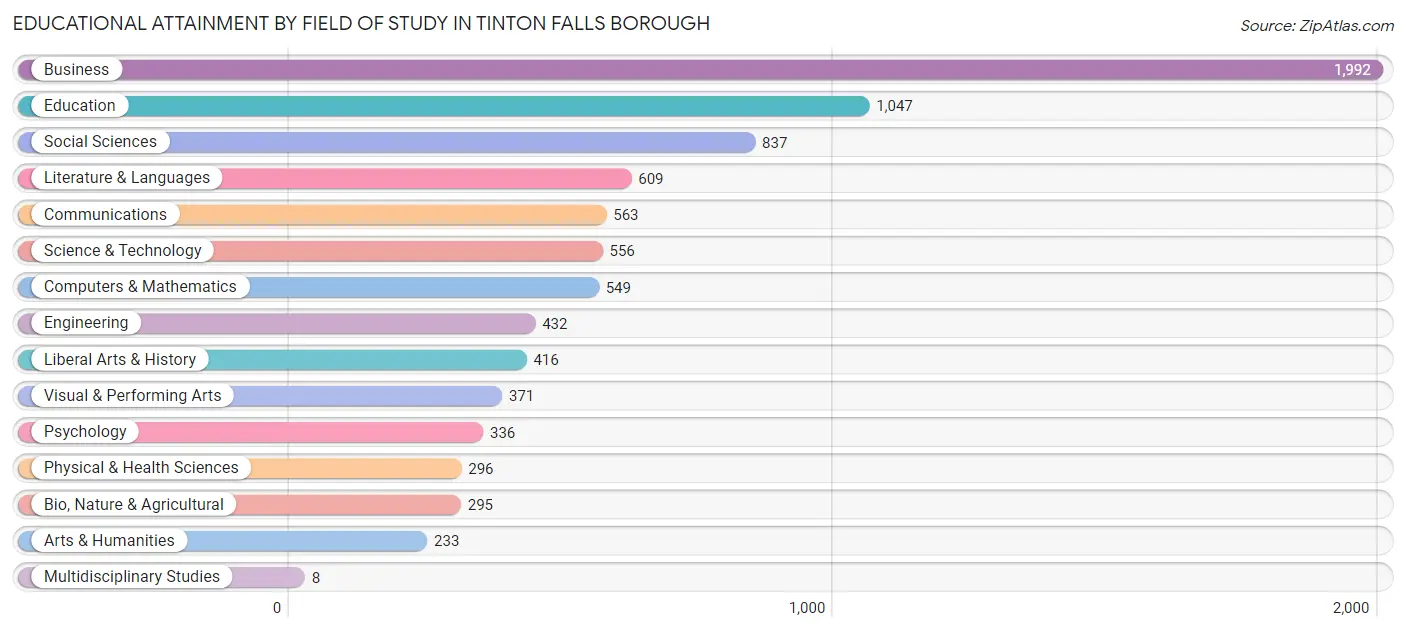
| Field of Study | # Graduates | % Graduates |
| Computers & Mathematics | 549 | 6.4% |
| Bio, Nature & Agricultural | 295 | 3.5% |
| Physical & Health Sciences | 296 | 3.5% |
| Psychology | 336 | 3.9% |
| Social Sciences | 837 | 9.8% |
| Engineering | 432 | 5.1% |
| Multidisciplinary Studies | 8 | 0.1% |
| Science & Technology | 556 | 6.5% |
| Business | 1,992 | 23.3% |
| Education | 1,047 | 12.3% |
| Literature & Languages | 609 | 7.1% |
| Liberal Arts & History | 416 | 4.9% |
| Visual & Performing Arts | 371 | 4.3% |
| Communications | 563 | 6.6% |
| Arts & Humanities | 233 | 2.7% |
| Total | 8,540 | 100.0% |
Transportation & Commute in Tinton Falls borough
Vehicle Availability by Sex in Tinton Falls borough
The most prevalent vehicle ownership categories in Tinton Falls borough are males with 2 vehicles (2,020, accounting for 42.4%) and females with 2 vehicles (1,772, making up 44.2%).
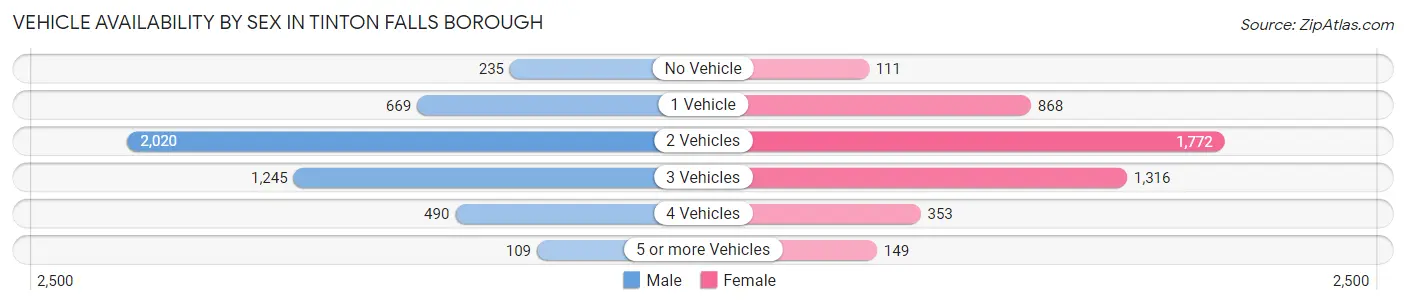
| Vehicles Available | Male | Female |
| No Vehicle | 235 (4.9%) | 111 (2.4%) |
| 1 Vehicle | 669 (14.0%) | 868 (19.0%) |
| 2 Vehicles | 2,020 (42.4%) | 1,772 (38.8%) |
| 3 Vehicles | 1,245 (26.1%) | 1,316 (28.8%) |
| 4 Vehicles | 490 (10.3%) | 353 (7.7%) |
| 5 or more Vehicles | 109 (2.3%) | 149 (3.3%) |
| Total | 4,768 (100.0%) | 4,569 (100.0%) |
Commute Time in Tinton Falls borough
The most frequently occuring commute durations in Tinton Falls borough are 15 to 19 minutes (1,399 commuters, 17.5%), 10 to 14 minutes (1,148 commuters, 14.4%), and 5 to 9 minutes (772 commuters, 9.7%).
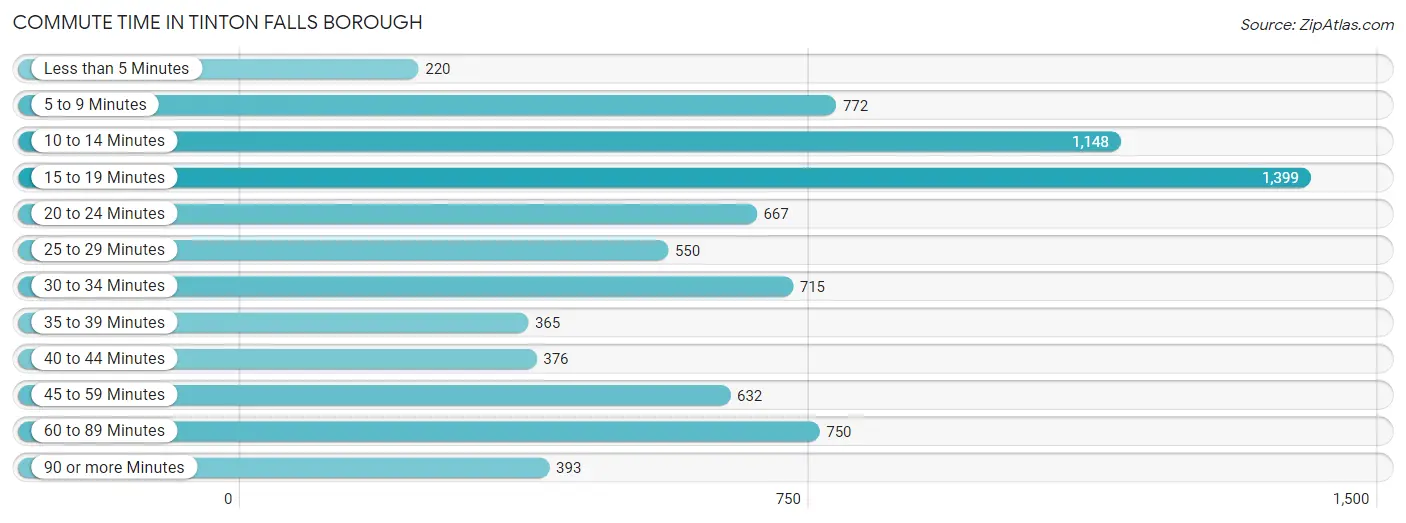
| Commute Time | # Commuters | % Commuters |
| Less than 5 Minutes | 220 | 2.8% |
| 5 to 9 Minutes | 772 | 9.7% |
| 10 to 14 Minutes | 1,148 | 14.4% |
| 15 to 19 Minutes | 1,399 | 17.5% |
| 20 to 24 Minutes | 667 | 8.4% |
| 25 to 29 Minutes | 550 | 6.9% |
| 30 to 34 Minutes | 715 | 8.9% |
| 35 to 39 Minutes | 365 | 4.6% |
| 40 to 44 Minutes | 376 | 4.7% |
| 45 to 59 Minutes | 632 | 7.9% |
| 60 to 89 Minutes | 750 | 9.4% |
| 90 or more Minutes | 393 | 4.9% |
Commute Time by Sex in Tinton Falls borough
The most common commute times in Tinton Falls borough are 15 to 19 minutes (599 commuters, 14.2%) for males and 15 to 19 minutes (800 commuters, 21.1%) for females.
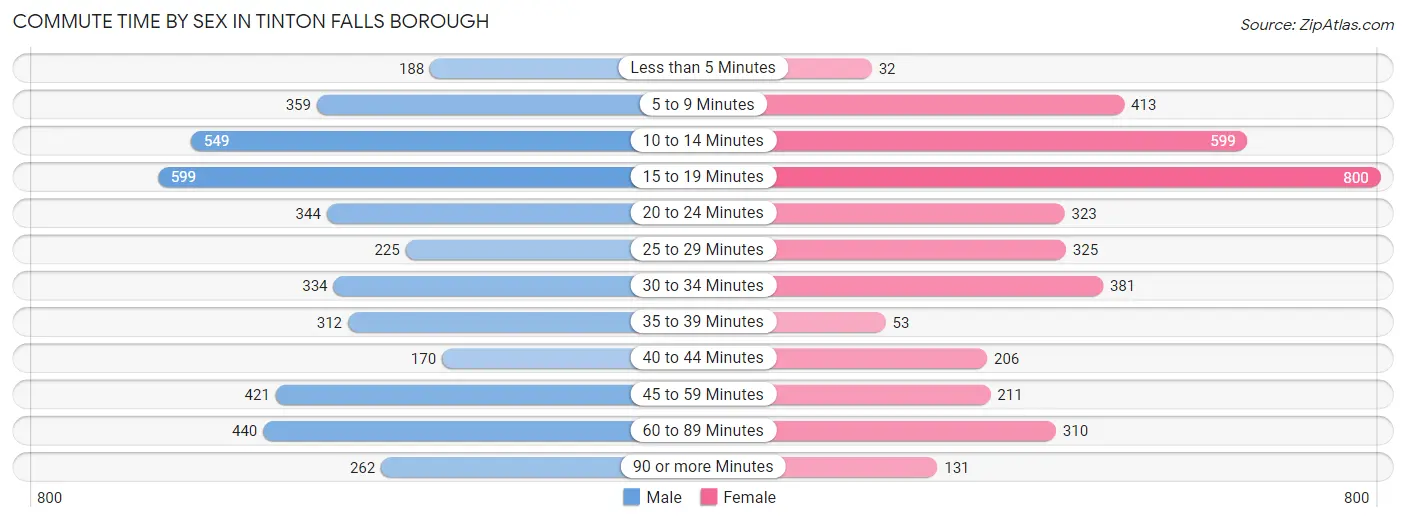
| Commute Time | Male | Female |
| Less than 5 Minutes | 188 (4.5%) | 32 (0.9%) |
| 5 to 9 Minutes | 359 (8.5%) | 413 (10.9%) |
| 10 to 14 Minutes | 549 (13.1%) | 599 (15.8%) |
| 15 to 19 Minutes | 599 (14.2%) | 800 (21.1%) |
| 20 to 24 Minutes | 344 (8.2%) | 323 (8.5%) |
| 25 to 29 Minutes | 225 (5.3%) | 325 (8.6%) |
| 30 to 34 Minutes | 334 (8.0%) | 381 (10.1%) |
| 35 to 39 Minutes | 312 (7.4%) | 53 (1.4%) |
| 40 to 44 Minutes | 170 (4.0%) | 206 (5.4%) |
| 45 to 59 Minutes | 421 (10.0%) | 211 (5.6%) |
| 60 to 89 Minutes | 440 (10.5%) | 310 (8.2%) |
| 90 or more Minutes | 262 (6.2%) | 131 (3.5%) |
Time of Departure to Work by Sex in Tinton Falls borough
The most frequent times of departure to work in Tinton Falls borough are 7:00 AM to 7:29 AM (882, 21.0%) for males and 8:00 AM to 8:29 AM (856, 22.6%) for females.
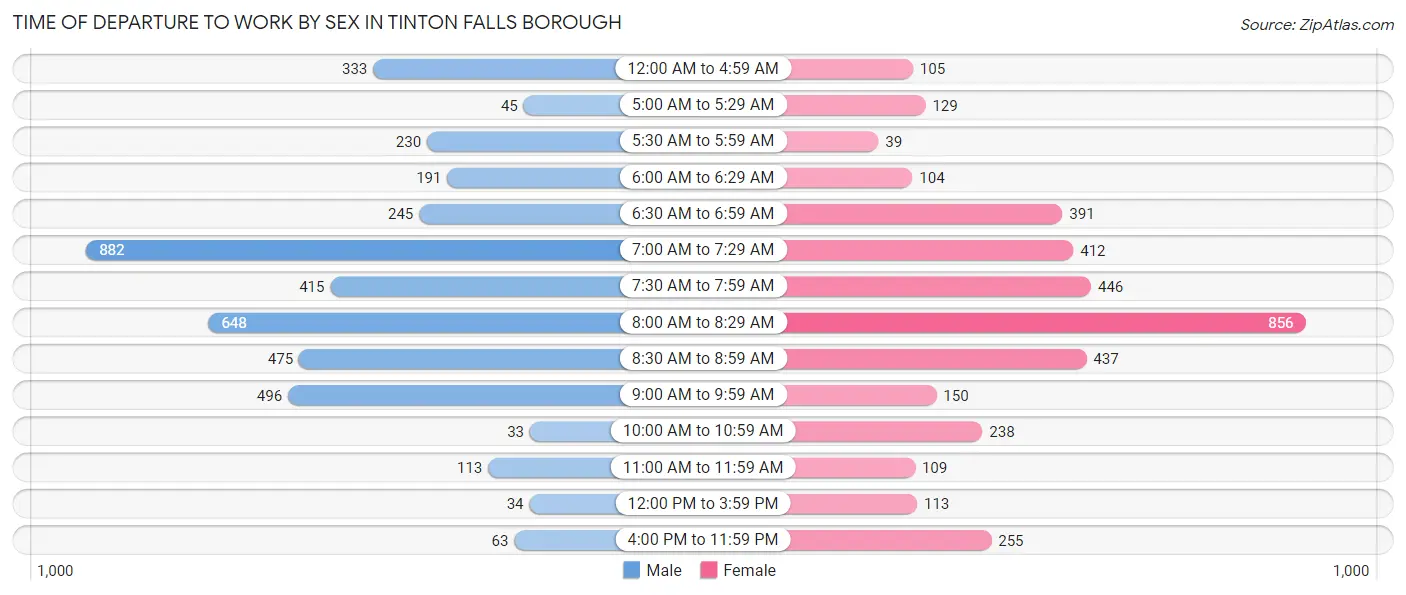
| Time of Departure | Male | Female |
| 12:00 AM to 4:59 AM | 333 (7.9%) | 105 (2.8%) |
| 5:00 AM to 5:29 AM | 45 (1.1%) | 129 (3.4%) |
| 5:30 AM to 5:59 AM | 230 (5.5%) | 39 (1.0%) |
| 6:00 AM to 6:29 AM | 191 (4.5%) | 104 (2.8%) |
| 6:30 AM to 6:59 AM | 245 (5.8%) | 391 (10.3%) |
| 7:00 AM to 7:29 AM | 882 (21.0%) | 412 (10.9%) |
| 7:30 AM to 7:59 AM | 415 (9.9%) | 446 (11.8%) |
| 8:00 AM to 8:29 AM | 648 (15.4%) | 856 (22.6%) |
| 8:30 AM to 8:59 AM | 475 (11.3%) | 437 (11.6%) |
| 9:00 AM to 9:59 AM | 496 (11.8%) | 150 (4.0%) |
| 10:00 AM to 10:59 AM | 33 (0.8%) | 238 (6.3%) |
| 11:00 AM to 11:59 AM | 113 (2.7%) | 109 (2.9%) |
| 12:00 PM to 3:59 PM | 34 (0.8%) | 113 (3.0%) |
| 4:00 PM to 11:59 PM | 63 (1.5%) | 255 (6.7%) |
| Total | 4,203 (100.0%) | 3,784 (100.0%) |
Housing Occupancy in Tinton Falls borough
Occupancy by Ownership in Tinton Falls borough
Of the total 8,795 dwellings in Tinton Falls borough, owner-occupied units account for 6,943 (78.9%), while renter-occupied units make up 1,852 (21.1%).
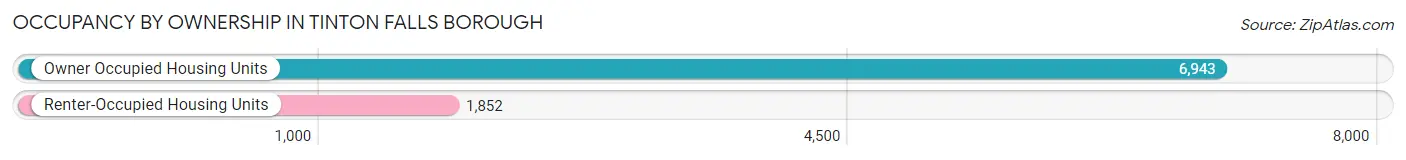
| Occupancy | # Housing Units | % Housing Units |
| Owner Occupied Housing Units | 6,943 | 78.9% |
| Renter-Occupied Housing Units | 1,852 | 21.1% |
| Total Occupied Housing Units | 8,795 | 100.0% |
Occupancy by Household Size in Tinton Falls borough
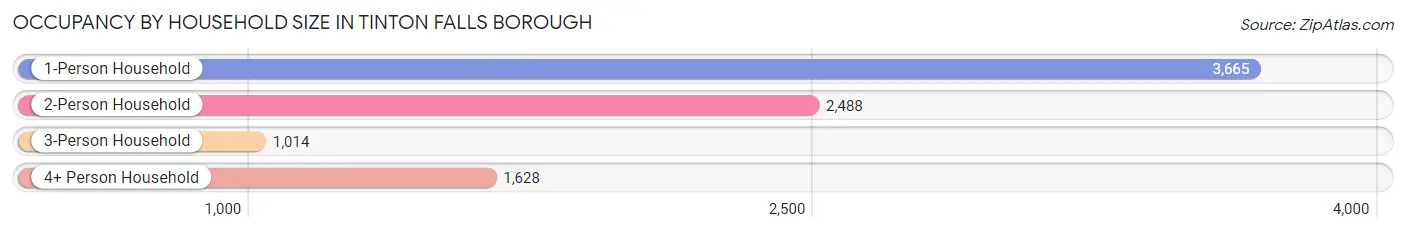
| Household Size | # Housing Units | % Housing Units |
| 1-Person Household | 3,665 | 41.7% |
| 2-Person Household | 2,488 | 28.3% |
| 3-Person Household | 1,014 | 11.5% |
| 4+ Person Household | 1,628 | 18.5% |
| Total Housing Units | 8,795 | 100.0% |
Occupancy by Ownership by Household Size in Tinton Falls borough
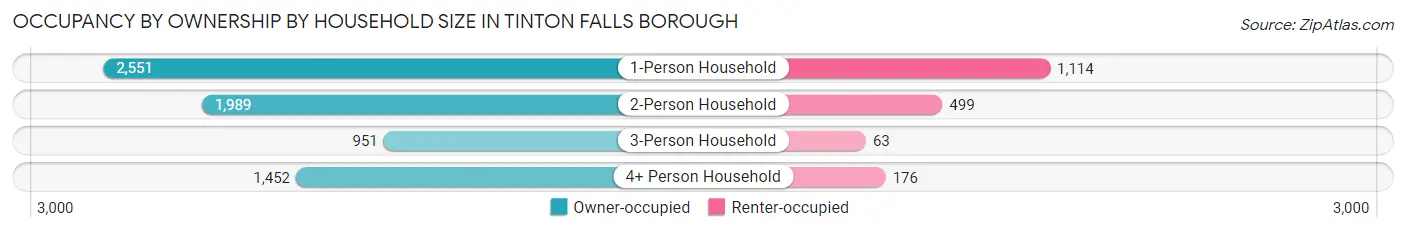
| Household Size | Owner-occupied | Renter-occupied |
| 1-Person Household | 2,551 (69.6%) | 1,114 (30.4%) |
| 2-Person Household | 1,989 (79.9%) | 499 (20.1%) |
| 3-Person Household | 951 (93.8%) | 63 (6.2%) |
| 4+ Person Household | 1,452 (89.2%) | 176 (10.8%) |
| Total Housing Units | 6,943 (78.9%) | 1,852 (21.1%) |
Occupancy by Educational Attainment in Tinton Falls borough
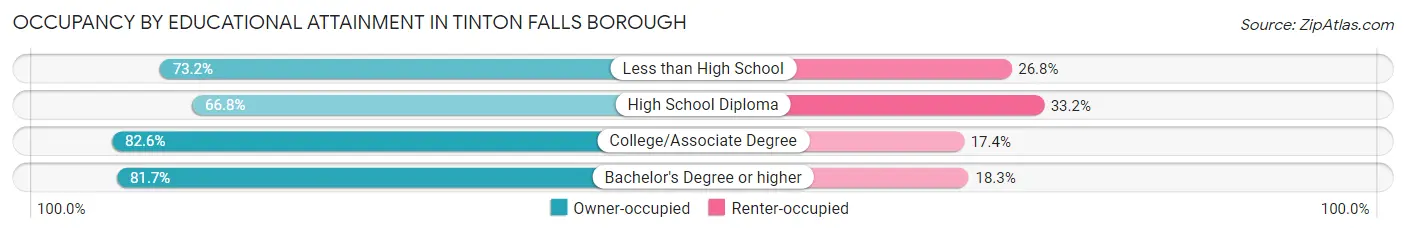
| Household Size | Owner-occupied | Renter-occupied |
| Less than High School | 82 (73.2%) | 30 (26.8%) |
| High School Diploma | 1,130 (66.8%) | 562 (33.2%) |
| College/Associate Degree | 1,780 (82.6%) | 374 (17.4%) |
| Bachelor's Degree or higher | 3,951 (81.7%) | 886 (18.3%) |
Occupancy by Age of Householder in Tinton Falls borough
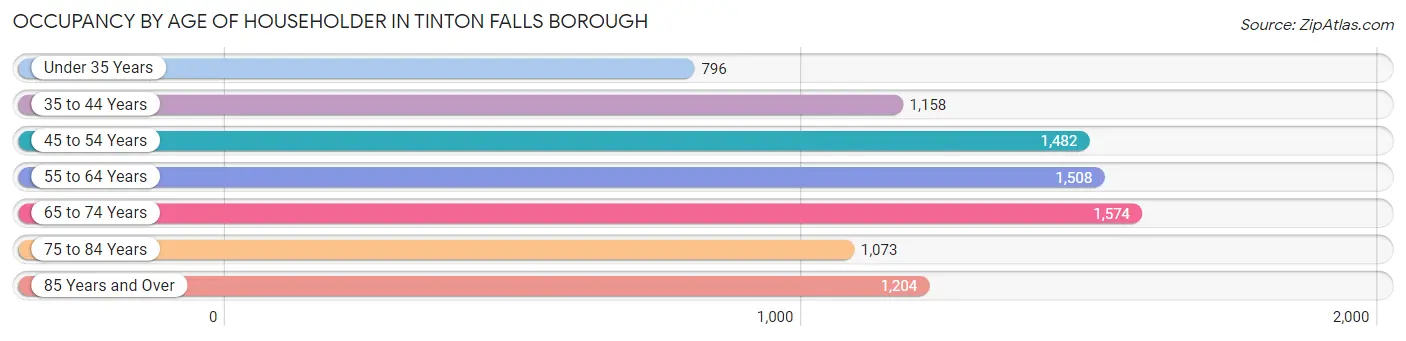
| Age Bracket | # Households | % Households |
| Under 35 Years | 796 | 9.0% |
| 35 to 44 Years | 1,158 | 13.2% |
| 45 to 54 Years | 1,482 | 16.9% |
| 55 to 64 Years | 1,508 | 17.2% |
| 65 to 74 Years | 1,574 | 17.9% |
| 75 to 84 Years | 1,073 | 12.2% |
| 85 Years and Over | 1,204 | 13.7% |
| Total | 8,795 | 100.0% |
Housing Finances in Tinton Falls borough
Median Income by Occupancy in Tinton Falls borough
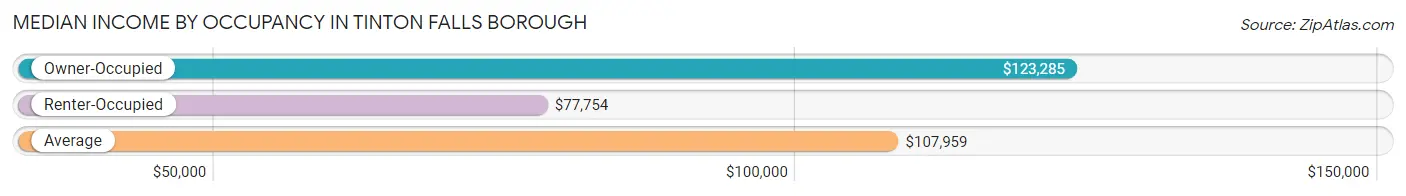
| Occupancy Type | # Households | Median Income |
| Owner-Occupied | 6,943 (78.9%) | $123,285 |
| Renter-Occupied | 1,852 (21.1%) | $77,754 |
| Average | 8,795 (100.0%) | $107,959 |
Occupancy by Householder Income Bracket in Tinton Falls borough
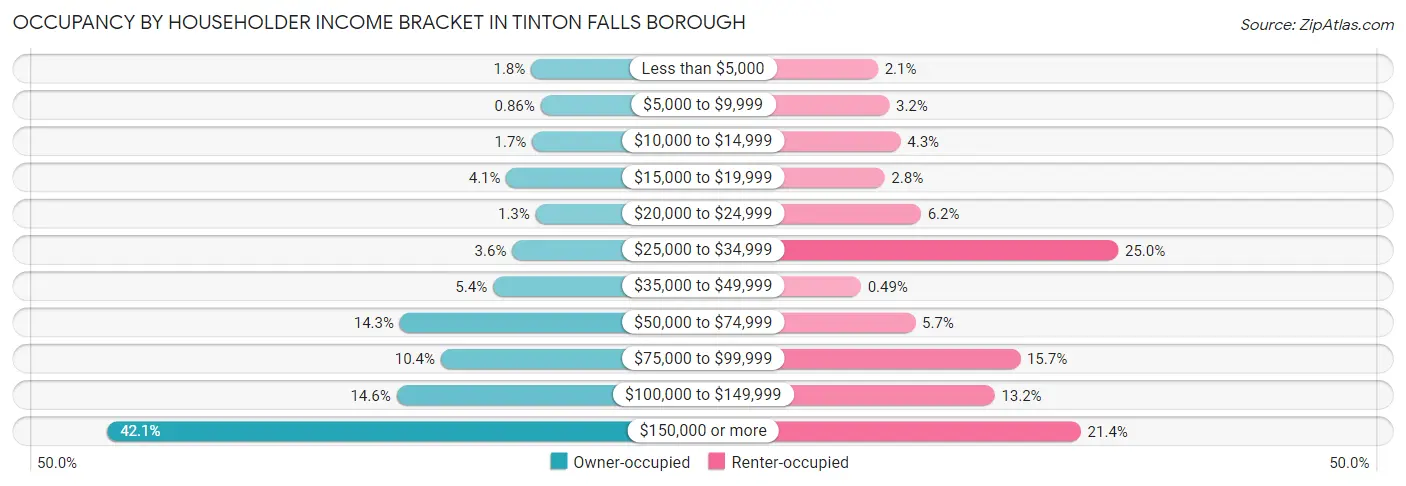
| Income Bracket | Owner-occupied | Renter-occupied |
| Less than $5,000 | 122 (1.8%) | 39 (2.1%) |
| $5,000 to $9,999 | 60 (0.9%) | 59 (3.2%) |
| $10,000 to $14,999 | 115 (1.7%) | 79 (4.3%) |
| $15,000 to $19,999 | 286 (4.1%) | 51 (2.8%) |
| $20,000 to $24,999 | 92 (1.3%) | 115 (6.2%) |
| $25,000 to $34,999 | 247 (3.6%) | 463 (25.0%) |
| $35,000 to $49,999 | 374 (5.4%) | 9 (0.5%) |
| $50,000 to $74,999 | 991 (14.3%) | 105 (5.7%) |
| $75,000 to $99,999 | 719 (10.4%) | 290 (15.7%) |
| $100,000 to $149,999 | 1,012 (14.6%) | 245 (13.2%) |
| $150,000 or more | 2,925 (42.1%) | 397 (21.4%) |
| Total | 6,943 (100.0%) | 1,852 (100.0%) |
Monthly Housing Cost Tiers in Tinton Falls borough
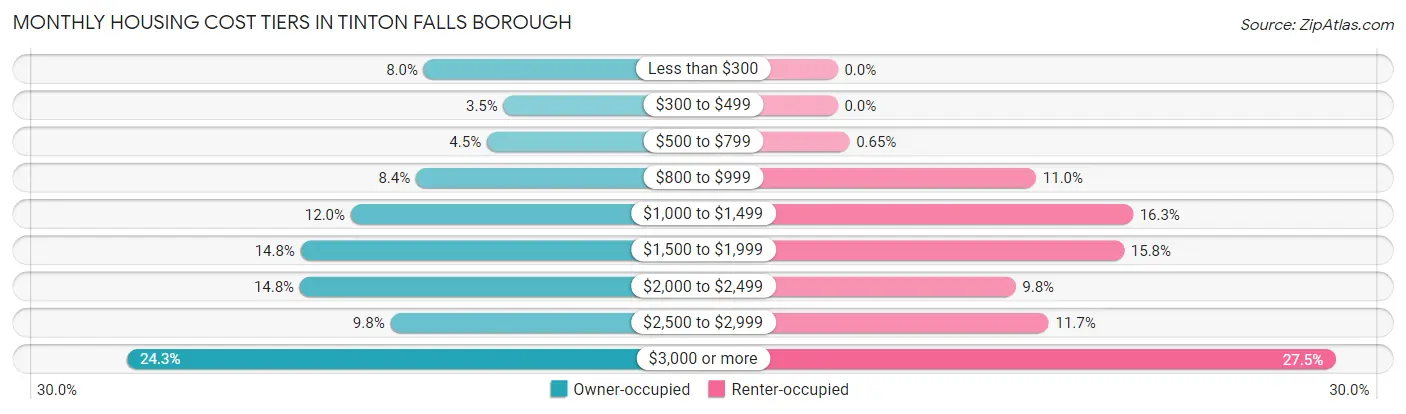
| Monthly Cost | Owner-occupied | Renter-occupied |
| Less than $300 | 552 (8.0%) | 0 (0.0%) |
| $300 to $499 | 246 (3.5%) | 0 (0.0%) |
| $500 to $799 | 310 (4.5%) | 12 (0.6%) |
| $800 to $999 | 582 (8.4%) | 203 (11.0%) |
| $1,000 to $1,499 | 832 (12.0%) | 302 (16.3%) |
| $1,500 to $1,999 | 1,024 (14.7%) | 293 (15.8%) |
| $2,000 to $2,499 | 1,027 (14.8%) | 182 (9.8%) |
| $2,500 to $2,999 | 680 (9.8%) | 216 (11.7%) |
| $3,000 or more | 1,690 (24.3%) | 509 (27.5%) |
| Total | 6,943 (100.0%) | 1,852 (100.0%) |
Physical Housing Characteristics in Tinton Falls borough
Housing Structures in Tinton Falls borough
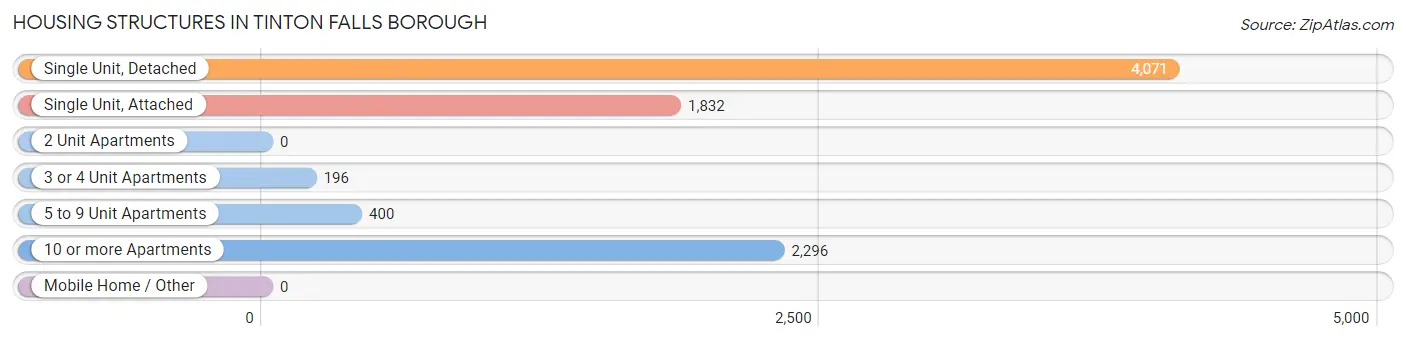
| Structure Type | # Housing Units | % Housing Units |
| Single Unit, Detached | 4,071 | 46.3% |
| Single Unit, Attached | 1,832 | 20.8% |
| 2 Unit Apartments | 0 | 0.0% |
| 3 or 4 Unit Apartments | 196 | 2.2% |
| 5 to 9 Unit Apartments | 400 | 4.5% |
| 10 or more Apartments | 2,296 | 26.1% |
| Mobile Home / Other | 0 | 0.0% |
| Total | 8,795 | 100.0% |
Housing Structures by Occupancy in Tinton Falls borough
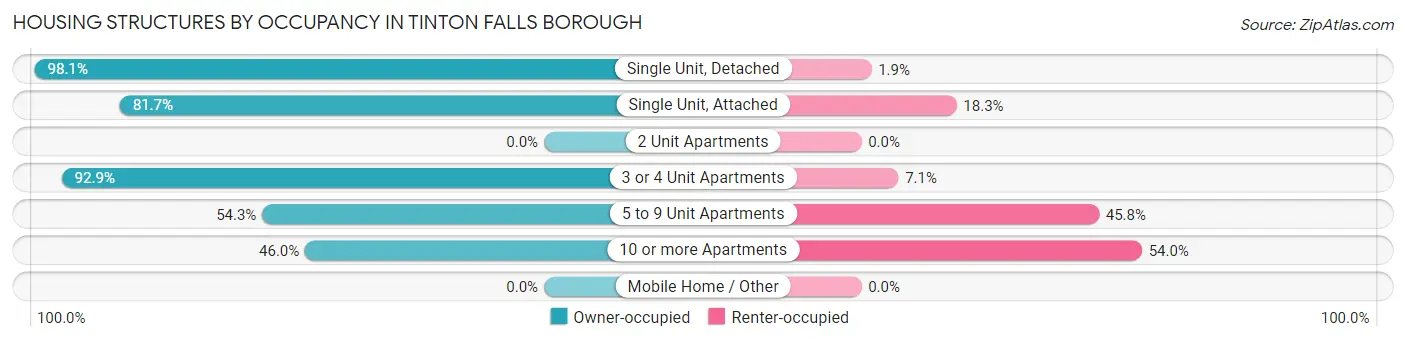
| Structure Type | Owner-occupied | Renter-occupied |
| Single Unit, Detached | 3,992 (98.1%) | 79 (1.9%) |
| Single Unit, Attached | 1,496 (81.7%) | 336 (18.3%) |
| 2 Unit Apartments | 0 (0.0%) | 0 (0.0%) |
| 3 or 4 Unit Apartments | 182 (92.9%) | 14 (7.1%) |
| 5 to 9 Unit Apartments | 217 (54.2%) | 183 (45.8%) |
| 10 or more Apartments | 1,056 (46.0%) | 1,240 (54.0%) |
| Mobile Home / Other | 0 (0.0%) | 0 (0.0%) |
| Total | 6,943 (78.9%) | 1,852 (21.1%) |
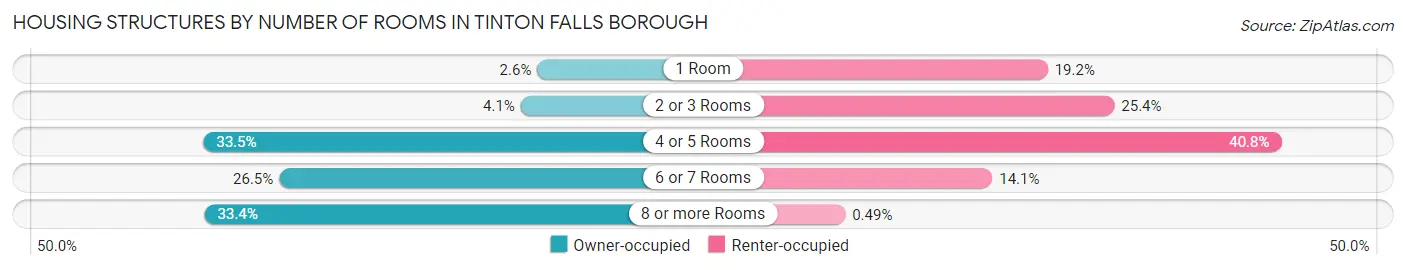
Housing Structures by Number of Rooms in Tinton Falls borough
| Number of Rooms | Owner-occupied | Renter-occupied |
| 1 Room | 180 (2.6%) | 356 (19.2%) |
| 2 or 3 Rooms | 286 (4.1%) | 470 (25.4%) |
| 4 or 5 Rooms | 2,324 (33.5%) | 756 (40.8%) |
| 6 or 7 Rooms | 1,837 (26.5%) | 261 (14.1%) |
| 8 or more Rooms | 2,316 (33.4%) | 9 (0.5%) |
| Total | 6,943 (100.0%) | 1,852 (100.0%) |
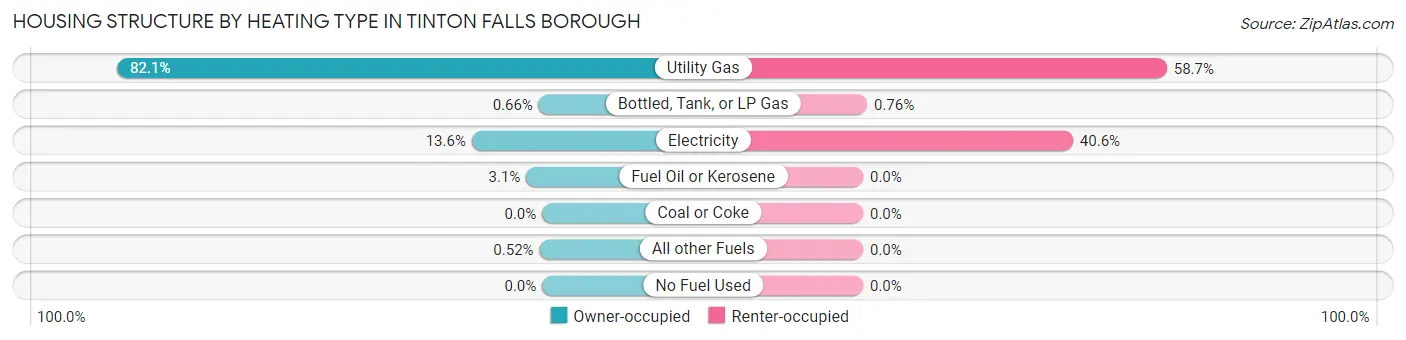
Housing Structure by Heating Type in Tinton Falls borough
| Heating Type | Owner-occupied | Renter-occupied |
| Utility Gas | 5,703 (82.1%) | 1,087 (58.7%) |
| Bottled, Tank, or LP Gas | 46 (0.7%) | 14 (0.8%) |
| Electricity | 944 (13.6%) | 751 (40.6%) |
| Fuel Oil or Kerosene | 214 (3.1%) | 0 (0.0%) |
| Coal or Coke | 0 (0.0%) | 0 (0.0%) |
| All other Fuels | 36 (0.5%) | 0 (0.0%) |
| No Fuel Used | 0 (0.0%) | 0 (0.0%) |
| Total | 6,943 (100.0%) | 1,852 (100.0%) |
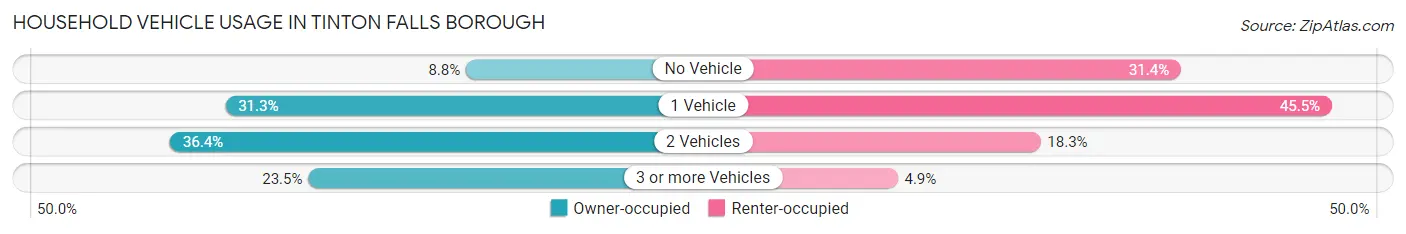
Household Vehicle Usage in Tinton Falls borough
| Vehicles per Household | Owner-occupied | Renter-occupied |
| No Vehicle | 610 (8.8%) | 581 (31.4%) |
| 1 Vehicle | 2,171 (31.3%) | 842 (45.5%) |
| 2 Vehicles | 2,529 (36.4%) | 338 (18.2%) |
| 3 or more Vehicles | 1,633 (23.5%) | 91 (4.9%) |
| Total | 6,943 (100.0%) | 1,852 (100.0%) |
Real Estate & Mortgages in Tinton Falls borough
Real Estate and Mortgage Overview in Tinton Falls borough
| Characteristic | Without Mortgage | With Mortgage |
| Housing Units | 2,492 | 4,451 |
| Median Property Value | $429,800 | $441,300 |
| Median Household Income | $92,230 | $2,079 |
| Monthly Housing Costs | $936 | $1,667 |
| Real Estate Taxes | $6,850 | $43 |
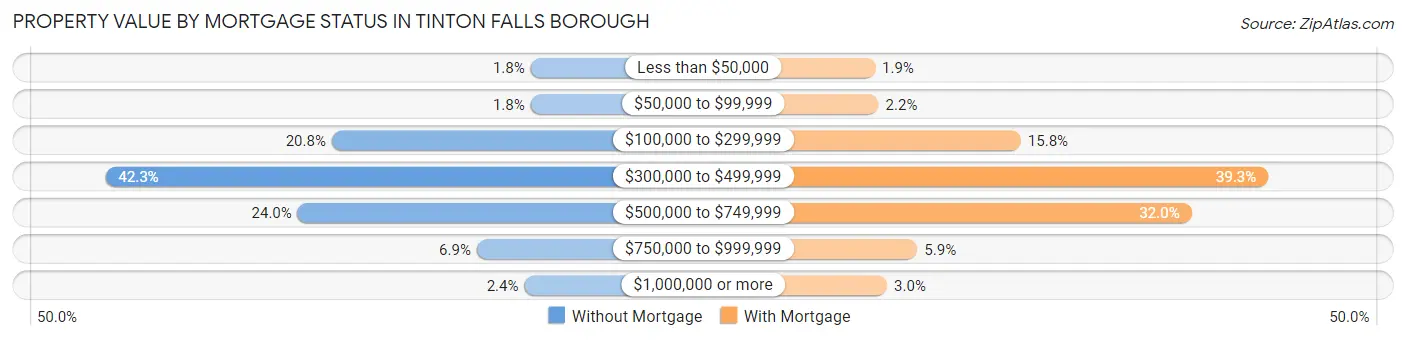
Property Value by Mortgage Status in Tinton Falls borough
| Property Value | Without Mortgage | With Mortgage |
| Less than $50,000 | 45 (1.8%) | 83 (1.9%) |
| $50,000 to $99,999 | 45 (1.8%) | 98 (2.2%) |
| $100,000 to $299,999 | 517 (20.7%) | 701 (15.8%) |
| $300,000 to $499,999 | 1,054 (42.3%) | 1,749 (39.3%) |
| $500,000 to $749,999 | 598 (24.0%) | 1,424 (32.0%) |
| $750,000 to $999,999 | 173 (6.9%) | 262 (5.9%) |
| $1,000,000 or more | 60 (2.4%) | 134 (3.0%) |
| Total | 2,492 (100.0%) | 4,451 (100.0%) |
Household Income by Mortgage Status in Tinton Falls borough
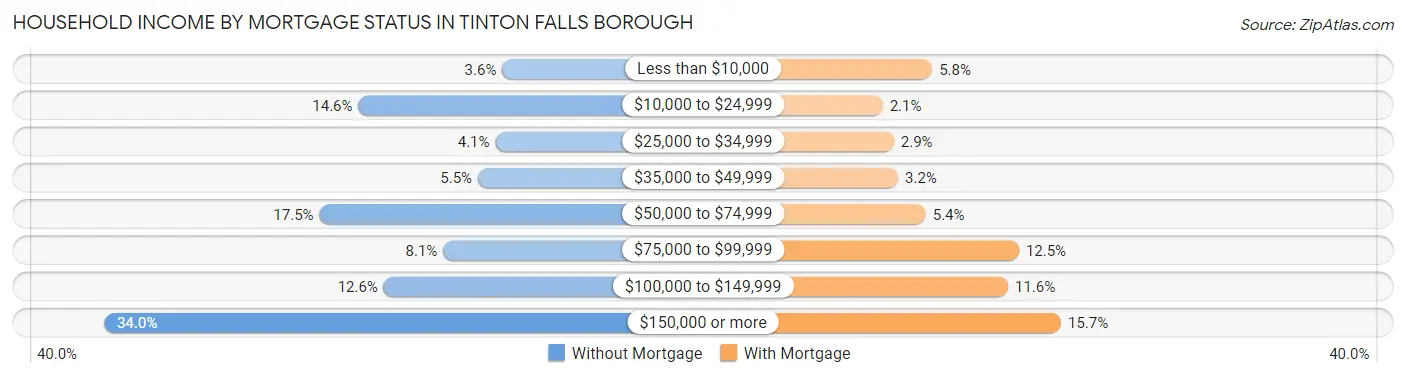
| Household Income | Without Mortgage | With Mortgage |
| Less than $10,000 | 90 (3.6%) | 260 (5.8%) |
| $10,000 to $24,999 | 363 (14.6%) | 92 (2.1%) |
| $25,000 to $34,999 | 103 (4.1%) | 130 (2.9%) |
| $35,000 to $49,999 | 136 (5.5%) | 144 (3.2%) |
| $50,000 to $74,999 | 437 (17.5%) | 238 (5.3%) |
| $75,000 to $99,999 | 202 (8.1%) | 554 (12.4%) |
| $100,000 to $149,999 | 315 (12.6%) | 517 (11.6%) |
| $150,000 or more | 846 (34.0%) | 697 (15.7%) |
| Total | 2,492 (100.0%) | 4,451 (100.0%) |
Property Value to Household Income Ratio in Tinton Falls borough
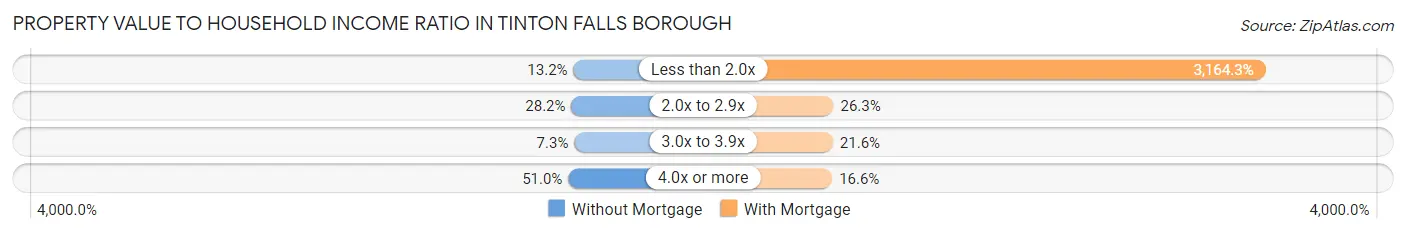
| Value-to-Income Ratio | Without Mortgage | With Mortgage |
| Less than 2.0x | 329 (13.2%) | 140,841 (3,164.3%) |
| 2.0x to 2.9x | 702 (28.2%) | 1,169 (26.3%) |
| 3.0x to 3.9x | 182 (7.3%) | 962 (21.6%) |
| 4.0x or more | 1,270 (51.0%) | 738 (16.6%) |
| Total | 2,492 (100.0%) | 4,451 (100.0%) |
Real Estate Taxes by Mortgage Status in Tinton Falls borough
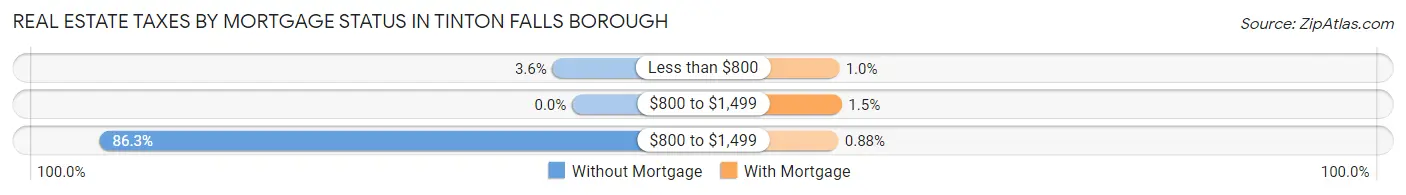
| Property Taxes | Without Mortgage | With Mortgage |
| Less than $800 | 89 (3.6%) | 46 (1.0%) |
| $800 to $1,499 | 0 (0.0%) | 68 (1.5%) |
| $800 to $1,499 | 2,150 (86.3%) | 39 (0.9%) |
| Total | 2,492 (100.0%) | 4,451 (100.0%) |
Health & Disability in Tinton Falls borough
Health Insurance Coverage by Age in Tinton Falls borough
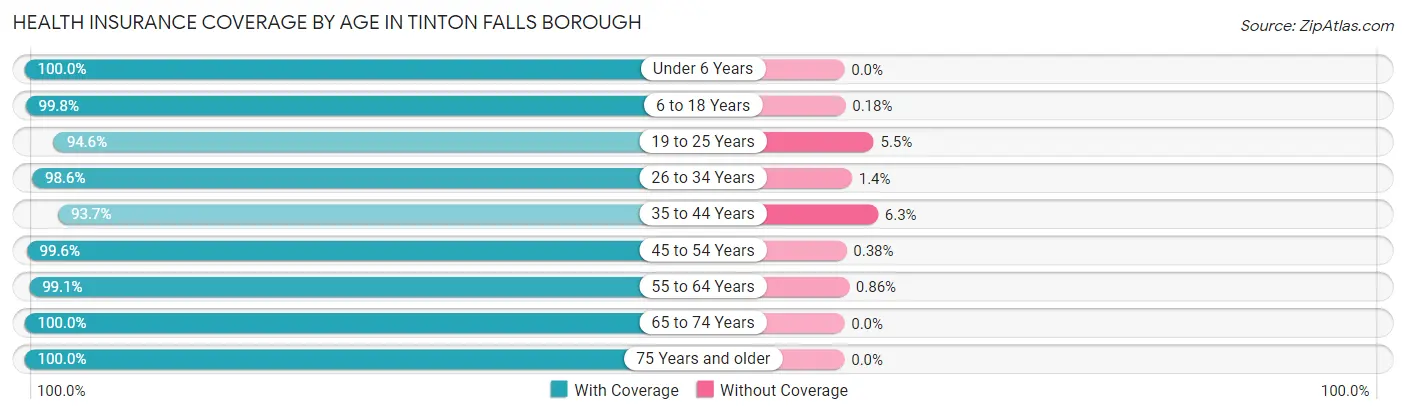
| Age Bracket | With Coverage | Without Coverage |
| Under 6 Years | 921 (100.0%) | 0 (0.0%) |
| 6 to 18 Years | 2,753 (99.8%) | 5 (0.2%) |
| 19 to 25 Years | 1,267 (94.6%) | 73 (5.4%) |
| 26 to 34 Years | 1,476 (98.6%) | 21 (1.4%) |
| 35 to 44 Years | 2,260 (93.7%) | 151 (6.3%) |
| 45 to 54 Years | 2,373 (99.6%) | 9 (0.4%) |
| 55 to 64 Years | 2,551 (99.1%) | 22 (0.9%) |
| 65 to 74 Years | 2,263 (100.0%) | 0 (0.0%) |
| 75 Years and older | 2,816 (100.0%) | 0 (0.0%) |
| Total | 18,680 (98.5%) | 281 (1.5%) |
Health Insurance Coverage by Citizenship Status in Tinton Falls borough
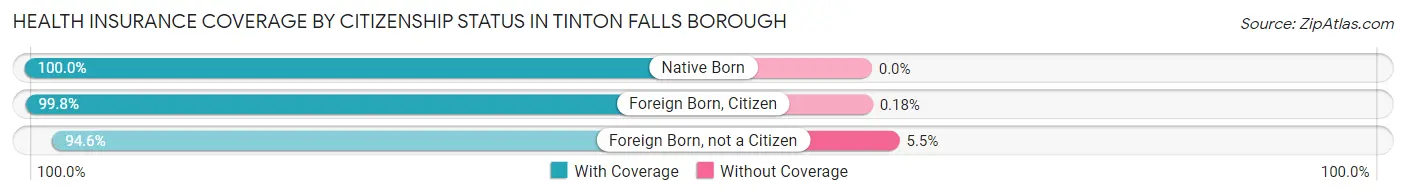
| Citizenship Status | With Coverage | Without Coverage |
| Native Born | 921 (100.0%) | 0 (0.0%) |
| Foreign Born, Citizen | 2,753 (99.8%) | 5 (0.2%) |
| Foreign Born, not a Citizen | 1,267 (94.6%) | 73 (5.4%) |
Health Insurance Coverage by Household Income in Tinton Falls borough
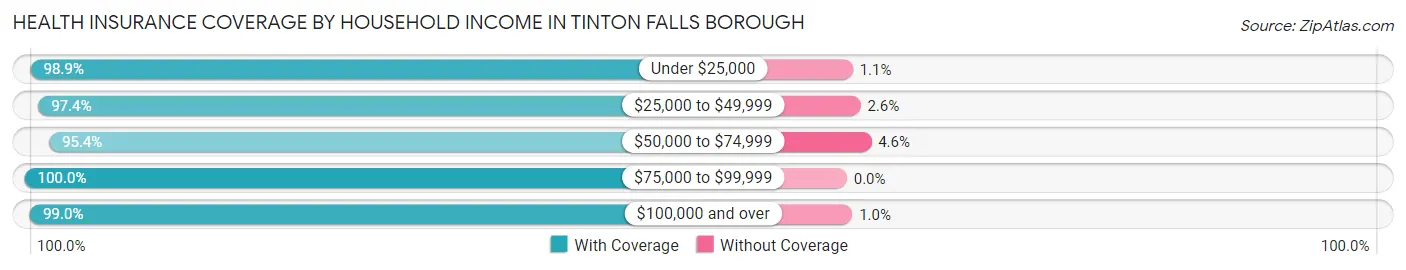
| Household Income | With Coverage | Without Coverage |
| Under $25,000 | 1,243 (98.9%) | 14 (1.1%) |
| $25,000 to $49,999 | 2,093 (97.4%) | 55 (2.6%) |
| $50,000 to $74,999 | 1,481 (95.4%) | 71 (4.6%) |
| $75,000 to $99,999 | 1,696 (100.0%) | 0 (0.0%) |
| $100,000 and over | 12,065 (99.0%) | 123 (1.0%) |
Public vs Private Health Insurance Coverage by Age in Tinton Falls borough
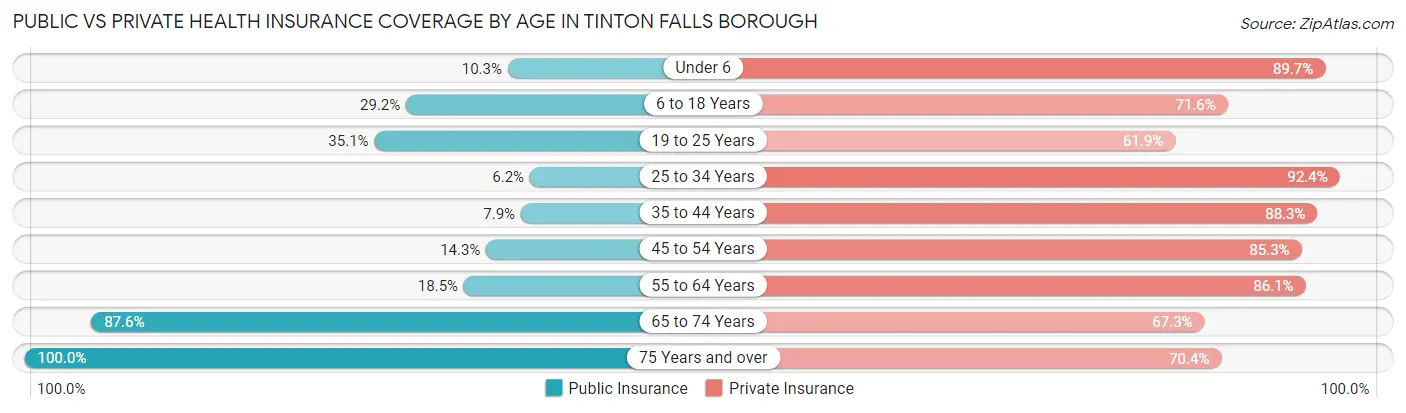
| Age Bracket | Public Insurance | Private Insurance |
| Under 6 | 95 (10.3%) | 826 (89.7%) |
| 6 to 18 Years | 805 (29.2%) | 1,975 (71.6%) |
| 19 to 25 Years | 470 (35.1%) | 829 (61.9%) |
| 25 to 34 Years | 93 (6.2%) | 1,383 (92.4%) |
| 35 to 44 Years | 190 (7.9%) | 2,128 (88.3%) |
| 45 to 54 Years | 341 (14.3%) | 2,032 (85.3%) |
| 55 to 64 Years | 475 (18.5%) | 2,214 (86.1%) |
| 65 to 74 Years | 1,983 (87.6%) | 1,523 (67.3%) |
| 75 Years and over | 2,816 (100.0%) | 1,983 (70.4%) |
| Total | 7,268 (38.3%) | 14,893 (78.5%) |
Disability Status by Sex by Age in Tinton Falls borough
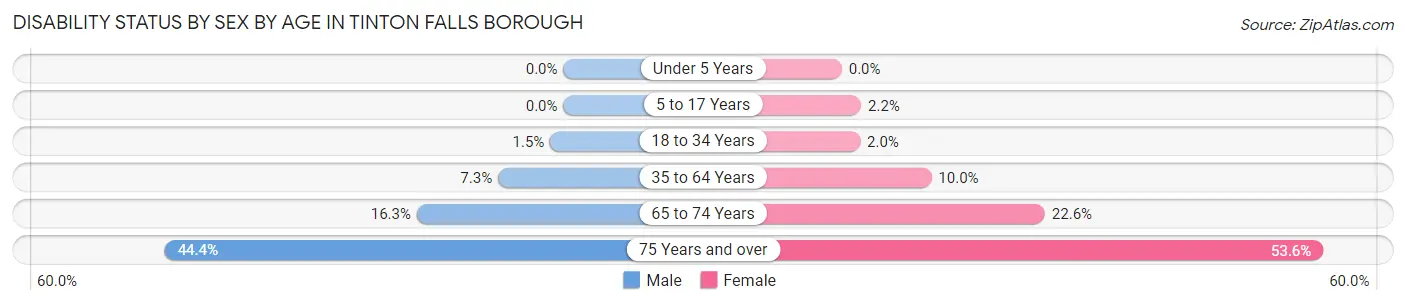
| Age Bracket | Male | Female |
| Under 5 Years | 0 (0.0%) | 0 (0.0%) |
| 5 to 17 Years | 0 (0.0%) | 27 (2.1%) |
| 18 to 34 Years | 25 (1.5%) | 28 (2.0%) |
| 35 to 64 Years | 273 (7.3%) | 361 (10.0%) |
| 65 to 74 Years | 181 (16.3%) | 261 (22.6%) |
| 75 Years and over | 368 (44.4%) | 1,065 (53.6%) |
Disability Class by Sex by Age in Tinton Falls borough
Disability Class: Hearing Difficulty
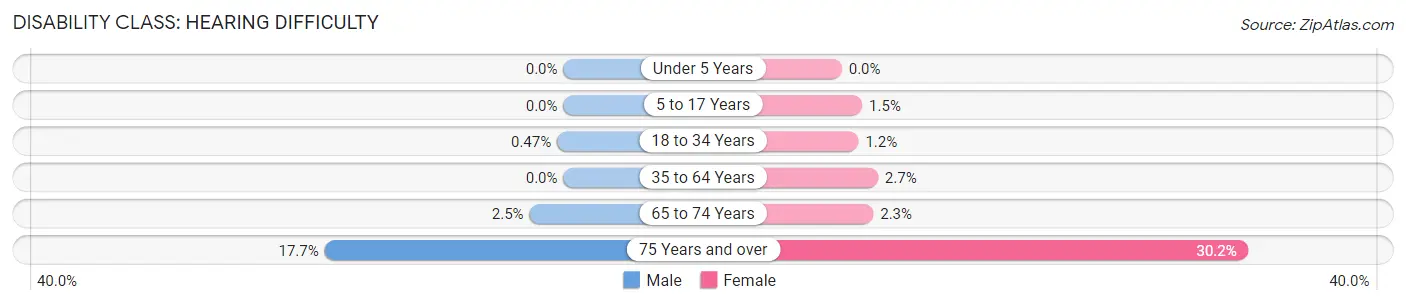
| Age Bracket | Male | Female |
| Under 5 Years | 0 (0.0%) | 0 (0.0%) |
| 5 to 17 Years | 0 (0.0%) | 19 (1.5%) |
| 18 to 34 Years | 8 (0.5%) | 17 (1.2%) |
| 35 to 64 Years | 0 (0.0%) | 97 (2.7%) |
| 65 to 74 Years | 28 (2.5%) | 27 (2.3%) |
| 75 Years and over | 147 (17.7%) | 600 (30.2%) |
Disability Class: Vision Difficulty
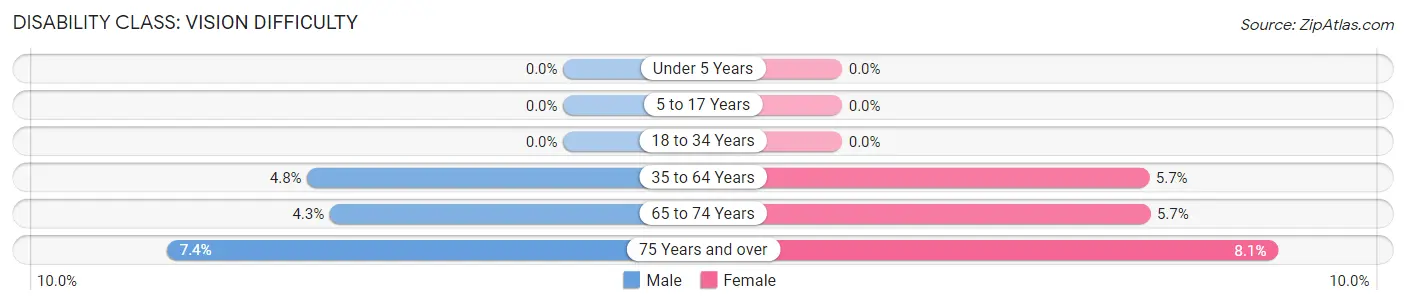
| Age Bracket | Male | Female |
| Under 5 Years | 0 (0.0%) | 0 (0.0%) |
| 5 to 17 Years | 0 (0.0%) | 0 (0.0%) |
| 18 to 34 Years | 0 (0.0%) | 0 (0.0%) |
| 35 to 64 Years | 178 (4.8%) | 206 (5.7%) |
| 65 to 74 Years | 48 (4.3%) | 66 (5.7%) |
| 75 Years and over | 61 (7.4%) | 161 (8.1%) |
Disability Class: Cognitive Difficulty
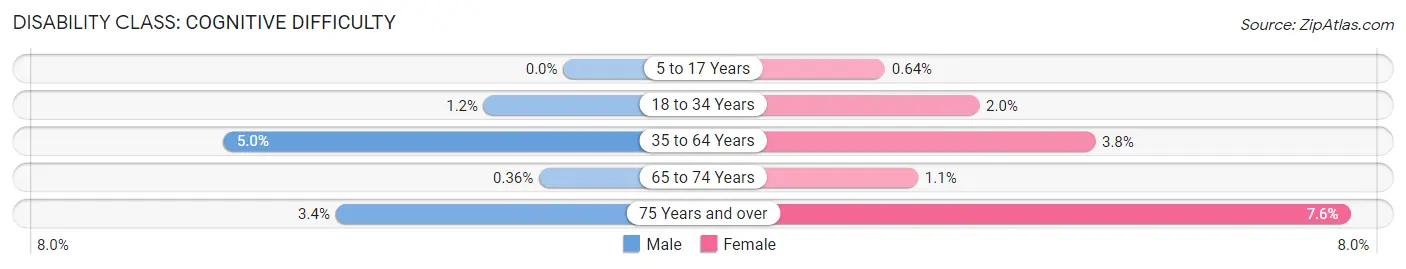
| Age Bracket | Male | Female |
| 5 to 17 Years | 0 (0.0%) | 8 (0.6%) |
| 18 to 34 Years | 20 (1.2%) | 28 (2.0%) |
| 35 to 64 Years | 189 (5.0%) | 136 (3.8%) |
| 65 to 74 Years | 4 (0.4%) | 13 (1.1%) |
| 75 Years and over | 28 (3.4%) | 150 (7.5%) |
Disability Class: Ambulatory Difficulty
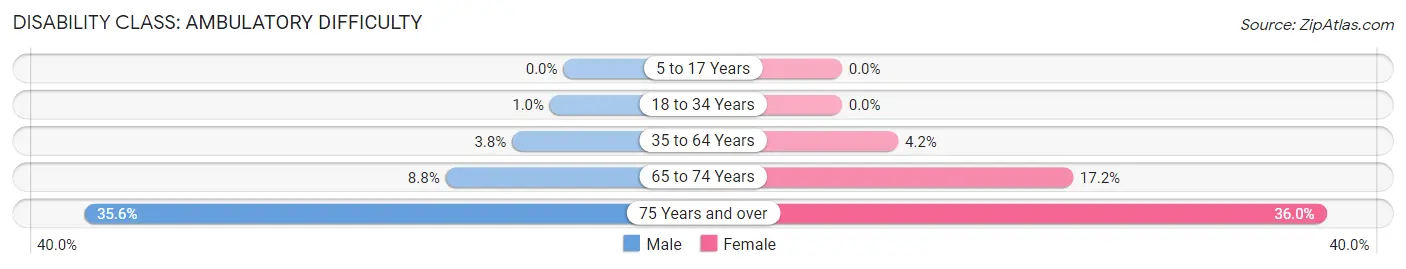
| Age Bracket | Male | Female |
| 5 to 17 Years | 0 (0.0%) | 0 (0.0%) |
| 18 to 34 Years | 17 (1.0%) | 0 (0.0%) |
| 35 to 64 Years | 143 (3.8%) | 151 (4.2%) |
| 65 to 74 Years | 97 (8.7%) | 198 (17.2%) |
| 75 Years and over | 295 (35.6%) | 715 (36.0%) |
Disability Class: Self-Care Difficulty
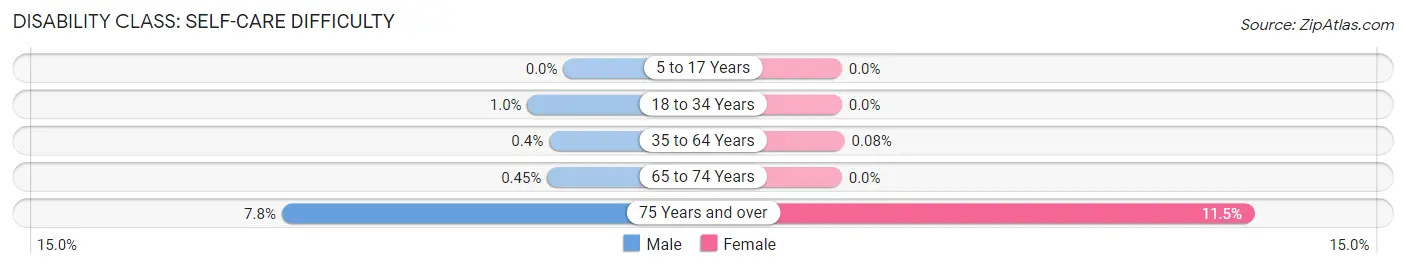
| Age Bracket | Male | Female |
| 5 to 17 Years | 0 (0.0%) | 0 (0.0%) |
| 18 to 34 Years | 17 (1.0%) | 0 (0.0%) |
| 35 to 64 Years | 15 (0.4%) | 3 (0.1%) |
| 65 to 74 Years | 5 (0.4%) | 0 (0.0%) |
| 75 Years and over | 65 (7.8%) | 228 (11.5%) |
Technology Access in Tinton Falls borough
Computing Device Access in Tinton Falls borough
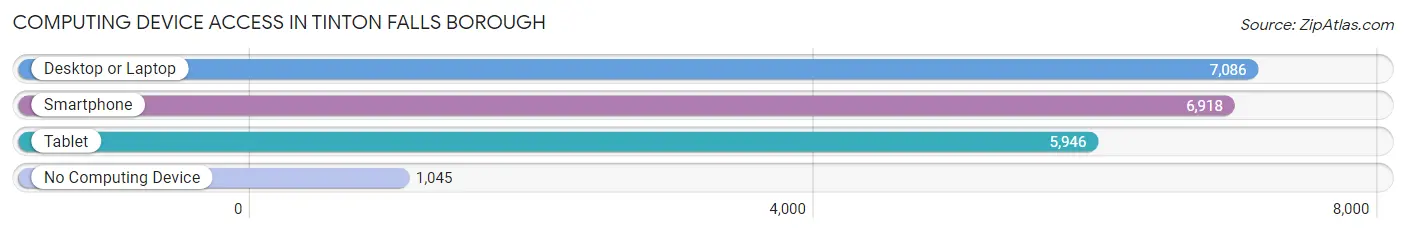
| Device Type | # Households | % Households |
| Desktop or Laptop | 7,086 | 80.6% |
| Smartphone | 6,918 | 78.7% |
| Tablet | 5,946 | 67.6% |
| No Computing Device | 1,045 | 11.9% |
| Total | 8,795 | 100.0% |
Internet Access in Tinton Falls borough
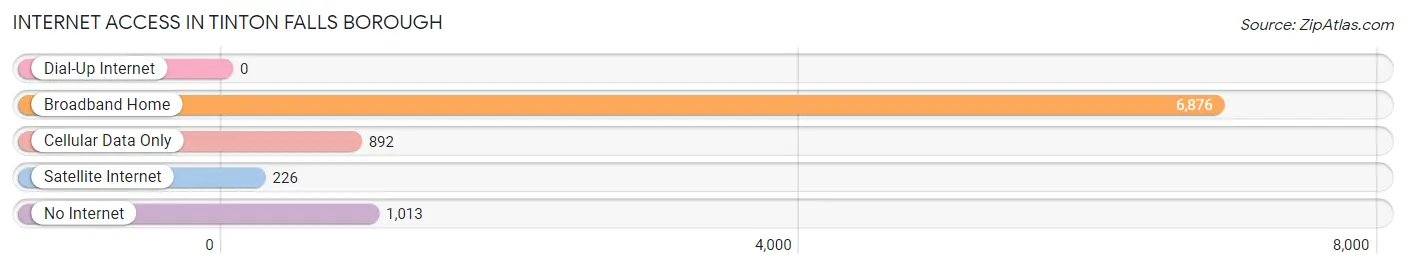
| Internet Type | # Households | % Households |
| Dial-Up Internet | 0 | 0.0% |
| Broadband Home | 6,876 | 78.2% |
| Cellular Data Only | 892 | 10.1% |
| Satellite Internet | 226 | 2.6% |
| No Internet | 1,013 | 11.5% |
| Total | 8,795 | 100.0% |
Tinton Falls borough Summary
Tinton Falls Borough is a small borough located in Monmouth County, New Jersey. It is situated on the banks of the Shrewsbury River and is part of the larger Jersey Shore region. The borough is home to a population of approximately 17,000 people and is a popular destination for tourists and locals alike.
Geography
Tinton Falls Borough is located in the northern part of Monmouth County, New Jersey. It is situated on the banks of the Shrewsbury River and is bordered by the towns of Eatontown, Oceanport, and Shrewsbury. The borough is approximately 5.5 square miles in size and is home to a variety of natural features, including the Shark River, the Navesink River, and the Shrewsbury River. The borough is also home to several parks, including the Tinton Falls Park, the Shark River Park, and the Navesink River Park.
History
Tinton Falls Borough was originally inhabited by the Lenape Native Americans. The area was first settled by Europeans in the late 17th century and was known as New Shrewsbury. The area was incorporated as a borough in 1950 and was named after the nearby Tinton Falls. The borough has a long history of industry, with the first paper mill being established in the area in 1790. The borough was also home to a variety of other industries, including a brickyard, a sawmill, and a gristmill.
Economy
Tinton Falls Borough is home to a variety of businesses and industries. The borough is home to several large corporations, including the Monmouth Mall, the Monmouth Medical Center, and the Monmouth County Park System. The borough is also home to a variety of small businesses, including restaurants, retail stores, and professional services. The borough is also home to a variety of manufacturing and industrial businesses, including the Tinton Falls Industrial Park.
Demographics
As of the 2010 census, Tinton Falls Borough had a population of 17,892 people. The racial makeup of the borough was 87.3% White, 5.2% African American, 0.3% Native American, 3.2% Asian, and 3.9% from other races. The median household income in the borough was $76,945, and the median family income was $90,945. The per capita income in the borough was $35,945.
Conclusion
Tinton Falls Borough is a small borough located in Monmouth County, New Jersey. It is situated on the banks of the Shrewsbury River and is part of the larger Jersey Shore region. The borough is home to a population of approximately 17,000 people and is a popular destination for tourists and locals alike. The borough has a long history of industry and is home to a variety of businesses and industries. The borough is also home to a diverse population, with a median household income of $76,945 and a median family income of $90,945. Tinton Falls Borough is a great place to live, work, and visit.
Common Questions
What is Per Capita Income in Tinton Falls borough?
Per Capita income in Tinton Falls borough is $67,122.
What is the Median Family Income in Tinton Falls borough?
Median Family Income in Tinton Falls borough is $168,047.
What is the Median Household income in Tinton Falls borough?
Median Household Income in Tinton Falls borough is $107,959.
What is Income or Wage Gap in Tinton Falls borough?
Income or Wage Gap in Tinton Falls borough is 23.3%.
Women in Tinton Falls borough earn 76.7 cents for every dollar earned by a man.
What is Inequality or Gini Index in Tinton Falls borough?
Inequality or Gini Index in Tinton Falls borough is 0.47.
What is the Total Population of Tinton Falls borough?
Total Population of Tinton Falls borough is 19,180.
What is the Total Male Population of Tinton Falls borough?
Total Male Population of Tinton Falls borough is 9,265.
What is the Total Female Population of Tinton Falls borough?
Total Female Population of Tinton Falls borough is 9,915.
What is the Ratio of Males per 100 Females in Tinton Falls borough?
There are 93.44 Males per 100 Females in Tinton Falls borough.
What is the Ratio of Females per 100 Males in Tinton Falls borough?
There are 107.02 Females per 100 Males in Tinton Falls borough.
What is the Median Population Age in Tinton Falls borough?
Median Population Age in Tinton Falls borough is 47.4 Years.
What is the Average Family Size in Tinton Falls borough
Average Family Size in Tinton Falls borough is 3.0 People.
What is the Average Household Size in Tinton Falls borough
Average Household Size in Tinton Falls borough is 2.1 People.
How Large is the Labor Force in Tinton Falls borough?
There are 10,200 People in the Labor Forcein in Tinton Falls borough.
What is the Percentage of People in the Labor Force in Tinton Falls borough?
62.2% of People are in the Labor Force in Tinton Falls borough.
What is the Unemployment Rate in Tinton Falls borough?
Unemployment Rate in Tinton Falls borough is 6.2%.