Middlesex borough, NJ Map & Demographics
Middlesex borough Overview
$48,793
PER CAPITA INCOME
$110,365
AVG FAMILY INCOME
$101,868
AVG HOUSEHOLD INCOME
35.6%
WAGE / INCOME GAP [ % ]
64.4¢/ $1
WAGE / INCOME GAP [ $ ]
$7,304
FAMILY INCOME DEFICIT
0.41
INEQUALITY / GINI INDEX
14,525
TOTAL POPULATION
6,881
MALE POPULATION
7,644
FEMALE POPULATION
90.02
MALES / 100 FEMALES
111.09
FEMALES / 100 MALES
44.7
MEDIAN AGE
3.0
AVG FAMILY SIZE
2.6
AVG HOUSEHOLD SIZE
8,223
LABOR FORCE [ PEOPLE ]
69.1%
PERCENT IN LABOR FORCE
5.6%
UNEMPLOYMENT RATE
Income in Middlesex borough
Income Overview in Middlesex borough
Per Capita Income in Middlesex borough is $48,793, while median incomes of families and households are $110,365 and $101,868 respectively.
| Characteristic | Number | Measure |
| Per Capita Income | 14,525 | $48,793 |
| Median Family Income | 4,284 | $110,365 |
| Mean Family Income | 4,284 | $136,267 |
| Median Household Income | 5,580 | $101,868 |
| Mean Household Income | 5,580 | $125,170 |
| Income Deficit | 4,284 | $7,304 |
| Wage / Income Gap (%) | 14,525 | 35.59% |
| Wage / Income Gap ($) | 14,525 | 64.41¢ per $1 |
| Gini / Inequality Index | 14,525 | 0.41 |
Earnings by Sex in Middlesex borough
Average Earnings in Middlesex borough are $55,512, $71,250 for men and $45,889 for women, a difference of 35.6%.
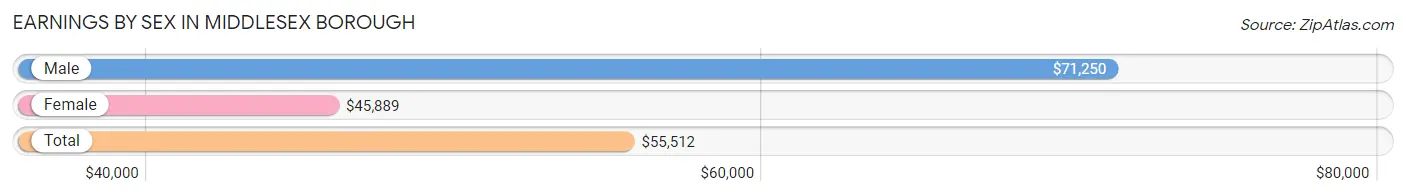
| Sex | Number | Average Earnings |
| Male | 4,018 (47.9%) | $71,250 |
| Female | 4,375 (52.1%) | $45,889 |
| Total | 8,393 (100.0%) | $55,512 |
Earnings by Sex by Income Bracket in Middlesex borough
The most common earnings brackets in Middlesex borough are $100,000+ for men (1,220 | 30.4%) and $75,000 to $99,999 for women (764 | 17.5%).
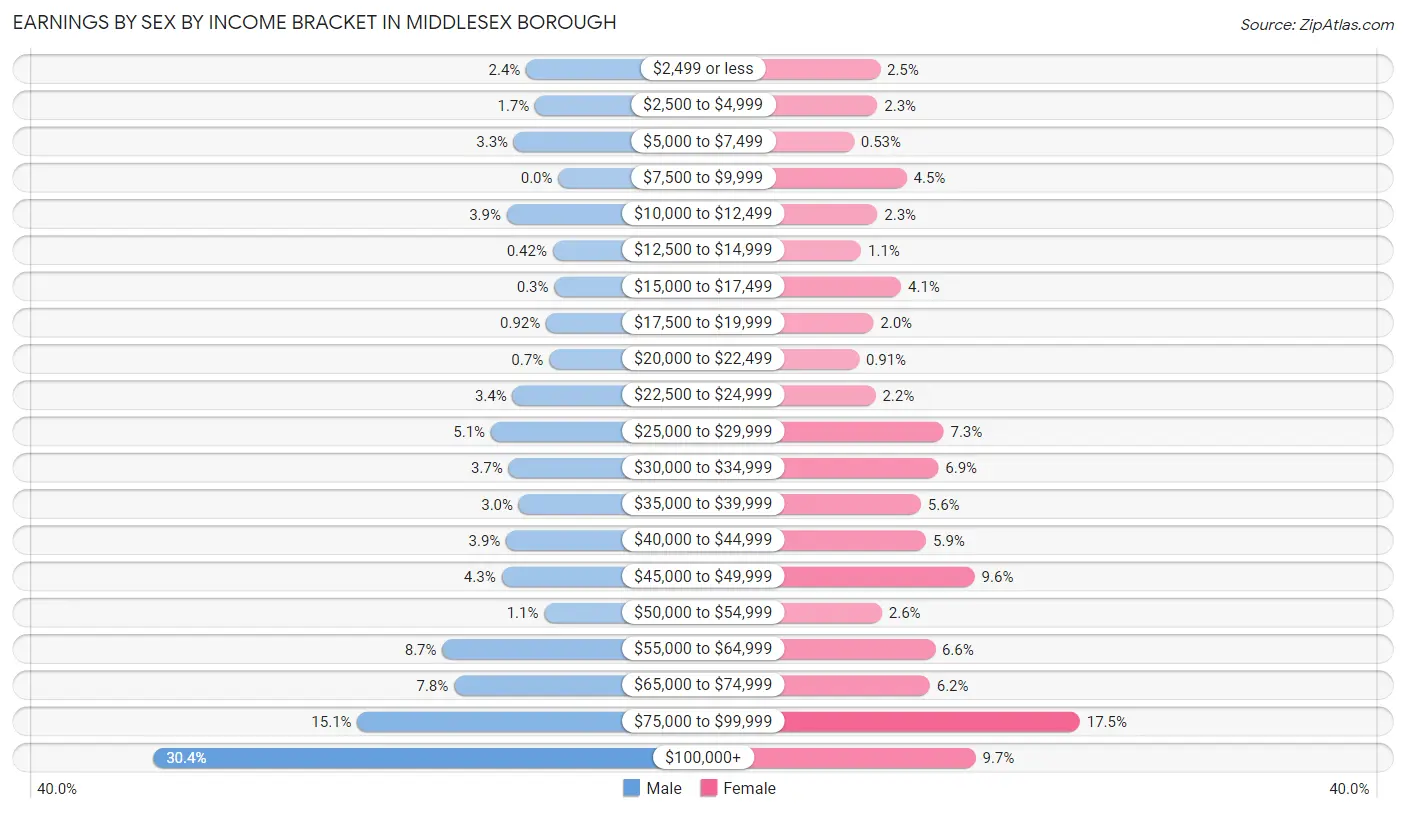
| Income | Male | Female |
| $2,499 or less | 97 (2.4%) | 109 (2.5%) |
| $2,500 to $4,999 | 70 (1.7%) | 100 (2.3%) |
| $5,000 to $7,499 | 134 (3.3%) | 23 (0.5%) |
| $7,500 to $9,999 | 0 (0.0%) | 196 (4.5%) |
| $10,000 to $12,499 | 155 (3.9%) | 100 (2.3%) |
| $12,500 to $14,999 | 17 (0.4%) | 47 (1.1%) |
| $15,000 to $17,499 | 12 (0.3%) | 178 (4.1%) |
| $17,500 to $19,999 | 37 (0.9%) | 87 (2.0%) |
| $20,000 to $22,499 | 28 (0.7%) | 40 (0.9%) |
| $22,500 to $24,999 | 138 (3.4%) | 94 (2.1%) |
| $25,000 to $29,999 | 203 (5.1%) | 317 (7.2%) |
| $30,000 to $34,999 | 150 (3.7%) | 300 (6.9%) |
| $35,000 to $39,999 | 119 (3.0%) | 243 (5.6%) |
| $40,000 to $44,999 | 157 (3.9%) | 260 (5.9%) |
| $45,000 to $49,999 | 171 (4.3%) | 419 (9.6%) |
| $50,000 to $54,999 | 42 (1.1%) | 115 (2.6%) |
| $55,000 to $64,999 | 349 (8.7%) | 289 (6.6%) |
| $65,000 to $74,999 | 314 (7.8%) | 272 (6.2%) |
| $75,000 to $99,999 | 605 (15.1%) | 764 (17.5%) |
| $100,000+ | 1,220 (30.4%) | 422 (9.7%) |
| Total | 4,018 (100.0%) | 4,375 (100.0%) |
Earnings by Sex by Educational Attainment in Middlesex borough
Average earnings in Middlesex borough are $75,525 for men and $47,732 for women, a difference of 36.8%. Men with an educational attainment of graduate degree enjoy the highest average annual earnings of $103,944, while those with college or associate's degree education earn the least with $59,513. Women with an educational attainment of graduate degree earn the most with the average annual earnings of $82,847, while those with less than high school education have the smallest earnings of $34,075.
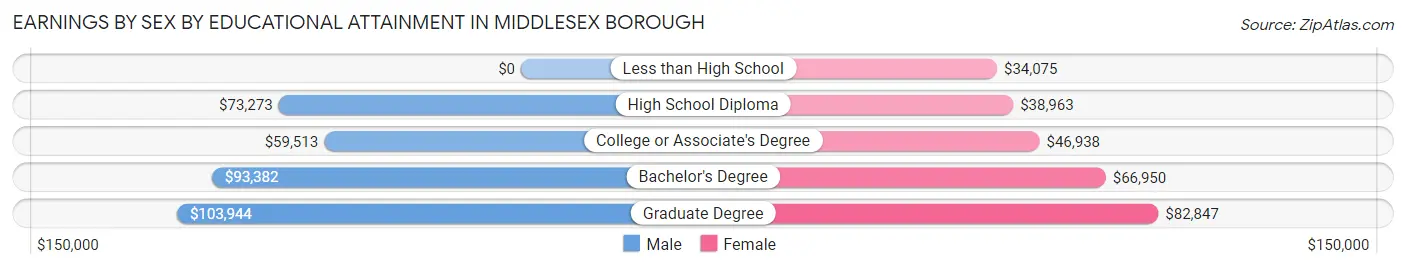
| Educational Attainment | Male Income | Female Income |
| Less than High School | - | - |
| High School Diploma | $73,273 | $38,963 |
| College or Associate's Degree | $59,513 | $46,938 |
| Bachelor's Degree | $93,382 | $66,950 |
| Graduate Degree | $103,944 | $82,847 |
| Total | $75,525 | $47,732 |
Family Income in Middlesex borough
Family Income Brackets in Middlesex borough
According to the Middlesex borough family income data, there are 1,067 families falling into the $100,000 to $149,999 income range, which is the most common income bracket and makes up 24.9% of all families. Conversely, the $25,000 to $34,999 income bracket is the least frequent group with only 17 families (0.4%) belonging to this category.
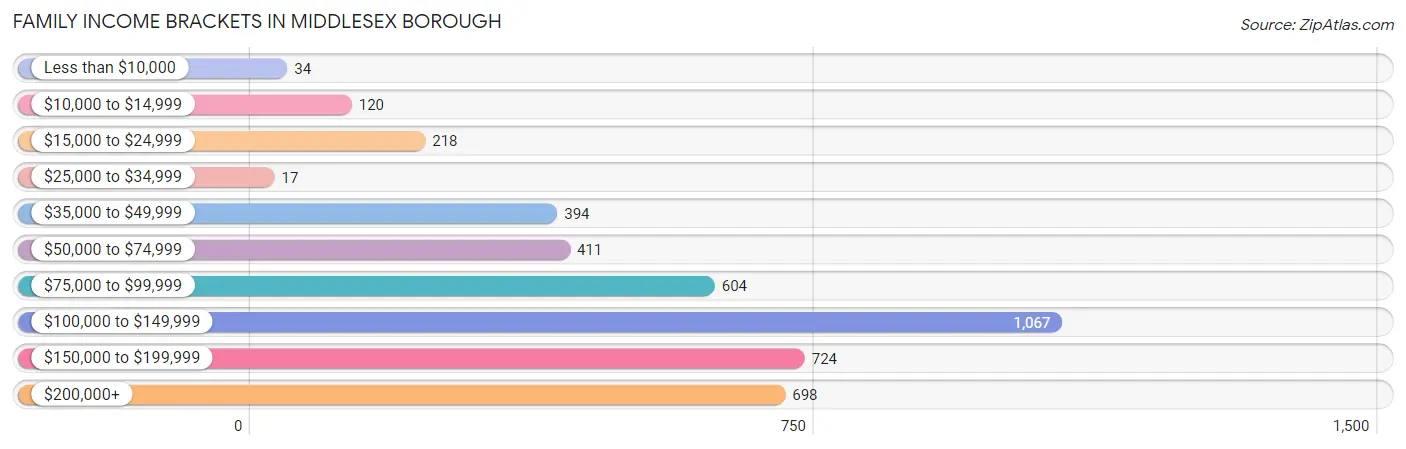
| Income Bracket | # Families | % Families |
| Less than $10,000 | 34 | 0.8% |
| $10,000 to $14,999 | 120 | 2.8% |
| $15,000 to $24,999 | 218 | 5.1% |
| $25,000 to $34,999 | 17 | 0.4% |
| $35,000 to $49,999 | 394 | 9.2% |
| $50,000 to $74,999 | 411 | 9.6% |
| $75,000 to $99,999 | 604 | 14.1% |
| $100,000 to $149,999 | 1,067 | 24.9% |
| $150,000 to $199,999 | 724 | 16.9% |
| $200,000+ | 698 | 16.3% |
Family Income by Famaliy Size in Middlesex borough
6-person families (21 | 0.5%) account for the highest median family income in Middlesex borough with $250,001 per family, while 2-person families (2,110 | 49.2%) have the highest median income of $48,694 per family member.
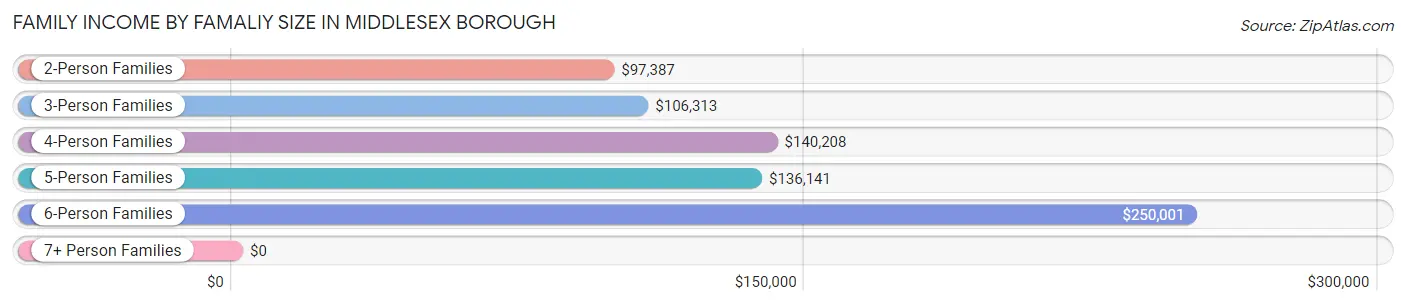
| Income Bracket | # Families | Median Income |
| 2-Person Families | 2,110 (49.2%) | $97,387 |
| 3-Person Families | 981 (22.9%) | $106,313 |
| 4-Person Families | 737 (17.2%) | $140,208 |
| 5-Person Families | 389 (9.1%) | $136,141 |
| 6-Person Families | 21 (0.5%) | $250,001 |
| 7+ Person Families | 46 (1.1%) | $0 |
| Total | 4,284 (100.0%) | $110,365 |
Family Income by Number of Earners in Middlesex borough
The median family income in Middlesex borough is $110,365, with families comprising 3+ earners (555) having the highest median family income of $225,368, while families with 1 earner (1,273) have the lowest median family income of $55,875, accounting for 13.0% and 29.7% of families, respectively.
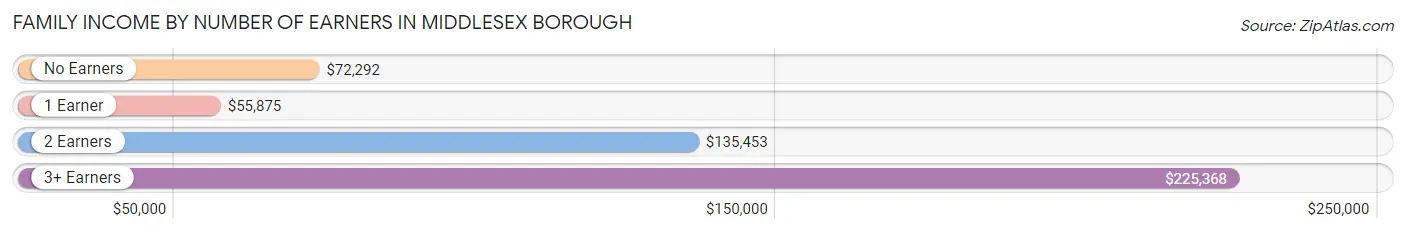
| Number of Earners | # Families | Median Income |
| No Earners | 445 (10.4%) | $72,292 |
| 1 Earner | 1,273 (29.7%) | $55,875 |
| 2 Earners | 2,011 (46.9%) | $135,453 |
| 3+ Earners | 555 (13.0%) | $225,368 |
| Total | 4,284 (100.0%) | $110,365 |
Household Income in Middlesex borough
Household Income Brackets in Middlesex borough
With 1,317 households falling in the category, the $100,000 to $149,999 income range is the most frequent in Middlesex borough, accounting for 23.6% of all households. In contrast, only 78 households (1.4%) fall into the less than $10,000 income bracket, making it the least populous group.
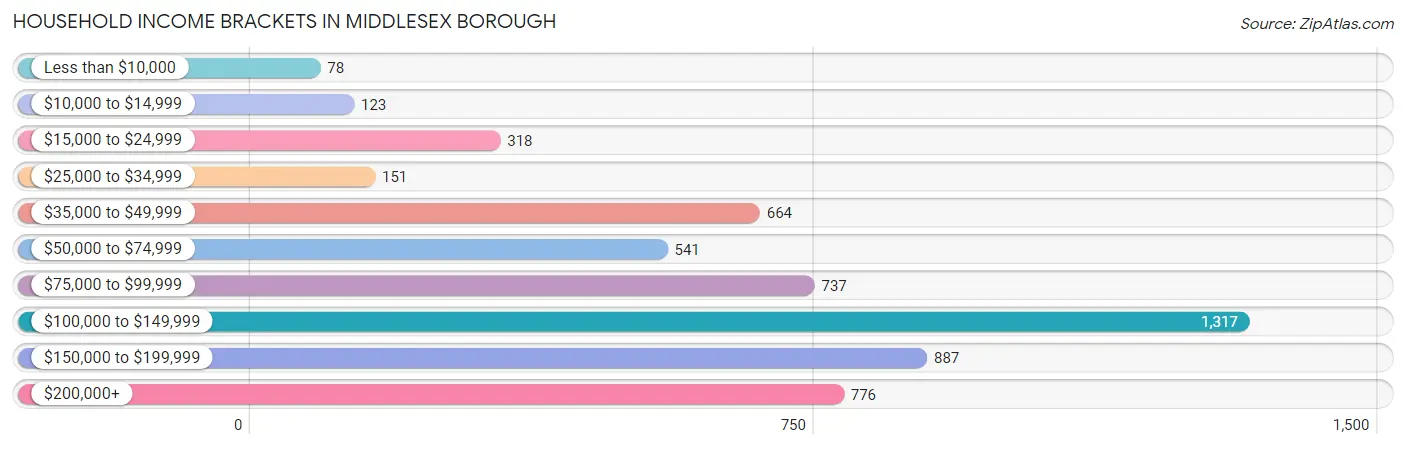
| Income Bracket | # Households | % Households |
| Less than $10,000 | 78 | 1.4% |
| $10,000 to $14,999 | 123 | 2.2% |
| $15,000 to $24,999 | 318 | 5.7% |
| $25,000 to $34,999 | 151 | 2.7% |
| $35,000 to $49,999 | 664 | 11.9% |
| $50,000 to $74,999 | 541 | 9.7% |
| $75,000 to $99,999 | 737 | 13.2% |
| $100,000 to $149,999 | 1,317 | 23.6% |
| $150,000 to $199,999 | 887 | 15.9% |
| $200,000+ | 776 | 13.9% |
Household Income by Householder Age in Middlesex borough
The median household income in Middlesex borough is $101,868, with the highest median household income of $114,933 found in the 45 to 64 years age bracket for the primary householder. A total of 2,642 households (47.3%) fall into this category. Meanwhile, the 15 to 24 years age bracket for the primary householder has the lowest median household income of $0, with 57 households (1.0%) in this group.
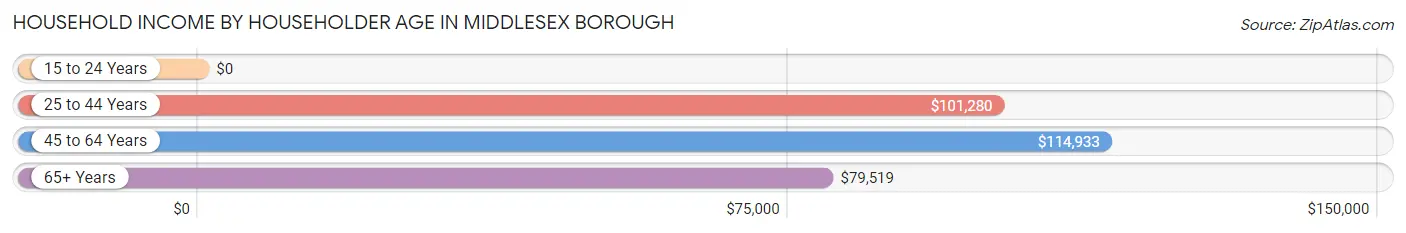
| Income Bracket | # Households | Median Income |
| 15 to 24 Years | 57 (1.0%) | $0 |
| 25 to 44 Years | 1,522 (27.3%) | $101,280 |
| 45 to 64 Years | 2,642 (47.3%) | $114,933 |
| 65+ Years | 1,359 (24.3%) | $79,519 |
| Total | 5,580 (100.0%) | $101,868 |
Poverty in Middlesex borough
Income Below Poverty by Sex and Age in Middlesex borough
With 6.4% poverty level for males and 7.9% for females among the residents of Middlesex borough, 16 and 17 year old males and 75 year old and over females are the most vulnerable to poverty, with 31 males (27.7%) and 161 females (21.8%) in their respective age groups living below the poverty level.
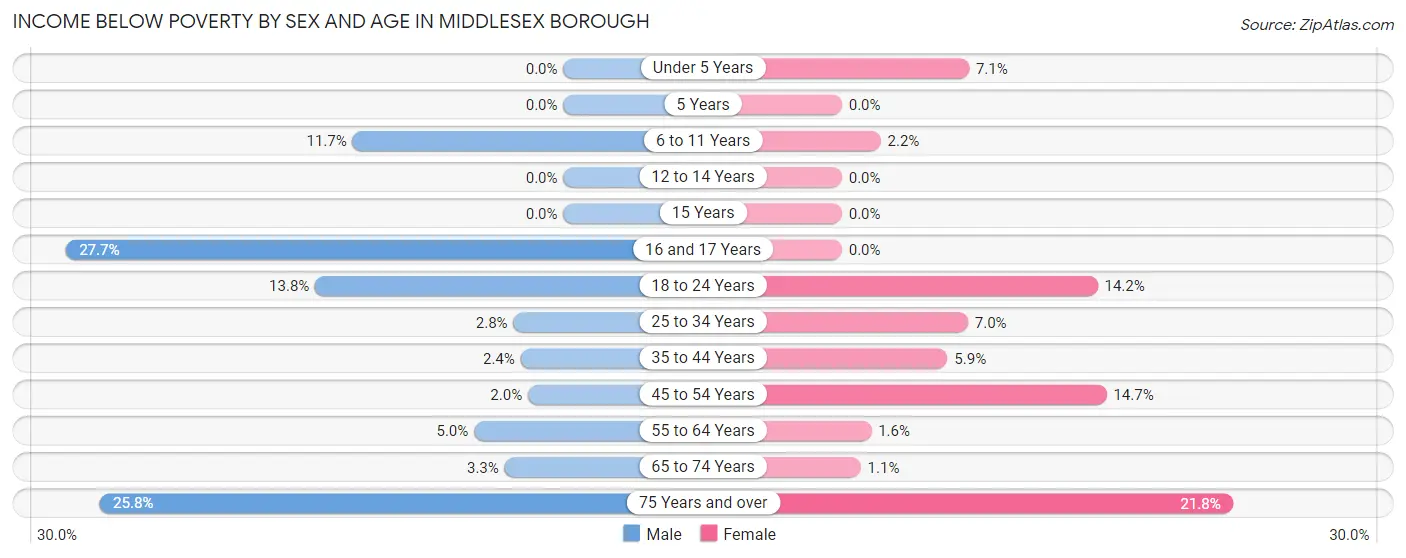
| Age Bracket | Male | Female |
| Under 5 Years | 0 (0.0%) | 24 (7.1%) |
| 5 Years | 0 (0.0%) | 0 (0.0%) |
| 6 to 11 Years | 56 (11.7%) | 15 (2.2%) |
| 12 to 14 Years | 0 (0.0%) | 0 (0.0%) |
| 15 Years | 0 (0.0%) | 0 (0.0%) |
| 16 and 17 Years | 31 (27.7%) | 0 (0.0%) |
| 18 to 24 Years | 76 (13.8%) | 42 (14.2%) |
| 25 to 34 Years | 23 (2.8%) | 70 (7.0%) |
| 35 to 44 Years | 22 (2.4%) | 43 (5.9%) |
| 45 to 54 Years | 17 (2.0%) | 220 (14.7%) |
| 55 to 64 Years | 62 (5.0%) | 17 (1.6%) |
| 65 to 74 Years | 21 (3.3%) | 7 (1.1%) |
| 75 Years and over | 130 (25.8%) | 161 (21.8%) |
| Total | 438 (6.4%) | 599 (7.9%) |
Income Above Poverty by Sex and Age in Middlesex borough
According to the poverty statistics in Middlesex borough, males aged under 5 years and females aged 5 years are the age groups that are most secure financially, with 100.0% of males and 100.0% of females in these age groups living above the poverty line.
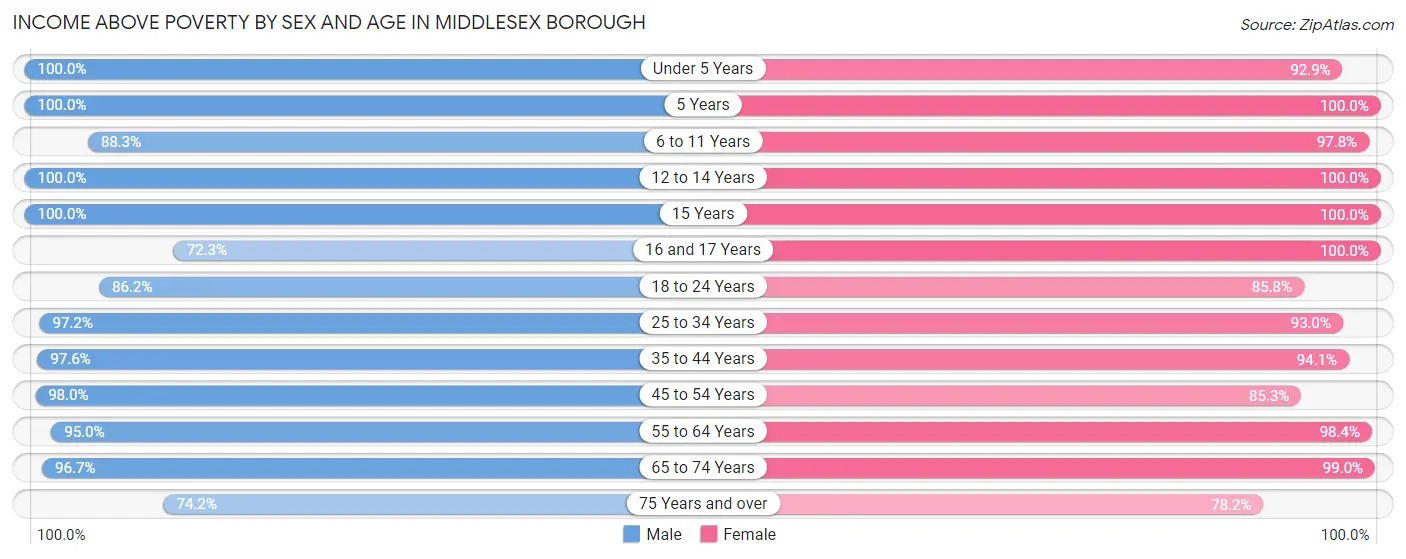
| Age Bracket | Male | Female |
| Under 5 Years | 370 (100.0%) | 315 (92.9%) |
| 5 Years | 106 (100.0%) | 14 (100.0%) |
| 6 to 11 Years | 421 (88.3%) | 678 (97.8%) |
| 12 to 14 Years | 227 (100.0%) | 207 (100.0%) |
| 15 Years | 28 (100.0%) | 154 (100.0%) |
| 16 and 17 Years | 81 (72.3%) | 268 (100.0%) |
| 18 to 24 Years | 474 (86.2%) | 253 (85.8%) |
| 25 to 34 Years | 804 (97.2%) | 927 (93.0%) |
| 35 to 44 Years | 904 (97.6%) | 688 (94.1%) |
| 45 to 54 Years | 847 (98.0%) | 1,273 (85.3%) |
| 55 to 64 Years | 1,186 (95.0%) | 1,022 (98.4%) |
| 65 to 74 Years | 621 (96.7%) | 657 (99.0%) |
| 75 Years and over | 374 (74.2%) | 579 (78.2%) |
| Total | 6,443 (93.6%) | 7,035 (92.1%) |
Income Below Poverty Among Married-Couple Families in Middlesex borough
The poverty statistics for married-couple families in Middlesex borough show that 8.6% or 289 of the total 3,380 families live below the poverty line. Families with no children have the highest poverty rate of 12.2%, comprising of 251 families. On the other hand, families with 5 or more children have the lowest poverty rate of 0.0%, which includes 0 families.
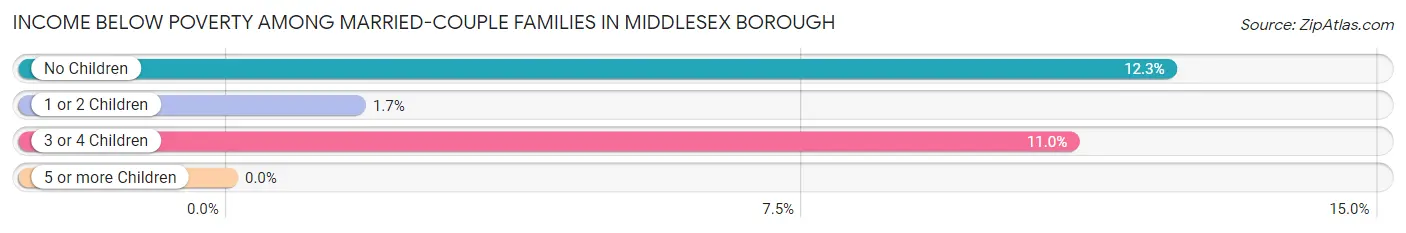
| Children | Above Poverty | Below Poverty |
| No Children | 1,798 (87.7%) | 251 (12.2%) |
| 1 or 2 Children | 1,118 (98.3%) | 19 (1.7%) |
| 3 or 4 Children | 154 (89.0%) | 19 (11.0%) |
| 5 or more Children | 21 (100.0%) | 0 (0.0%) |
| Total | 3,091 (91.4%) | 289 (8.6%) |
Income Below Poverty Among Single-Parent Households in Middlesex borough
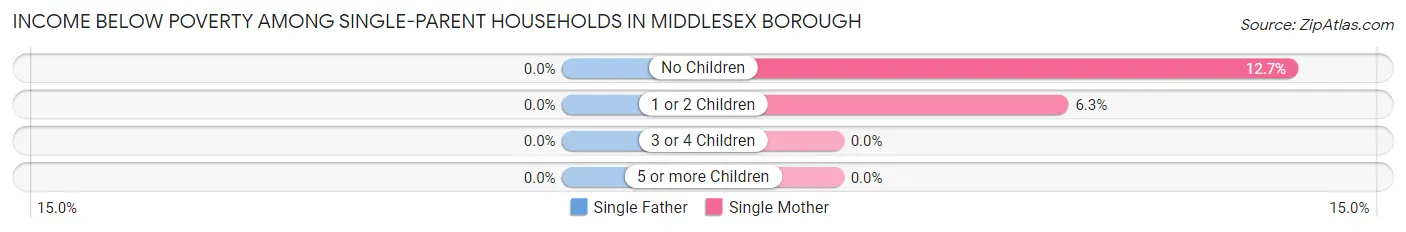
| Children | Single Father | Single Mother |
| No Children | 0 (0.0%) | 42 (12.7%) |
| 1 or 2 Children | 0 (0.0%) | 29 (6.3%) |
| 3 or 4 Children | 0 (0.0%) | 0 (0.0%) |
| 5 or more Children | 0 (0.0%) | 0 (0.0%) |
| Total | 0 (0.0%) | 71 (8.8%) |
Income Below Poverty Among Married-Couple vs Single-Parent Households in Middlesex borough
The poverty data for Middlesex borough shows that 289 of the married-couple family households (8.6%) and 71 of the single-parent households (7.9%) are living below the poverty level. Within the married-couple family households, those with no children have the highest poverty rate, with 251 households (12.2%) falling below the poverty line. Among the single-parent households, those with no children have the highest poverty rate, with 42 household (10.2%) living below poverty.
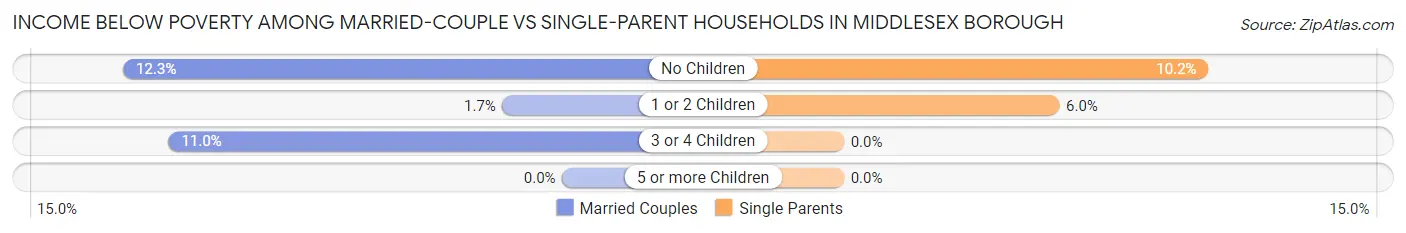
| Children | Married-Couple Families | Single-Parent Households |
| No Children | 251 (12.2%) | 42 (10.2%) |
| 1 or 2 Children | 19 (1.7%) | 29 (6.0%) |
| 3 or 4 Children | 19 (11.0%) | 0 (0.0%) |
| 5 or more Children | 0 (0.0%) | 0 (0.0%) |
| Total | 289 (8.6%) | 71 (7.9%) |
Race in Middlesex borough
The most populous races in Middlesex borough are White / Caucasian (8,919 | 61.4%), Hispanic or Latino (3,873 | 26.7%), and Asian (1,549 | 10.7%).
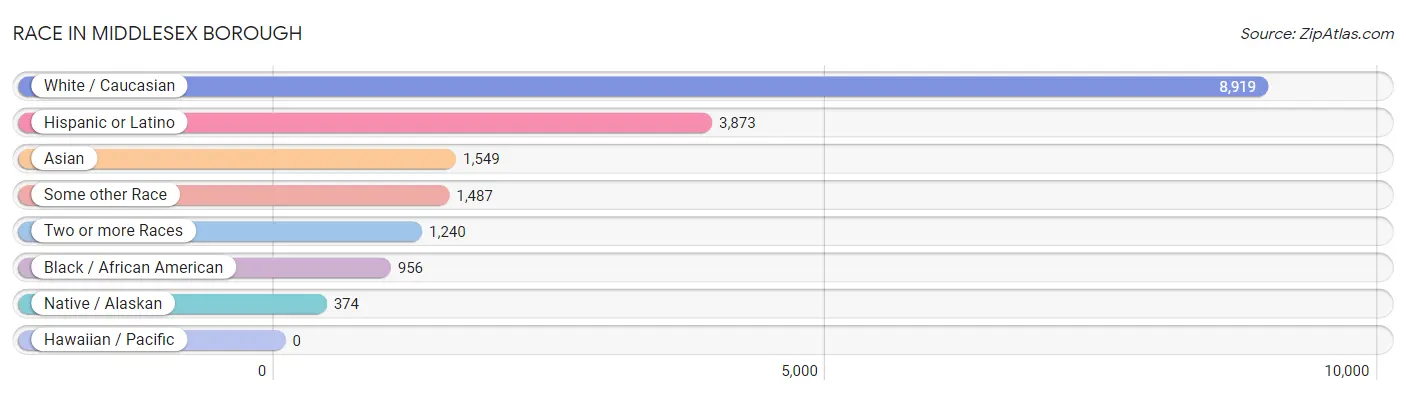
| Race | # Population | % Population |
| Asian | 1,549 | 10.7% |
| Black / African American | 956 | 6.6% |
| Hawaiian / Pacific | 0 | 0.0% |
| Hispanic or Latino | 3,873 | 26.7% |
| Native / Alaskan | 374 | 2.6% |
| White / Caucasian | 8,919 | 61.4% |
| Two or more Races | 1,240 | 8.5% |
| Some other Race | 1,487 | 10.2% |
| Total | 14,525 | 100.0% |
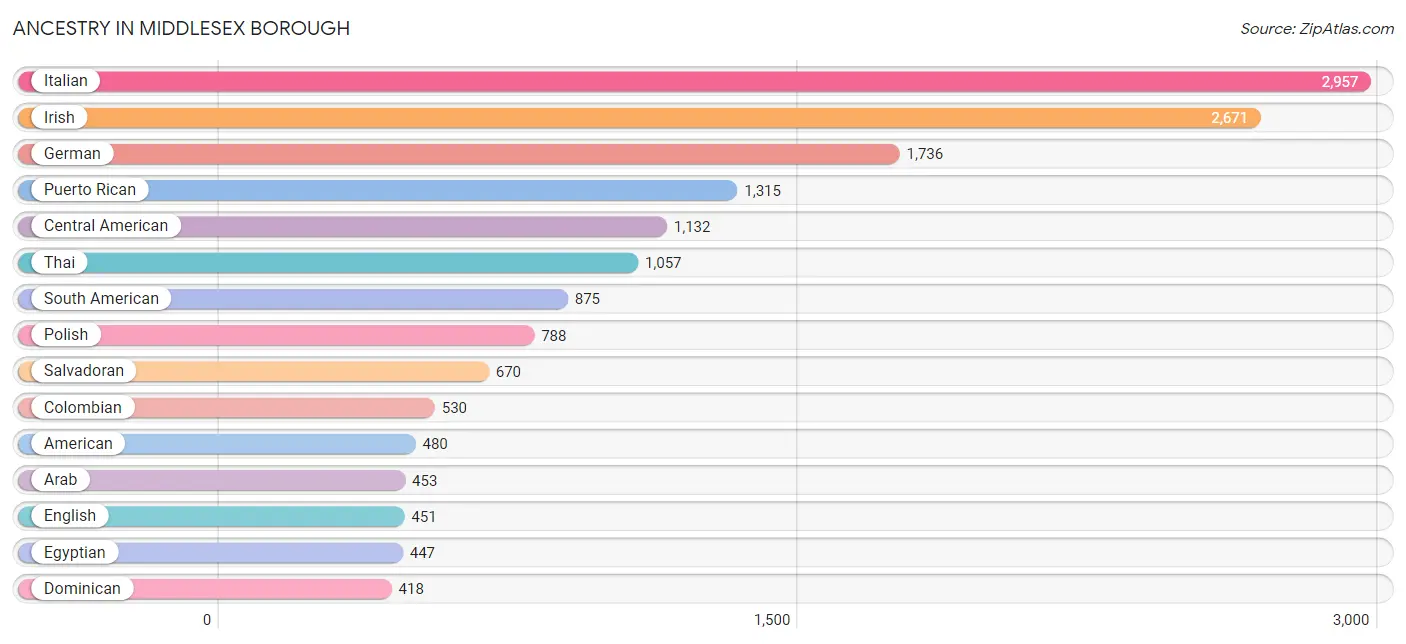
Ancestry in Middlesex borough
The most populous ancestries reported in Middlesex borough are Italian (2,957 | 20.4%), Irish (2,671 | 18.4%), German (1,736 | 11.9%), Puerto Rican (1,315 | 9.0%), and Central American (1,132 | 7.8%), together accounting for 67.5% of all Middlesex borough residents.
| Ancestry | # Population | % Population |
| African | 14 | 0.1% |
| Albanian | 41 | 0.3% |
| American | 480 | 3.3% |
| Arab | 453 | 3.1% |
| Austrian | 100 | 0.7% |
| British | 23 | 0.2% |
| Burmese | 54 | 0.4% |
| Canadian | 19 | 0.1% |
| Central American | 1,132 | 7.8% |
| Central American Indian | 388 | 2.7% |
| Cherokee | 81 | 0.6% |
| Colombian | 530 | 3.6% |
| Costa Rican | 115 | 0.8% |
| Cree | 47 | 0.3% |
| Croatian | 38 | 0.3% |
| Cuban | 17 | 0.1% |
| Czechoslovakian | 13 | 0.1% |
| Dominican | 418 | 2.9% |
| Dutch | 205 | 1.4% |
| Eastern European | 188 | 1.3% |
| Ecuadorian | 189 | 1.3% |
| Egyptian | 447 | 3.1% |
| English | 451 | 3.1% |
| European | 19 | 0.1% |
| Finnish | 18 | 0.1% |
| French | 118 | 0.8% |
| French Canadian | 58 | 0.4% |
| German | 1,736 | 11.9% |
| Greek | 193 | 1.3% |
| Guatemalan | 18 | 0.1% |
| Haitian | 190 | 1.3% |
| Honduran | 104 | 0.7% |
| Hungarian | 158 | 1.1% |
| Indian (Asian) | 8 | 0.1% |
| Irish | 2,671 | 18.4% |
| Italian | 2,957 | 20.4% |
| Japanese | 42 | 0.3% |
| Korean | 269 | 1.8% |
| Latvian | 20 | 0.1% |
| Lebanese | 6 | 0.0% |
| Mexican | 93 | 0.6% |
| Nicaraguan | 15 | 0.1% |
| Norwegian | 33 | 0.2% |
| Panamanian | 210 | 1.5% |
| Peruvian | 156 | 1.1% |
| Polish | 788 | 5.4% |
| Puerto Rican | 1,315 | 9.0% |
| Romanian | 7 | 0.1% |
| Russian | 166 | 1.1% |
| Salvadoran | 670 | 4.6% |
| Scandinavian | 21 | 0.1% |
| Scotch-Irish | 85 | 0.6% |
| Scottish | 207 | 1.4% |
| Slavic | 55 | 0.4% |
| Slovak | 22 | 0.2% |
| Slovene | 15 | 0.1% |
| South American | 875 | 6.0% |
| Spanish | 23 | 0.2% |
| Sri Lankan | 156 | 1.1% |
| Subsaharan African | 14 | 0.1% |
| Swedish | 27 | 0.2% |
| Thai | 1,057 | 7.3% |
| Trinidadian and Tobagonian | 69 | 0.5% |
| Ukrainian | 275 | 1.9% |
| Welsh | 54 | 0.4% | View All 65 Rows |
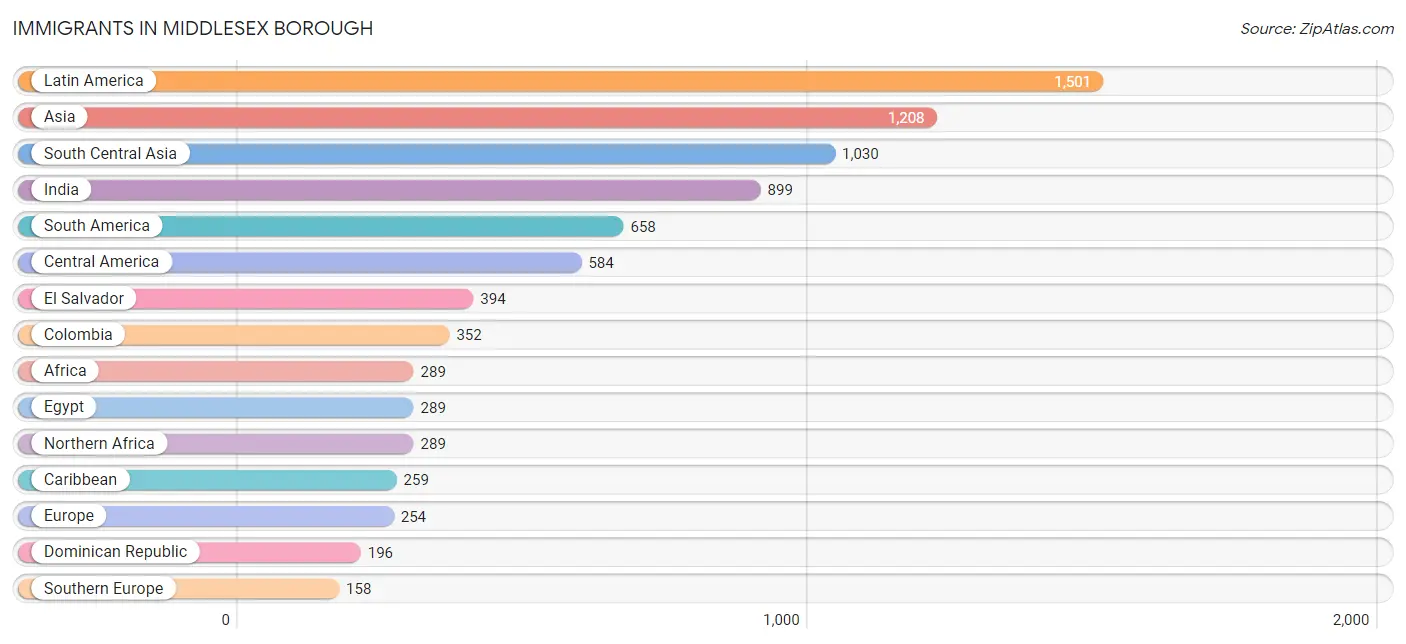
Immigrants in Middlesex borough
The most numerous immigrant groups reported in Middlesex borough came from Latin America (1,501 | 10.3%), Asia (1,208 | 8.3%), South Central Asia (1,030 | 7.1%), India (899 | 6.2%), and South America (658 | 4.5%), together accounting for 36.5% of all Middlesex borough residents.
| Immigration Origin | # Population | % Population |
| Africa | 289 | 2.0% |
| Asia | 1,208 | 8.3% |
| Austria | 15 | 0.1% |
| Cambodia | 23 | 0.2% |
| Canada | 19 | 0.1% |
| Caribbean | 259 | 1.8% |
| Central America | 584 | 4.0% |
| Colombia | 352 | 2.4% |
| Costa Rica | 49 | 0.3% |
| Dominican Republic | 196 | 1.3% |
| Eastern Asia | 29 | 0.2% |
| Eastern Europe | 52 | 0.4% |
| Ecuador | 143 | 1.0% |
| Egypt | 289 | 2.0% |
| El Salvador | 394 | 2.7% |
| Europe | 254 | 1.8% |
| Germany | 24 | 0.2% |
| Greece | 49 | 0.3% |
| Guyana | 74 | 0.5% |
| Honduras | 57 | 0.4% |
| India | 899 | 6.2% |
| Italy | 74 | 0.5% |
| Jamaica | 63 | 0.4% |
| Korea | 29 | 0.2% |
| Latin America | 1,501 | 10.3% |
| Nicaragua | 28 | 0.2% |
| Northern Africa | 289 | 2.0% |
| Northern Europe | 5 | 0.0% |
| Pakistan | 77 | 0.5% |
| Panama | 56 | 0.4% |
| Peru | 89 | 0.6% |
| Philippines | 39 | 0.3% |
| Poland | 17 | 0.1% |
| Portugal | 35 | 0.2% |
| South America | 658 | 4.5% |
| South Central Asia | 1,030 | 7.1% |
| South Eastern Asia | 149 | 1.0% |
| Southern Europe | 158 | 1.1% |
| Ukraine | 35 | 0.2% |
| Uzbekistan | 54 | 0.4% |
| Vietnam | 87 | 0.6% |
| Western Europe | 39 | 0.3% | View All 42 Rows |
Sex and Age in Middlesex borough
Sex and Age in Middlesex borough
The most populous age groups in Middlesex borough are 60 to 64 Years (663 | 9.6%) for men and 50 to 54 Years (808 | 10.6%) for women.
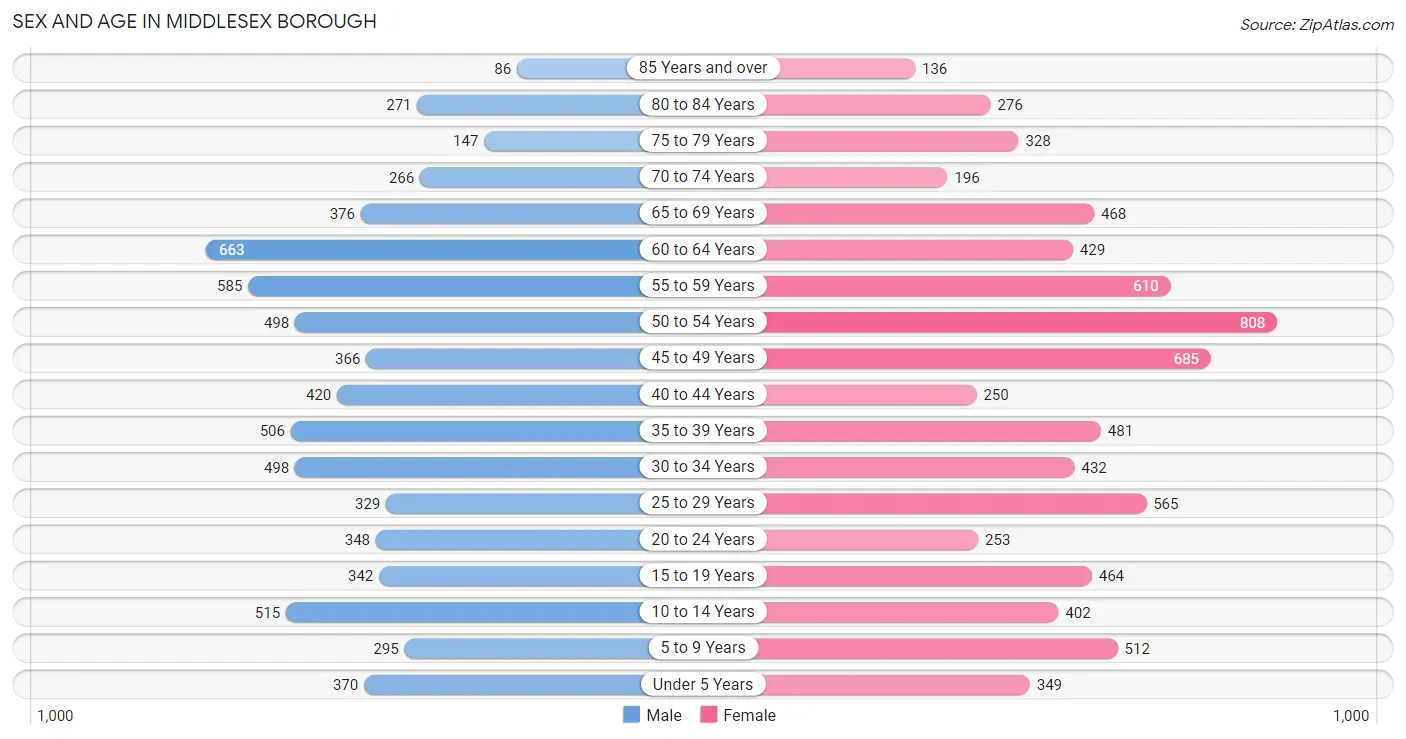
| Age Bracket | Male | Female |
| Under 5 Years | 370 (5.4%) | 349 (4.6%) |
| 5 to 9 Years | 295 (4.3%) | 512 (6.7%) |
| 10 to 14 Years | 515 (7.5%) | 402 (5.3%) |
| 15 to 19 Years | 342 (5.0%) | 464 (6.1%) |
| 20 to 24 Years | 348 (5.1%) | 253 (3.3%) |
| 25 to 29 Years | 329 (4.8%) | 565 (7.4%) |
| 30 to 34 Years | 498 (7.2%) | 432 (5.7%) |
| 35 to 39 Years | 506 (7.3%) | 481 (6.3%) |
| 40 to 44 Years | 420 (6.1%) | 250 (3.3%) |
| 45 to 49 Years | 366 (5.3%) | 685 (9.0%) |
| 50 to 54 Years | 498 (7.2%) | 808 (10.6%) |
| 55 to 59 Years | 585 (8.5%) | 610 (8.0%) |
| 60 to 64 Years | 663 (9.6%) | 429 (5.6%) |
| 65 to 69 Years | 376 (5.5%) | 468 (6.1%) |
| 70 to 74 Years | 266 (3.9%) | 196 (2.6%) |
| 75 to 79 Years | 147 (2.1%) | 328 (4.3%) |
| 80 to 84 Years | 271 (3.9%) | 276 (3.6%) |
| 85 Years and over | 86 (1.3%) | 136 (1.8%) |
| Total | 6,881 (100.0%) | 7,644 (100.0%) |
Families and Households in Middlesex borough
Median Family Size in Middlesex borough
The median family size in Middlesex borough is 2.96 persons per family, with married-couple families (3,380 | 78.9%) accounting for the largest median family size of 3.13 persons per family. On the other hand, single male/father families (101 | 2.4%) represent the smallest median family size with 2.18 persons per family.
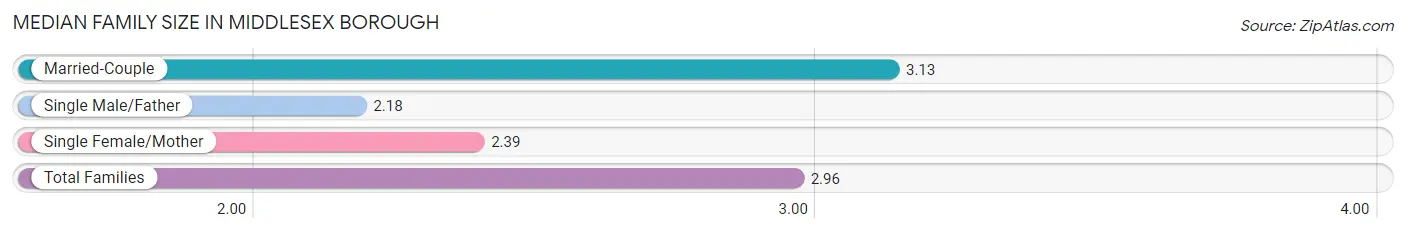
| Family Type | # Families | Family Size |
| Married-Couple | 3,380 (78.9%) | 3.13 |
| Single Male/Father | 101 (2.4%) | 2.18 |
| Single Female/Mother | 803 (18.7%) | 2.39 |
| Total Families | 4,284 (100.0%) | 2.96 |
Median Household Size in Middlesex borough
The median household size in Middlesex borough is 2.60 persons per household, with married-couple households (3,380 | 60.6%) accounting for the largest median household size of 3.14 persons per household. non-family households (1,296 | 23.2%) represent the smallest median household size with 1.25 persons per household.
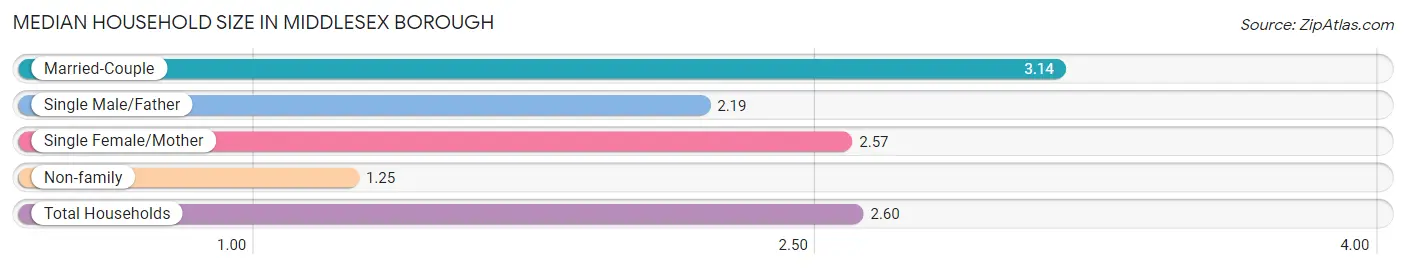
| Household Type | # Households | Household Size |
| Married-Couple | 3,380 (60.6%) | 3.14 |
| Single Male/Father | 101 (1.8%) | 2.19 |
| Single Female/Mother | 803 (14.4%) | 2.57 |
| Non-family | 1,296 (23.2%) | 1.25 |
| Total Households | 5,580 (100.0%) | 2.60 |
Household Size by Marriage Status in Middlesex borough
Out of a total of 5,580 households in Middlesex borough, 4,284 (76.8%) are family households, while 1,296 (23.2%) are nonfamily households. The most numerous type of family households are 2-person households, comprising 2,019, and the most common type of nonfamily households are 1-person households, comprising 1,064.
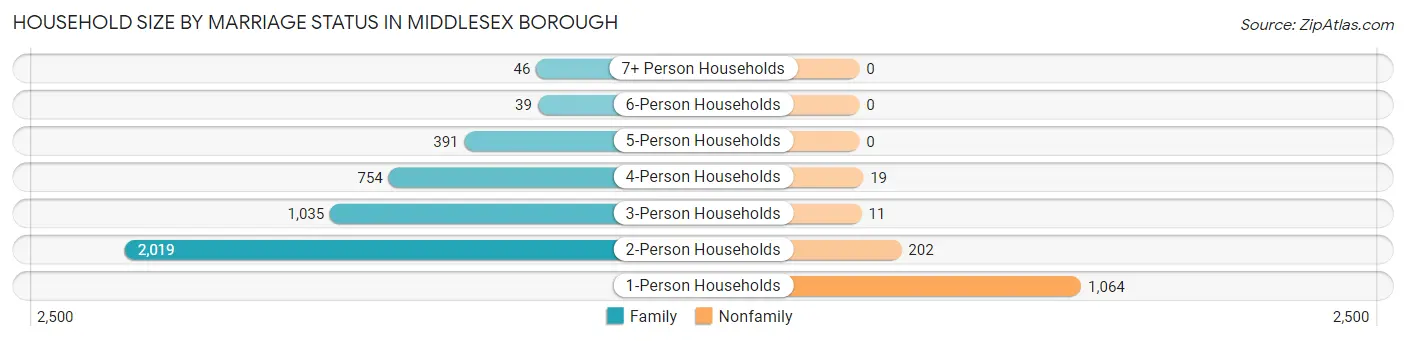
| Household Size | Family Households | Nonfamily Households |
| 1-Person Households | - | 1,064 (19.1%) |
| 2-Person Households | 2,019 (36.2%) | 202 (3.6%) |
| 3-Person Households | 1,035 (18.5%) | 11 (0.2%) |
| 4-Person Households | 754 (13.5%) | 19 (0.3%) |
| 5-Person Households | 391 (7.0%) | 0 (0.0%) |
| 6-Person Households | 39 (0.7%) | 0 (0.0%) |
| 7+ Person Households | 46 (0.8%) | 0 (0.0%) |
| Total | 4,284 (76.8%) | 1,296 (23.2%) |
Female Fertility in Middlesex borough
Fertility by Age in Middlesex borough
Average fertility rate in Middlesex borough is 55.0 births per 1,000 women. Women in the age bracket of 20 to 34 years have the highest fertility rate with 126.0 births per 1,000 women. Women in the age bracket of 20 to 34 years acount for 86.8% of all women with births.
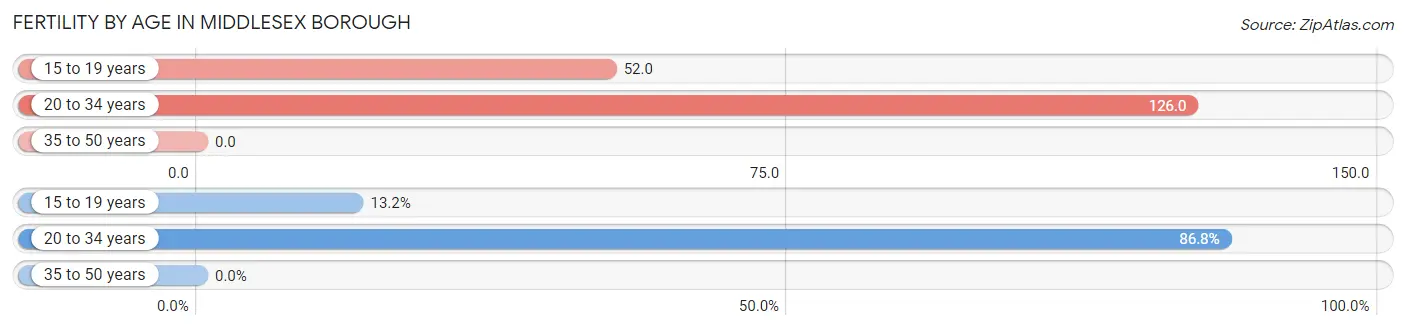
| Age Bracket | Women with Births | Births / 1,000 Women |
| 15 to 19 years | 24 (13.2%) | 52.0 |
| 20 to 34 years | 158 (86.8%) | 126.0 |
| 35 to 50 years | 0 (0.0%) | 0.0 |
| Total | 182 (100.0%) | 55.0 |
Fertility by Age by Marriage Status in Middlesex borough
73.6% of women with births (182) in Middlesex borough are married. The highest percentage of unmarried women with births falls into 15 to 19 years age bracket with 100.0% of them unmarried at the time of birth, while the lowest percentage of unmarried women with births belong to 20 to 34 years age bracket with 15.2% of them unmarried.
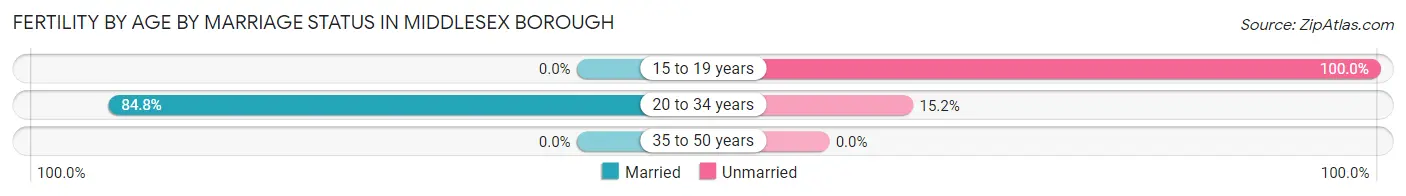
| Age Bracket | Married | Unmarried |
| 15 to 19 years | 0 (0.0%) | 24 (100.0%) |
| 20 to 34 years | 134 (84.8%) | 24 (15.2%) |
| 35 to 50 years | 0 (0.0%) | 0 (0.0%) |
| Total | 134 (73.6%) | 48 (26.4%) |
Fertility by Education in Middlesex borough
Average fertility rate in Middlesex borough is 55.0 births per 1,000 women. Women with the education attainment of graduate degree have the highest fertility rate of 169.0 births per 1,000 women, while women with the education attainment of bachelor's degree have the lowest fertility at 20.0 births per 1,000 women. Women with the education attainment of college or associate's degree represent 28.6% of all women with births.
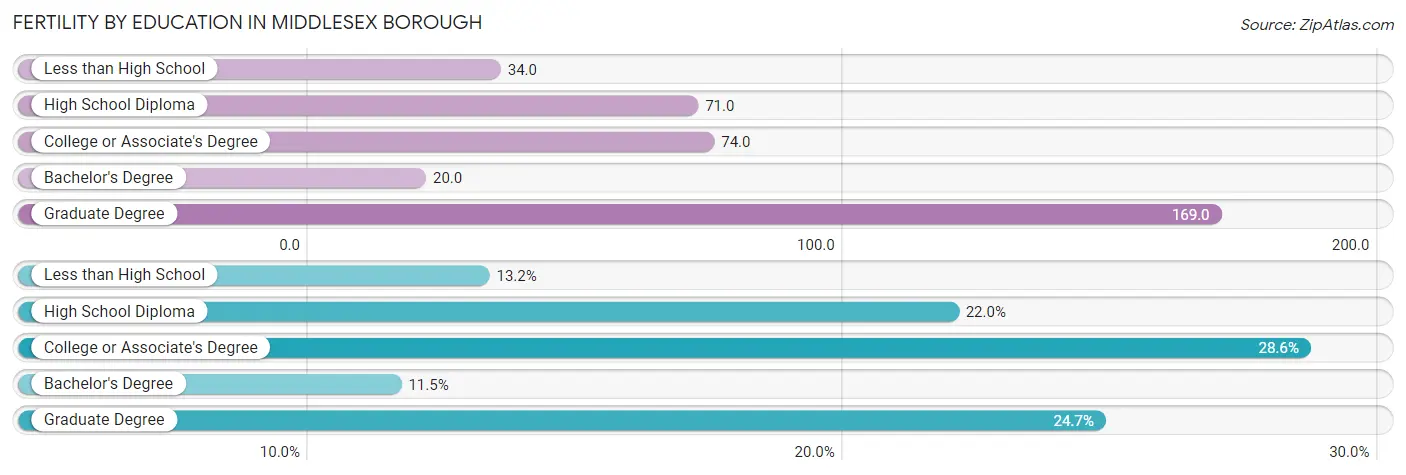
| Educational Attainment | Women with Births | Births / 1,000 Women |
| Less than High School | 24 (13.2%) | 34.0 |
| High School Diploma | 40 (22.0%) | 71.0 |
| College or Associate's Degree | 52 (28.6%) | 74.0 |
| Bachelor's Degree | 21 (11.5%) | 20.0 |
| Graduate Degree | 45 (24.7%) | 169.0 |
| Total | 182 (100.0%) | 55.0 |
Fertility by Education by Marriage Status in Middlesex borough
26.4% of women with births in Middlesex borough are unmarried. Women with the educational attainment of college or associate's degree are most likely to be married with 100.0% of them married at childbirth, while women with the educational attainment of less than high school are least likely to be married with 100.0% of them unmarried at childbirth.
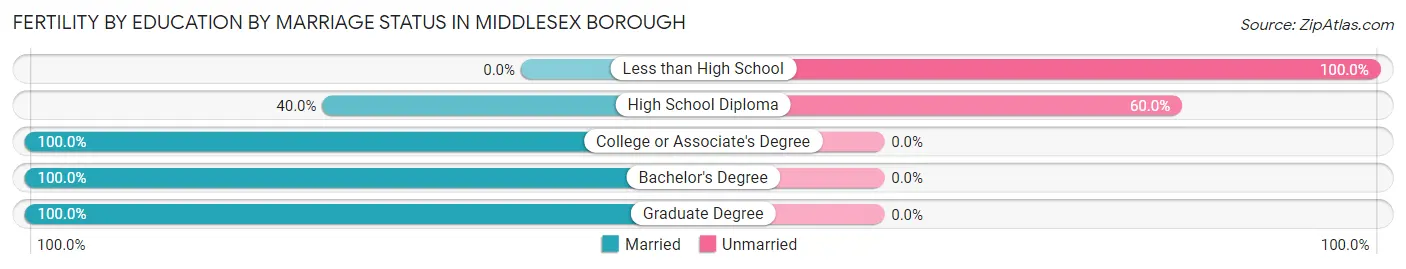
| Educational Attainment | Married | Unmarried |
| Less than High School | 0 (0.0%) | 24 (100.0%) |
| High School Diploma | 16 (40.0%) | 24 (60.0%) |
| College or Associate's Degree | 52 (100.0%) | 0 (0.0%) |
| Bachelor's Degree | 21 (100.0%) | 0 (0.0%) |
| Graduate Degree | 45 (100.0%) | 0 (0.0%) |
| Total | 134 (73.6%) | 48 (26.4%) |
Employment Characteristics in Middlesex borough
Employment by Class of Employer in Middlesex borough
Among the 7,542 employed individuals in Middlesex borough, private company employees (5,452 | 72.3%), local government employees (618 | 8.2%), and not-for-profit organizations (475 | 6.3%) make up the most common classes of employment.
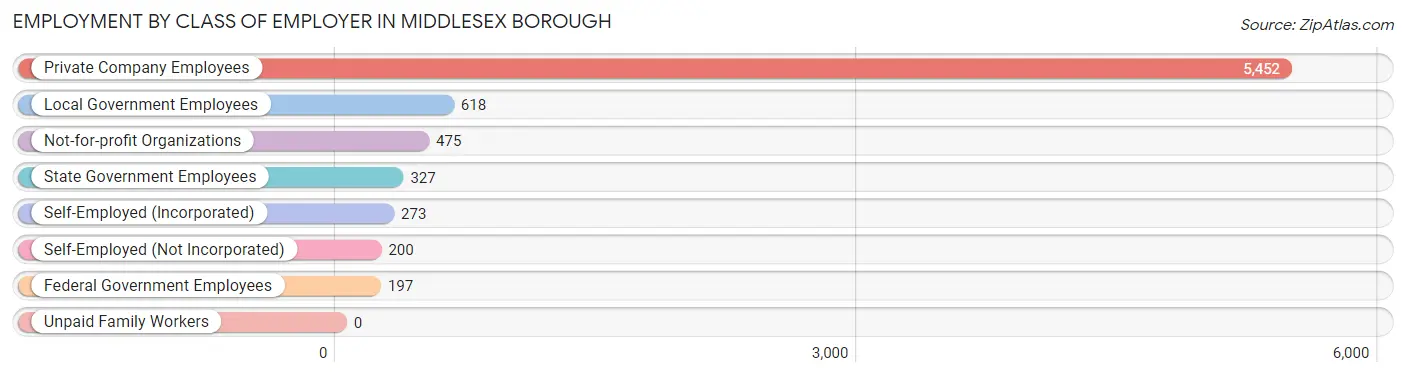
| Employer Class | # Employees | % Employees |
| Private Company Employees | 5,452 | 72.3% |
| Self-Employed (Incorporated) | 273 | 3.6% |
| Self-Employed (Not Incorporated) | 200 | 2.6% |
| Not-for-profit Organizations | 475 | 6.3% |
| Local Government Employees | 618 | 8.2% |
| State Government Employees | 327 | 4.3% |
| Federal Government Employees | 197 | 2.6% |
| Unpaid Family Workers | 0 | 0.0% |
| Total | 7,542 | 100.0% |
Employment Status by Age in Middlesex borough
According to the labor force statistics for Middlesex borough, out of the total population over 16 years of age (11,900), 69.1% or 8,223 individuals are in the labor force, with 5.6% or 460 of them unemployed. The age group with the highest labor force participation rate is 35 to 44 years, with 96.4% or 1,597 individuals in the labor force. Within the labor force, the 75 years and over age range has the highest percentage of unemployed individuals, with 100.0% or 16 of them being unemployed.
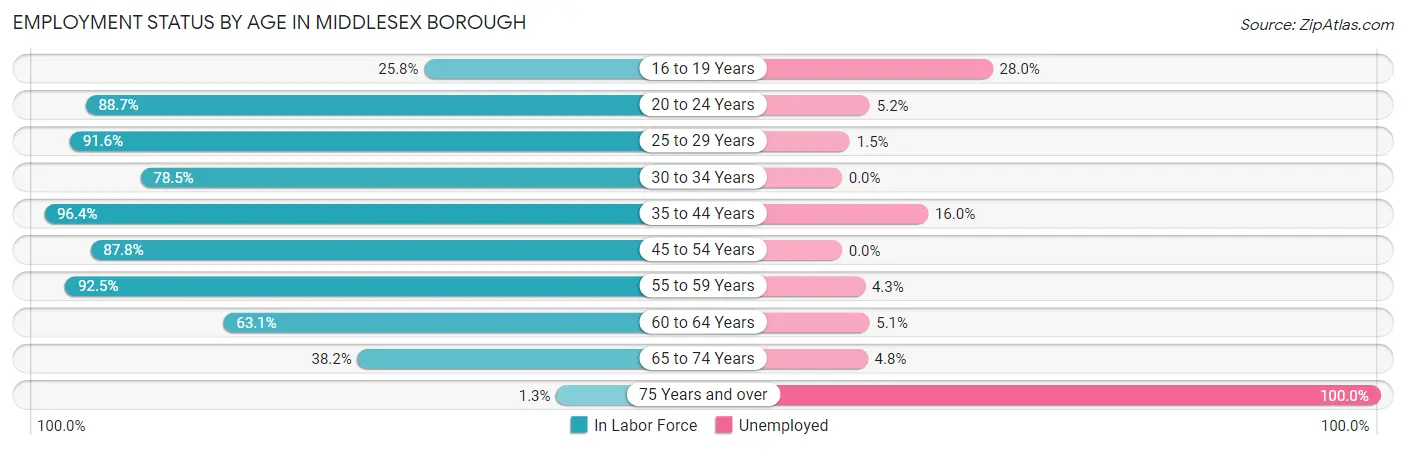
| Age Bracket | In Labor Force | Unemployed |
| 16 to 19 Years | 161 (25.8%) | 45 (28.0%) |
| 20 to 24 Years | 533 (88.7%) | 28 (5.2%) |
| 25 to 29 Years | 819 (91.6%) | 12 (1.5%) |
| 30 to 34 Years | 730 (78.5%) | 0 (0.0%) |
| 35 to 44 Years | 1,597 (96.4%) | 256 (16.0%) |
| 45 to 54 Years | 2,069 (87.8%) | 0 (0.0%) |
| 55 to 59 Years | 1,105 (92.5%) | 48 (4.3%) |
| 60 to 64 Years | 689 (63.1%) | 35 (5.1%) |
| 65 to 74 Years | 499 (38.2%) | 24 (4.8%) |
| 75 Years and over | 16 (1.3%) | 16 (100.0%) |
| Total | 8,223 (69.1%) | 460 (5.6%) |
Employment Status by Educational Attainment in Middlesex borough
According to labor force statistics for Middlesex borough, 86.3% of individuals (7,012) out of the total population between 25 and 64 years of age (8,125) are in the labor force, with 5.0% or 351 of them being unemployed. The group with the highest labor force participation rate are those with the educational attainment of bachelor's degree or higher, with 92.0% or 2,771 individuals in the labor force. Within the labor force, individuals with bachelor's degree or higher education have the highest percentage of unemployment, with 8.9% or 247 of them being unemployed.
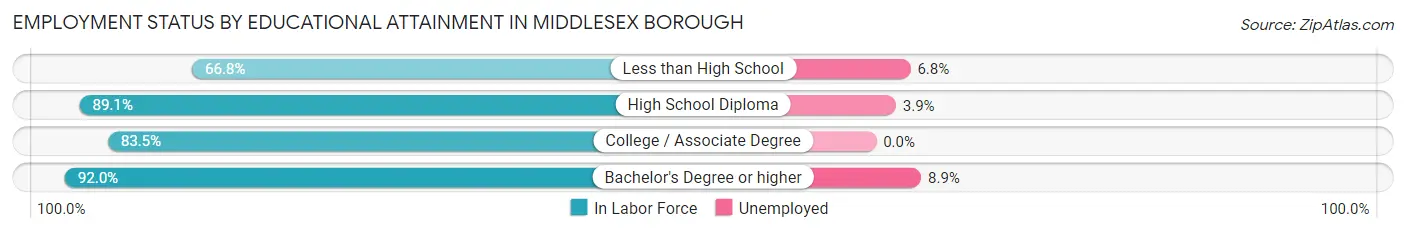
| Educational Attainment | In Labor Force | Unemployed |
| Less than High School | 543 (66.8%) | 55 (6.8%) |
| High School Diploma | 1,689 (89.1%) | 74 (3.9%) |
| College / Associate Degree | 2,007 (83.5%) | 0 (0.0%) |
| Bachelor's Degree or higher | 2,771 (92.0%) | 268 (8.9%) |
| Total | 7,012 (86.3%) | 406 (5.0%) |
Employment Occupations by Sex in Middlesex borough
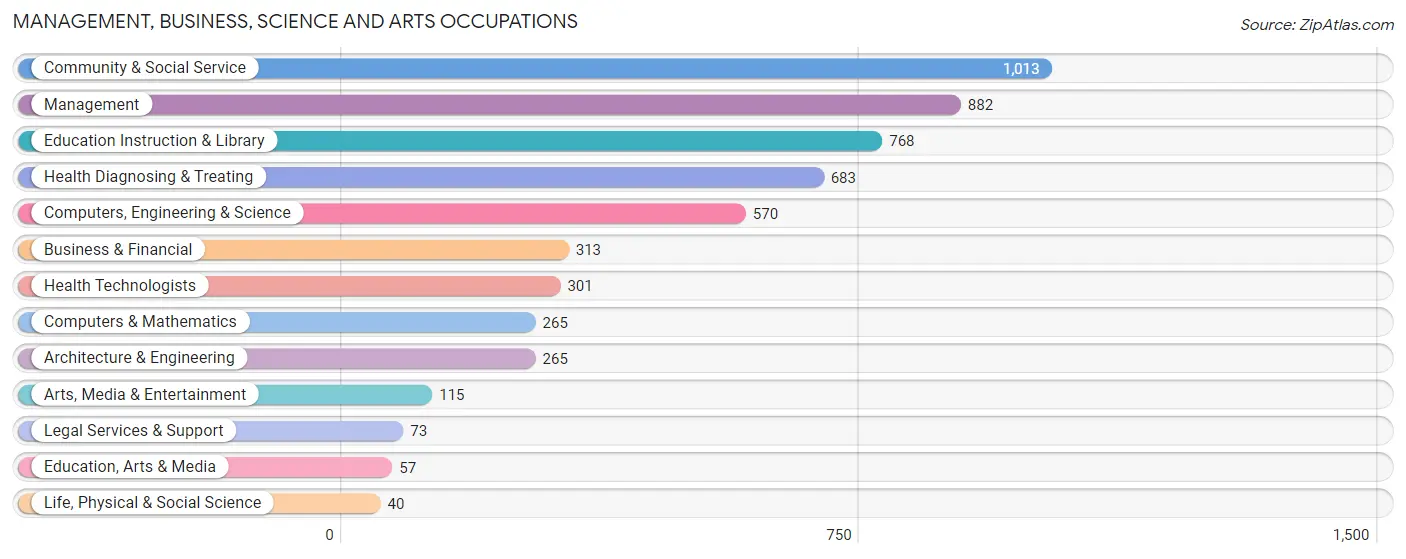
Management, Business, Science and Arts Occupations
The most common Management, Business, Science and Arts occupations in Middlesex borough are Community & Social Service (1,013 | 13.1%), Management (882 | 11.4%), Education Instruction & Library (768 | 10.0%), Health Diagnosing & Treating (683 | 8.9%), and Computers, Engineering & Science (570 | 7.4%).
Management, Business, Science and Arts Occupations by Sex
Within the Management, Business, Science and Arts occupations in Middlesex borough, the most male-oriented occupations are Computers & Mathematics (95.1%), Architecture & Engineering (86.4%), and Computers, Engineering & Science (86.3%), while the most female-oriented occupations are Education, Arts & Media (100.0%), Education Instruction & Library (79.2%), and Health Diagnosing & Treating (73.5%).
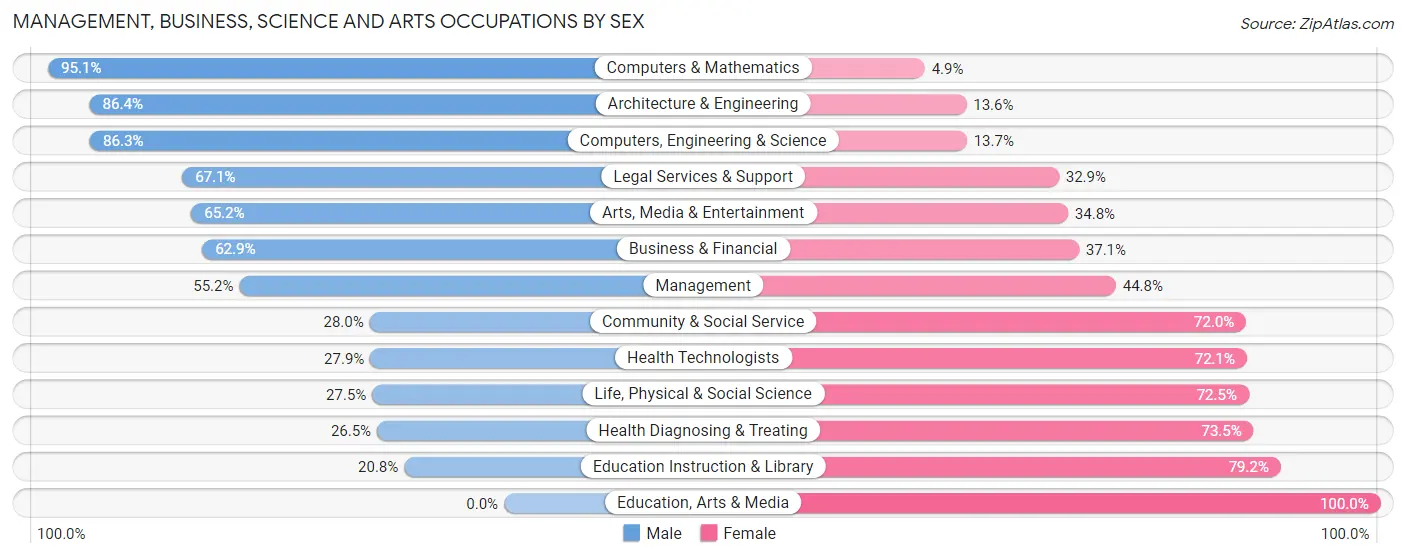
| Occupation | Male | Female |
| Management | 487 (55.2%) | 395 (44.8%) |
| Business & Financial | 197 (62.9%) | 116 (37.1%) |
| Computers, Engineering & Science | 492 (86.3%) | 78 (13.7%) |
| Computers & Mathematics | 252 (95.1%) | 13 (4.9%) |
| Architecture & Engineering | 229 (86.4%) | 36 (13.6%) |
| Life, Physical & Social Science | 11 (27.5%) | 29 (72.5%) |
| Community & Social Service | 284 (28.0%) | 729 (72.0%) |
| Education, Arts & Media | 0 (0.0%) | 57 (100.0%) |
| Legal Services & Support | 49 (67.1%) | 24 (32.9%) |
| Education Instruction & Library | 160 (20.8%) | 608 (79.2%) |
| Arts, Media & Entertainment | 75 (65.2%) | 40 (34.8%) |
| Health Diagnosing & Treating | 181 (26.5%) | 502 (73.5%) |
| Health Technologists | 84 (27.9%) | 217 (72.1%) |
| Total (Category) | 1,641 (47.4%) | 1,820 (52.6%) |
| Total (Overall) | 3,809 (49.4%) | 3,901 (50.6%) |
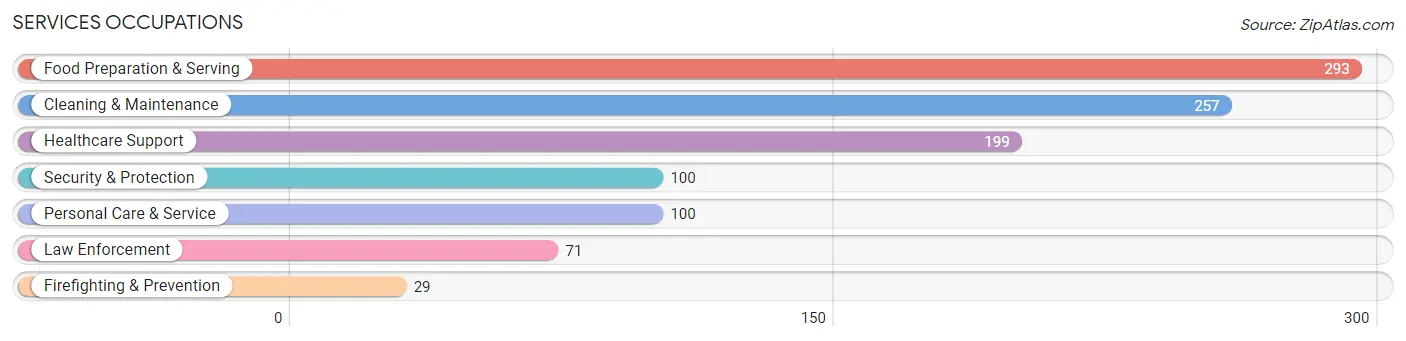
Services Occupations
The most common Services occupations in Middlesex borough are Food Preparation & Serving (293 | 3.8%), Cleaning & Maintenance (257 | 3.3%), Healthcare Support (199 | 2.6%), Security & Protection (100 | 1.3%), and Personal Care & Service (100 | 1.3%).
Services Occupations by Sex
Within the Services occupations in Middlesex borough, the most male-oriented occupations are Security & Protection (100.0%), Firefighting & Prevention (100.0%), and Law Enforcement (100.0%), while the most female-oriented occupations are Personal Care & Service (89.0%), Food Preparation & Serving (76.4%), and Healthcare Support (55.3%).
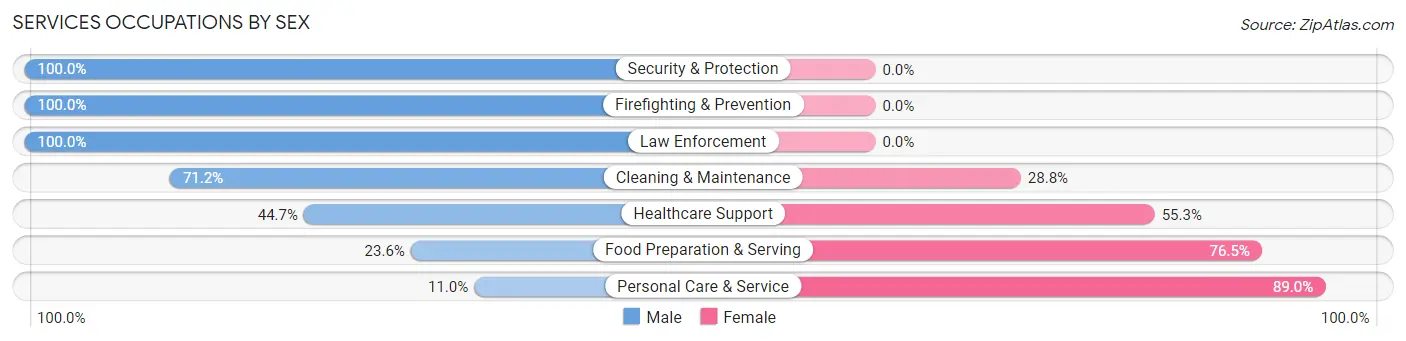
| Occupation | Male | Female |
| Healthcare Support | 89 (44.7%) | 110 (55.3%) |
| Security & Protection | 100 (100.0%) | 0 (0.0%) |
| Firefighting & Prevention | 29 (100.0%) | 0 (0.0%) |
| Law Enforcement | 71 (100.0%) | 0 (0.0%) |
| Food Preparation & Serving | 69 (23.5%) | 224 (76.4%) |
| Cleaning & Maintenance | 183 (71.2%) | 74 (28.8%) |
| Personal Care & Service | 11 (11.0%) | 89 (89.0%) |
| Total (Category) | 452 (47.6%) | 497 (52.4%) |
| Total (Overall) | 3,809 (49.4%) | 3,901 (50.6%) |
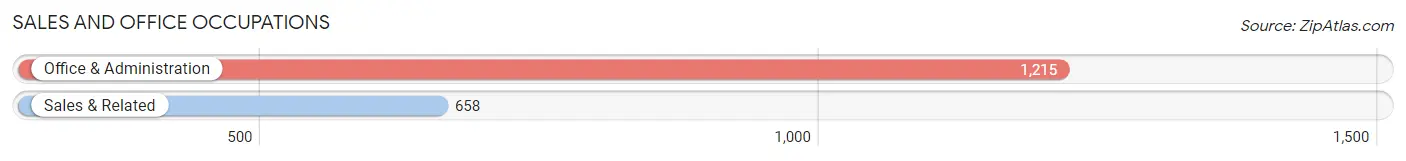
Sales and Office Occupations
The most common Sales and Office occupations in Middlesex borough are Office & Administration (1,215 | 15.8%), and Sales & Related (658 | 8.5%).
Sales and Office Occupations by Sex
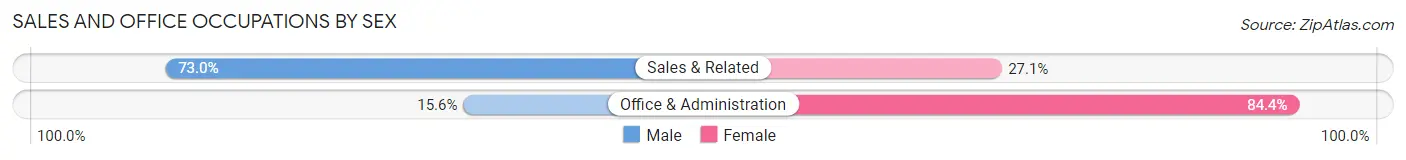
| Occupation | Male | Female |
| Sales & Related | 480 (73.0%) | 178 (27.1%) |
| Office & Administration | 190 (15.6%) | 1,025 (84.4%) |
| Total (Category) | 670 (35.8%) | 1,203 (64.2%) |
| Total (Overall) | 3,809 (49.4%) | 3,901 (50.6%) |
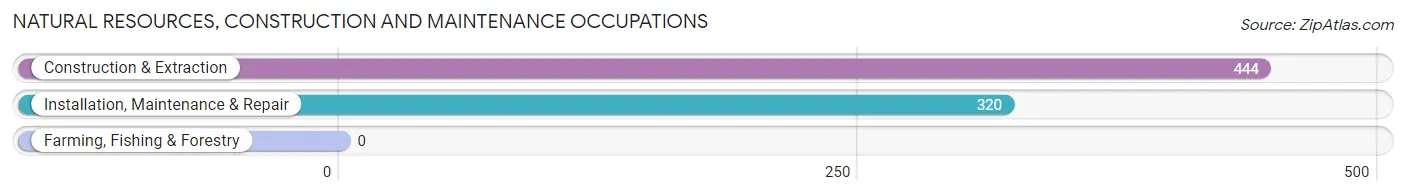
Natural Resources, Construction and Maintenance Occupations
The most common Natural Resources, Construction and Maintenance occupations in Middlesex borough are Construction & Extraction (444 | 5.8%), and Installation, Maintenance & Repair (320 | 4.2%).
Natural Resources, Construction and Maintenance Occupations by Sex
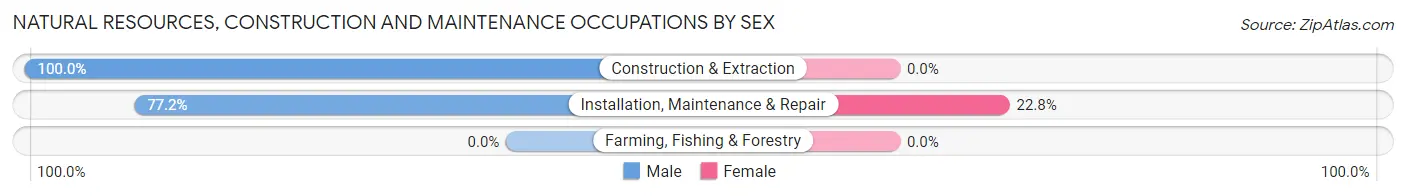
| Occupation | Male | Female |
| Farming, Fishing & Forestry | 0 (0.0%) | 0 (0.0%) |
| Construction & Extraction | 444 (100.0%) | 0 (0.0%) |
| Installation, Maintenance & Repair | 247 (77.2%) | 73 (22.8%) |
| Total (Category) | 691 (90.4%) | 73 (9.6%) |
| Total (Overall) | 3,809 (49.4%) | 3,901 (50.6%) |
Production, Transportation and Moving Occupations
The most common Production, Transportation and Moving occupations in Middlesex borough are Production (238 | 3.1%), Transportation (231 | 3.0%), and Material Moving (194 | 2.5%).
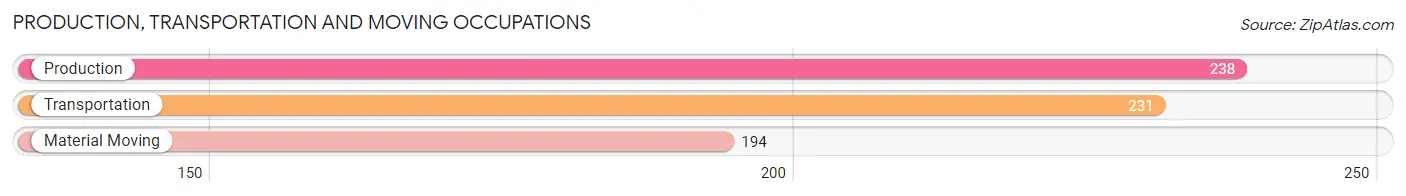
Production, Transportation and Moving Occupations by Sex
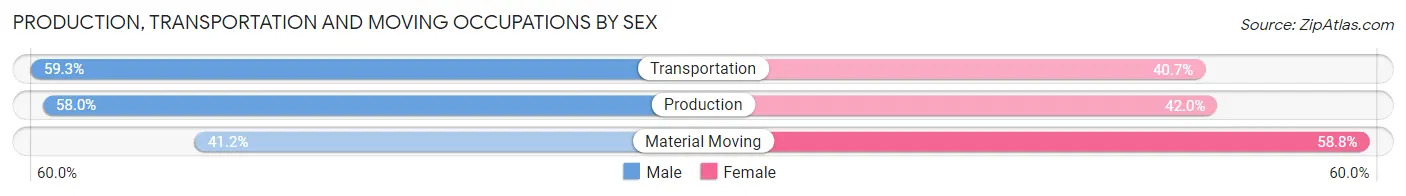
| Occupation | Male | Female |
| Production | 138 (58.0%) | 100 (42.0%) |
| Transportation | 137 (59.3%) | 94 (40.7%) |
| Material Moving | 80 (41.2%) | 114 (58.8%) |
| Total (Category) | 355 (53.5%) | 308 (46.5%) |
| Total (Overall) | 3,809 (49.4%) | 3,901 (50.6%) |
Employment Industries by Sex in Middlesex borough
Employment Industries in Middlesex borough
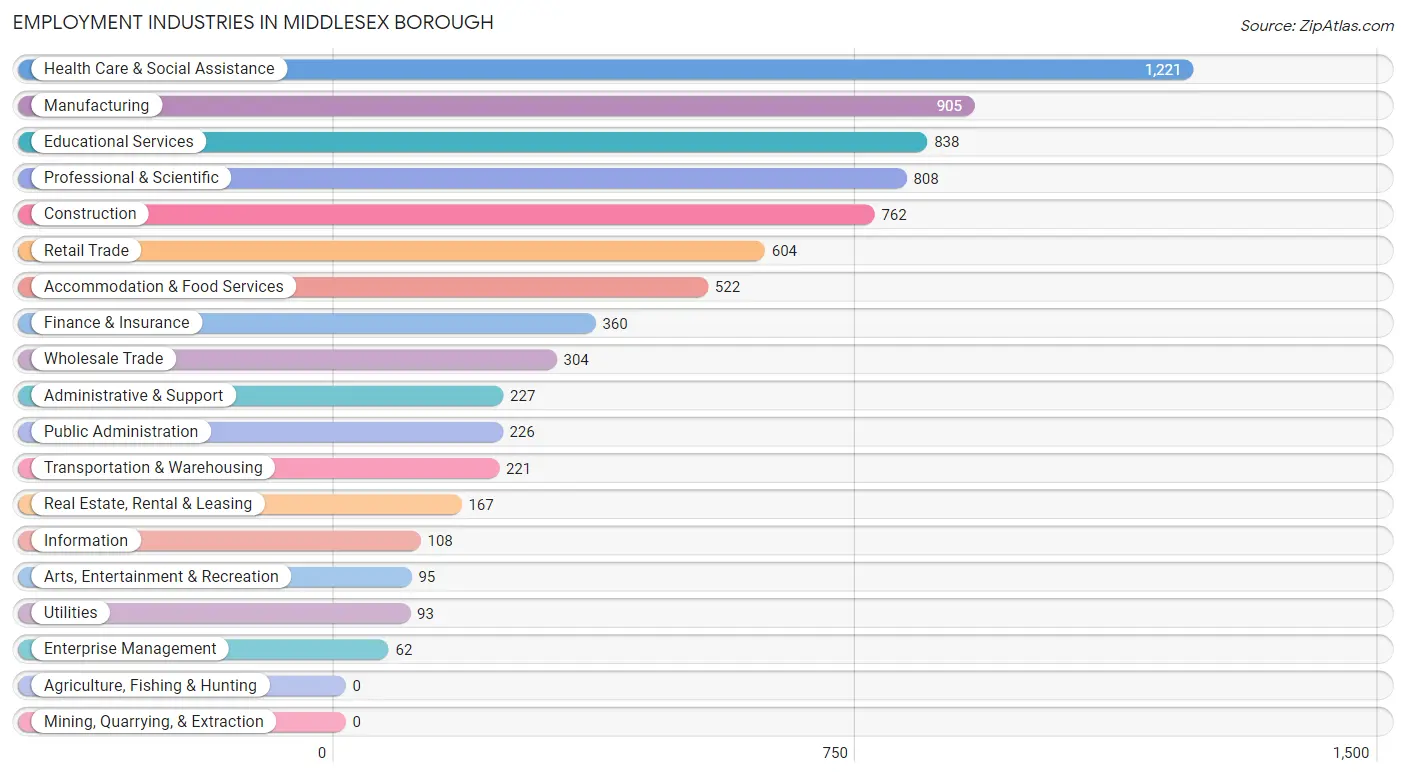
The major employment industries in Middlesex borough include Health Care & Social Assistance (1,221 | 15.8%), Manufacturing (905 | 11.7%), Educational Services (838 | 10.9%), Professional & Scientific (808 | 10.5%), and Construction (762 | 9.9%).
Employment Industries by Sex in Middlesex borough
The Middlesex borough industries that see more men than women are Arts, Entertainment & Recreation (89.5%), Utilities (85.0%), and Transportation & Warehousing (79.2%), whereas the industries that tend to have a higher number of women are Enterprise Management (90.3%), Educational Services (77.2%), and Public Administration (67.3%).
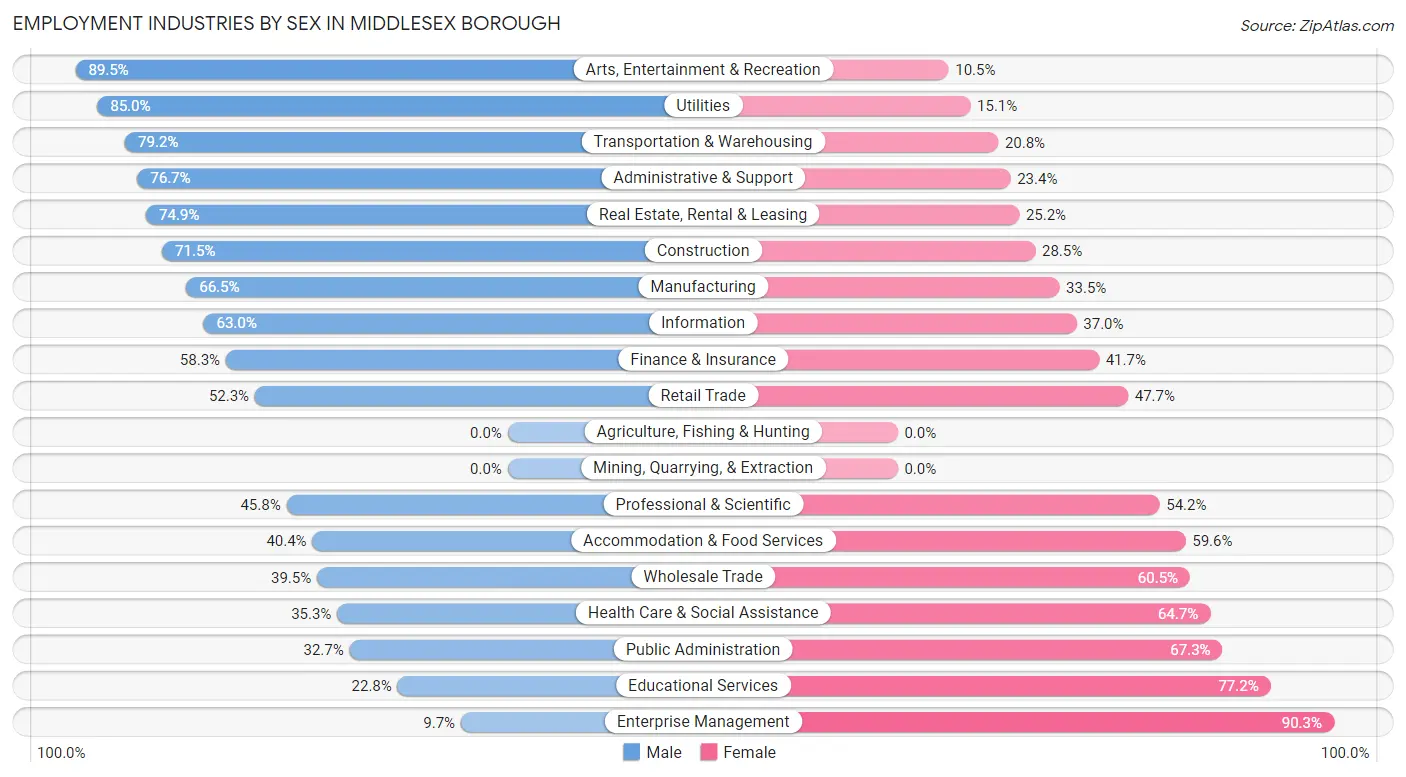
| Industry | Male | Female |
| Agriculture, Fishing & Hunting | 0 (0.0%) | 0 (0.0%) |
| Mining, Quarrying, & Extraction | 0 (0.0%) | 0 (0.0%) |
| Construction | 545 (71.5%) | 217 (28.5%) |
| Manufacturing | 602 (66.5%) | 303 (33.5%) |
| Wholesale Trade | 120 (39.5%) | 184 (60.5%) |
| Retail Trade | 316 (52.3%) | 288 (47.7%) |
| Transportation & Warehousing | 175 (79.2%) | 46 (20.8%) |
| Utilities | 79 (85.0%) | 14 (15.0%) |
| Information | 68 (63.0%) | 40 (37.0%) |
| Finance & Insurance | 210 (58.3%) | 150 (41.7%) |
| Real Estate, Rental & Leasing | 125 (74.9%) | 42 (25.2%) |
| Professional & Scientific | 370 (45.8%) | 438 (54.2%) |
| Enterprise Management | 6 (9.7%) | 56 (90.3%) |
| Administrative & Support | 174 (76.6%) | 53 (23.4%) |
| Educational Services | 191 (22.8%) | 647 (77.2%) |
| Health Care & Social Assistance | 431 (35.3%) | 790 (64.7%) |
| Arts, Entertainment & Recreation | 85 (89.5%) | 10 (10.5%) |
| Accommodation & Food Services | 211 (40.4%) | 311 (59.6%) |
| Public Administration | 74 (32.7%) | 152 (67.3%) |
| Total | 3,809 (49.4%) | 3,901 (50.6%) |
Education in Middlesex borough
School Enrollment in Middlesex borough
The most common levels of schooling among the 3,186 students in Middlesex borough are elementary school (842 | 26.4%), high school (723 | 22.7%), and middle school (633 | 19.9%).
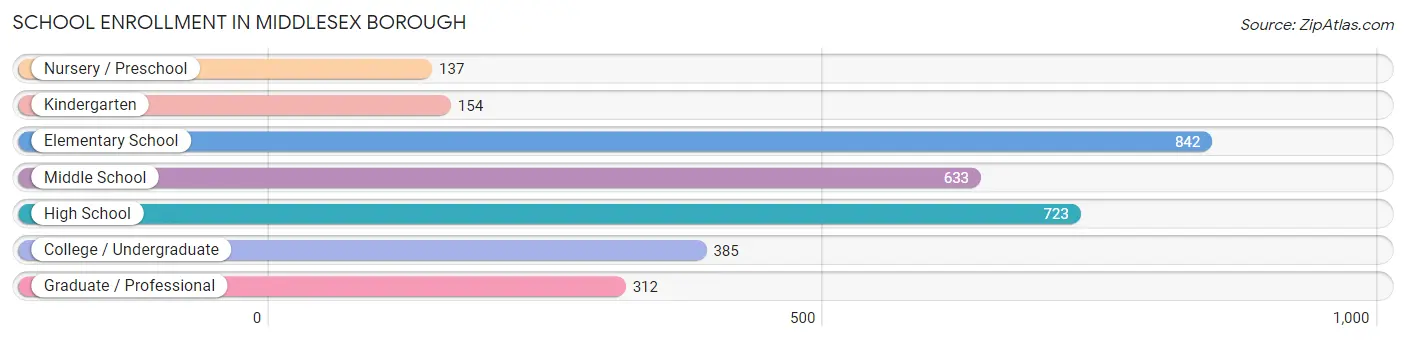
| School Level | # Students | % Students |
| Nursery / Preschool | 137 | 4.3% |
| Kindergarten | 154 | 4.8% |
| Elementary School | 842 | 26.4% |
| Middle School | 633 | 19.9% |
| High School | 723 | 22.7% |
| College / Undergraduate | 385 | 12.1% |
| Graduate / Professional | 312 | 9.8% |
| Total | 3,186 | 100.0% |
School Enrollment by Age by Funding Source in Middlesex borough
Out of a total of 3,186 students who are enrolled in schools in Middlesex borough, 322 (10.1%) attend a private institution, while the remaining 2,864 (89.9%) are enrolled in public schools. The age group of 3 to 4 year olds has the highest likelihood of being enrolled in private schools, with 75 (75.8% in the age bracket) enrolled. Conversely, the age group of 10 to 14 year olds has the lowest likelihood of being enrolled in a private school, with 917 (100.0% in the age bracket) attending a public institution.
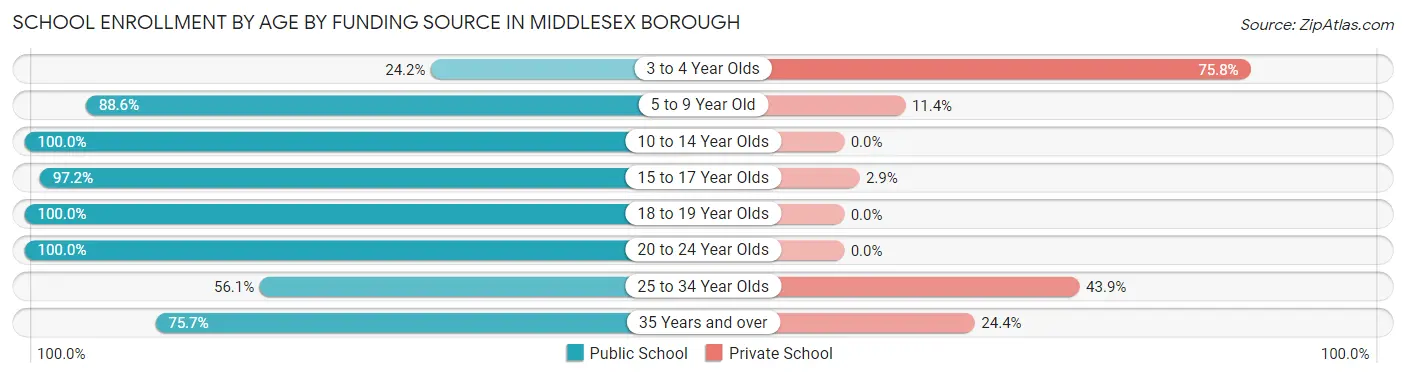
| Age Bracket | Public School | Private School |
| 3 to 4 Year Olds | 24 (24.2%) | 75 (75.8%) |
| 5 to 9 Year Old | 691 (88.6%) | 89 (11.4%) |
| 10 to 14 Year Olds | 917 (100.0%) | 0 (0.0%) |
| 15 to 17 Year Olds | 546 (97.2%) | 16 (2.9%) |
| 18 to 19 Year Olds | 167 (100.0%) | 0 (0.0%) |
| 20 to 24 Year Olds | 219 (100.0%) | 0 (0.0%) |
| 25 to 34 Year Olds | 96 (56.1%) | 75 (43.9%) |
| 35 Years and over | 205 (75.6%) | 66 (24.3%) |
| Total | 2,864 (89.9%) | 322 (10.1%) |
Educational Attainment by Field of Study in Middlesex borough
Education (765 | 19.7%), science & technology (628 | 16.2%), business (534 | 13.7%), social sciences (453 | 11.7%), and computers & mathematics (216 | 5.6%) are the most common fields of study among 3,886 individuals in Middlesex borough who have obtained a bachelor's degree or higher.
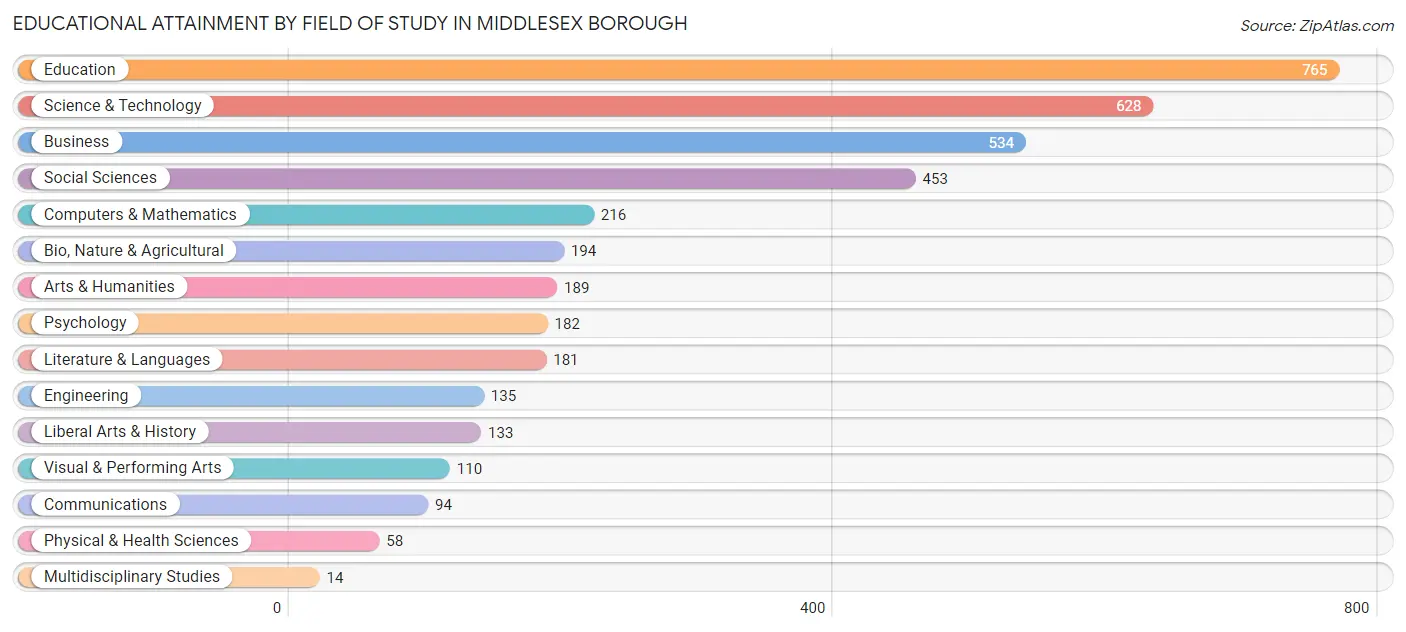
| Field of Study | # Graduates | % Graduates |
| Computers & Mathematics | 216 | 5.6% |
| Bio, Nature & Agricultural | 194 | 5.0% |
| Physical & Health Sciences | 58 | 1.5% |
| Psychology | 182 | 4.7% |
| Social Sciences | 453 | 11.7% |
| Engineering | 135 | 3.5% |
| Multidisciplinary Studies | 14 | 0.4% |
| Science & Technology | 628 | 16.2% |
| Business | 534 | 13.7% |
| Education | 765 | 19.7% |
| Literature & Languages | 181 | 4.7% |
| Liberal Arts & History | 133 | 3.4% |
| Visual & Performing Arts | 110 | 2.8% |
| Communications | 94 | 2.4% |
| Arts & Humanities | 189 | 4.9% |
| Total | 3,886 | 100.0% |
Transportation & Commute in Middlesex borough
Vehicle Availability by Sex in Middlesex borough
The most prevalent vehicle ownership categories in Middlesex borough are males with 2 vehicles (1,784, accounting for 46.7%) and females with 2 vehicles (1,399, making up 48.0%).
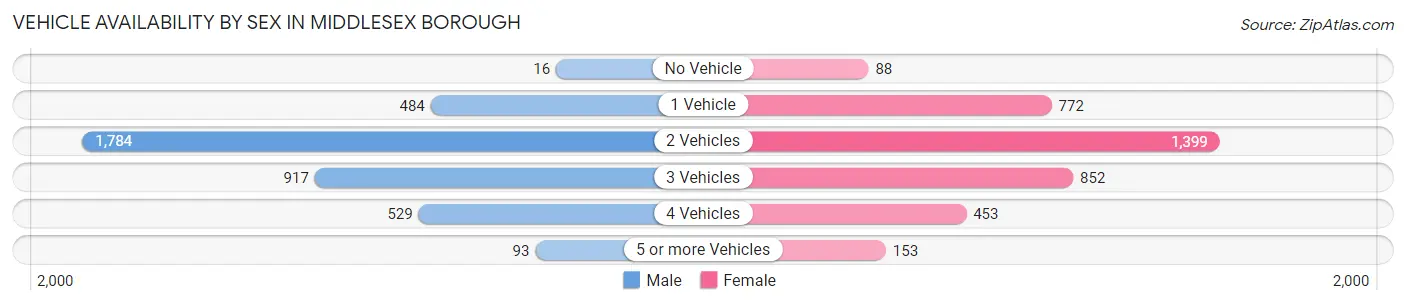
| Vehicles Available | Male | Female |
| No Vehicle | 16 (0.4%) | 88 (2.4%) |
| 1 Vehicle | 484 (12.7%) | 772 (20.8%) |
| 2 Vehicles | 1,784 (46.7%) | 1,399 (37.6%) |
| 3 Vehicles | 917 (24.0%) | 852 (22.9%) |
| 4 Vehicles | 529 (13.8%) | 453 (12.2%) |
| 5 or more Vehicles | 93 (2.4%) | 153 (4.1%) |
| Total | 3,823 (100.0%) | 3,717 (100.0%) |
Commute Time in Middlesex borough
The most frequently occuring commute durations in Middlesex borough are 15 to 19 minutes (1,200 commuters, 17.1%), 20 to 24 minutes (1,088 commuters, 15.5%), and 10 to 14 minutes (1,046 commuters, 14.9%).
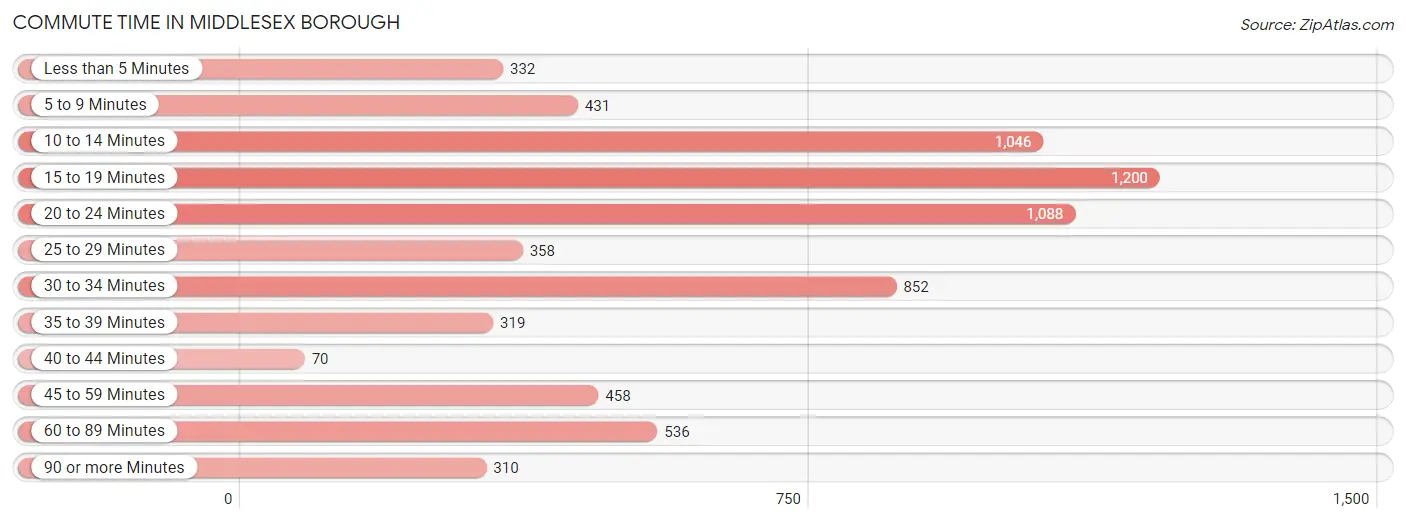
| Commute Time | # Commuters | % Commuters |
| Less than 5 Minutes | 332 | 4.7% |
| 5 to 9 Minutes | 431 | 6.2% |
| 10 to 14 Minutes | 1,046 | 14.9% |
| 15 to 19 Minutes | 1,200 | 17.1% |
| 20 to 24 Minutes | 1,088 | 15.5% |
| 25 to 29 Minutes | 358 | 5.1% |
| 30 to 34 Minutes | 852 | 12.2% |
| 35 to 39 Minutes | 319 | 4.6% |
| 40 to 44 Minutes | 70 | 1.0% |
| 45 to 59 Minutes | 458 | 6.5% |
| 60 to 89 Minutes | 536 | 7.7% |
| 90 or more Minutes | 310 | 4.4% |
Commute Time by Sex in Middlesex borough
The most common commute times in Middlesex borough are 15 to 19 minutes (612 commuters, 18.0%) for males and 15 to 19 minutes (588 commuters, 16.4%) for females.
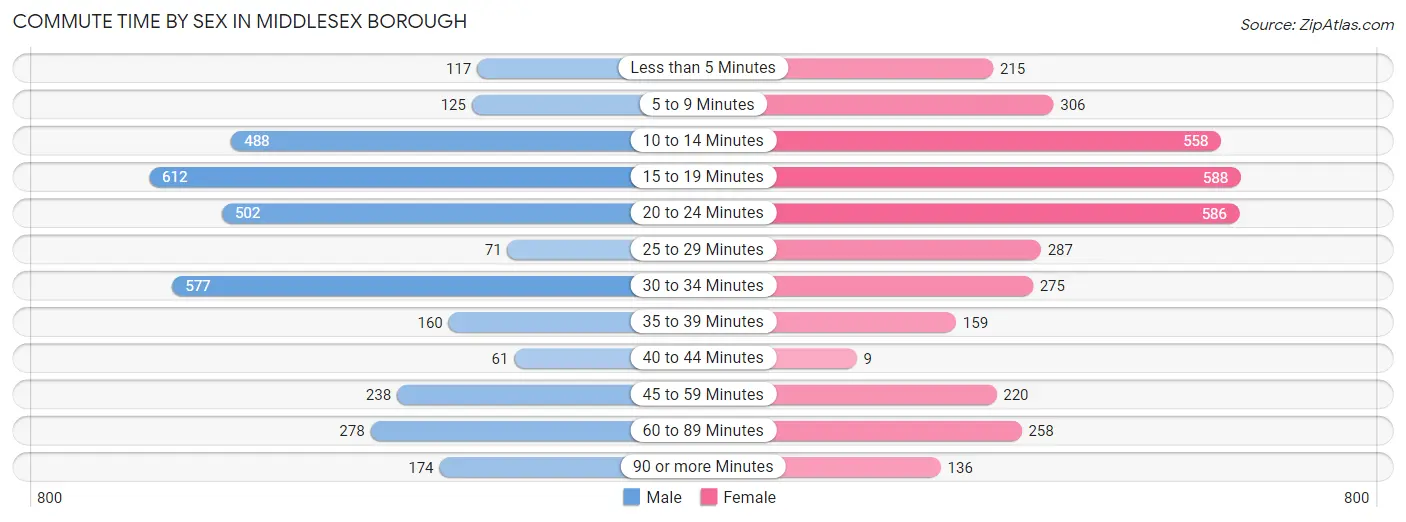
| Commute Time | Male | Female |
| Less than 5 Minutes | 117 (3.4%) | 215 (6.0%) |
| 5 to 9 Minutes | 125 (3.7%) | 306 (8.5%) |
| 10 to 14 Minutes | 488 (14.3%) | 558 (15.5%) |
| 15 to 19 Minutes | 612 (18.0%) | 588 (16.4%) |
| 20 to 24 Minutes | 502 (14.7%) | 586 (16.3%) |
| 25 to 29 Minutes | 71 (2.1%) | 287 (8.0%) |
| 30 to 34 Minutes | 577 (17.0%) | 275 (7.6%) |
| 35 to 39 Minutes | 160 (4.7%) | 159 (4.4%) |
| 40 to 44 Minutes | 61 (1.8%) | 9 (0.3%) |
| 45 to 59 Minutes | 238 (7.0%) | 220 (6.1%) |
| 60 to 89 Minutes | 278 (8.2%) | 258 (7.2%) |
| 90 or more Minutes | 174 (5.1%) | 136 (3.8%) |
Time of Departure to Work by Sex in Middlesex borough
The most frequent times of departure to work in Middlesex borough are 7:30 AM to 7:59 AM (525, 15.4%) for males and 8:30 AM to 8:59 AM (685, 19.0%) for females.
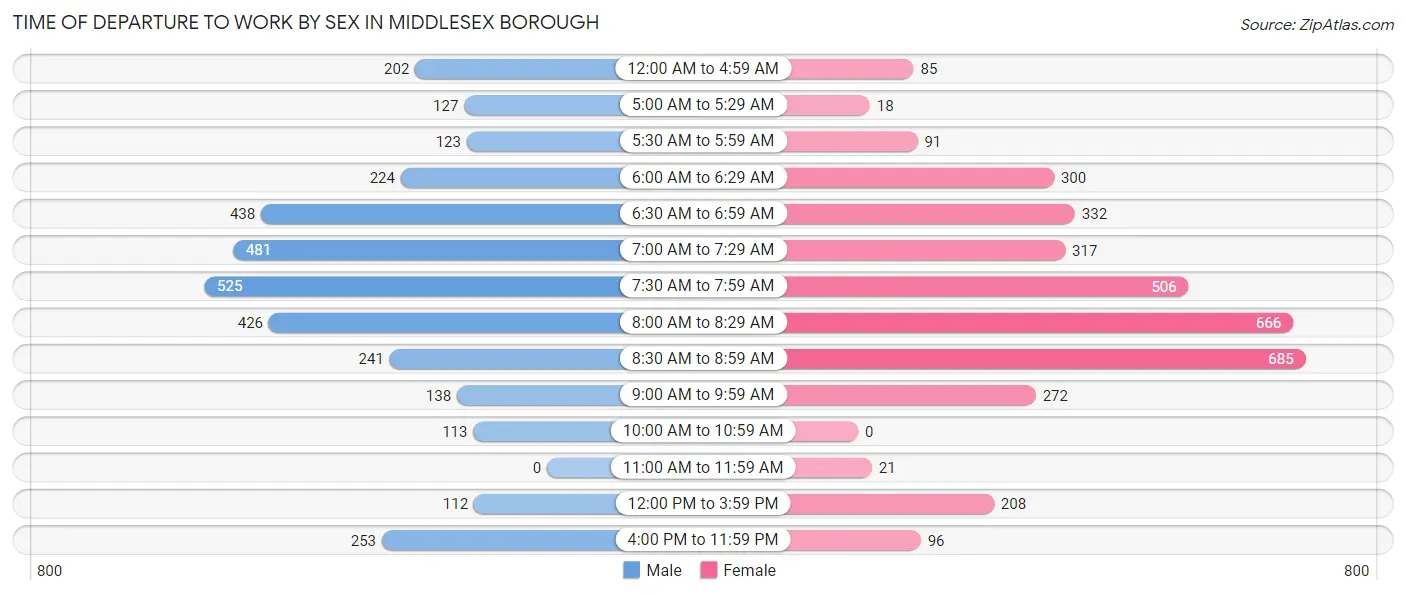
| Time of Departure | Male | Female |
| 12:00 AM to 4:59 AM | 202 (5.9%) | 85 (2.4%) |
| 5:00 AM to 5:29 AM | 127 (3.7%) | 18 (0.5%) |
| 5:30 AM to 5:59 AM | 123 (3.6%) | 91 (2.5%) |
| 6:00 AM to 6:29 AM | 224 (6.6%) | 300 (8.3%) |
| 6:30 AM to 6:59 AM | 438 (12.9%) | 332 (9.2%) |
| 7:00 AM to 7:29 AM | 481 (14.1%) | 317 (8.8%) |
| 7:30 AM to 7:59 AM | 525 (15.4%) | 506 (14.1%) |
| 8:00 AM to 8:29 AM | 426 (12.5%) | 666 (18.5%) |
| 8:30 AM to 8:59 AM | 241 (7.1%) | 685 (19.0%) |
| 9:00 AM to 9:59 AM | 138 (4.1%) | 272 (7.6%) |
| 10:00 AM to 10:59 AM | 113 (3.3%) | 0 (0.0%) |
| 11:00 AM to 11:59 AM | 0 (0.0%) | 21 (0.6%) |
| 12:00 PM to 3:59 PM | 112 (3.3%) | 208 (5.8%) |
| 4:00 PM to 11:59 PM | 253 (7.4%) | 96 (2.7%) |
| Total | 3,403 (100.0%) | 3,597 (100.0%) |
Housing Occupancy in Middlesex borough
Occupancy by Ownership in Middlesex borough
Of the total 5,580 dwellings in Middlesex borough, owner-occupied units account for 4,196 (75.2%), while renter-occupied units make up 1,384 (24.8%).
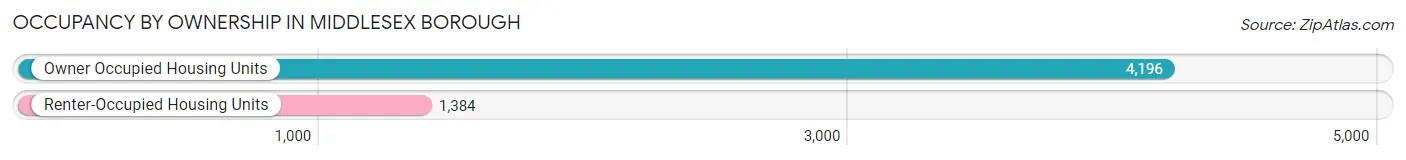
| Occupancy | # Housing Units | % Housing Units |
| Owner Occupied Housing Units | 4,196 | 75.2% |
| Renter-Occupied Housing Units | 1,384 | 24.8% |
| Total Occupied Housing Units | 5,580 | 100.0% |
Occupancy by Household Size in Middlesex borough
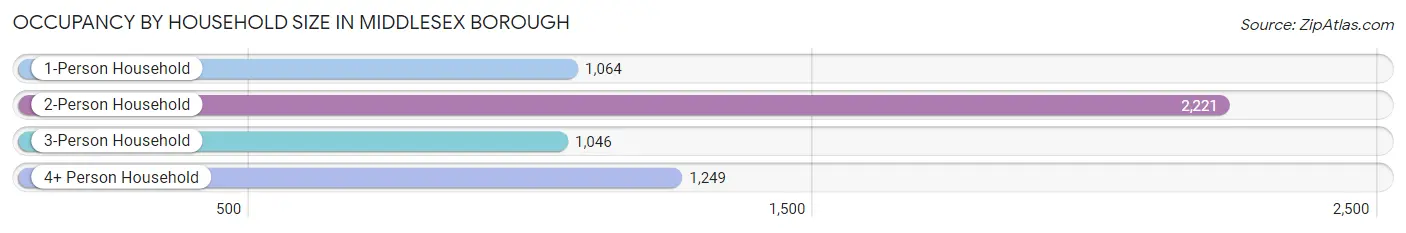
| Household Size | # Housing Units | % Housing Units |
| 1-Person Household | 1,064 | 19.1% |
| 2-Person Household | 2,221 | 39.8% |
| 3-Person Household | 1,046 | 18.8% |
| 4+ Person Household | 1,249 | 22.4% |
| Total Housing Units | 5,580 | 100.0% |
Occupancy by Ownership by Household Size in Middlesex borough
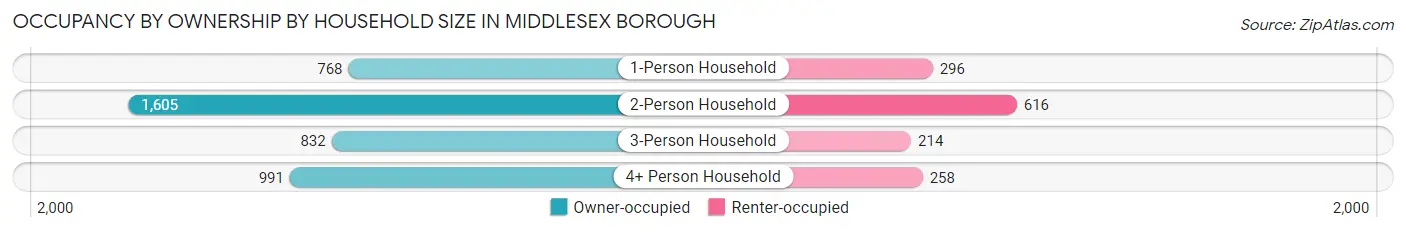
| Household Size | Owner-occupied | Renter-occupied |
| 1-Person Household | 768 (72.2%) | 296 (27.8%) |
| 2-Person Household | 1,605 (72.3%) | 616 (27.7%) |
| 3-Person Household | 832 (79.5%) | 214 (20.5%) |
| 4+ Person Household | 991 (79.3%) | 258 (20.7%) |
| Total Housing Units | 4,196 (75.2%) | 1,384 (24.8%) |
Occupancy by Educational Attainment in Middlesex borough
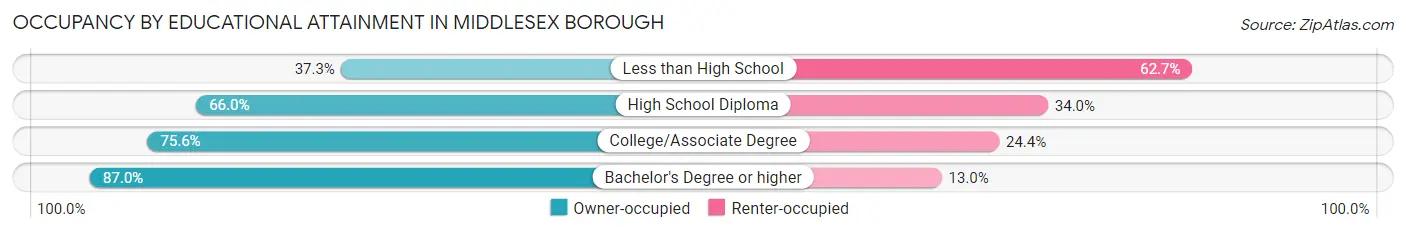
| Household Size | Owner-occupied | Renter-occupied |
| Less than High School | 109 (37.3%) | 183 (62.7%) |
| High School Diploma | 971 (66.0%) | 501 (34.0%) |
| College/Associate Degree | 1,363 (75.6%) | 439 (24.4%) |
| Bachelor's Degree or higher | 1,753 (87.0%) | 261 (13.0%) |
Occupancy by Age of Householder in Middlesex borough
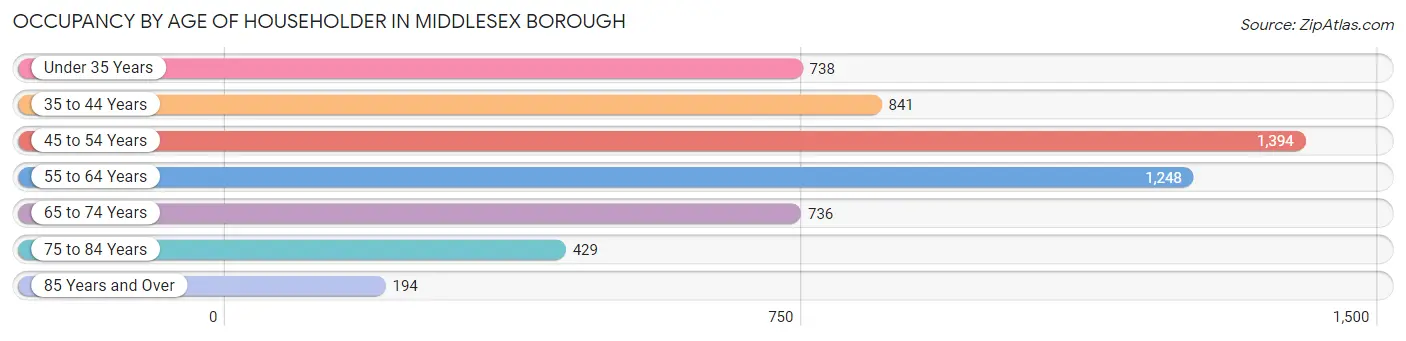
| Age Bracket | # Households | % Households |
| Under 35 Years | 738 | 13.2% |
| 35 to 44 Years | 841 | 15.1% |
| 45 to 54 Years | 1,394 | 25.0% |
| 55 to 64 Years | 1,248 | 22.4% |
| 65 to 74 Years | 736 | 13.2% |
| 75 to 84 Years | 429 | 7.7% |
| 85 Years and Over | 194 | 3.5% |
| Total | 5,580 | 100.0% |
Housing Finances in Middlesex borough
Median Income by Occupancy in Middlesex borough
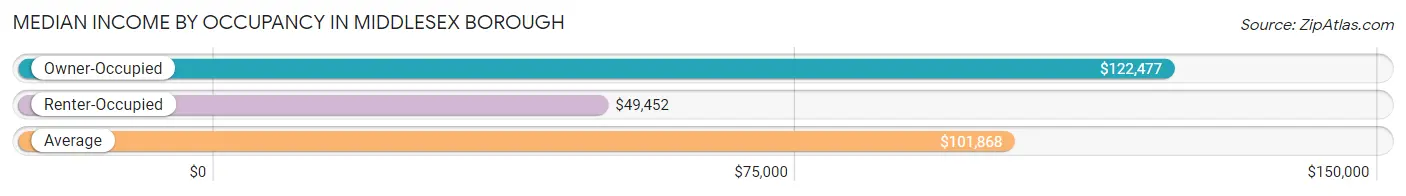
| Occupancy Type | # Households | Median Income |
| Owner-Occupied | 4,196 (75.2%) | $122,477 |
| Renter-Occupied | 1,384 (24.8%) | $49,452 |
| Average | 5,580 (100.0%) | $101,868 |
Occupancy by Householder Income Bracket in Middlesex borough
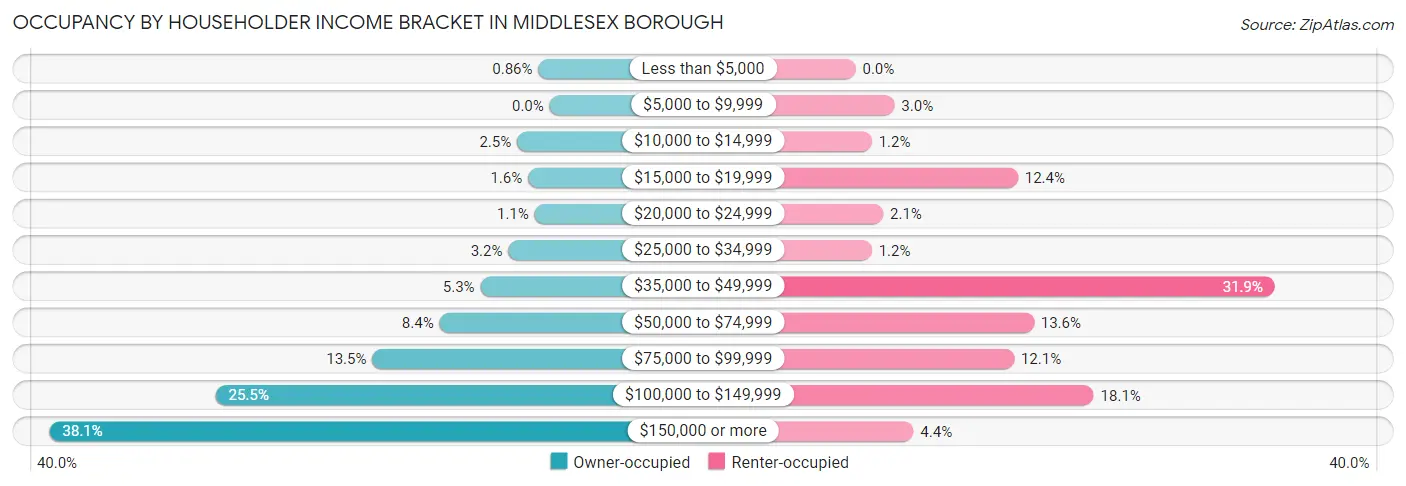
| Income Bracket | Owner-occupied | Renter-occupied |
| Less than $5,000 | 36 (0.9%) | 0 (0.0%) |
| $5,000 to $9,999 | 0 (0.0%) | 41 (3.0%) |
| $10,000 to $14,999 | 104 (2.5%) | 17 (1.2%) |
| $15,000 to $19,999 | 69 (1.6%) | 171 (12.4%) |
| $20,000 to $24,999 | 48 (1.1%) | 29 (2.1%) |
| $25,000 to $34,999 | 132 (3.2%) | 17 (1.2%) |
| $35,000 to $49,999 | 221 (5.3%) | 442 (31.9%) |
| $50,000 to $74,999 | 352 (8.4%) | 188 (13.6%) |
| $75,000 to $99,999 | 567 (13.5%) | 167 (12.1%) |
| $100,000 to $149,999 | 1,068 (25.5%) | 251 (18.1%) |
| $150,000 or more | 1,599 (38.1%) | 61 (4.4%) |
| Total | 4,196 (100.0%) | 1,384 (100.0%) |
Monthly Housing Cost Tiers in Middlesex borough
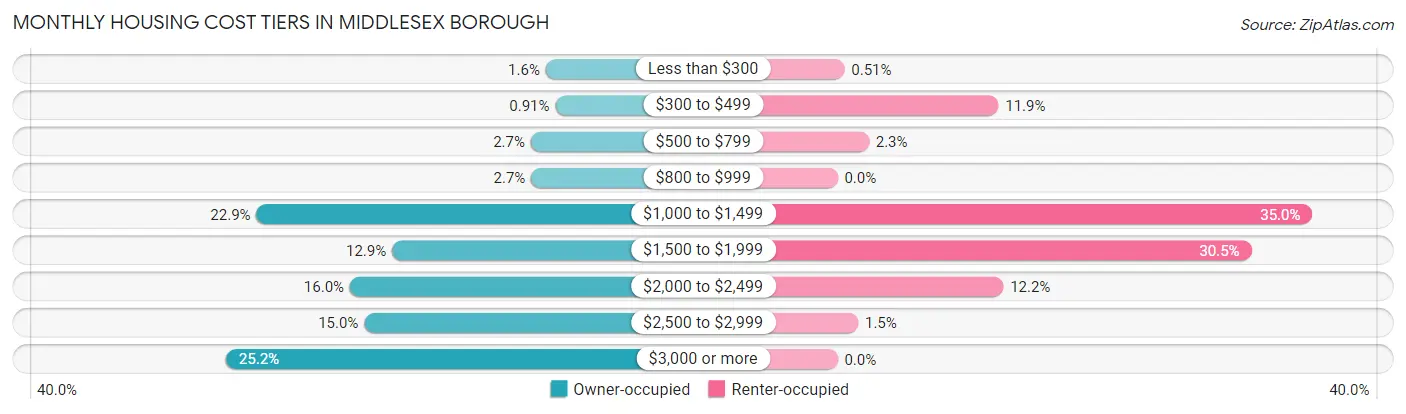
| Monthly Cost | Owner-occupied | Renter-occupied |
| Less than $300 | 68 (1.6%) | 7 (0.5%) |
| $300 to $499 | 38 (0.9%) | 164 (11.8%) |
| $500 to $799 | 114 (2.7%) | 32 (2.3%) |
| $800 to $999 | 113 (2.7%) | 0 (0.0%) |
| $1,000 to $1,499 | 962 (22.9%) | 484 (35.0%) |
| $1,500 to $1,999 | 543 (12.9%) | 422 (30.5%) |
| $2,000 to $2,499 | 673 (16.0%) | 169 (12.2%) |
| $2,500 to $2,999 | 629 (15.0%) | 21 (1.5%) |
| $3,000 or more | 1,056 (25.2%) | 0 (0.0%) |
| Total | 4,196 (100.0%) | 1,384 (100.0%) |
Physical Housing Characteristics in Middlesex borough
Housing Structures in Middlesex borough
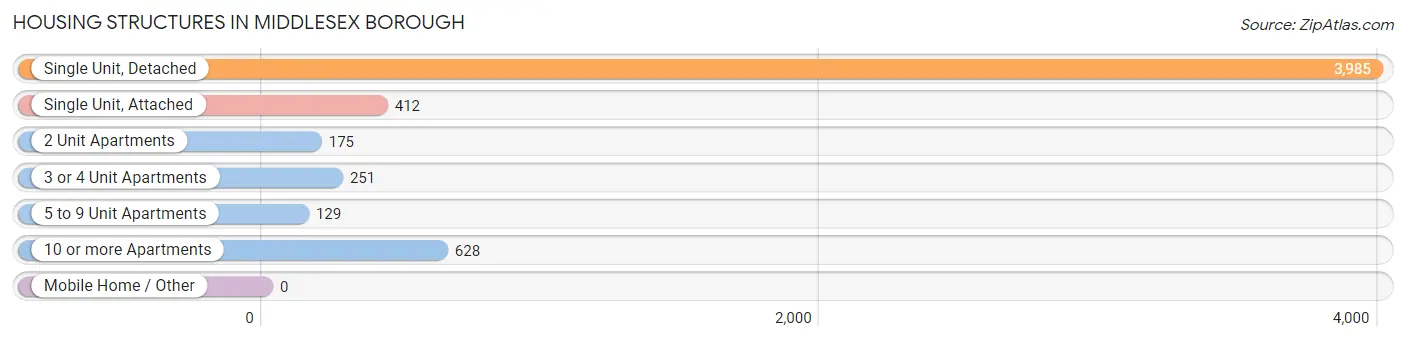
| Structure Type | # Housing Units | % Housing Units |
| Single Unit, Detached | 3,985 | 71.4% |
| Single Unit, Attached | 412 | 7.4% |
| 2 Unit Apartments | 175 | 3.1% |
| 3 or 4 Unit Apartments | 251 | 4.5% |
| 5 to 9 Unit Apartments | 129 | 2.3% |
| 10 or more Apartments | 628 | 11.3% |
| Mobile Home / Other | 0 | 0.0% |
| Total | 5,580 | 100.0% |
Housing Structures by Occupancy in Middlesex borough
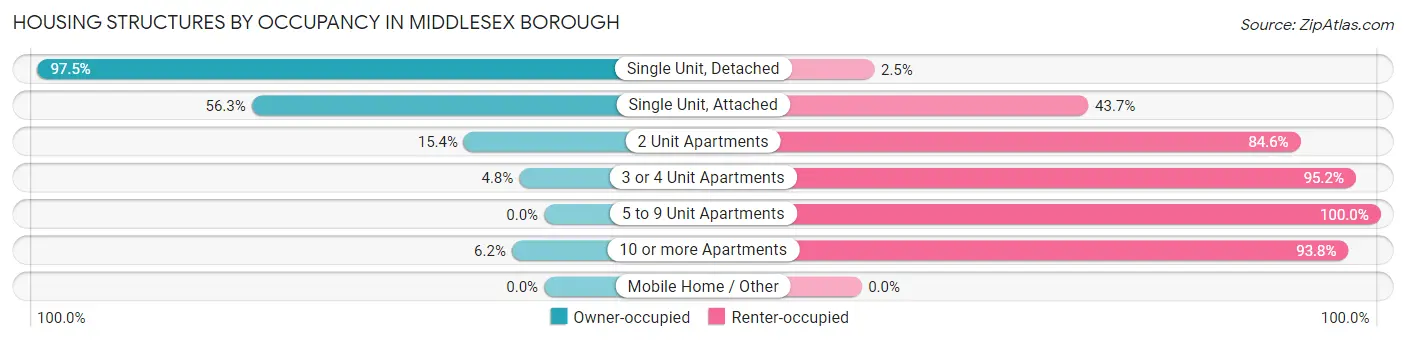
| Structure Type | Owner-occupied | Renter-occupied |
| Single Unit, Detached | 3,886 (97.5%) | 99 (2.5%) |
| Single Unit, Attached | 232 (56.3%) | 180 (43.7%) |
| 2 Unit Apartments | 27 (15.4%) | 148 (84.6%) |
| 3 or 4 Unit Apartments | 12 (4.8%) | 239 (95.2%) |
| 5 to 9 Unit Apartments | 0 (0.0%) | 129 (100.0%) |
| 10 or more Apartments | 39 (6.2%) | 589 (93.8%) |
| Mobile Home / Other | 0 (0.0%) | 0 (0.0%) |
| Total | 4,196 (75.2%) | 1,384 (24.8%) |
Housing Structures by Number of Rooms in Middlesex borough
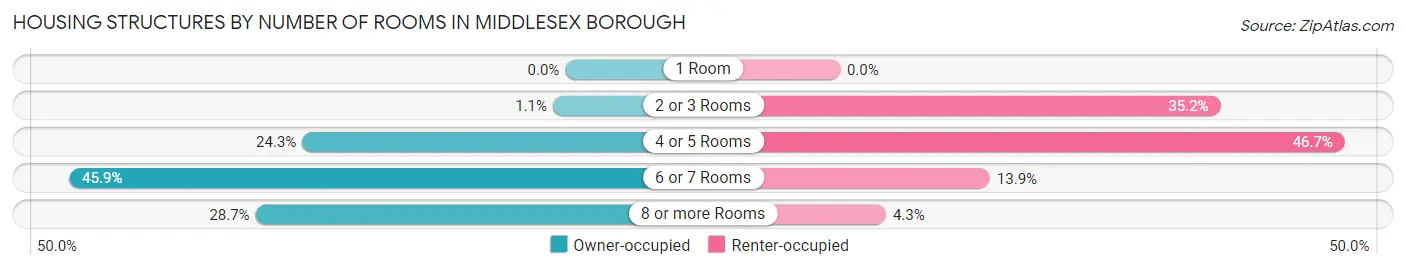
| Number of Rooms | Owner-occupied | Renter-occupied |
| 1 Room | 0 (0.0%) | 0 (0.0%) |
| 2 or 3 Rooms | 48 (1.1%) | 487 (35.2%) |
| 4 or 5 Rooms | 1,021 (24.3%) | 646 (46.7%) |
| 6 or 7 Rooms | 1,925 (45.9%) | 192 (13.9%) |
| 8 or more Rooms | 1,202 (28.6%) | 59 (4.3%) |
| Total | 4,196 (100.0%) | 1,384 (100.0%) |
Housing Structure by Heating Type in Middlesex borough
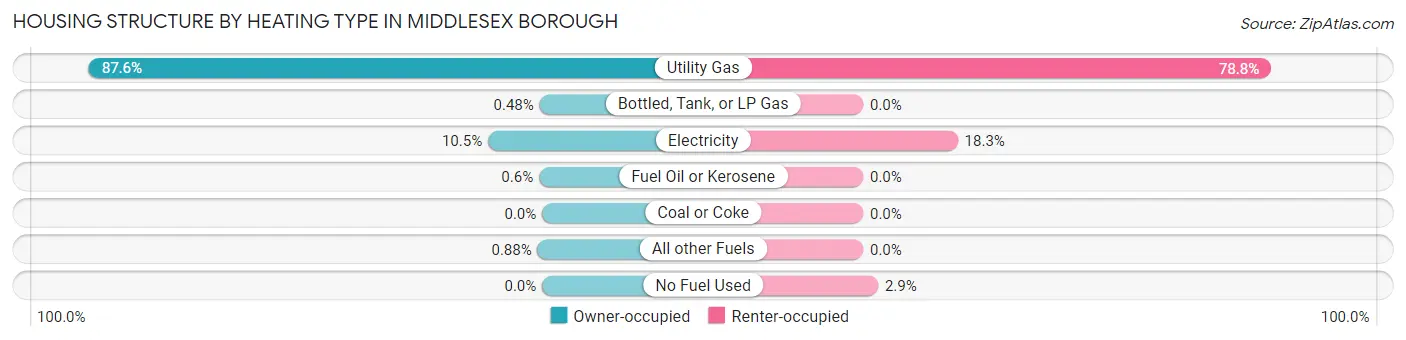
| Heating Type | Owner-occupied | Renter-occupied |
| Utility Gas | 3,675 (87.6%) | 1,091 (78.8%) |
| Bottled, Tank, or LP Gas | 20 (0.5%) | 0 (0.0%) |
| Electricity | 439 (10.5%) | 253 (18.3%) |
| Fuel Oil or Kerosene | 25 (0.6%) | 0 (0.0%) |
| Coal or Coke | 0 (0.0%) | 0 (0.0%) |
| All other Fuels | 37 (0.9%) | 0 (0.0%) |
| No Fuel Used | 0 (0.0%) | 40 (2.9%) |
| Total | 4,196 (100.0%) | 1,384 (100.0%) |
Household Vehicle Usage in Middlesex borough
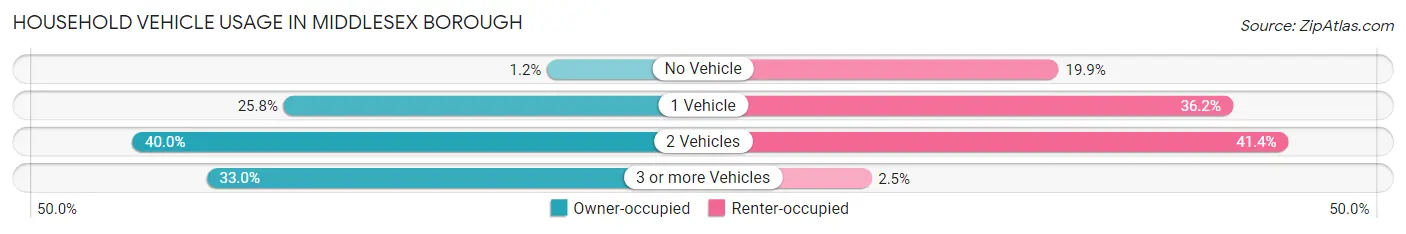
| Vehicles per Household | Owner-occupied | Renter-occupied |
| No Vehicle | 51 (1.2%) | 276 (19.9%) |
| 1 Vehicle | 1,083 (25.8%) | 501 (36.2%) |
| 2 Vehicles | 1,677 (40.0%) | 573 (41.4%) |
| 3 or more Vehicles | 1,385 (33.0%) | 34 (2.5%) |
| Total | 4,196 (100.0%) | 1,384 (100.0%) |
Real Estate & Mortgages in Middlesex borough
Real Estate and Mortgage Overview in Middlesex borough
| Characteristic | Without Mortgage | With Mortgage |
| Housing Units | 1,260 | 2,936 |
| Median Property Value | $388,100 | $391,200 |
| Median Household Income | $113,676 | $1,096 |
| Monthly Housing Costs | $1,201 | $1,045 |
| Real Estate Taxes | $10,001 | $0 |
Property Value by Mortgage Status in Middlesex borough
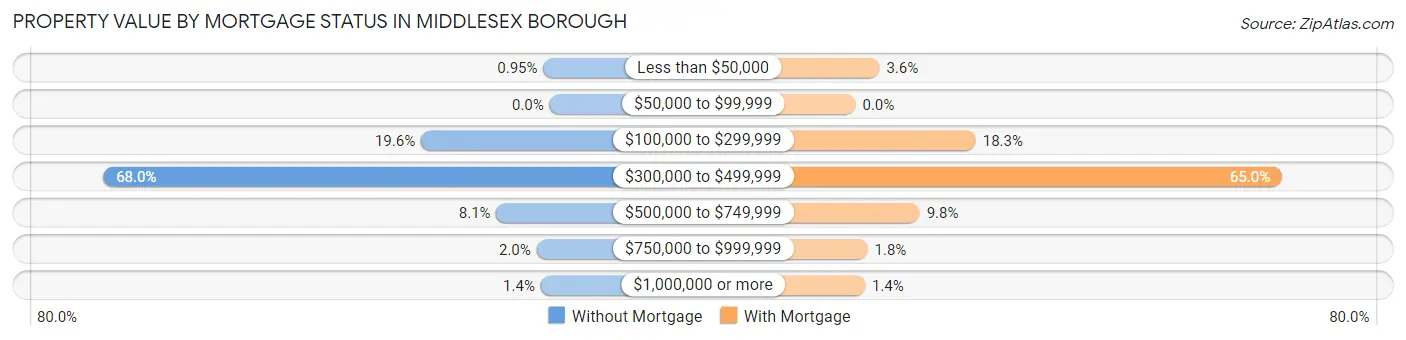
| Property Value | Without Mortgage | With Mortgage |
| Less than $50,000 | 12 (0.9%) | 107 (3.6%) |
| $50,000 to $99,999 | 0 (0.0%) | 0 (0.0%) |
| $100,000 to $299,999 | 247 (19.6%) | 538 (18.3%) |
| $300,000 to $499,999 | 857 (68.0%) | 1,908 (65.0%) |
| $500,000 to $749,999 | 102 (8.1%) | 287 (9.8%) |
| $750,000 to $999,999 | 25 (2.0%) | 54 (1.8%) |
| $1,000,000 or more | 17 (1.3%) | 42 (1.4%) |
| Total | 1,260 (100.0%) | 2,936 (100.0%) |
Household Income by Mortgage Status in Middlesex borough
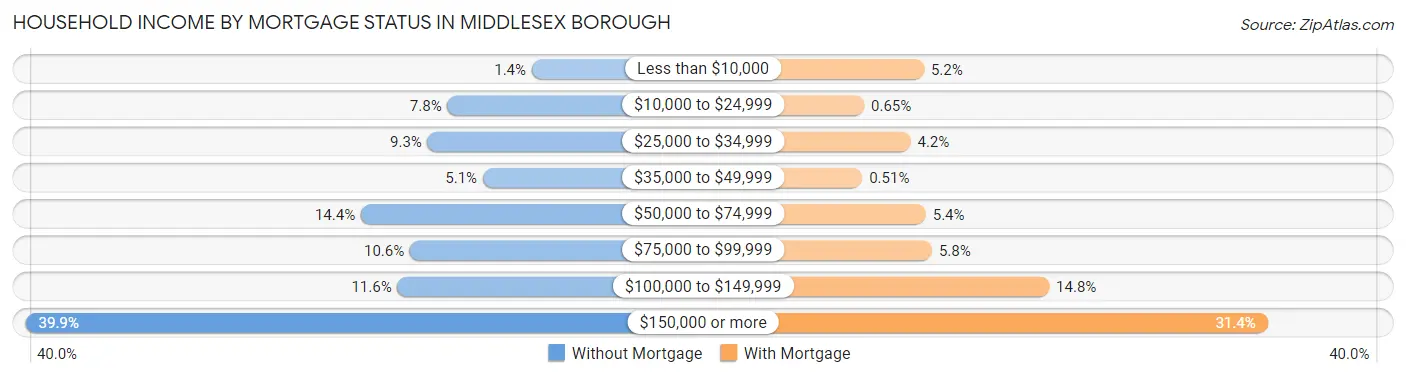
| Household Income | Without Mortgage | With Mortgage |
| Less than $10,000 | 17 (1.3%) | 153 (5.2%) |
| $10,000 to $24,999 | 98 (7.8%) | 19 (0.6%) |
| $25,000 to $34,999 | 117 (9.3%) | 123 (4.2%) |
| $35,000 to $49,999 | 64 (5.1%) | 15 (0.5%) |
| $50,000 to $74,999 | 181 (14.4%) | 157 (5.3%) |
| $75,000 to $99,999 | 134 (10.6%) | 171 (5.8%) |
| $100,000 to $149,999 | 146 (11.6%) | 433 (14.7%) |
| $150,000 or more | 503 (39.9%) | 922 (31.4%) |
| Total | 1,260 (100.0%) | 2,936 (100.0%) |
Property Value to Household Income Ratio in Middlesex borough
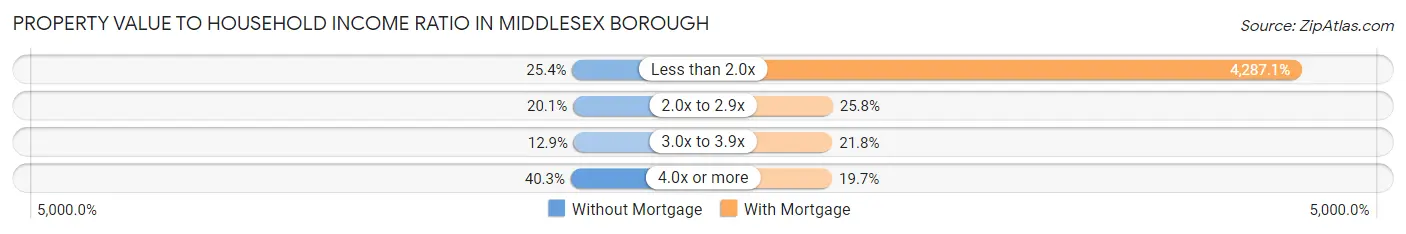
| Value-to-Income Ratio | Without Mortgage | With Mortgage |
| Less than 2.0x | 320 (25.4%) | 125,870 (4,287.1%) |
| 2.0x to 2.9x | 253 (20.1%) | 756 (25.8%) |
| 3.0x to 3.9x | 162 (12.9%) | 639 (21.8%) |
| 4.0x or more | 508 (40.3%) | 579 (19.7%) |
| Total | 1,260 (100.0%) | 2,936 (100.0%) |
Real Estate Taxes by Mortgage Status in Middlesex borough
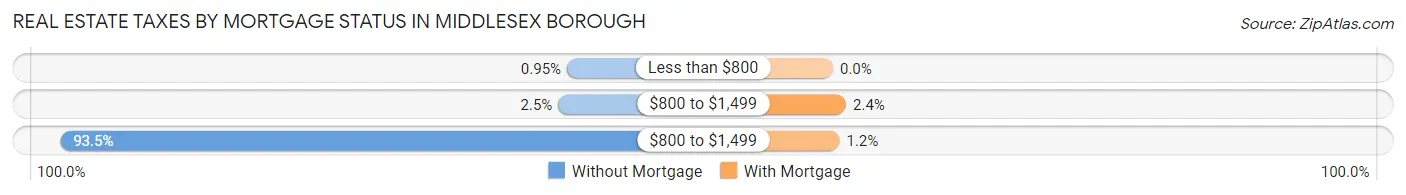
| Property Taxes | Without Mortgage | With Mortgage |
| Less than $800 | 12 (0.9%) | 0 (0.0%) |
| $800 to $1,499 | 32 (2.5%) | 70 (2.4%) |
| $800 to $1,499 | 1,178 (93.5%) | 35 (1.2%) |
| Total | 1,260 (100.0%) | 2,936 (100.0%) |
Health & Disability in Middlesex borough
Health Insurance Coverage by Age in Middlesex borough
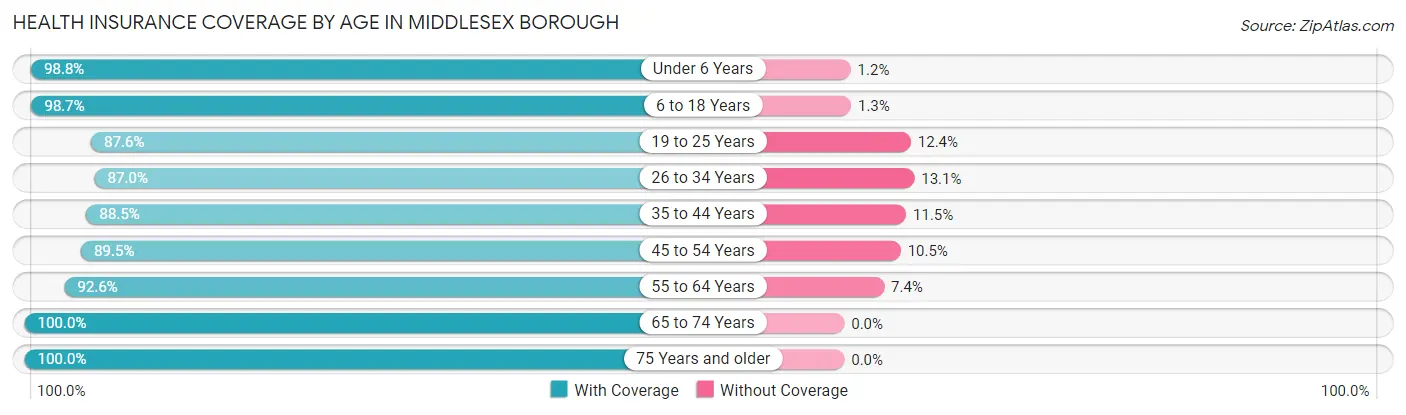
| Age Bracket | With Coverage | Without Coverage |
| Under 6 Years | 829 (98.8%) | 10 (1.2%) |
| 6 to 18 Years | 2,271 (98.7%) | 29 (1.3%) |
| 19 to 25 Years | 734 (87.6%) | 104 (12.4%) |
| 26 to 34 Years | 1,433 (87.0%) | 215 (13.1%) |
| 35 to 44 Years | 1,466 (88.5%) | 191 (11.5%) |
| 45 to 54 Years | 2,109 (89.5%) | 248 (10.5%) |
| 55 to 64 Years | 2,117 (92.6%) | 170 (7.4%) |
| 65 to 74 Years | 1,306 (100.0%) | 0 (0.0%) |
| 75 Years and older | 1,244 (100.0%) | 0 (0.0%) |
| Total | 13,509 (93.3%) | 967 (6.7%) |
Health Insurance Coverage by Citizenship Status in Middlesex borough
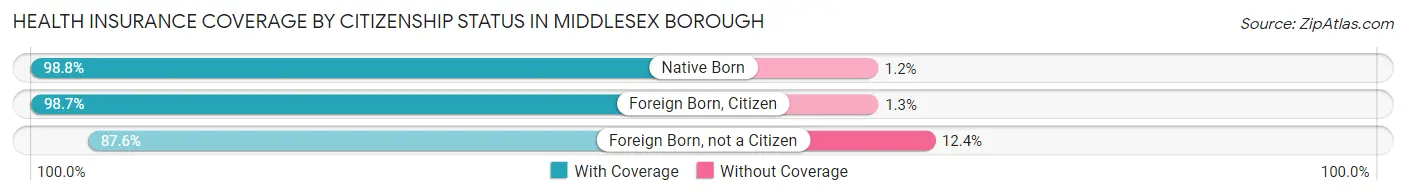
| Citizenship Status | With Coverage | Without Coverage |
| Native Born | 829 (98.8%) | 10 (1.2%) |
| Foreign Born, Citizen | 2,271 (98.7%) | 29 (1.3%) |
| Foreign Born, not a Citizen | 734 (87.6%) | 104 (12.4%) |
Health Insurance Coverage by Household Income in Middlesex borough
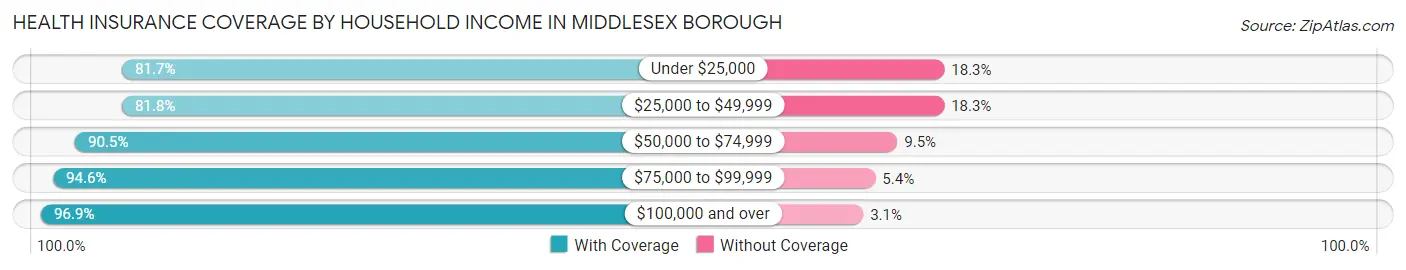
| Household Income | With Coverage | Without Coverage |
| Under $25,000 | 733 (81.7%) | 164 (18.3%) |
| $25,000 to $49,999 | 1,429 (81.8%) | 319 (18.2%) |
| $50,000 to $74,999 | 1,185 (90.5%) | 124 (9.5%) |
| $75,000 to $99,999 | 1,465 (94.6%) | 83 (5.4%) |
| $100,000 and over | 8,678 (96.9%) | 276 (3.1%) |
Public vs Private Health Insurance Coverage by Age in Middlesex borough
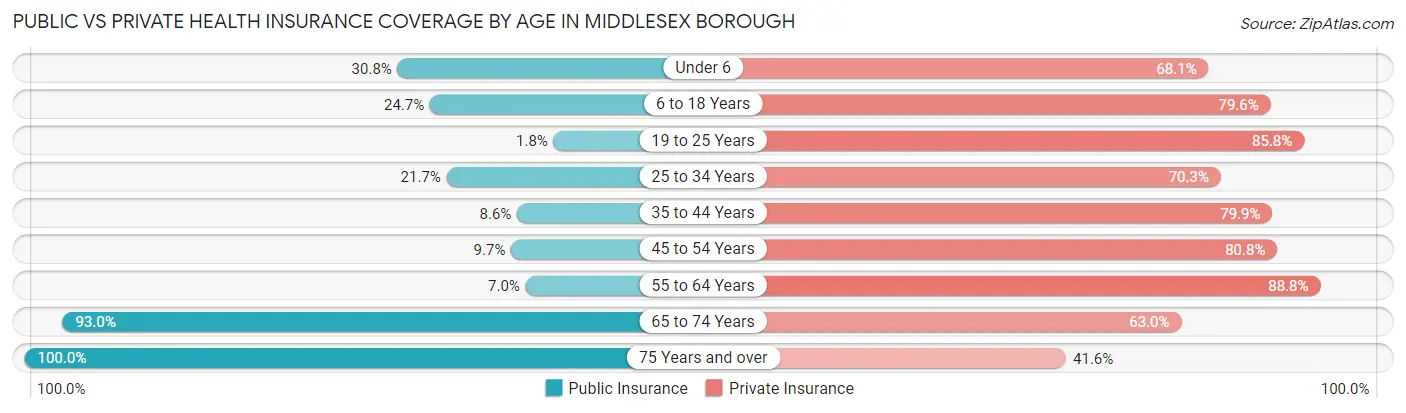
| Age Bracket | Public Insurance | Private Insurance |
| Under 6 | 258 (30.7%) | 571 (68.1%) |
| 6 to 18 Years | 569 (24.7%) | 1,830 (79.6%) |
| 19 to 25 Years | 15 (1.8%) | 719 (85.8%) |
| 25 to 34 Years | 357 (21.7%) | 1,159 (70.3%) |
| 35 to 44 Years | 142 (8.6%) | 1,324 (79.9%) |
| 45 to 54 Years | 228 (9.7%) | 1,905 (80.8%) |
| 55 to 64 Years | 160 (7.0%) | 2,031 (88.8%) |
| 65 to 74 Years | 1,214 (93.0%) | 823 (63.0%) |
| 75 Years and over | 1,244 (100.0%) | 518 (41.6%) |
| Total | 4,187 (28.9%) | 10,880 (75.2%) |
Disability Status by Sex by Age in Middlesex borough
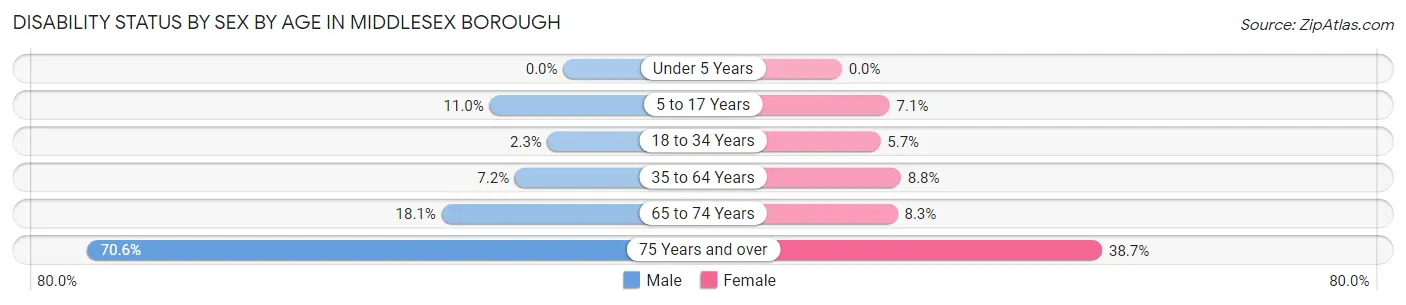
| Age Bracket | Male | Female |
| Under 5 Years | 0 (0.0%) | 0 (0.0%) |
| 5 to 17 Years | 104 (11.0%) | 95 (7.1%) |
| 18 to 34 Years | 31 (2.3%) | 74 (5.7%) |
| 35 to 64 Years | 218 (7.2%) | 286 (8.8%) |
| 65 to 74 Years | 116 (18.1%) | 55 (8.3%) |
| 75 Years and over | 356 (70.6%) | 286 (38.7%) |
Disability Class by Sex by Age in Middlesex borough
Disability Class: Hearing Difficulty
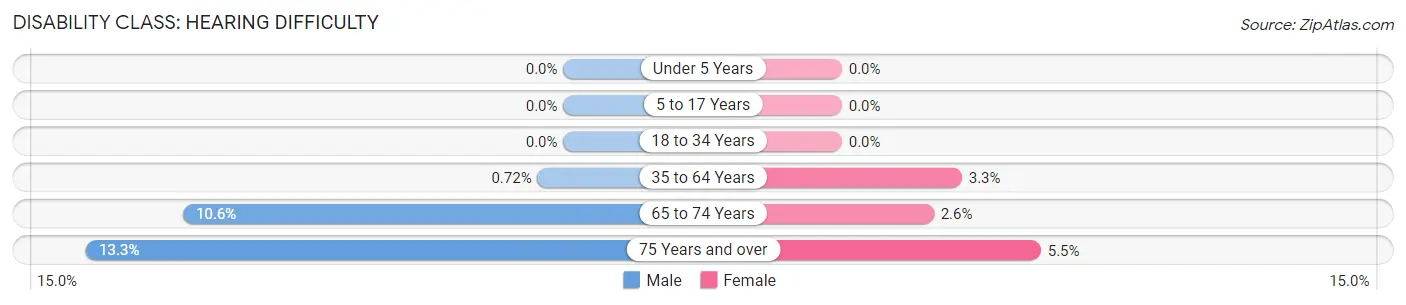
| Age Bracket | Male | Female |
| Under 5 Years | 0 (0.0%) | 0 (0.0%) |
| 5 to 17 Years | 0 (0.0%) | 0 (0.0%) |
| 18 to 34 Years | 0 (0.0%) | 0 (0.0%) |
| 35 to 64 Years | 22 (0.7%) | 109 (3.3%) |
| 65 to 74 Years | 68 (10.6%) | 17 (2.6%) |
| 75 Years and over | 67 (13.3%) | 41 (5.5%) |
Disability Class: Vision Difficulty
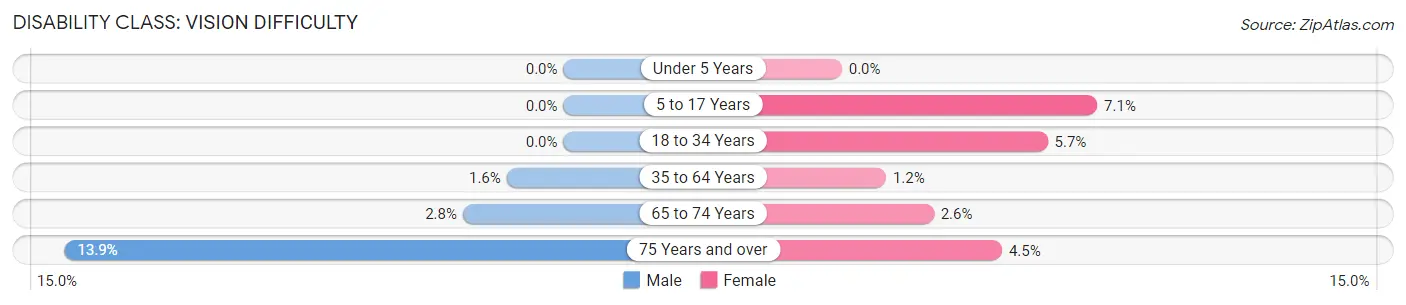
| Age Bracket | Male | Female |
| Under 5 Years | 0 (0.0%) | 0 (0.0%) |
| 5 to 17 Years | 0 (0.0%) | 95 (7.1%) |
| 18 to 34 Years | 0 (0.0%) | 74 (5.7%) |
| 35 to 64 Years | 48 (1.6%) | 40 (1.2%) |
| 65 to 74 Years | 18 (2.8%) | 17 (2.6%) |
| 75 Years and over | 70 (13.9%) | 33 (4.5%) |
Disability Class: Cognitive Difficulty
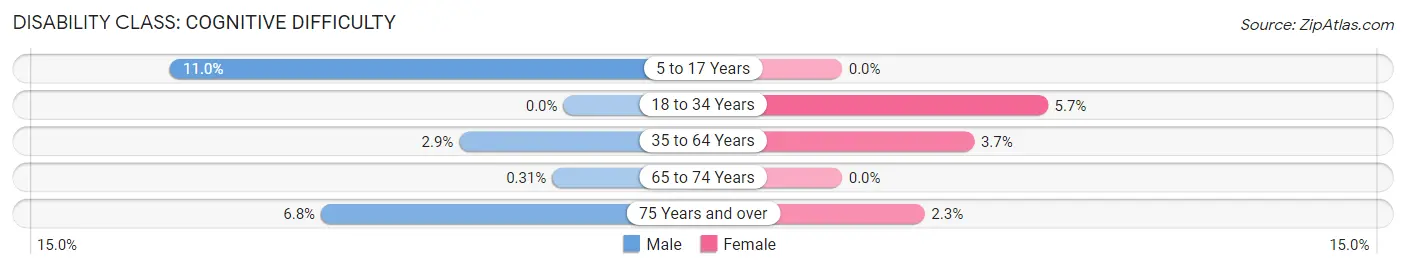
| Age Bracket | Male | Female |
| 5 to 17 Years | 104 (11.0%) | 0 (0.0%) |
| 18 to 34 Years | 0 (0.0%) | 74 (5.7%) |
| 35 to 64 Years | 88 (2.9%) | 120 (3.7%) |
| 65 to 74 Years | 2 (0.3%) | 0 (0.0%) |
| 75 Years and over | 34 (6.8%) | 17 (2.3%) |
Disability Class: Ambulatory Difficulty
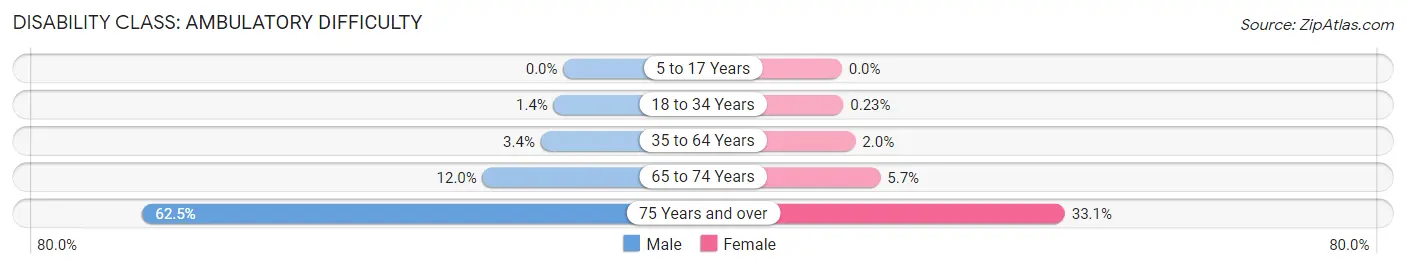
| Age Bracket | Male | Female |
| 5 to 17 Years | 0 (0.0%) | 0 (0.0%) |
| 18 to 34 Years | 19 (1.4%) | 3 (0.2%) |
| 35 to 64 Years | 102 (3.4%) | 66 (2.0%) |
| 65 to 74 Years | 77 (12.0%) | 38 (5.7%) |
| 75 Years and over | 315 (62.5%) | 245 (33.1%) |
Disability Class: Self-Care Difficulty
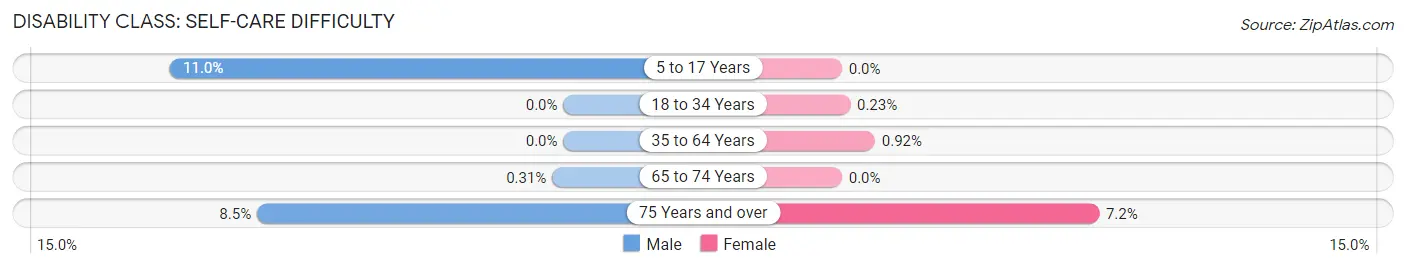
| Age Bracket | Male | Female |
| 5 to 17 Years | 104 (11.0%) | 0 (0.0%) |
| 18 to 34 Years | 0 (0.0%) | 3 (0.2%) |
| 35 to 64 Years | 0 (0.0%) | 30 (0.9%) |
| 65 to 74 Years | 2 (0.3%) | 0 (0.0%) |
| 75 Years and over | 43 (8.5%) | 53 (7.2%) |
Technology Access in Middlesex borough
Computing Device Access in Middlesex borough
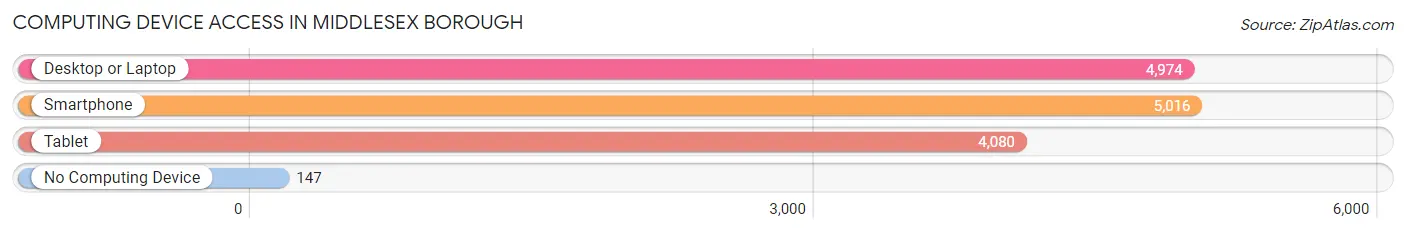
| Device Type | # Households | % Households |
| Desktop or Laptop | 4,974 | 89.1% |
| Smartphone | 5,016 | 89.9% |
| Tablet | 4,080 | 73.1% |
| No Computing Device | 147 | 2.6% |
| Total | 5,580 | 100.0% |
Internet Access in Middlesex borough
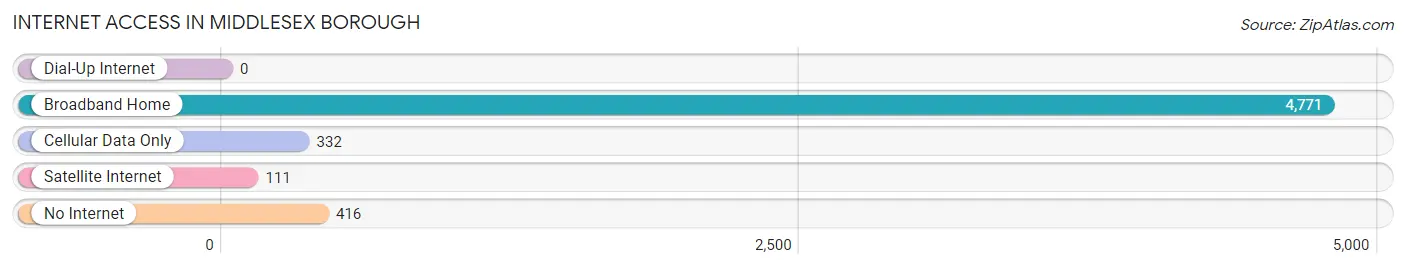
| Internet Type | # Households | % Households |
| Dial-Up Internet | 0 | 0.0% |
| Broadband Home | 4,771 | 85.5% |
| Cellular Data Only | 332 | 5.9% |
| Satellite Internet | 111 | 2.0% |
| No Internet | 416 | 7.5% |
| Total | 5,580 | 100.0% |
Middlesex borough Summary
Middlesex Borough is a small borough located in Middlesex County, New Jersey. It is situated in the Raritan Valley region of Central New Jersey, and is bordered by the towns of Piscataway, Dunellen, South Plainfield, and Edison. The borough has a population of 13,635 as of the 2010 census, and is home to a diverse mix of residents.
History
Middlesex Borough was originally part of Piscataway Township, which was established in 1666. In 1798, the area was incorporated as the Borough of Middlesex. The borough was named after the county of Middlesex, England, which was named after the ancient kingdom of the same name.
The borough was a major center of industry in the 19th century, with several factories and mills located in the area. The most prominent of these was the Middlesex Cotton Mill, which was established in 1845 and operated until the early 20th century. The mill was a major employer in the area, and its products were shipped all over the world.
In the early 20th century, Middlesex Borough began to transition from an industrial center to a residential community. The borough was home to several large estates, and many of these were converted into residential neighborhoods. The borough also saw an influx of immigrants from Europe, particularly from Italy and Poland.
Geography
Middlesex Borough is located in the Raritan Valley region of Central New Jersey. It is bordered by the towns of Piscataway, Dunellen, South Plainfield, and Edison. The borough has a total area of 2.2 square miles, all of which is land.
The borough is located in the Raritan Valley, which is a major transportation corridor in the region. The borough is served by several major highways, including Interstate 287, U.S. Route 1, and the New Jersey Turnpike. The borough is also served by NJ Transit buses and trains, which provide service to New York City and other destinations.
Economy
Middlesex Borough has a diverse economy, with a mix of retail, manufacturing, and service businesses. The borough is home to several large employers, including the Middlesex County College, the Middlesex County Vocational and Technical School, and the Middlesex County Utilities Authority.
The borough is also home to several retail businesses, including several restaurants, grocery stores, and other shops. The borough is also home to several industrial parks, which are home to a variety of businesses.
Demographics
As of the 2010 census, Middlesex Borough had a population of 13,635. The racial makeup of the borough was 79.2% White, 8.3% African American, 0.3% Native American, 5.2% Asian, and 6.9% from other races. Hispanic or Latino of any race were 15.3% of the population.
The median household income in the borough was $68,945, and the median family income was $77,945. The per capita income in the borough was $30,945. About 6.2% of families and 8.3% of the population were below the poverty line.
Middlesex Borough is a diverse community, with a mix of residents from different backgrounds and cultures. The borough is home to a variety of religious institutions, including churches, synagogues, and mosques. The borough is also home to several parks and recreational facilities, which provide a variety of activities for residents.
Common Questions
What is Per Capita Income in Middlesex borough?
Per Capita income in Middlesex borough is $48,793.
What is the Median Family Income in Middlesex borough?
Median Family Income in Middlesex borough is $110,365.
What is the Median Household income in Middlesex borough?
Median Household Income in Middlesex borough is $101,868.
What is Income or Wage Gap in Middlesex borough?
Income or Wage Gap in Middlesex borough is 35.6%.
Women in Middlesex borough earn 64.4 cents for every dollar earned by a man.
What is Family Income Deficit in Middlesex borough?
Family Income Deficit in Middlesex borough is $7,304.
Families that are below poverty line in Middlesex borough earn $7,304 less on average than the poverty threshold level.
What is Inequality or Gini Index in Middlesex borough?
Inequality or Gini Index in Middlesex borough is 0.41.
What is the Total Population of Middlesex borough?
Total Population of Middlesex borough is 14,525.
What is the Total Male Population of Middlesex borough?
Total Male Population of Middlesex borough is 6,881.
What is the Total Female Population of Middlesex borough?
Total Female Population of Middlesex borough is 7,644.
What is the Ratio of Males per 100 Females in Middlesex borough?
There are 90.02 Males per 100 Females in Middlesex borough.
What is the Ratio of Females per 100 Males in Middlesex borough?
There are 111.09 Females per 100 Males in Middlesex borough.
What is the Median Population Age in Middlesex borough?
Median Population Age in Middlesex borough is 44.7 Years.
What is the Average Family Size in Middlesex borough
Average Family Size in Middlesex borough is 3.0 People.
What is the Average Household Size in Middlesex borough
Average Household Size in Middlesex borough is 2.6 People.
How Large is the Labor Force in Middlesex borough?
There are 8,223 People in the Labor Forcein in Middlesex borough.
What is the Percentage of People in the Labor Force in Middlesex borough?
69.1% of People are in the Labor Force in Middlesex borough.
What is the Unemployment Rate in Middlesex borough?
Unemployment Rate in Middlesex borough is 5.6%.