Victory Lakes, NJ Map & Demographics
Victory Lakes Map
Victory Lakes Overview
$40,446
PER CAPITA INCOME
$92,857
AVG FAMILY INCOME
$94,821
AVG HOUSEHOLD INCOME
0.30
INEQUALITY / GINI INDEX
1,322
TOTAL POPULATION
675
MALE POPULATION
647
FEMALE POPULATION
104.33
MALES / 100 FEMALES
95.85
FEMALES / 100 MALES
45.7
MEDIAN AGE
2.8
AVG FAMILY SIZE
2.3
AVG HOUSEHOLD SIZE
762
LABOR FORCE [ PEOPLE ]
67.5%
PERCENT IN LABOR FORCE
10.6%
UNEMPLOYMENT RATE
Income in Victory Lakes
Income Overview in Victory Lakes
Per Capita Income in Victory Lakes is $40,446, while median incomes of families and households are $92,857 and $94,821 respectively.
| Characteristic | Number | Measure |
| Per Capita Income | 1,322 | $40,446 |
| Median Family Income | 380 | $92,857 |
| Mean Family Income | 380 | $95,640 |
| Median Household Income | 566 | $94,821 |
| Mean Household Income | 566 | $93,321 |
| Income Deficit | 380 | $0 |
| Wage / Income Gap (%) | 1,322 | 0.00% |
| Wage / Income Gap ($) | 1,322 | 100.00¢ per $1 |
| Gini / Inequality Index | 1,322 | 0.30 |
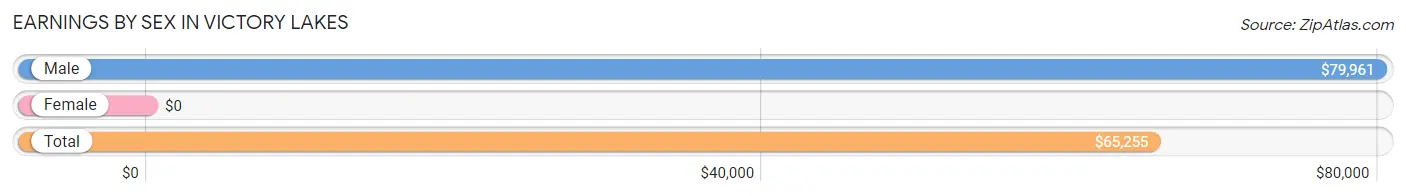
Earnings by Sex in Victory Lakes
| Sex | Number | Average Earnings |
| Male | 413 (53.0%) | $79,961 |
| Female | 366 (47.0%) | $0 |
| Total | 779 (100.0%) | $65,255 |
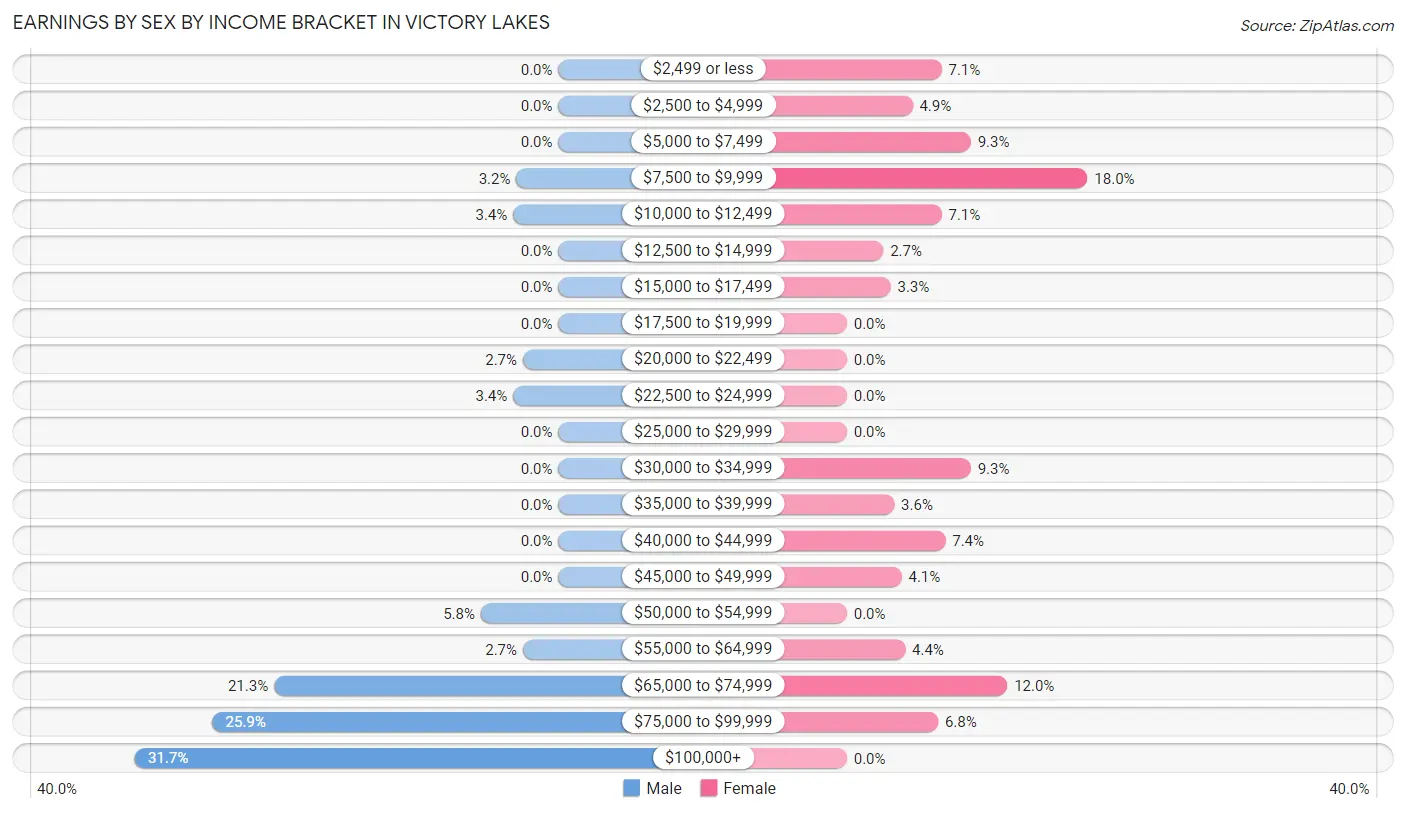
Earnings by Sex by Income Bracket in Victory Lakes
The most common earnings brackets in Victory Lakes are $100,000+ for men (131 | 31.7%) and $7,500 to $9,999 for women (66 | 18.0%).
| Income | Male | Female |
| $2,499 or less | 0 (0.0%) | 26 (7.1%) |
| $2,500 to $4,999 | 0 (0.0%) | 18 (4.9%) |
| $5,000 to $7,499 | 0 (0.0%) | 34 (9.3%) |
| $7,500 to $9,999 | 13 (3.2%) | 66 (18.0%) |
| $10,000 to $12,499 | 14 (3.4%) | 26 (7.1%) |
| $12,500 to $14,999 | 0 (0.0%) | 10 (2.7%) |
| $15,000 to $17,499 | 0 (0.0%) | 12 (3.3%) |
| $17,500 to $19,999 | 0 (0.0%) | 0 (0.0%) |
| $20,000 to $22,499 | 11 (2.7%) | 0 (0.0%) |
| $22,500 to $24,999 | 14 (3.4%) | 0 (0.0%) |
| $25,000 to $29,999 | 0 (0.0%) | 0 (0.0%) |
| $30,000 to $34,999 | 0 (0.0%) | 34 (9.3%) |
| $35,000 to $39,999 | 0 (0.0%) | 13 (3.5%) |
| $40,000 to $44,999 | 0 (0.0%) | 27 (7.4%) |
| $45,000 to $49,999 | 0 (0.0%) | 15 (4.1%) |
| $50,000 to $54,999 | 24 (5.8%) | 0 (0.0%) |
| $55,000 to $64,999 | 11 (2.7%) | 16 (4.4%) |
| $65,000 to $74,999 | 88 (21.3%) | 44 (12.0%) |
| $75,000 to $99,999 | 107 (25.9%) | 25 (6.8%) |
| $100,000+ | 131 (31.7%) | 0 (0.0%) |
| Total | 413 (100.0%) | 366 (100.0%) |
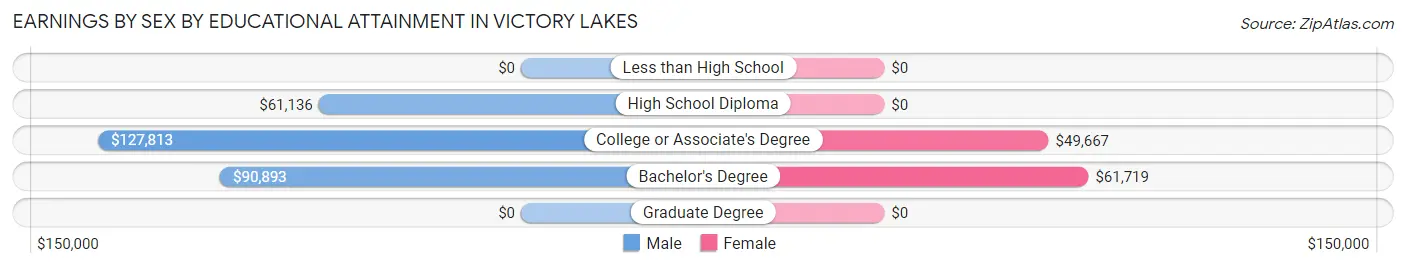
Earnings by Sex by Educational Attainment in Victory Lakes
Average earnings in Victory Lakes are $82,829 for men and $37,308 for women, a difference of 55.0%. Men with an educational attainment of college or associate's degree enjoy the highest average annual earnings of $127,813, while those with high school diploma education earn the least with $61,136. Women with an educational attainment of bachelor's degree earn the most with the average annual earnings of $61,719, while those with college or associate's degree education have the smallest earnings of $49,667.
| Educational Attainment | Male Income | Female Income |
| Less than High School | - | - |
| High School Diploma | $61,136 | $0 |
| College or Associate's Degree | $127,813 | $49,667 |
| Bachelor's Degree | $90,893 | $61,719 |
| Graduate Degree | - | - |
| Total | $82,829 | $37,308 |
Family Income in Victory Lakes
Family Income Brackets in Victory Lakes
According to the Victory Lakes family income data, there are 113 families falling into the $100,000 to $149,999 income range, which is the most common income bracket and makes up 29.7% of all families.
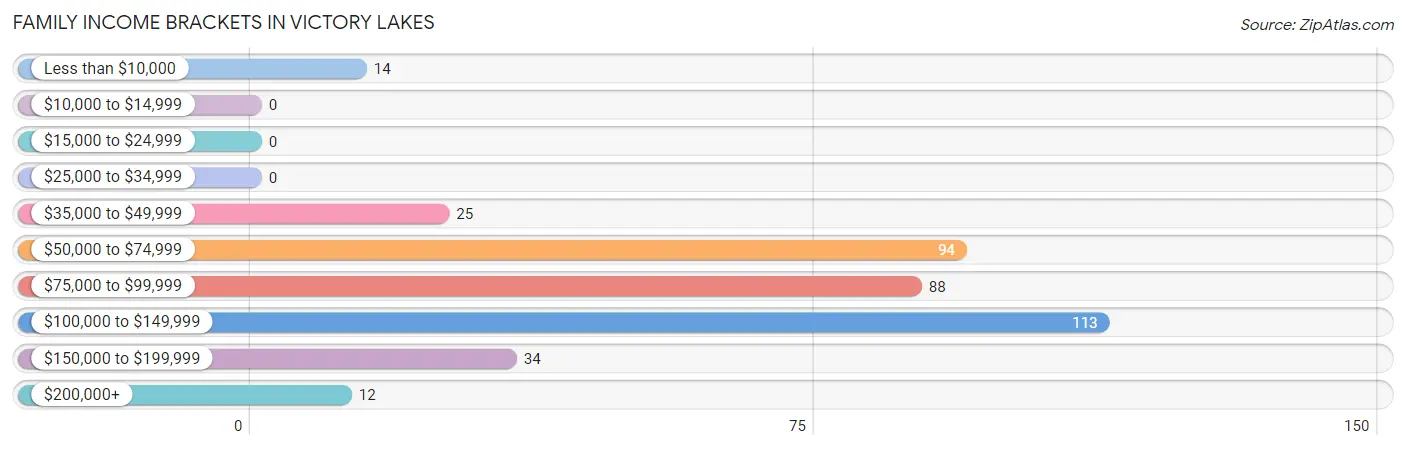
| Income Bracket | # Families | % Families |
| Less than $10,000 | 14 | 3.7% |
| $10,000 to $14,999 | 0 | 0.0% |
| $15,000 to $24,999 | 0 | 0.0% |
| $25,000 to $34,999 | 0 | 0.0% |
| $35,000 to $49,999 | 25 | 6.6% |
| $50,000 to $74,999 | 94 | 24.7% |
| $75,000 to $99,999 | 88 | 23.2% |
| $100,000 to $149,999 | 113 | 29.7% |
| $150,000 to $199,999 | 34 | 8.9% |
| $200,000+ | 12 | 3.2% |
Family Income by Famaliy Size in Victory Lakes
4-person families (112 | 29.5%) account for the highest median family income in Victory Lakes with $110,519 per family, while 2-person families (191 | 50.3%) have the highest median income of $40,896 per family member.
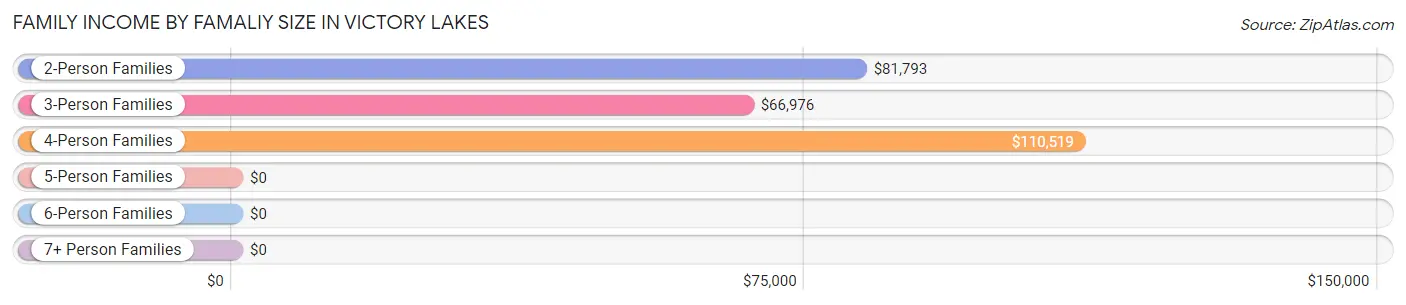
| Income Bracket | # Families | Median Income |
| 2-Person Families | 191 (50.3%) | $81,793 |
| 3-Person Families | 77 (20.3%) | $66,976 |
| 4-Person Families | 112 (29.5%) | $110,519 |
| 5-Person Families | 0 (0.0%) | $0 |
| 6-Person Families | 0 (0.0%) | $0 |
| 7+ Person Families | 0 (0.0%) | $0 |
| Total | 380 (100.0%) | $92,857 |
Family Income by Number of Earners in Victory Lakes
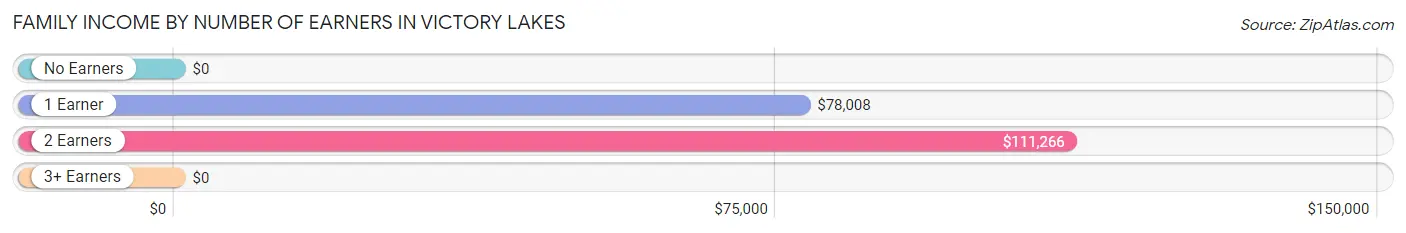
| Number of Earners | # Families | Median Income |
| No Earners | 12 (3.2%) | $0 |
| 1 Earner | 203 (53.4%) | $78,008 |
| 2 Earners | 151 (39.7%) | $111,266 |
| 3+ Earners | 14 (3.7%) | $0 |
| Total | 380 (100.0%) | $92,857 |
Household Income in Victory Lakes
Household Income Brackets in Victory Lakes
With 189 households falling in the category, the $100,000 to $149,999 income range is the most frequent in Victory Lakes, accounting for 33.4% of all households.
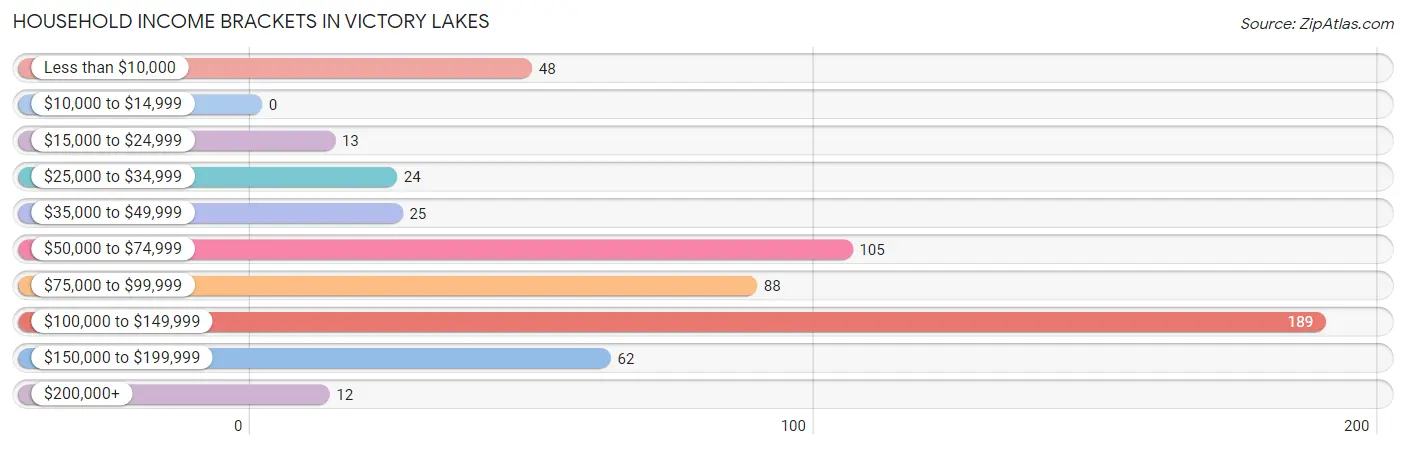
| Income Bracket | # Households | % Households |
| Less than $10,000 | 48 | 8.5% |
| $10,000 to $14,999 | 0 | 0.0% |
| $15,000 to $24,999 | 13 | 2.3% |
| $25,000 to $34,999 | 24 | 4.2% |
| $35,000 to $49,999 | 25 | 4.4% |
| $50,000 to $74,999 | 105 | 18.6% |
| $75,000 to $99,999 | 88 | 15.5% |
| $100,000 to $149,999 | 189 | 33.4% |
| $150,000 to $199,999 | 62 | 11.0% |
| $200,000+ | 12 | 2.1% |
Household Income by Householder Age in Victory Lakes
The median household income in Victory Lakes is $94,821, with the highest median household income of $109,063 found in the 45 to 64 years age bracket for the primary householder. A total of 330 households (58.3%) fall into this category.
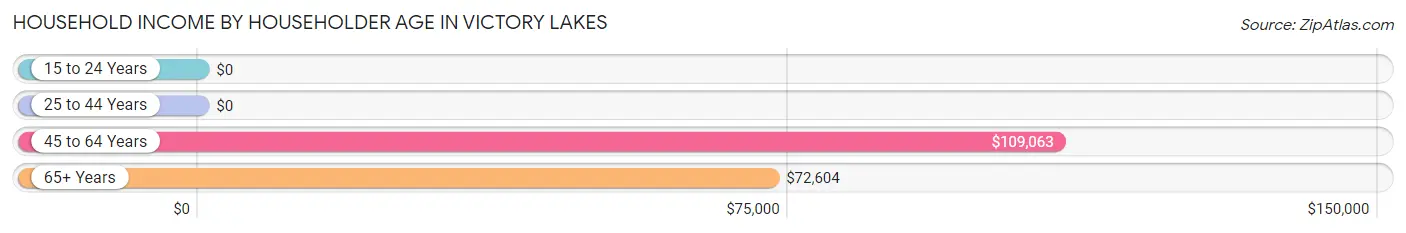
| Income Bracket | # Households | Median Income |
| 15 to 24 Years | 0 (0.0%) | $0 |
| 25 to 44 Years | 135 (23.8%) | $0 |
| 45 to 64 Years | 330 (58.3%) | $109,063 |
| 65+ Years | 101 (17.8%) | $72,604 |
| Total | 566 (100.0%) | $94,821 |
Poverty in Victory Lakes
Income Below Poverty by Sex and Age in Victory Lakes
With 2.1% poverty level for males and 12.3% for females among the residents of Victory Lakes, 12 to 14 year old males and 35 to 44 year old females are the most vulnerable to poverty, with 14 males (31.8%) and 14 females (56.0%) in their respective age groups living below the poverty level.
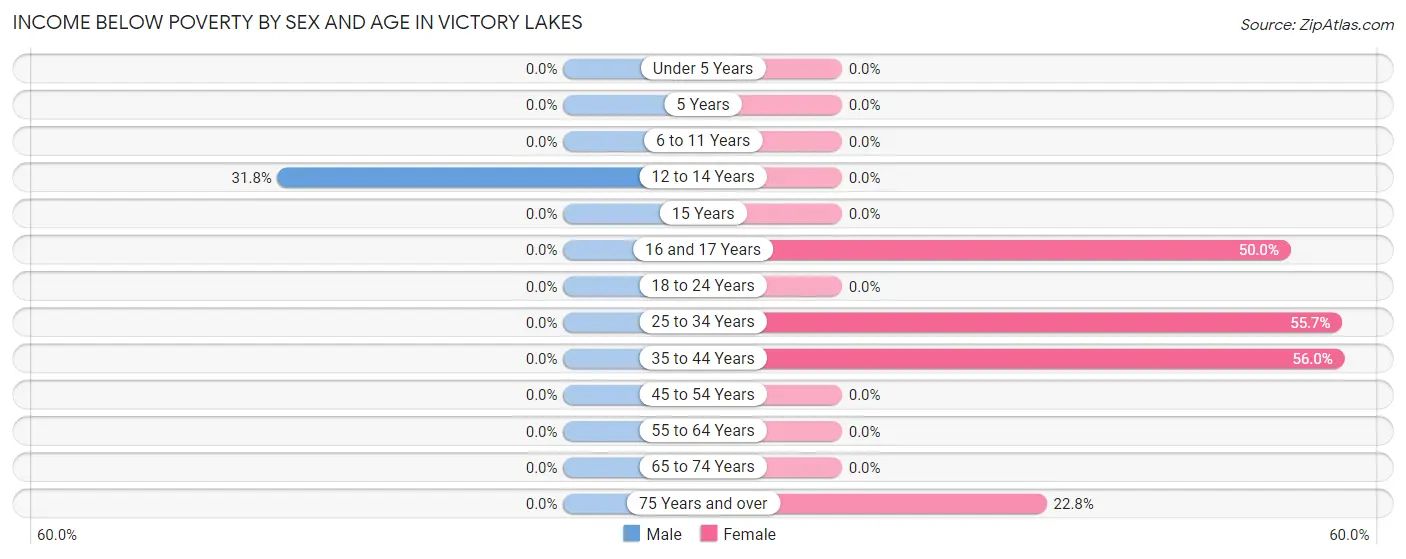
| Age Bracket | Male | Female |
| Under 5 Years | 0 (0.0%) | 0 (0.0%) |
| 5 Years | 0 (0.0%) | 0 (0.0%) |
| 6 to 11 Years | 0 (0.0%) | 0 (0.0%) |
| 12 to 14 Years | 14 (31.8%) | 0 (0.0%) |
| 15 Years | 0 (0.0%) | 0 (0.0%) |
| 16 and 17 Years | 0 (0.0%) | 17 (50.0%) |
| 18 to 24 Years | 0 (0.0%) | 0 (0.0%) |
| 25 to 34 Years | 0 (0.0%) | 34 (55.7%) |
| 35 to 44 Years | 0 (0.0%) | 14 (56.0%) |
| 45 to 54 Years | 0 (0.0%) | 0 (0.0%) |
| 55 to 64 Years | 0 (0.0%) | 0 (0.0%) |
| 65 to 74 Years | 0 (0.0%) | 0 (0.0%) |
| 75 Years and over | 0 (0.0%) | 13 (22.8%) |
| Total | 14 (2.1%) | 78 (12.3%) |
Income Above Poverty by Sex and Age in Victory Lakes
According to the poverty statistics in Victory Lakes, males aged 6 to 11 years and females aged 6 to 11 years are the age groups that are most secure financially, with 100.0% of males and 100.0% of females in these age groups living above the poverty line.
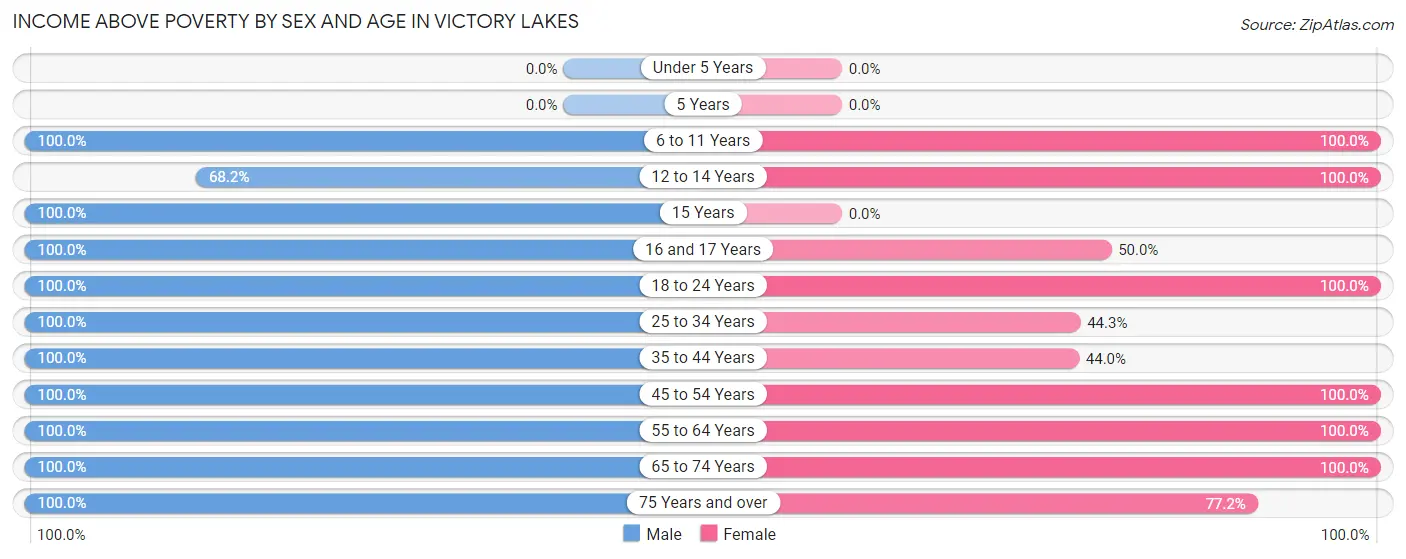
| Age Bracket | Male | Female |
| Under 5 Years | 0 (0.0%) | 0 (0.0%) |
| 5 Years | 0 (0.0%) | 0 (0.0%) |
| 6 to 11 Years | 28 (100.0%) | 28 (100.0%) |
| 12 to 14 Years | 30 (68.2%) | 29 (100.0%) |
| 15 Years | 54 (100.0%) | 0 (0.0%) |
| 16 and 17 Years | 53 (100.0%) | 17 (50.0%) |
| 18 to 24 Years | 47 (100.0%) | 106 (100.0%) |
| 25 to 34 Years | 19 (100.0%) | 27 (44.3%) |
| 35 to 44 Years | 76 (100.0%) | 11 (44.0%) |
| 45 to 54 Years | 186 (100.0%) | 153 (100.0%) |
| 55 to 64 Years | 87 (100.0%) | 73 (100.0%) |
| 65 to 74 Years | 37 (100.0%) | 68 (100.0%) |
| 75 Years and over | 44 (100.0%) | 44 (77.2%) |
| Total | 661 (97.9%) | 556 (87.7%) |
Income Below Poverty Among Married-Couple Families in Victory Lakes
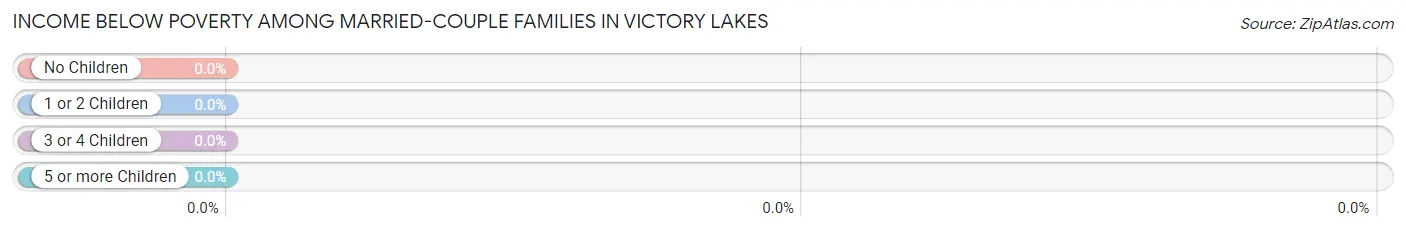
| Children | Above Poverty | Below Poverty |
| No Children | 190 (100.0%) | 0 (0.0%) |
| 1 or 2 Children | 14 (100.0%) | 0 (0.0%) |
| 3 or 4 Children | 0 (0.0%) | 0 (0.0%) |
| 5 or more Children | 0 (0.0%) | 0 (0.0%) |
| Total | 204 (100.0%) | 0 (0.0%) |
Income Below Poverty Among Single-Parent Households in Victory Lakes
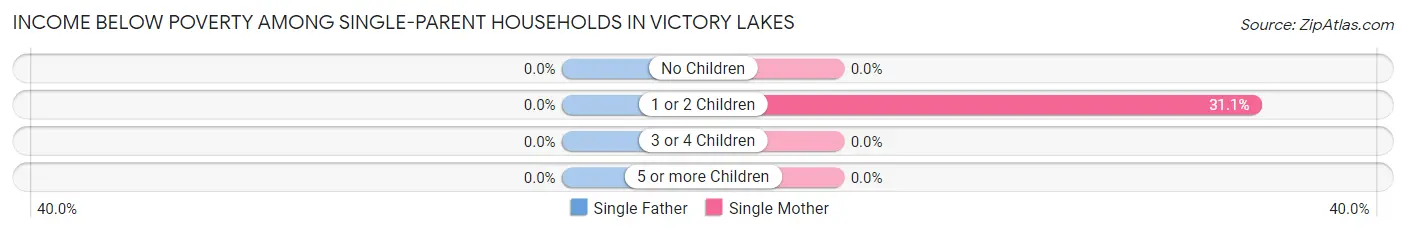
| Children | Single Father | Single Mother |
| No Children | 0 (0.0%) | 0 (0.0%) |
| 1 or 2 Children | 0 (0.0%) | 14 (31.1%) |
| 3 or 4 Children | 0 (0.0%) | 0 (0.0%) |
| 5 or more Children | 0 (0.0%) | 0 (0.0%) |
| Total | 0 (0.0%) | 14 (23.3%) |
Income Below Poverty Among Married-Couple vs Single-Parent Households in Victory Lakes
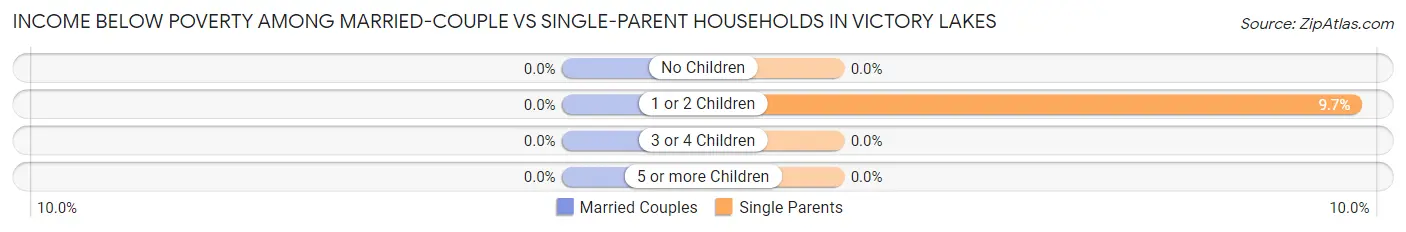
| Children | Married-Couple Families | Single-Parent Households |
| No Children | 0 (0.0%) | 0 (0.0%) |
| 1 or 2 Children | 0 (0.0%) | 14 (9.7%) |
| 3 or 4 Children | 0 (0.0%) | 0 (0.0%) |
| 5 or more Children | 0 (0.0%) | 0 (0.0%) |
| Total | 0 (0.0%) | 14 (8.0%) |
Race in Victory Lakes
The most populous races in Victory Lakes are White / Caucasian (1,236 | 93.5%), Hispanic or Latino (93 | 7.0%), and Some other Race (58 | 4.4%).
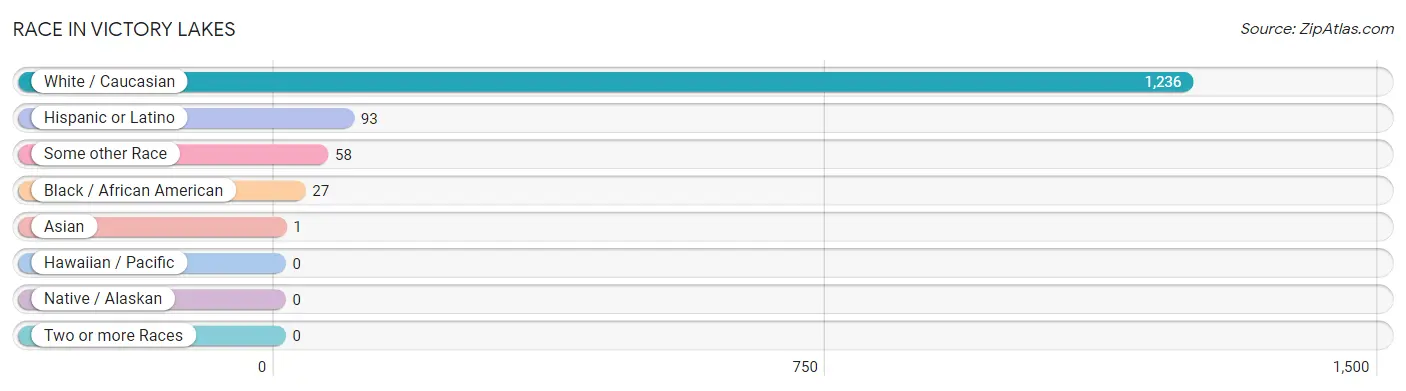
| Race | # Population | % Population |
| Asian | 1 | 0.1% |
| Black / African American | 27 | 2.0% |
| Hawaiian / Pacific | 0 | 0.0% |
| Hispanic or Latino | 93 | 7.0% |
| Native / Alaskan | 0 | 0.0% |
| White / Caucasian | 1,236 | 93.5% |
| Two or more Races | 0 | 0.0% |
| Some other Race | 58 | 4.4% |
| Total | 1,322 | 100.0% |
Ancestry in Victory Lakes
The most populous ancestries reported in Victory Lakes are Irish (537 | 40.6%), German (217 | 16.4%), Italian (197 | 14.9%), English (191 | 14.4%), and Polish (126 | 9.5%), together accounting for 95.9% of all Victory Lakes residents.
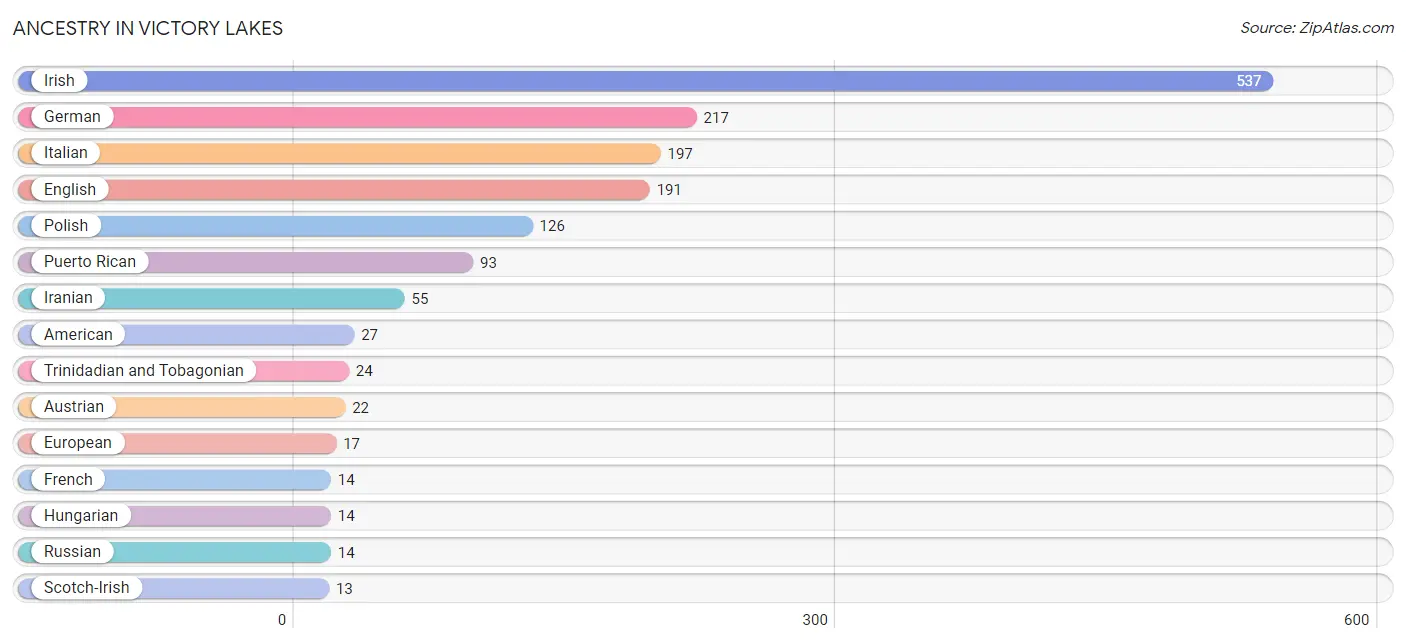
| Ancestry | # Population | % Population |
| American | 27 | 2.0% |
| Austrian | 22 | 1.7% |
| Dutch | 12 | 0.9% |
| English | 191 | 14.4% |
| European | 17 | 1.3% |
| French | 14 | 1.1% |
| German | 217 | 16.4% |
| Hungarian | 14 | 1.1% |
| Iranian | 55 | 4.2% |
| Irish | 537 | 40.6% |
| Italian | 197 | 14.9% |
| Polish | 126 | 9.5% |
| Puerto Rican | 93 | 7.0% |
| Russian | 14 | 1.1% |
| Scotch-Irish | 13 | 1.0% |
| Trinidadian and Tobagonian | 24 | 1.8% |
| Ukrainian | 9 | 0.7% | View All 17 Rows |
Immigrants in Victory Lakes
The most numerous immigrant groups reported in Victory Lakes came from Caribbean (24 | 1.8%), Latin America (24 | 1.8%), Trinidad and Tobago (24 | 1.8%), Europe (16 | 1.2%), and Italy (16 | 1.2%), together accounting for 7.9% of all Victory Lakes residents.
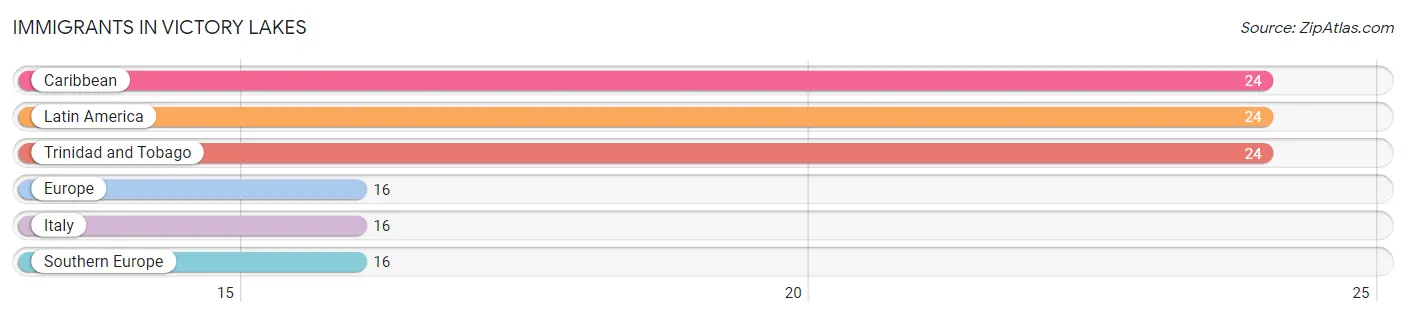
| Immigration Origin | # Population | % Population |
| Caribbean | 24 | 1.8% |
| Europe | 16 | 1.2% |
| Italy | 16 | 1.2% |
| Latin America | 24 | 1.8% |
| Southern Europe | 16 | 1.2% |
| Trinidad and Tobago | 24 | 1.8% | View All 6 Rows |
Sex and Age in Victory Lakes
Sex and Age in Victory Lakes
The most populous age groups in Victory Lakes are 15 to 19 Years (121 | 17.9%) for men and 20 to 24 Years (80 | 12.4%) for women.
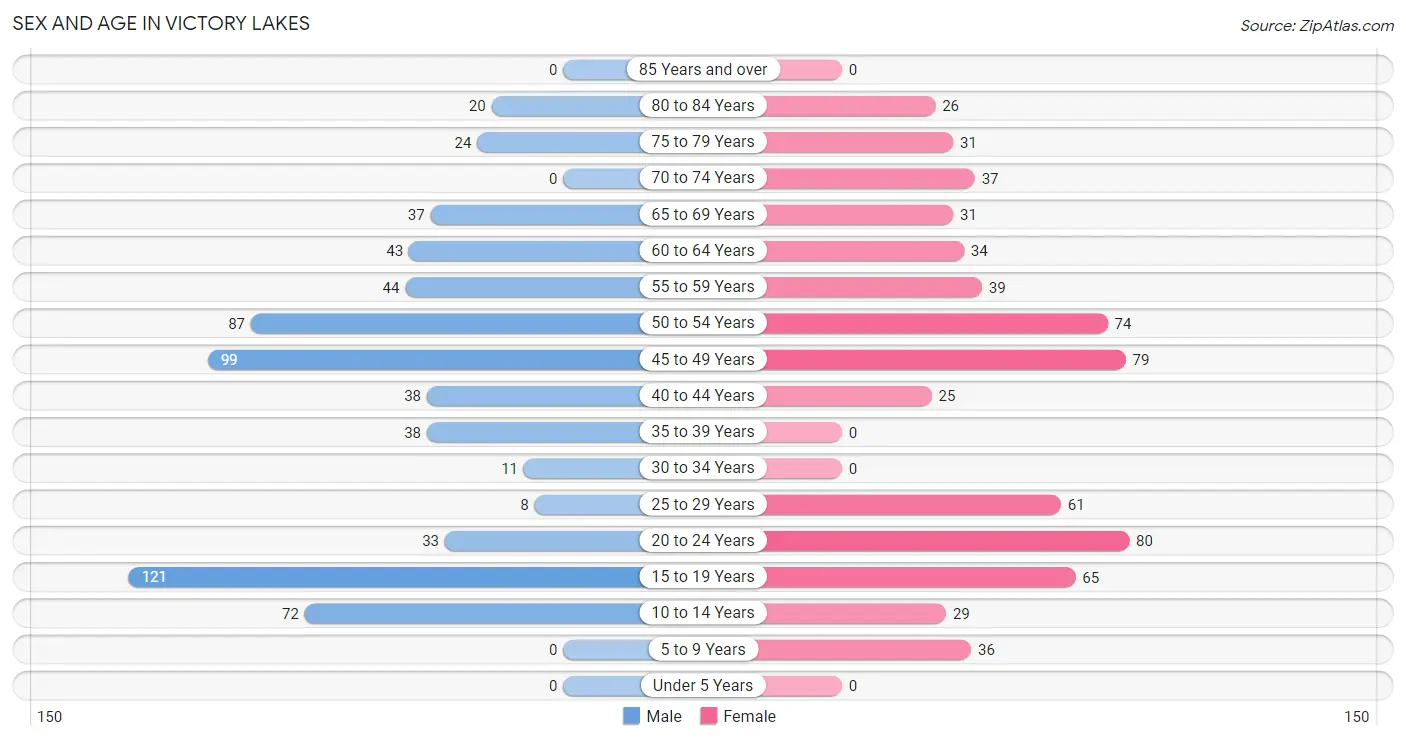
| Age Bracket | Male | Female |
| Under 5 Years | 0 (0.0%) | 0 (0.0%) |
| 5 to 9 Years | 0 (0.0%) | 36 (5.6%) |
| 10 to 14 Years | 72 (10.7%) | 29 (4.5%) |
| 15 to 19 Years | 121 (17.9%) | 65 (10.1%) |
| 20 to 24 Years | 33 (4.9%) | 80 (12.4%) |
| 25 to 29 Years | 8 (1.2%) | 61 (9.4%) |
| 30 to 34 Years | 11 (1.6%) | 0 (0.0%) |
| 35 to 39 Years | 38 (5.6%) | 0 (0.0%) |
| 40 to 44 Years | 38 (5.6%) | 25 (3.9%) |
| 45 to 49 Years | 99 (14.7%) | 79 (12.2%) |
| 50 to 54 Years | 87 (12.9%) | 74 (11.4%) |
| 55 to 59 Years | 44 (6.5%) | 39 (6.0%) |
| 60 to 64 Years | 43 (6.4%) | 34 (5.3%) |
| 65 to 69 Years | 37 (5.5%) | 31 (4.8%) |
| 70 to 74 Years | 0 (0.0%) | 37 (5.7%) |
| 75 to 79 Years | 24 (3.6%) | 31 (4.8%) |
| 80 to 84 Years | 20 (3.0%) | 26 (4.0%) |
| 85 Years and over | 0 (0.0%) | 0 (0.0%) |
| Total | 675 (100.0%) | 647 (100.0%) |
Families and Households in Victory Lakes
Median Family Size in Victory Lakes
The median family size in Victory Lakes is 2.79 persons per family, with single male/father families (116 | 30.5%) accounting for the largest median family size of 3.05 persons per family. On the other hand, married-couple families (204 | 53.7%) represent the smallest median family size with 2.60 persons per family.
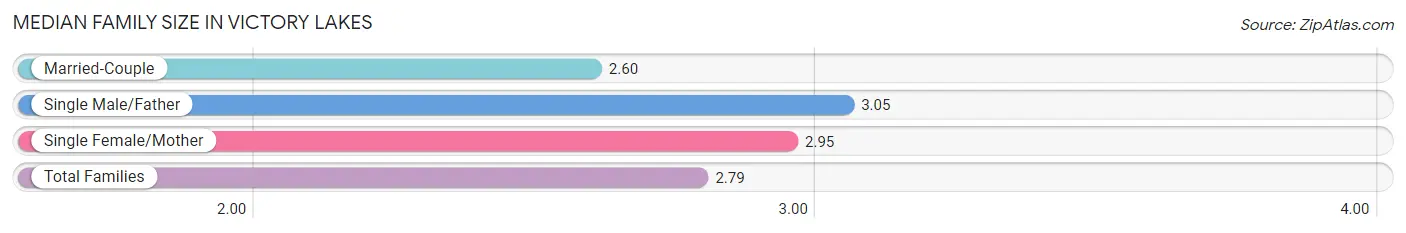
| Family Type | # Families | Family Size |
| Married-Couple | 204 (53.7%) | 2.60 |
| Single Male/Father | 116 (30.5%) | 3.05 |
| Single Female/Mother | 60 (15.8%) | 2.95 |
| Total Families | 380 (100.0%) | 2.79 |
Median Household Size in Victory Lakes
The median household size in Victory Lakes is 2.33 persons per household, with single male/father households (116 | 20.5%) accounting for the largest median household size of 3.18 persons per household. non-family households (186 | 32.9%) represent the smallest median household size with 1.25 persons per household.
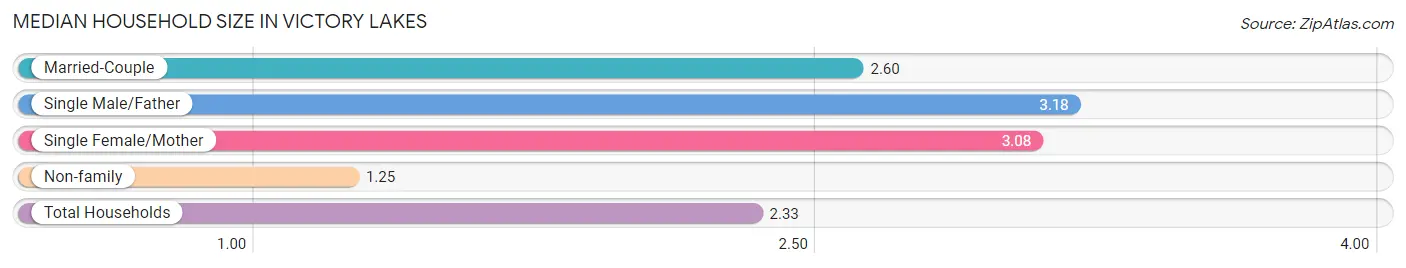
| Household Type | # Households | Household Size |
| Married-Couple | 204 (36.0%) | 2.60 |
| Single Male/Father | 116 (20.5%) | 3.18 |
| Single Female/Mother | 60 (10.6%) | 3.08 |
| Non-family | 186 (32.9%) | 1.25 |
| Total Households | 566 (100.0%) | 2.33 |
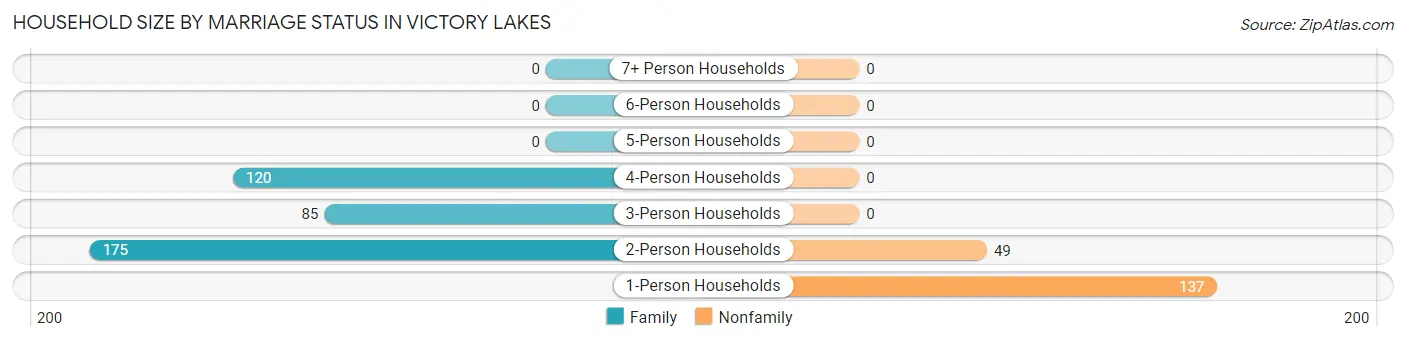
Household Size by Marriage Status in Victory Lakes
Out of a total of 566 households in Victory Lakes, 380 (67.1%) are family households, while 186 (32.9%) are nonfamily households. The most numerous type of family households are 2-person households, comprising 175, and the most common type of nonfamily households are 1-person households, comprising 137.
| Household Size | Family Households | Nonfamily Households |
| 1-Person Households | - | 137 (24.2%) |
| 2-Person Households | 175 (30.9%) | 49 (8.7%) |
| 3-Person Households | 85 (15.0%) | 0 (0.0%) |
| 4-Person Households | 120 (21.2%) | 0 (0.0%) |
| 5-Person Households | 0 (0.0%) | 0 (0.0%) |
| 6-Person Households | 0 (0.0%) | 0 (0.0%) |
| 7+ Person Households | 0 (0.0%) | 0 (0.0%) |
| Total | 380 (67.1%) | 186 (32.9%) |
Female Fertility in Victory Lakes
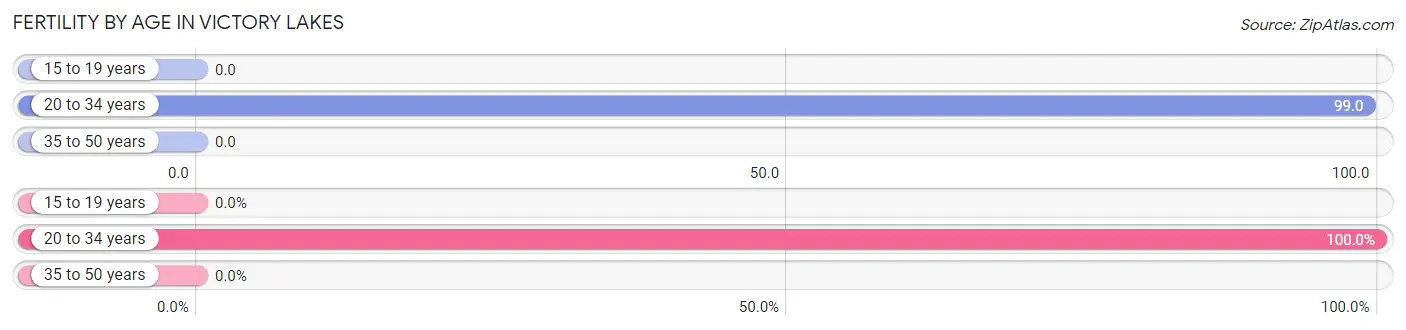
Fertility by Age in Victory Lakes
Average fertility rate in Victory Lakes is 39.0 births per 1,000 women. Women in the age bracket of 20 to 34 years have the highest fertility rate with 99.0 births per 1,000 women. Women in the age bracket of 20 to 34 years acount for 100.0% of all women with births.
| Age Bracket | Women with Births | Births / 1,000 Women |
| 15 to 19 years | 0 (0.0%) | 0.0 |
| 20 to 34 years | 14 (100.0%) | 99.0 |
| 35 to 50 years | 0 (0.0%) | 0.0 |
| Total | 14 (100.0%) | 39.0 |
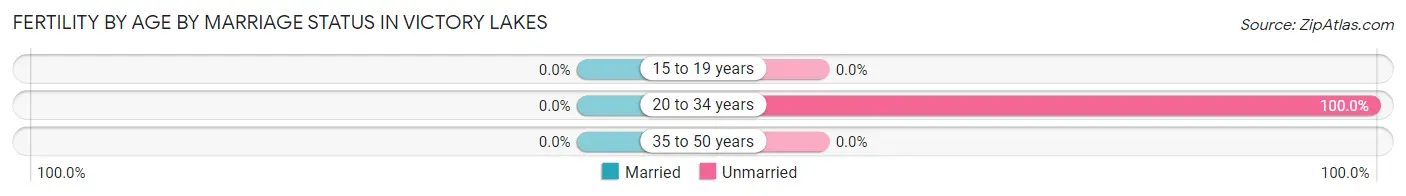
Fertility by Age by Marriage Status in Victory Lakes
| Age Bracket | Married | Unmarried |
| 15 to 19 years | 0 (0.0%) | 0 (0.0%) |
| 20 to 34 years | 0 (0.0%) | 14 (100.0%) |
| 35 to 50 years | 0 (0.0%) | 0 (0.0%) |
| Total | 0 (0.0%) | 14 (100.0%) |
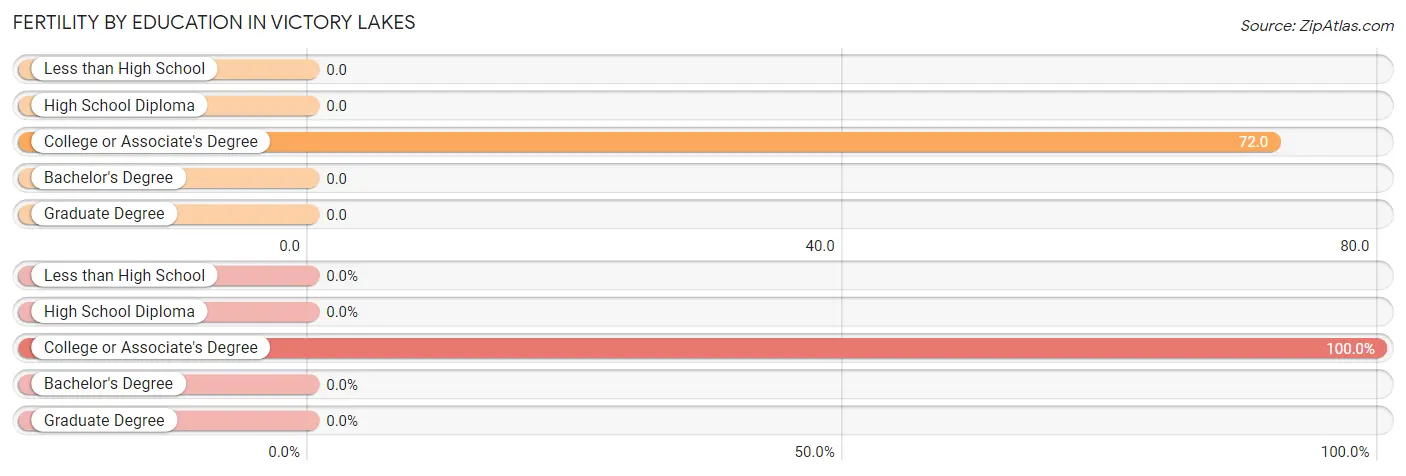
Fertility by Education in Victory Lakes
| Educational Attainment | Women with Births | Births / 1,000 Women |
| Less than High School | 0 (0.0%) | 0.0 |
| High School Diploma | 0 (0.0%) | 0.0 |
| College or Associate's Degree | 14 (100.0%) | 72.0 |
| Bachelor's Degree | 0 (0.0%) | 0.0 |
| Graduate Degree | 0 (0.0%) | 0.0 |
| Total | 14 (100.0%) | 39.0 |
Fertility by Education by Marriage Status in Victory Lakes
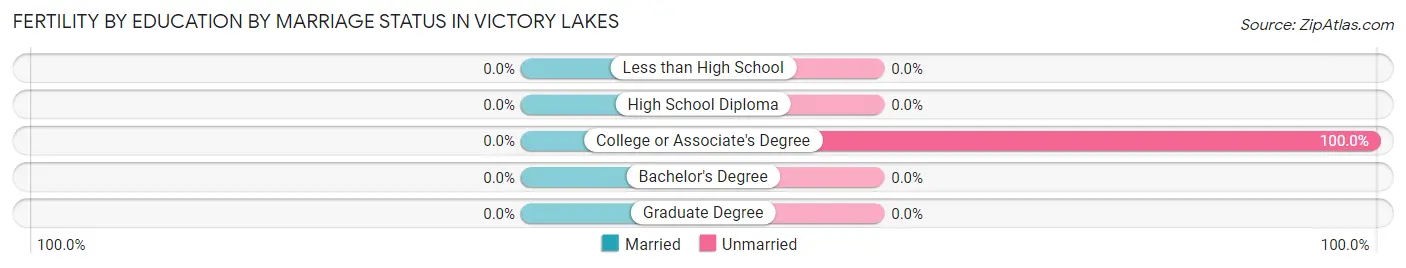
| Educational Attainment | Married | Unmarried |
| Less than High School | 0 (0.0%) | 0 (0.0%) |
| High School Diploma | 0 (0.0%) | 0 (0.0%) |
| College or Associate's Degree | 0 (0.0%) | 14 (100.0%) |
| Bachelor's Degree | 0 (0.0%) | 0 (0.0%) |
| Graduate Degree | 0 (0.0%) | 0 (0.0%) |
| Total | 0 (0.0%) | 14 (100.0%) |
Employment Characteristics in Victory Lakes
Employment by Class of Employer in Victory Lakes
Among the 661 employed individuals in Victory Lakes, private company employees (463 | 70.1%), state government employees (75 | 11.4%), and not-for-profit organizations (51 | 7.7%) make up the most common classes of employment.
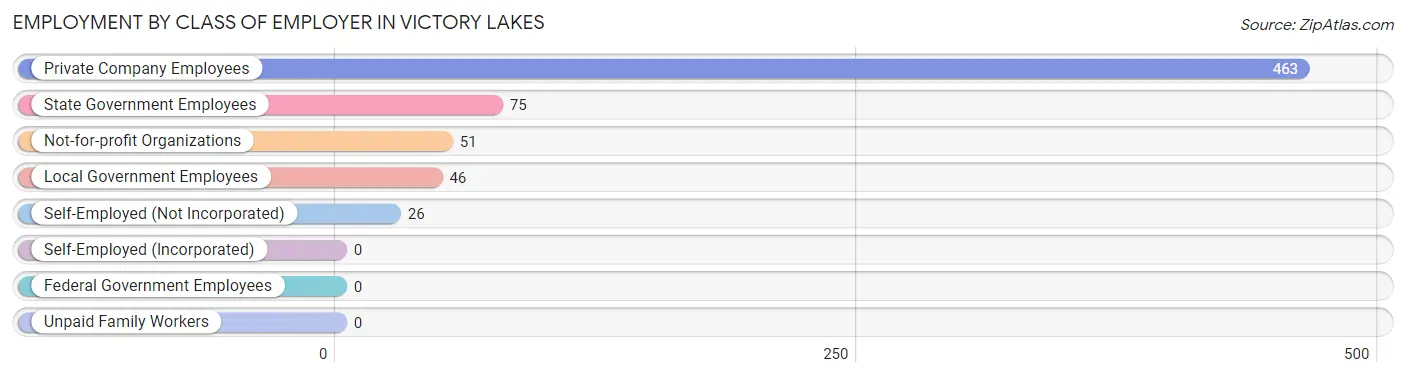
| Employer Class | # Employees | % Employees |
| Private Company Employees | 463 | 70.1% |
| Self-Employed (Incorporated) | 0 | 0.0% |
| Self-Employed (Not Incorporated) | 26 | 3.9% |
| Not-for-profit Organizations | 51 | 7.7% |
| Local Government Employees | 46 | 7.0% |
| State Government Employees | 75 | 11.4% |
| Federal Government Employees | 0 | 0.0% |
| Unpaid Family Workers | 0 | 0.0% |
| Total | 661 | 100.0% |
Employment Status by Age in Victory Lakes
According to the labor force statistics for Victory Lakes, out of the total population over 16 years of age (1,129), 67.5% or 762 individuals are in the labor force, with 10.6% or 81 of them unemployed. The age group with the highest labor force participation rate is 20 to 24 years, with 100.0% or 113 individuals in the labor force. Within the labor force, the 20 to 24 years age range has the highest percentage of unemployed individuals, with 31.9% or 36 of them being unemployed.
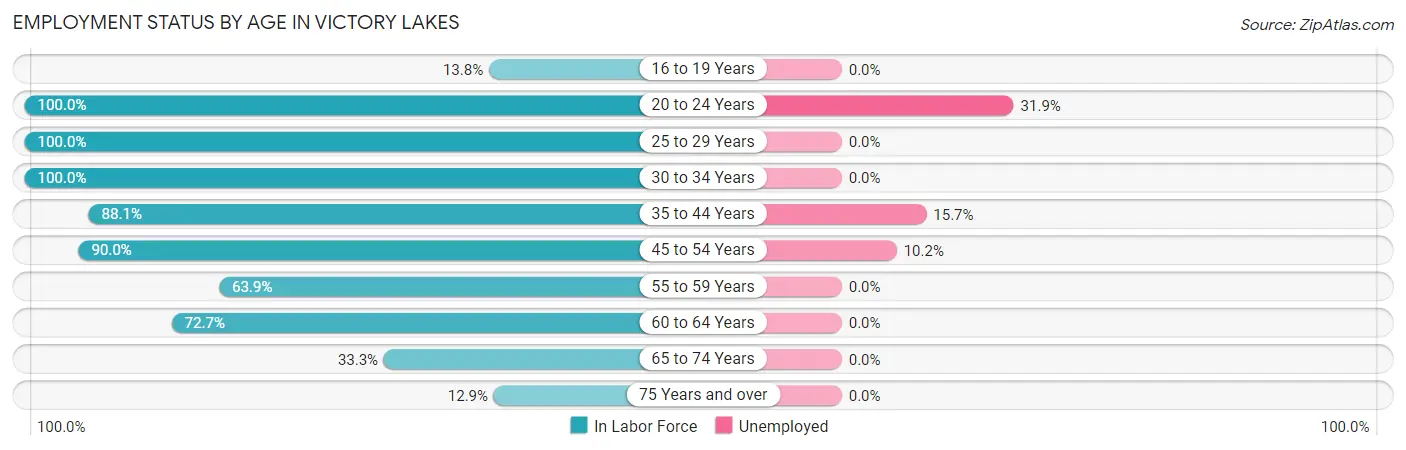
| Age Bracket | In Labor Force | Unemployed |
| 16 to 19 Years | 18 (13.8%) | 0 (0.0%) |
| 20 to 24 Years | 113 (100.0%) | 36 (31.9%) |
| 25 to 29 Years | 69 (100.0%) | 0 (0.0%) |
| 30 to 34 Years | 11 (100.0%) | 0 (0.0%) |
| 35 to 44 Years | 89 (88.1%) | 14 (15.7%) |
| 45 to 54 Years | 305 (90.0%) | 31 (10.2%) |
| 55 to 59 Years | 53 (63.9%) | 0 (0.0%) |
| 60 to 64 Years | 56 (72.7%) | 0 (0.0%) |
| 65 to 74 Years | 35 (33.3%) | 0 (0.0%) |
| 75 Years and over | 13 (12.9%) | 0 (0.0%) |
| Total | 762 (67.5%) | 81 (10.6%) |
Employment Status by Educational Attainment in Victory Lakes
According to labor force statistics for Victory Lakes, 85.7% of individuals (583) out of the total population between 25 and 64 years of age (680) are in the labor force, with 7.7% or 45 of them being unemployed. The group with the highest labor force participation rate are those with the educational attainment of less than high school, with 100.0% or 46 individuals in the labor force. Within the labor force, individuals with high school diploma education have the highest percentage of unemployment, with 15.3% or 17 of them being unemployed.
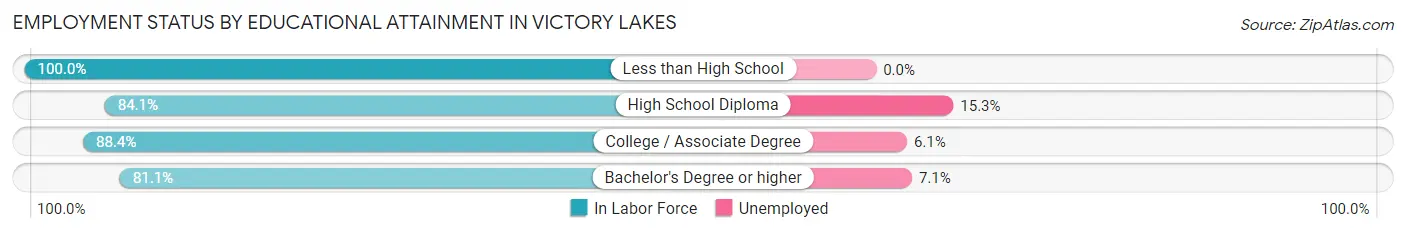
| Educational Attainment | In Labor Force | Unemployed |
| Less than High School | 46 (100.0%) | 0 (0.0%) |
| High School Diploma | 111 (84.1%) | 20 (15.3%) |
| College / Associate Degree | 228 (88.4%) | 16 (6.1%) |
| Bachelor's Degree or higher | 198 (81.1%) | 17 (7.1%) |
| Total | 583 (85.7%) | 52 (7.7%) |
Employment Occupations by Sex in Victory Lakes
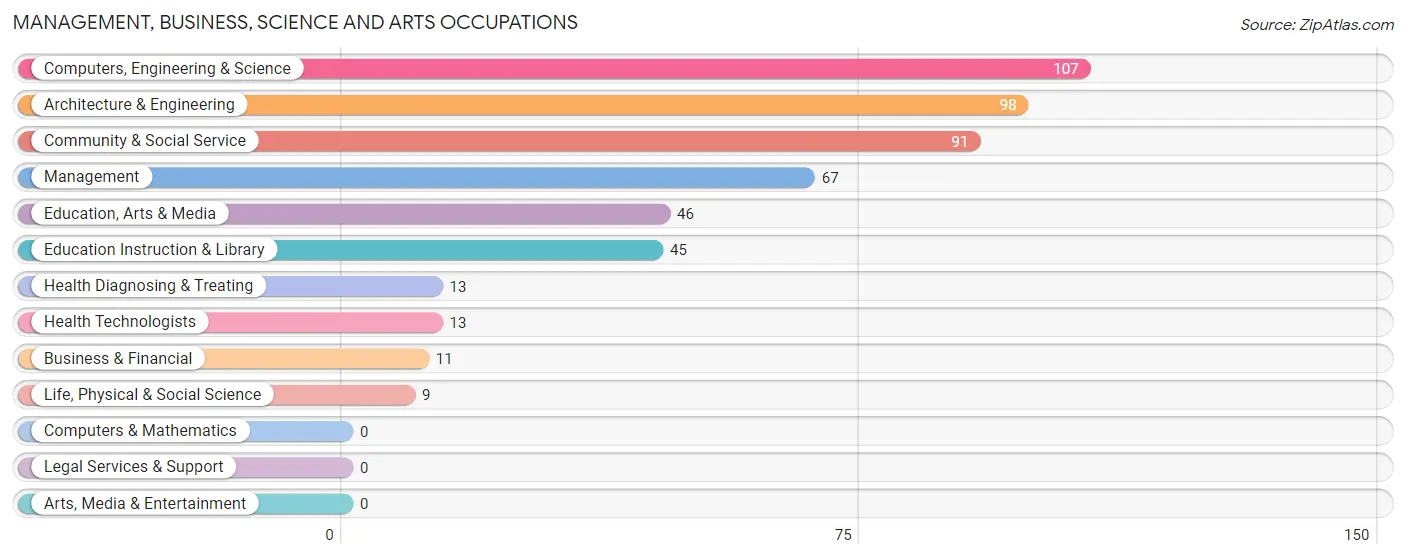
Management, Business, Science and Arts Occupations
The most common Management, Business, Science and Arts occupations in Victory Lakes are Computers, Engineering & Science (107 | 15.7%), Architecture & Engineering (98 | 14.4%), Community & Social Service (91 | 13.4%), Management (67 | 9.8%), and Education, Arts & Media (46 | 6.8%).
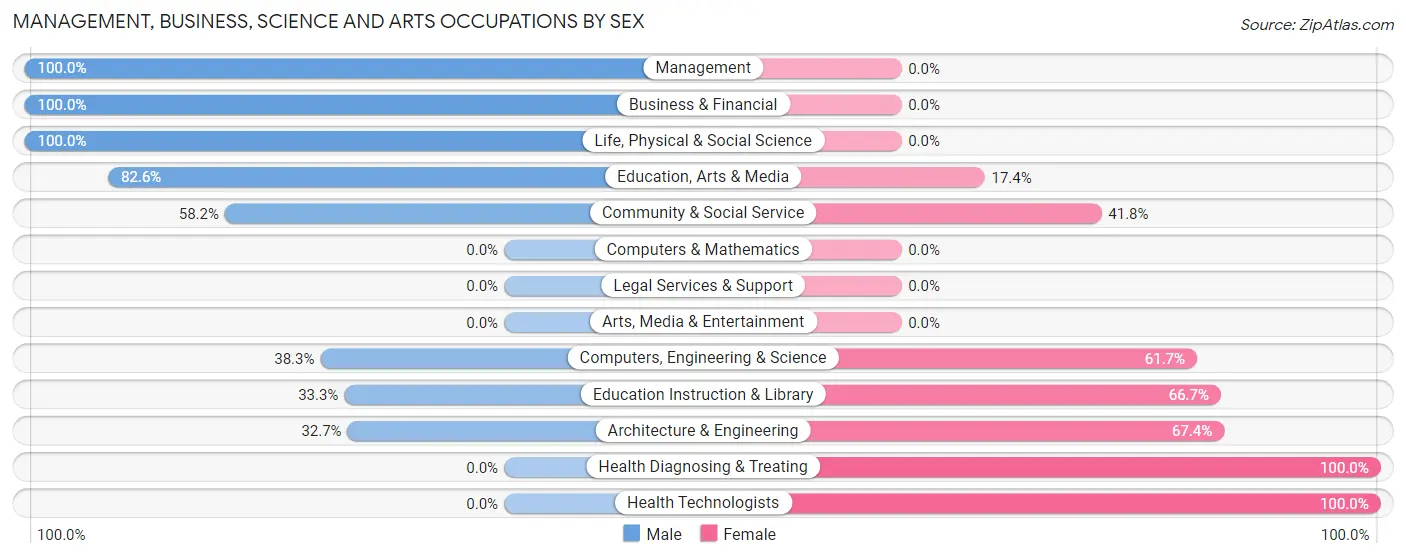
Management, Business, Science and Arts Occupations by Sex
Within the Management, Business, Science and Arts occupations in Victory Lakes, the most male-oriented occupations are Management (100.0%), Business & Financial (100.0%), and Life, Physical & Social Science (100.0%), while the most female-oriented occupations are Health Diagnosing & Treating (100.0%), Health Technologists (100.0%), and Architecture & Engineering (67.3%).
| Occupation | Male | Female |
| Management | 67 (100.0%) | 0 (0.0%) |
| Business & Financial | 11 (100.0%) | 0 (0.0%) |
| Computers, Engineering & Science | 41 (38.3%) | 66 (61.7%) |
| Computers & Mathematics | 0 (0.0%) | 0 (0.0%) |
| Architecture & Engineering | 32 (32.7%) | 66 (67.3%) |
| Life, Physical & Social Science | 9 (100.0%) | 0 (0.0%) |
| Community & Social Service | 53 (58.2%) | 38 (41.8%) |
| Education, Arts & Media | 38 (82.6%) | 8 (17.4%) |
| Legal Services & Support | 0 (0.0%) | 0 (0.0%) |
| Education Instruction & Library | 15 (33.3%) | 30 (66.7%) |
| Arts, Media & Entertainment | 0 (0.0%) | 0 (0.0%) |
| Health Diagnosing & Treating | 0 (0.0%) | 13 (100.0%) |
| Health Technologists | 0 (0.0%) | 13 (100.0%) |
| Total (Category) | 172 (59.5%) | 117 (40.5%) |
| Total (Overall) | 375 (55.1%) | 306 (44.9%) |
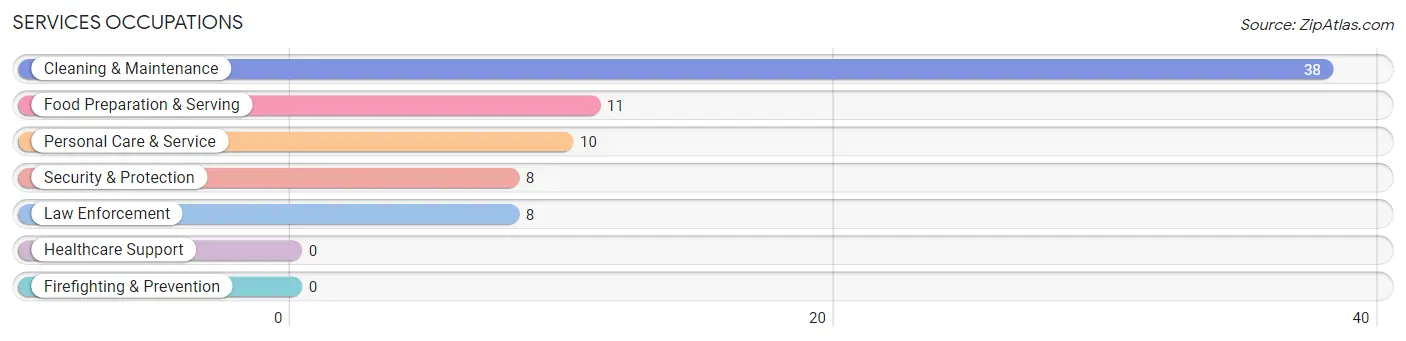
Services Occupations
The most common Services occupations in Victory Lakes are Cleaning & Maintenance (38 | 5.6%), Food Preparation & Serving (11 | 1.6%), Personal Care & Service (10 | 1.5%), Security & Protection (8 | 1.2%), and Law Enforcement (8 | 1.2%).
Services Occupations by Sex
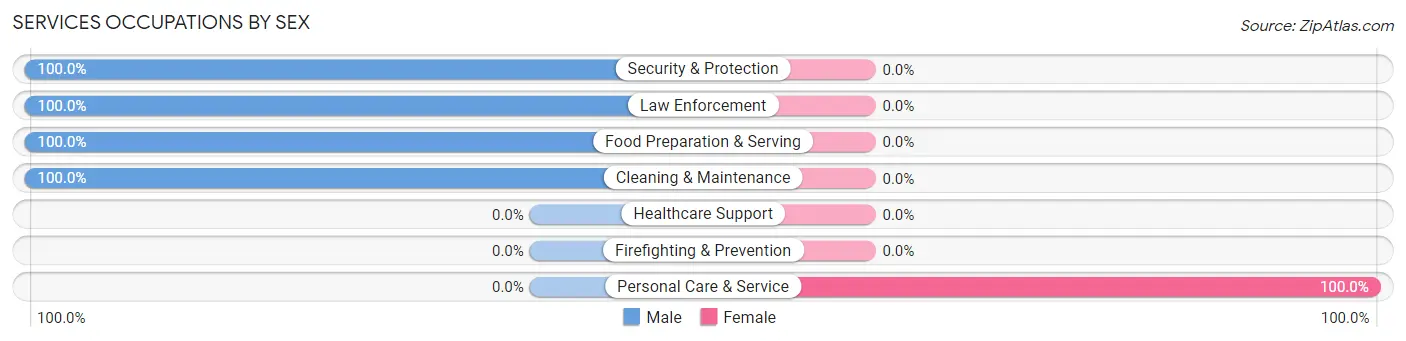
| Occupation | Male | Female |
| Healthcare Support | 0 (0.0%) | 0 (0.0%) |
| Security & Protection | 8 (100.0%) | 0 (0.0%) |
| Firefighting & Prevention | 0 (0.0%) | 0 (0.0%) |
| Law Enforcement | 8 (100.0%) | 0 (0.0%) |
| Food Preparation & Serving | 11 (100.0%) | 0 (0.0%) |
| Cleaning & Maintenance | 38 (100.0%) | 0 (0.0%) |
| Personal Care & Service | 0 (0.0%) | 10 (100.0%) |
| Total (Category) | 57 (85.1%) | 10 (14.9%) |
| Total (Overall) | 375 (55.1%) | 306 (44.9%) |
Sales and Office Occupations
The most common Sales and Office occupations in Victory Lakes are Sales & Related (131 | 19.2%), and Office & Administration (79 | 11.6%).
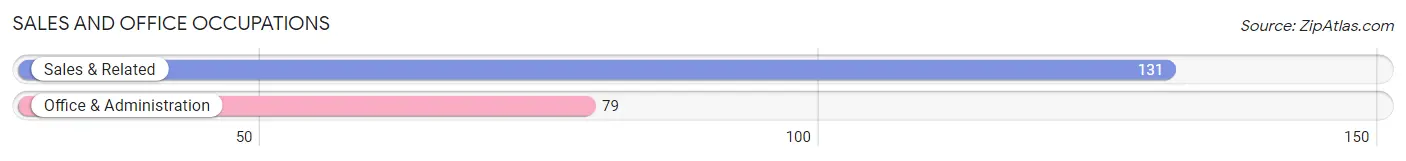
Sales and Office Occupations by Sex
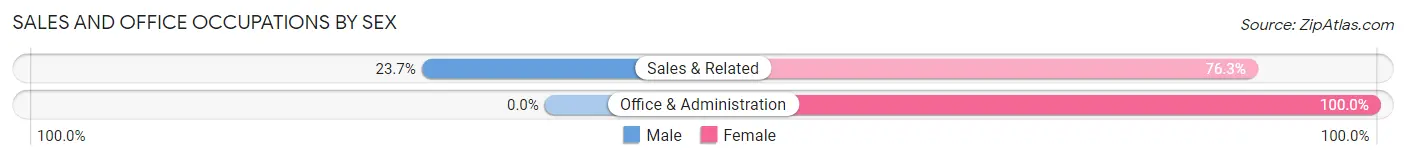
| Occupation | Male | Female |
| Sales & Related | 31 (23.7%) | 100 (76.3%) |
| Office & Administration | 0 (0.0%) | 79 (100.0%) |
| Total (Category) | 31 (14.8%) | 179 (85.2%) |
| Total (Overall) | 375 (55.1%) | 306 (44.9%) |
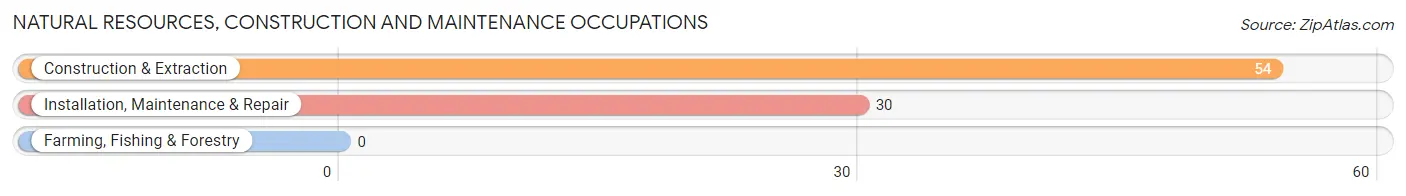
Natural Resources, Construction and Maintenance Occupations
The most common Natural Resources, Construction and Maintenance occupations in Victory Lakes are Construction & Extraction (54 | 7.9%), and Installation, Maintenance & Repair (30 | 4.4%).
Natural Resources, Construction and Maintenance Occupations by Sex
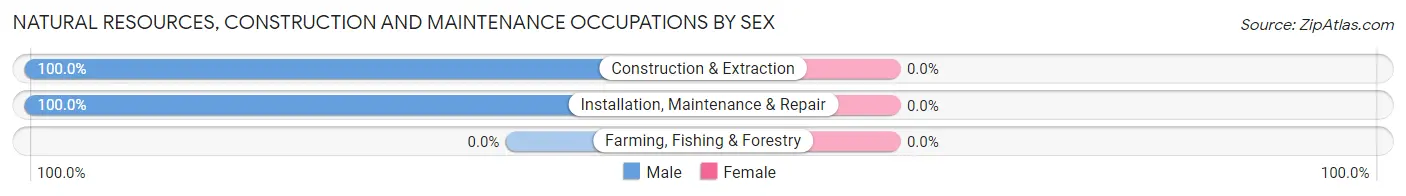
| Occupation | Male | Female |
| Farming, Fishing & Forestry | 0 (0.0%) | 0 (0.0%) |
| Construction & Extraction | 54 (100.0%) | 0 (0.0%) |
| Installation, Maintenance & Repair | 30 (100.0%) | 0 (0.0%) |
| Total (Category) | 84 (100.0%) | 0 (0.0%) |
| Total (Overall) | 375 (55.1%) | 306 (44.9%) |
Production, Transportation and Moving Occupations
The most common Production, Transportation and Moving occupations in Victory Lakes are , and Material Moving (31 | 4.5%).
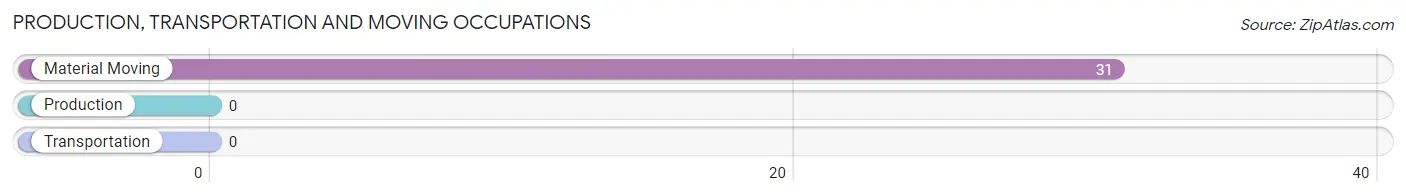
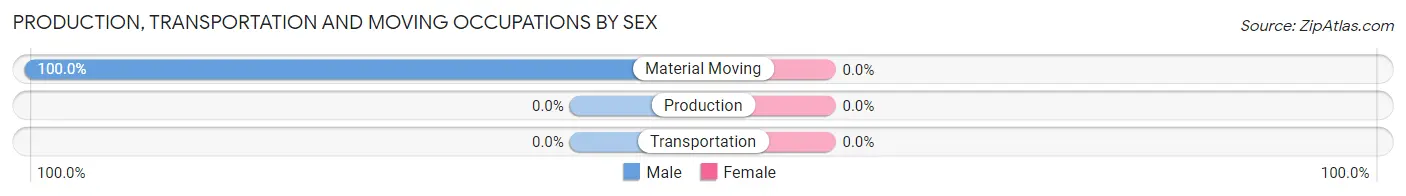
Production, Transportation and Moving Occupations by Sex
| Occupation | Male | Female |
| Production | 0 (0.0%) | 0 (0.0%) |
| Transportation | 0 (0.0%) | 0 (0.0%) |
| Material Moving | 31 (100.0%) | 0 (0.0%) |
| Total (Category) | 31 (100.0%) | 0 (0.0%) |
| Total (Overall) | 375 (55.1%) | 306 (44.9%) |
Employment Industries by Sex in Victory Lakes
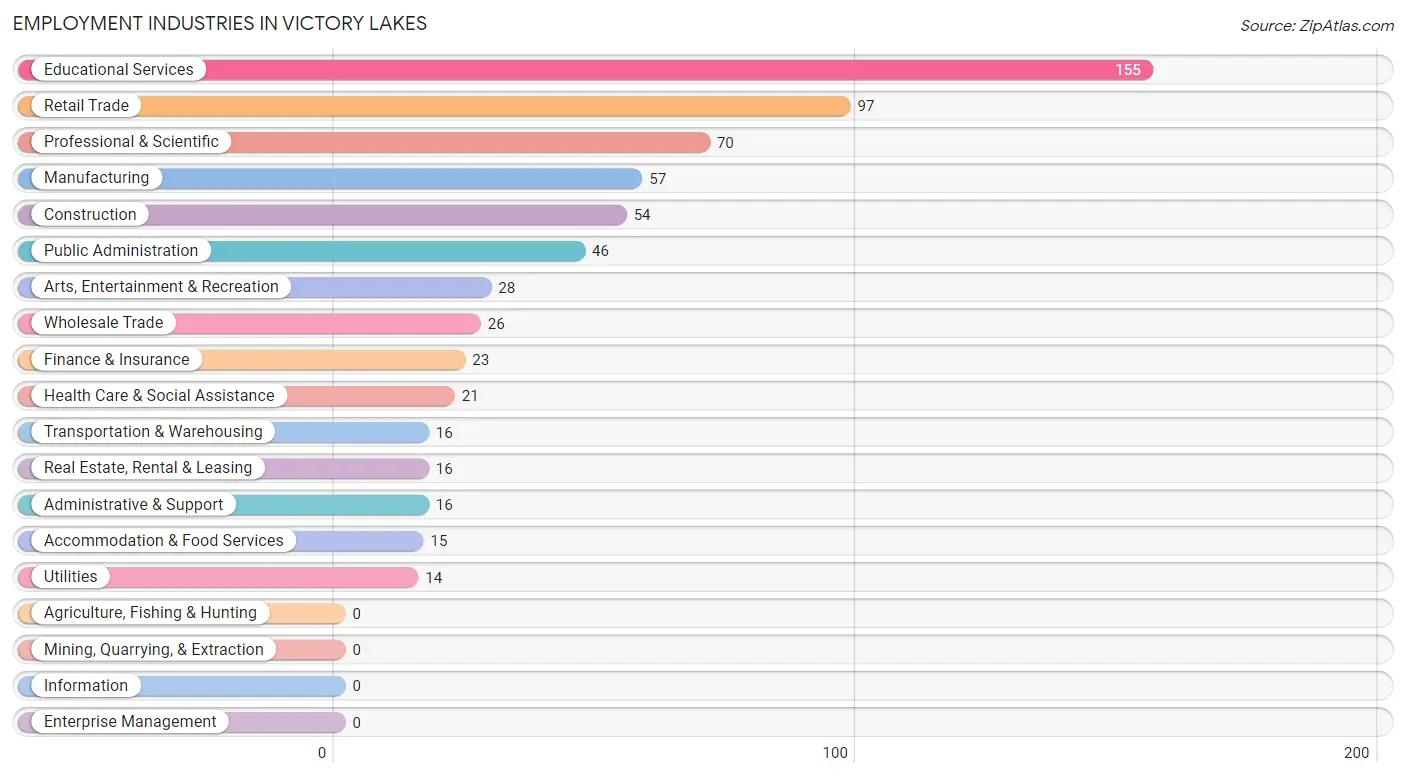
Employment Industries in Victory Lakes
The major employment industries in Victory Lakes include Educational Services (155 | 22.8%), Retail Trade (97 | 14.2%), Professional & Scientific (70 | 10.3%), Manufacturing (57 | 8.4%), and Construction (54 | 7.9%).
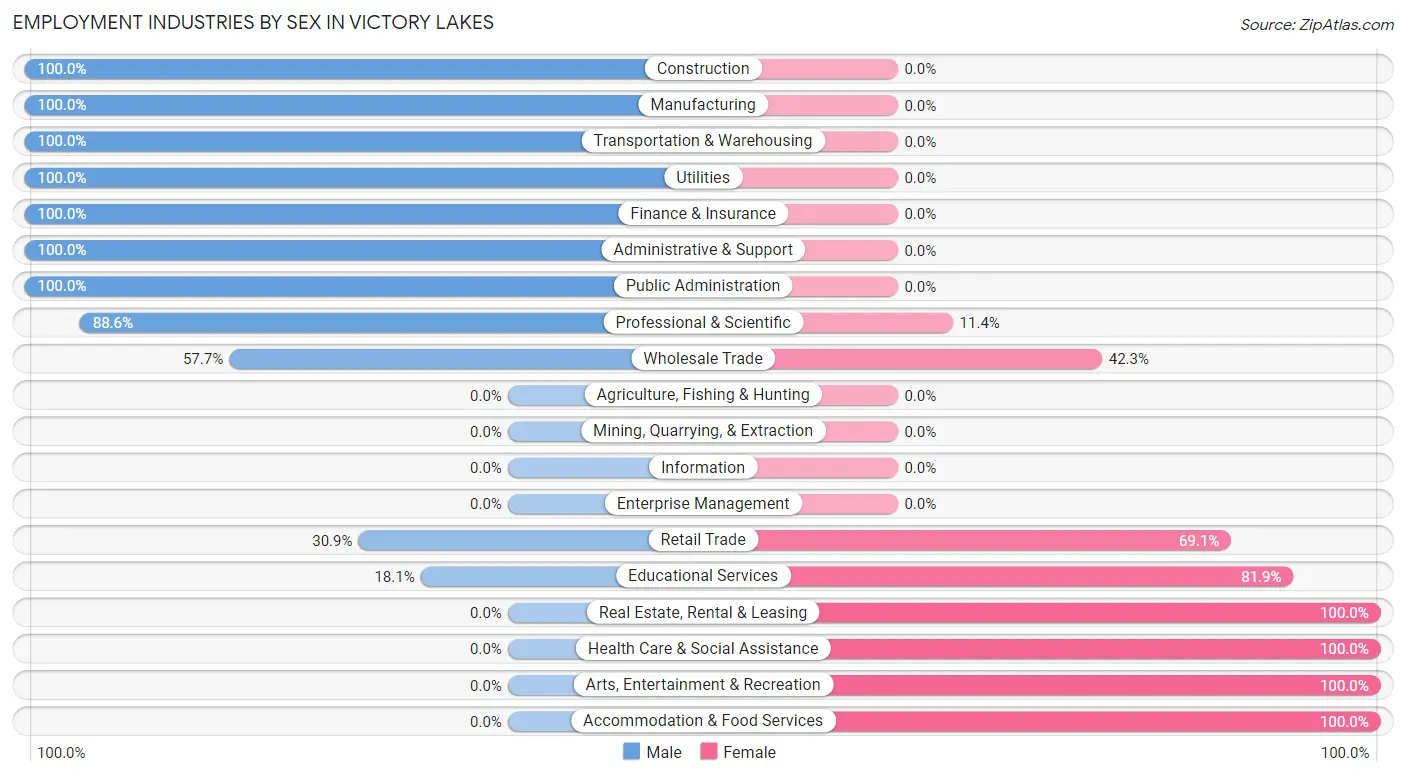
Employment Industries by Sex in Victory Lakes
The Victory Lakes industries that see more men than women are Construction (100.0%), Manufacturing (100.0%), and Transportation & Warehousing (100.0%), whereas the industries that tend to have a higher number of women are Real Estate, Rental & Leasing (100.0%), Health Care & Social Assistance (100.0%), and Arts, Entertainment & Recreation (100.0%).
| Industry | Male | Female |
| Agriculture, Fishing & Hunting | 0 (0.0%) | 0 (0.0%) |
| Mining, Quarrying, & Extraction | 0 (0.0%) | 0 (0.0%) |
| Construction | 54 (100.0%) | 0 (0.0%) |
| Manufacturing | 57 (100.0%) | 0 (0.0%) |
| Wholesale Trade | 15 (57.7%) | 11 (42.3%) |
| Retail Trade | 30 (30.9%) | 67 (69.1%) |
| Transportation & Warehousing | 16 (100.0%) | 0 (0.0%) |
| Utilities | 14 (100.0%) | 0 (0.0%) |
| Information | 0 (0.0%) | 0 (0.0%) |
| Finance & Insurance | 23 (100.0%) | 0 (0.0%) |
| Real Estate, Rental & Leasing | 0 (0.0%) | 16 (100.0%) |
| Professional & Scientific | 62 (88.6%) | 8 (11.4%) |
| Enterprise Management | 0 (0.0%) | 0 (0.0%) |
| Administrative & Support | 16 (100.0%) | 0 (0.0%) |
| Educational Services | 28 (18.1%) | 127 (81.9%) |
| Health Care & Social Assistance | 0 (0.0%) | 21 (100.0%) |
| Arts, Entertainment & Recreation | 0 (0.0%) | 28 (100.0%) |
| Accommodation & Food Services | 0 (0.0%) | 15 (100.0%) |
| Public Administration | 46 (100.0%) | 0 (0.0%) |
| Total | 375 (55.1%) | 306 (44.9%) |
Education in Victory Lakes
School Enrollment in Victory Lakes
The most common levels of schooling among the 407 students in Victory Lakes are high school (182 | 44.7%), college / undergraduate (118 | 29.0%), and elementary school (64 | 15.7%).
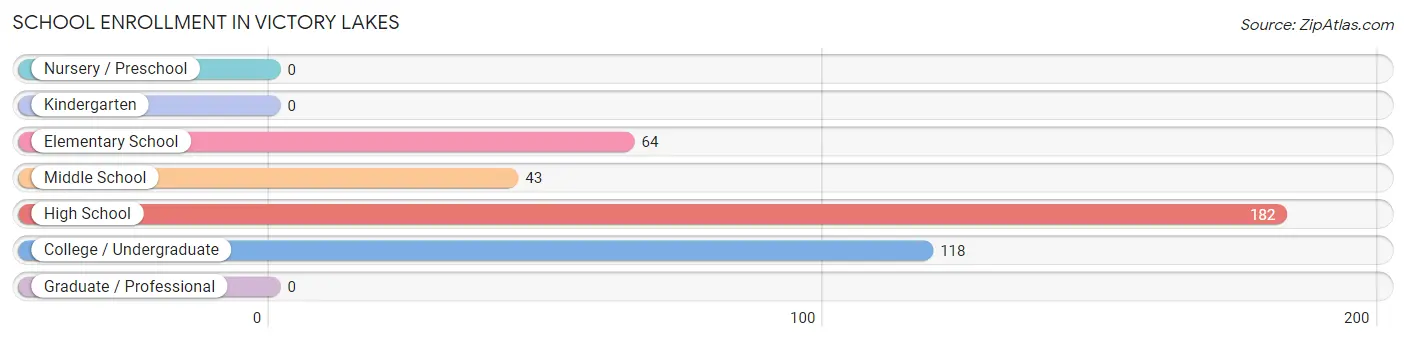
| School Level | # Students | % Students |
| Nursery / Preschool | 0 | 0.0% |
| Kindergarten | 0 | 0.0% |
| Elementary School | 64 | 15.7% |
| Middle School | 43 | 10.6% |
| High School | 182 | 44.7% |
| College / Undergraduate | 118 | 29.0% |
| Graduate / Professional | 0 | 0.0% |
| Total | 407 | 100.0% |
School Enrollment by Age by Funding Source in Victory Lakes
Out of a total of 407 students who are enrolled in schools in Victory Lakes, 32 (7.9%) attend a private institution, while the remaining 375 (92.1%) are enrolled in public schools. The age group of 18 to 19 year olds has the highest likelihood of being enrolled in private schools, with 21 (72.4% in the age bracket) enrolled. Conversely, the age group of 5 to 9 year old has the lowest likelihood of being enrolled in a private school, with 36 (100.0% in the age bracket) attending a public institution.
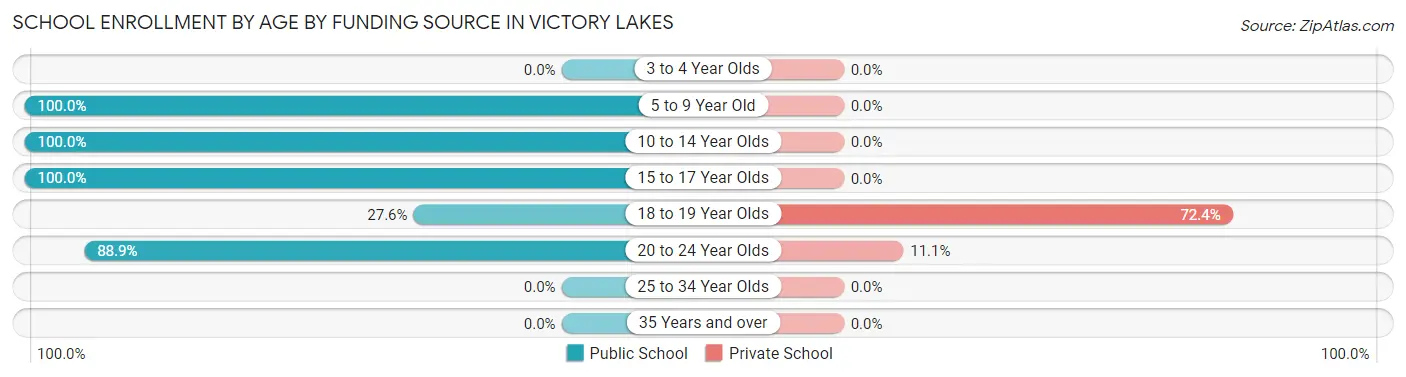
| Age Bracket | Public School | Private School |
| 3 to 4 Year Olds | 0 (0.0%) | 0 (0.0%) |
| 5 to 9 Year Old | 36 (100.0%) | 0 (0.0%) |
| 10 to 14 Year Olds | 101 (100.0%) | 0 (0.0%) |
| 15 to 17 Year Olds | 142 (100.0%) | 0 (0.0%) |
| 18 to 19 Year Olds | 8 (27.6%) | 21 (72.4%) |
| 20 to 24 Year Olds | 88 (88.9%) | 11 (11.1%) |
| 25 to 34 Year Olds | 0 (0.0%) | 0 (0.0%) |
| 35 Years and over | 0 (0.0%) | 0 (0.0%) |
| Total | 375 (92.1%) | 32 (7.9%) |
Educational Attainment by Field of Study in Victory Lakes
Bio, nature & agricultural (68 | 23.1%), social sciences (38 | 12.9%), arts & humanities (38 | 12.9%), literature & languages (34 | 11.6%), and liberal arts & history (33 | 11.2%) are the most common fields of study among 294 individuals in Victory Lakes who have obtained a bachelor's degree or higher.
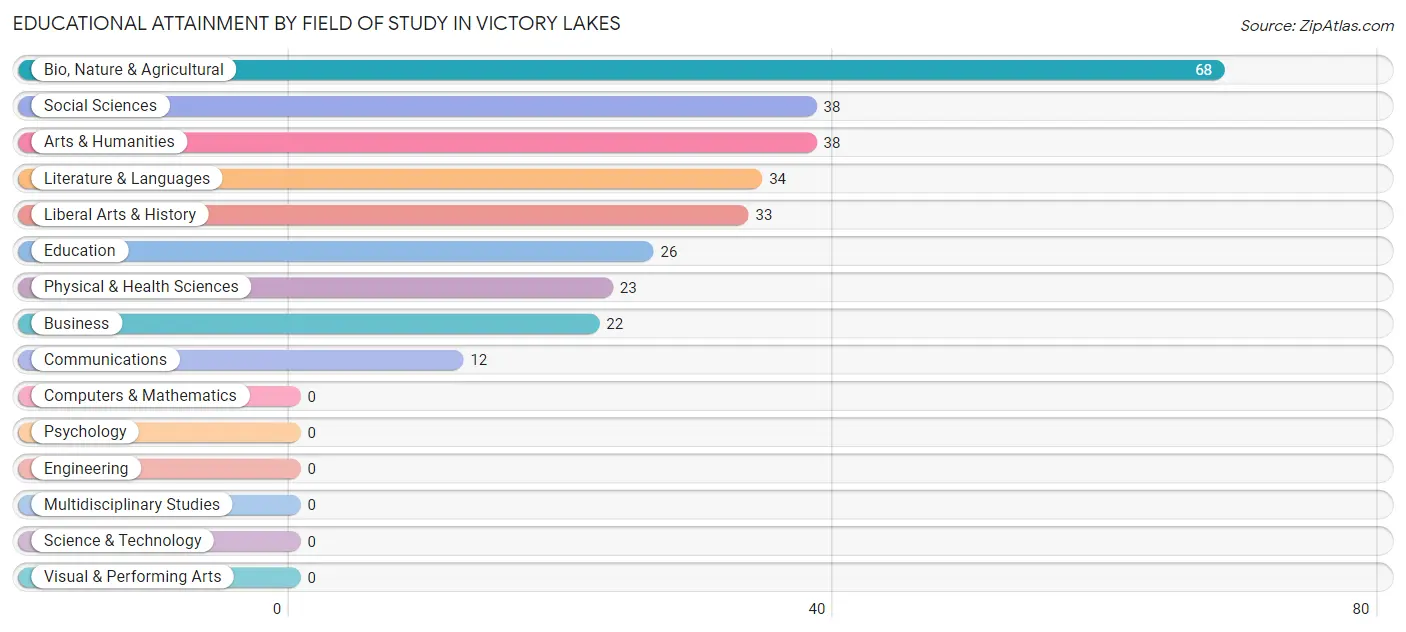
| Field of Study | # Graduates | % Graduates |
| Computers & Mathematics | 0 | 0.0% |
| Bio, Nature & Agricultural | 68 | 23.1% |
| Physical & Health Sciences | 23 | 7.8% |
| Psychology | 0 | 0.0% |
| Social Sciences | 38 | 12.9% |
| Engineering | 0 | 0.0% |
| Multidisciplinary Studies | 0 | 0.0% |
| Science & Technology | 0 | 0.0% |
| Business | 22 | 7.5% |
| Education | 26 | 8.8% |
| Literature & Languages | 34 | 11.6% |
| Liberal Arts & History | 33 | 11.2% |
| Visual & Performing Arts | 0 | 0.0% |
| Communications | 12 | 4.1% |
| Arts & Humanities | 38 | 12.9% |
| Total | 294 | 100.0% |
Transportation & Commute in Victory Lakes
Vehicle Availability by Sex in Victory Lakes
The most prevalent vehicle ownership categories in Victory Lakes are males with 1 vehicle (114, accounting for 30.4%) and females with 1 vehicle (42, making up 39.9%).
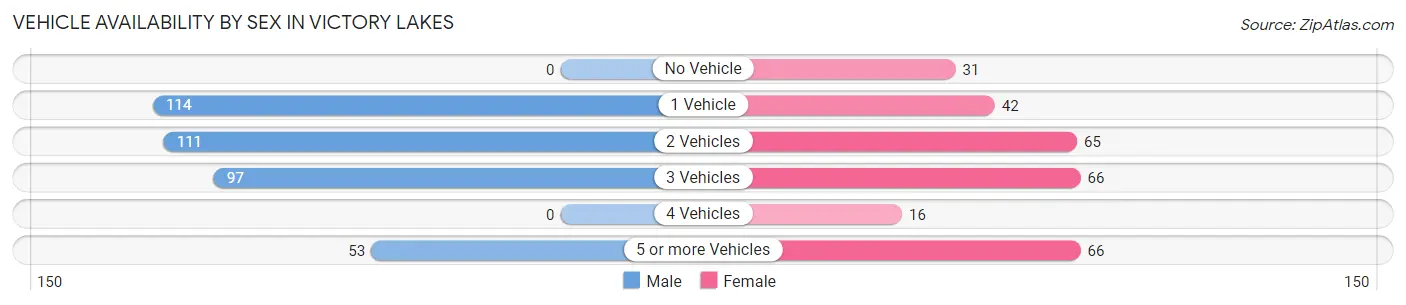
| Vehicles Available | Male | Female |
| No Vehicle | 0 (0.0%) | 31 (10.8%) |
| 1 Vehicle | 114 (30.4%) | 42 (14.7%) |
| 2 Vehicles | 111 (29.6%) | 65 (22.7%) |
| 3 Vehicles | 97 (25.9%) | 66 (23.1%) |
| 4 Vehicles | 0 (0.0%) | 16 (5.6%) |
| 5 or more Vehicles | 53 (14.1%) | 66 (23.1%) |
| Total | 375 (100.0%) | 286 (100.0%) |
Commute Time in Victory Lakes
The most frequently occuring commute durations in Victory Lakes are 20 to 24 minutes (237 commuters, 36.6%), 60 to 89 minutes (129 commuters, 19.9%), and 15 to 19 minutes (90 commuters, 13.9%).
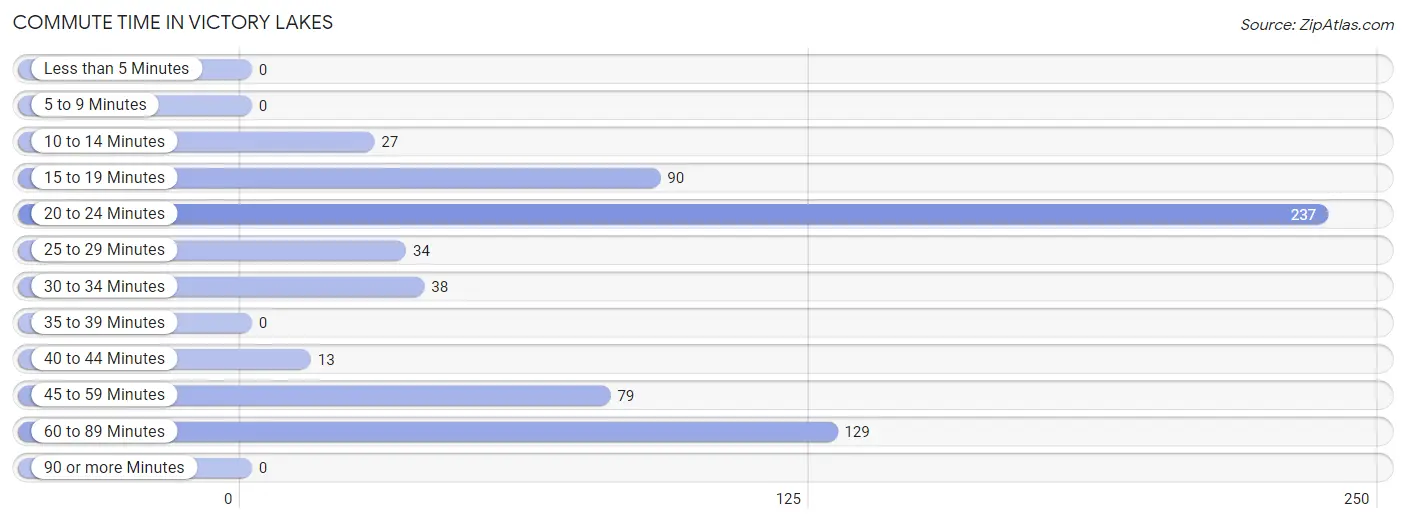
| Commute Time | # Commuters | % Commuters |
| Less than 5 Minutes | 0 | 0.0% |
| 5 to 9 Minutes | 0 | 0.0% |
| 10 to 14 Minutes | 27 | 4.2% |
| 15 to 19 Minutes | 90 | 13.9% |
| 20 to 24 Minutes | 237 | 36.6% |
| 25 to 29 Minutes | 34 | 5.3% |
| 30 to 34 Minutes | 38 | 5.9% |
| 35 to 39 Minutes | 0 | 0.0% |
| 40 to 44 Minutes | 13 | 2.0% |
| 45 to 59 Minutes | 79 | 12.2% |
| 60 to 89 Minutes | 129 | 19.9% |
| 90 or more Minutes | 0 | 0.0% |
Commute Time by Sex in Victory Lakes
The most common commute times in Victory Lakes are 20 to 24 minutes (125 commuters, 34.6%) for males and 20 to 24 minutes (112 commuters, 39.2%) for females.
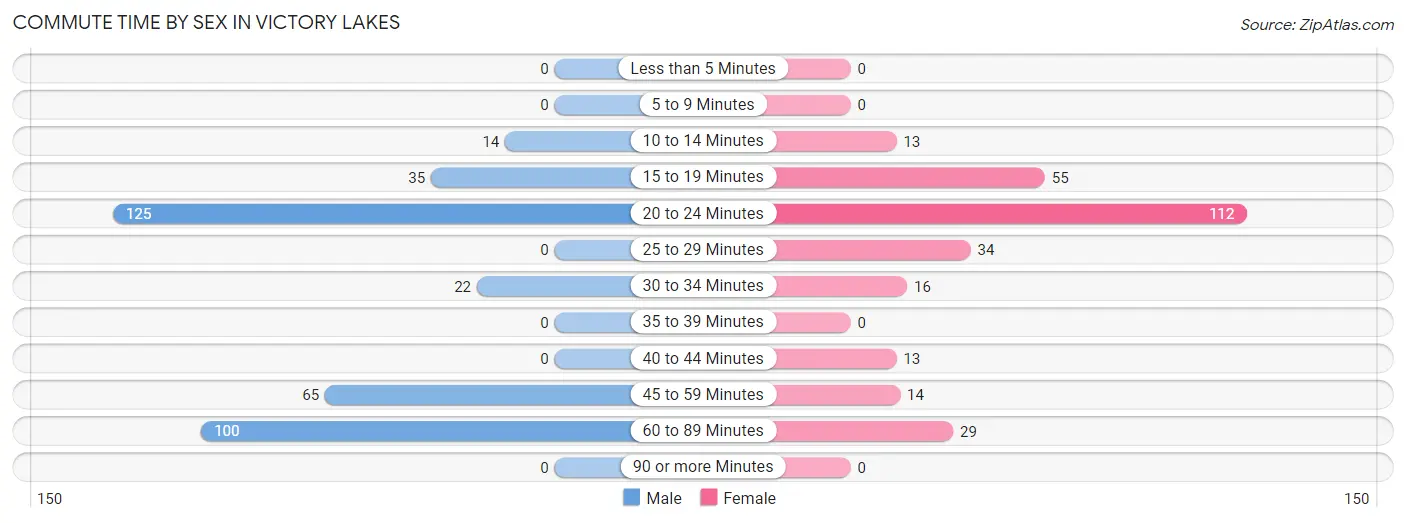
| Commute Time | Male | Female |
| Less than 5 Minutes | 0 (0.0%) | 0 (0.0%) |
| 5 to 9 Minutes | 0 (0.0%) | 0 (0.0%) |
| 10 to 14 Minutes | 14 (3.9%) | 13 (4.5%) |
| 15 to 19 Minutes | 35 (9.7%) | 55 (19.2%) |
| 20 to 24 Minutes | 125 (34.6%) | 112 (39.2%) |
| 25 to 29 Minutes | 0 (0.0%) | 34 (11.9%) |
| 30 to 34 Minutes | 22 (6.1%) | 16 (5.6%) |
| 35 to 39 Minutes | 0 (0.0%) | 0 (0.0%) |
| 40 to 44 Minutes | 0 (0.0%) | 13 (4.5%) |
| 45 to 59 Minutes | 65 (18.0%) | 14 (4.9%) |
| 60 to 89 Minutes | 100 (27.7%) | 29 (10.1%) |
| 90 or more Minutes | 0 (0.0%) | 0 (0.0%) |
Time of Departure to Work by Sex in Victory Lakes
The most frequent times of departure to work in Victory Lakes are 9:00 AM to 9:59 AM (93, 25.8%) for males and 7:00 AM to 7:29 AM (103, 36.0%) for females.
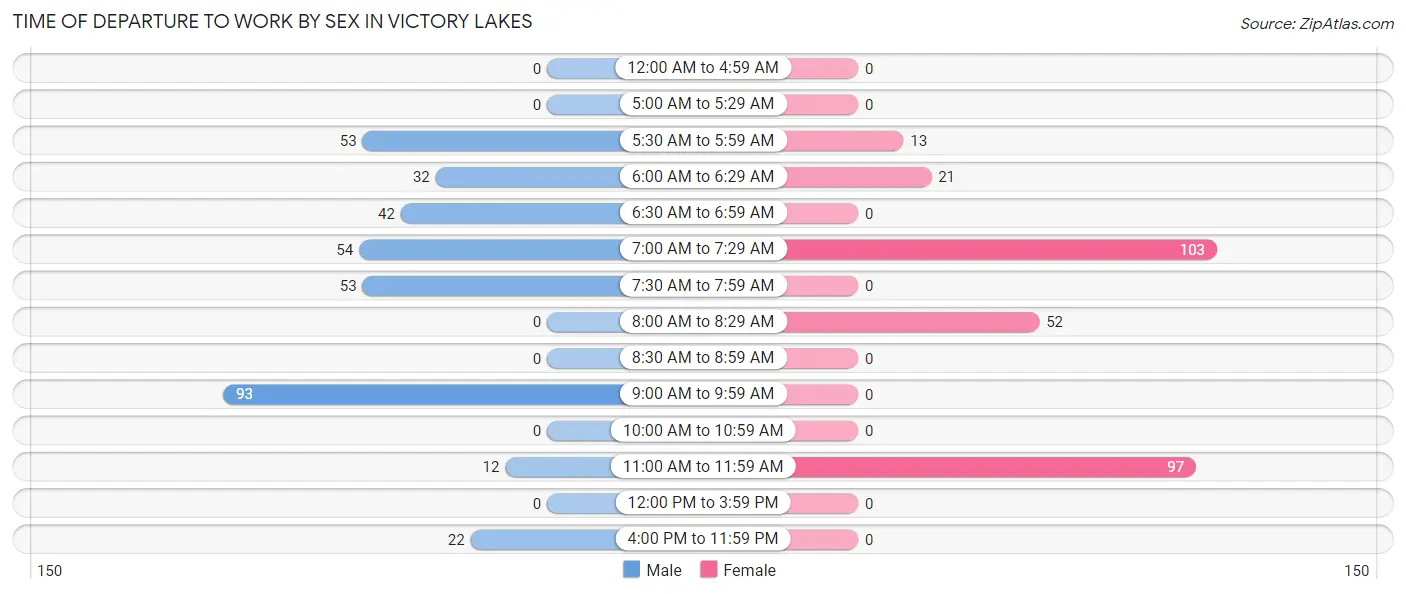
| Time of Departure | Male | Female |
| 12:00 AM to 4:59 AM | 0 (0.0%) | 0 (0.0%) |
| 5:00 AM to 5:29 AM | 0 (0.0%) | 0 (0.0%) |
| 5:30 AM to 5:59 AM | 53 (14.7%) | 13 (4.5%) |
| 6:00 AM to 6:29 AM | 32 (8.9%) | 21 (7.3%) |
| 6:30 AM to 6:59 AM | 42 (11.6%) | 0 (0.0%) |
| 7:00 AM to 7:29 AM | 54 (15.0%) | 103 (36.0%) |
| 7:30 AM to 7:59 AM | 53 (14.7%) | 0 (0.0%) |
| 8:00 AM to 8:29 AM | 0 (0.0%) | 52 (18.2%) |
| 8:30 AM to 8:59 AM | 0 (0.0%) | 0 (0.0%) |
| 9:00 AM to 9:59 AM | 93 (25.8%) | 0 (0.0%) |
| 10:00 AM to 10:59 AM | 0 (0.0%) | 0 (0.0%) |
| 11:00 AM to 11:59 AM | 12 (3.3%) | 97 (33.9%) |
| 12:00 PM to 3:59 PM | 0 (0.0%) | 0 (0.0%) |
| 4:00 PM to 11:59 PM | 22 (6.1%) | 0 (0.0%) |
| Total | 361 (100.0%) | 286 (100.0%) |
Housing Occupancy in Victory Lakes
Occupancy by Ownership in Victory Lakes
Of the total 566 dwellings in Victory Lakes, owner-occupied units account for 541 (95.6%), while renter-occupied units make up 25 (4.4%).
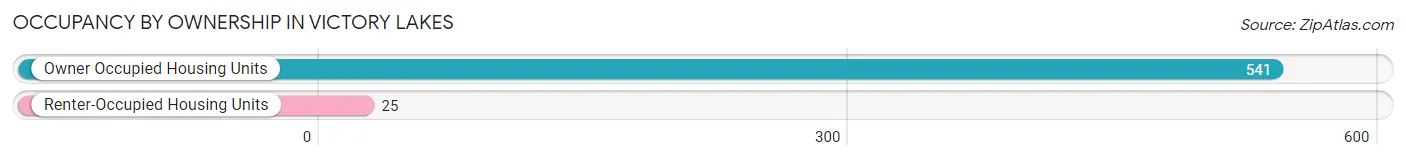
| Occupancy | # Housing Units | % Housing Units |
| Owner Occupied Housing Units | 541 | 95.6% |
| Renter-Occupied Housing Units | 25 | 4.4% |
| Total Occupied Housing Units | 566 | 100.0% |
Occupancy by Household Size in Victory Lakes
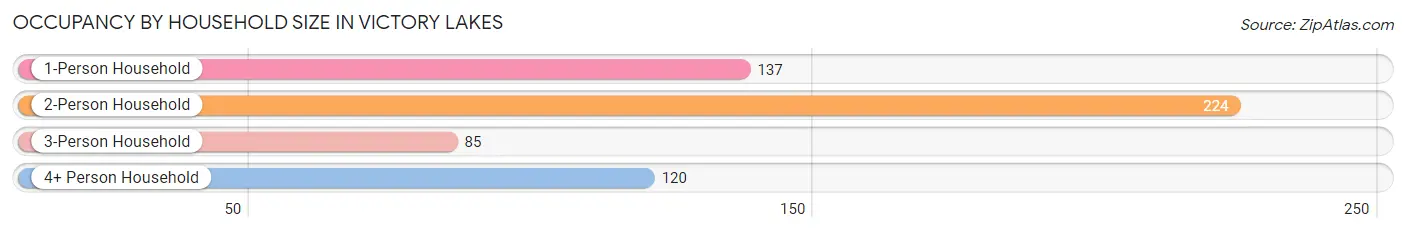
| Household Size | # Housing Units | % Housing Units |
| 1-Person Household | 137 | 24.2% |
| 2-Person Household | 224 | 39.6% |
| 3-Person Household | 85 | 15.0% |
| 4+ Person Household | 120 | 21.2% |
| Total Housing Units | 566 | 100.0% |
Occupancy by Ownership by Household Size in Victory Lakes
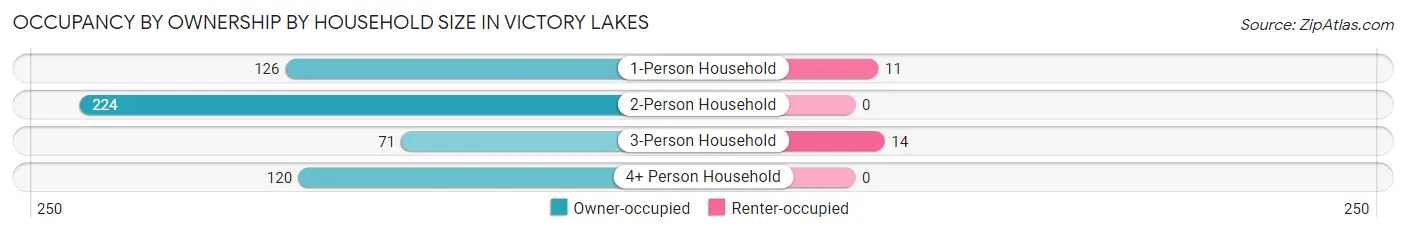
| Household Size | Owner-occupied | Renter-occupied |
| 1-Person Household | 126 (92.0%) | 11 (8.0%) |
| 2-Person Household | 224 (100.0%) | 0 (0.0%) |
| 3-Person Household | 71 (83.5%) | 14 (16.5%) |
| 4+ Person Household | 120 (100.0%) | 0 (0.0%) |
| Total Housing Units | 541 (95.6%) | 25 (4.4%) |
Occupancy by Educational Attainment in Victory Lakes
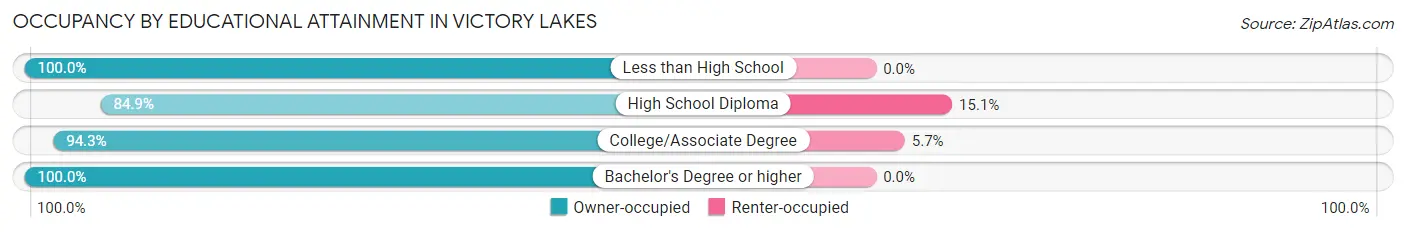
| Household Size | Owner-occupied | Renter-occupied |
| Less than High School | 70 (100.0%) | 0 (0.0%) |
| High School Diploma | 62 (84.9%) | 11 (15.1%) |
| College/Associate Degree | 232 (94.3%) | 14 (5.7%) |
| Bachelor's Degree or higher | 177 (100.0%) | 0 (0.0%) |
Occupancy by Age of Householder in Victory Lakes
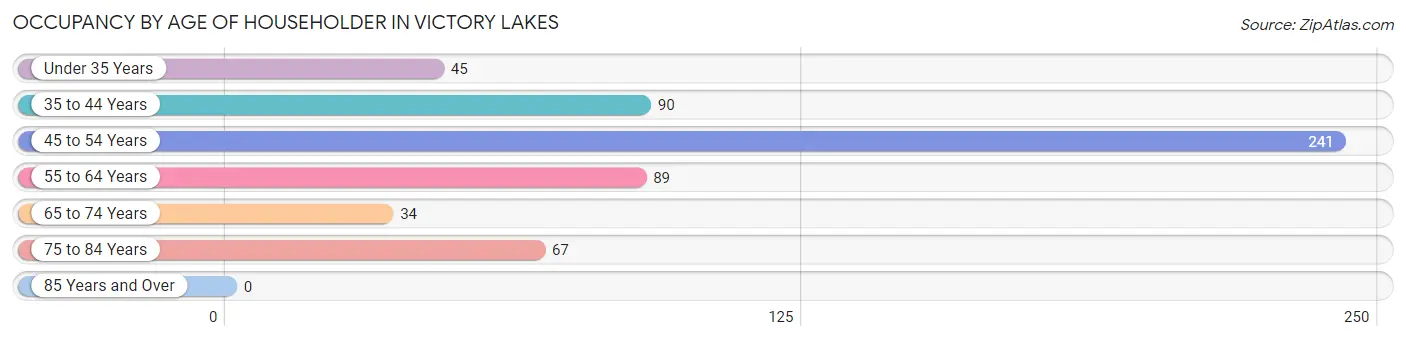
| Age Bracket | # Households | % Households |
| Under 35 Years | 45 | 8.0% |
| 35 to 44 Years | 90 | 15.9% |
| 45 to 54 Years | 241 | 42.6% |
| 55 to 64 Years | 89 | 15.7% |
| 65 to 74 Years | 34 | 6.0% |
| 75 to 84 Years | 67 | 11.8% |
| 85 Years and Over | 0 | 0.0% |
| Total | 566 | 100.0% |
Housing Finances in Victory Lakes
Median Income by Occupancy in Victory Lakes
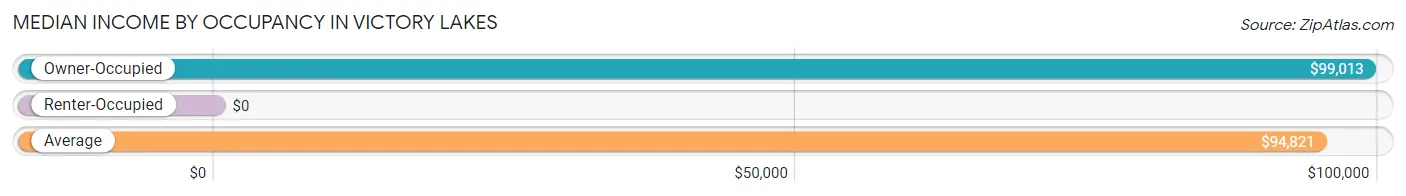
| Occupancy Type | # Households | Median Income |
| Owner-Occupied | 541 (95.6%) | $99,013 |
| Renter-Occupied | 25 (4.4%) | $0 |
| Average | 566 (100.0%) | $94,821 |
Occupancy by Householder Income Bracket in Victory Lakes
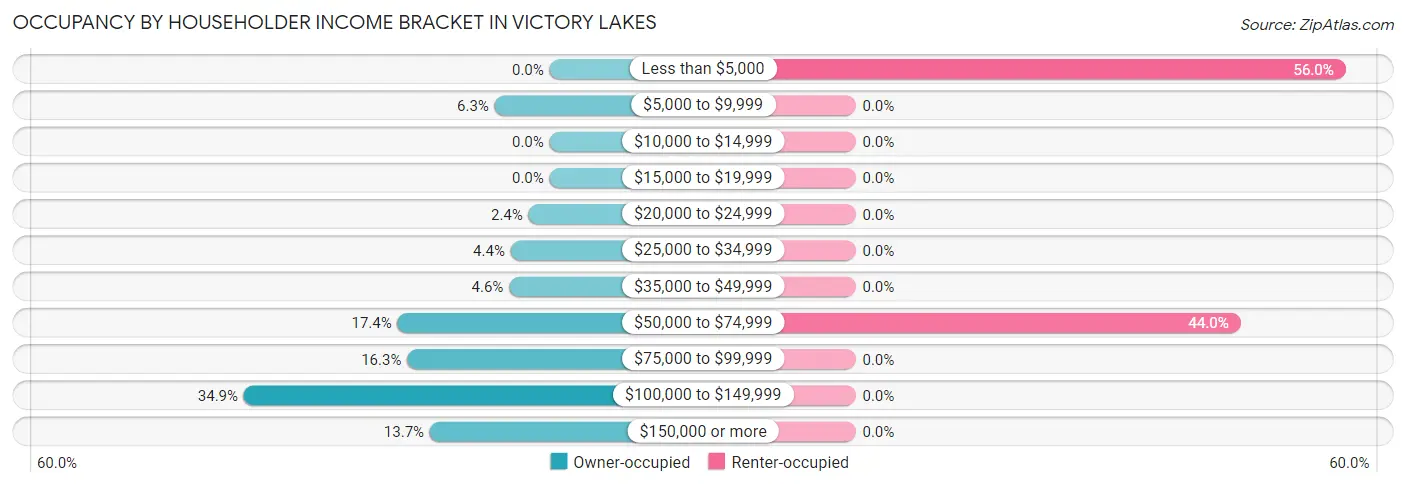
| Income Bracket | Owner-occupied | Renter-occupied |
| Less than $5,000 | 0 (0.0%) | 14 (56.0%) |
| $5,000 to $9,999 | 34 (6.3%) | 0 (0.0%) |
| $10,000 to $14,999 | 0 (0.0%) | 0 (0.0%) |
| $15,000 to $19,999 | 0 (0.0%) | 0 (0.0%) |
| $20,000 to $24,999 | 13 (2.4%) | 0 (0.0%) |
| $25,000 to $34,999 | 24 (4.4%) | 0 (0.0%) |
| $35,000 to $49,999 | 25 (4.6%) | 0 (0.0%) |
| $50,000 to $74,999 | 94 (17.4%) | 11 (44.0%) |
| $75,000 to $99,999 | 88 (16.3%) | 0 (0.0%) |
| $100,000 to $149,999 | 189 (34.9%) | 0 (0.0%) |
| $150,000 or more | 74 (13.7%) | 0 (0.0%) |
| Total | 541 (100.0%) | 25 (100.0%) |
Monthly Housing Cost Tiers in Victory Lakes
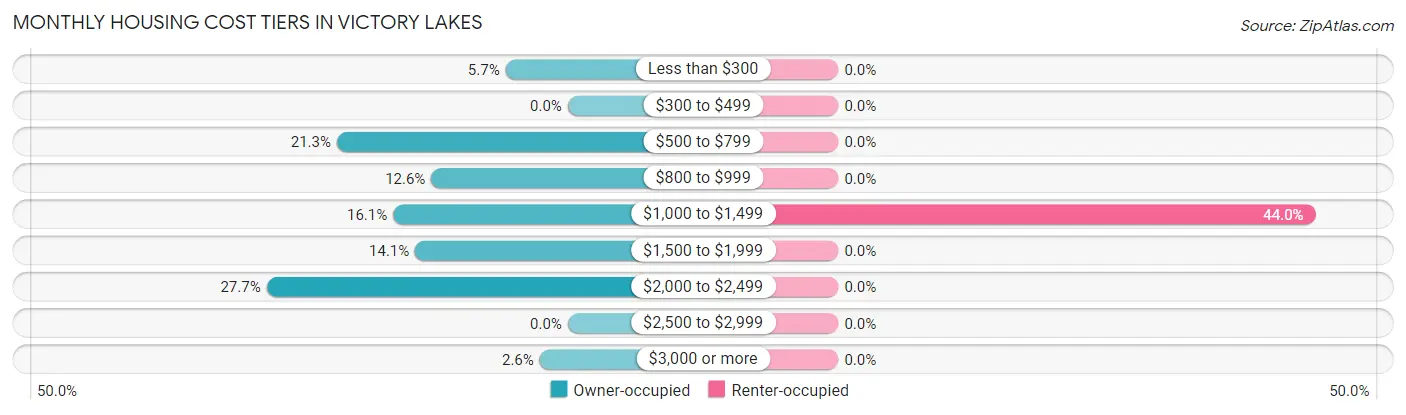
| Monthly Cost | Owner-occupied | Renter-occupied |
| Less than $300 | 31 (5.7%) | 0 (0.0%) |
| $300 to $499 | 0 (0.0%) | 0 (0.0%) |
| $500 to $799 | 115 (21.3%) | 0 (0.0%) |
| $800 to $999 | 68 (12.6%) | 0 (0.0%) |
| $1,000 to $1,499 | 87 (16.1%) | 11 (44.0%) |
| $1,500 to $1,999 | 76 (14.1%) | 0 (0.0%) |
| $2,000 to $2,499 | 150 (27.7%) | 0 (0.0%) |
| $2,500 to $2,999 | 0 (0.0%) | 0 (0.0%) |
| $3,000 or more | 14 (2.6%) | 0 (0.0%) |
| Total | 541 (100.0%) | 25 (100.0%) |
Physical Housing Characteristics in Victory Lakes
Housing Structures in Victory Lakes
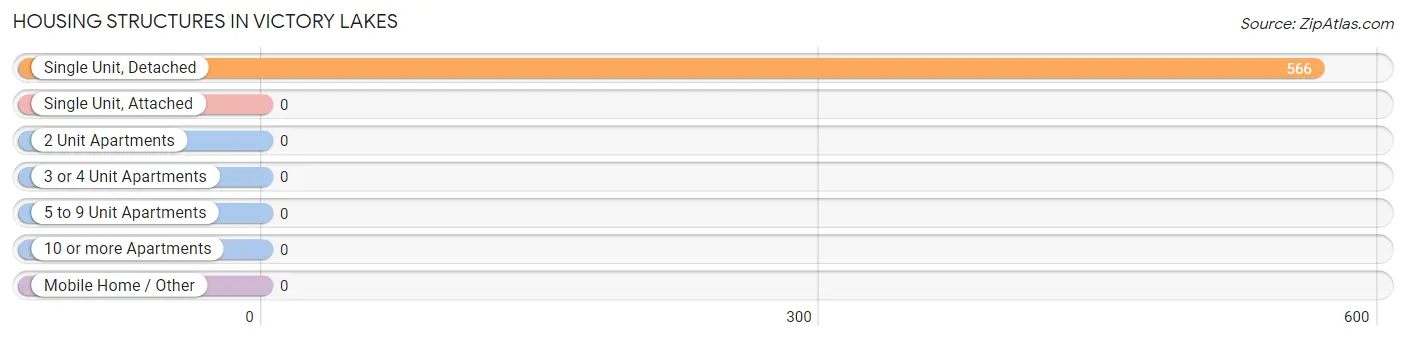
| Structure Type | # Housing Units | % Housing Units |
| Single Unit, Detached | 566 | 100.0% |
| Single Unit, Attached | 0 | 0.0% |
| 2 Unit Apartments | 0 | 0.0% |
| 3 or 4 Unit Apartments | 0 | 0.0% |
| 5 to 9 Unit Apartments | 0 | 0.0% |
| 10 or more Apartments | 0 | 0.0% |
| Mobile Home / Other | 0 | 0.0% |
| Total | 566 | 100.0% |
Housing Structures by Occupancy in Victory Lakes
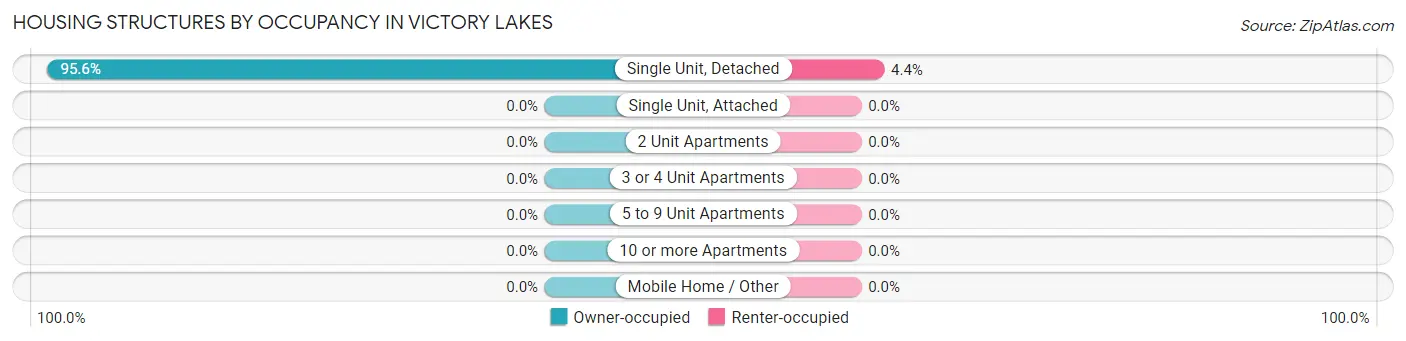
| Structure Type | Owner-occupied | Renter-occupied |
| Single Unit, Detached | 541 (95.6%) | 25 (4.4%) |
| Single Unit, Attached | 0 (0.0%) | 0 (0.0%) |
| 2 Unit Apartments | 0 (0.0%) | 0 (0.0%) |
| 3 or 4 Unit Apartments | 0 (0.0%) | 0 (0.0%) |
| 5 to 9 Unit Apartments | 0 (0.0%) | 0 (0.0%) |
| 10 or more Apartments | 0 (0.0%) | 0 (0.0%) |
| Mobile Home / Other | 0 (0.0%) | 0 (0.0%) |
| Total | 541 (95.6%) | 25 (4.4%) |
Housing Structures by Number of Rooms in Victory Lakes
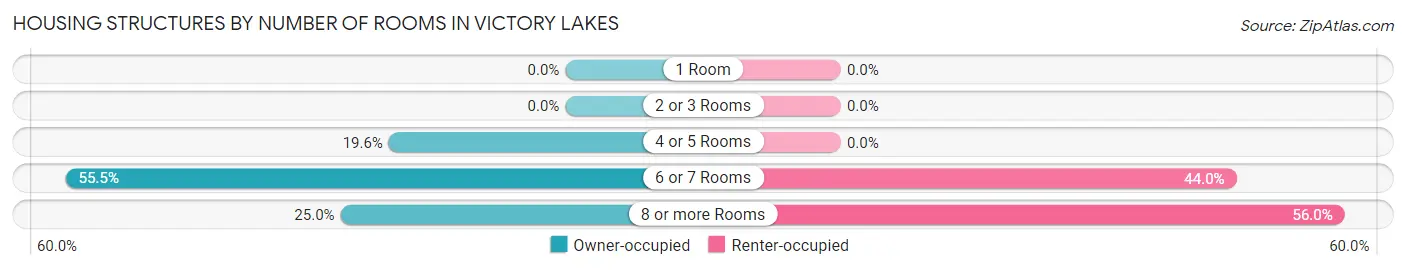
| Number of Rooms | Owner-occupied | Renter-occupied |
| 1 Room | 0 (0.0%) | 0 (0.0%) |
| 2 or 3 Rooms | 0 (0.0%) | 0 (0.0%) |
| 4 or 5 Rooms | 106 (19.6%) | 0 (0.0%) |
| 6 or 7 Rooms | 300 (55.4%) | 11 (44.0%) |
| 8 or more Rooms | 135 (24.9%) | 14 (56.0%) |
| Total | 541 (100.0%) | 25 (100.0%) |
Housing Structure by Heating Type in Victory Lakes
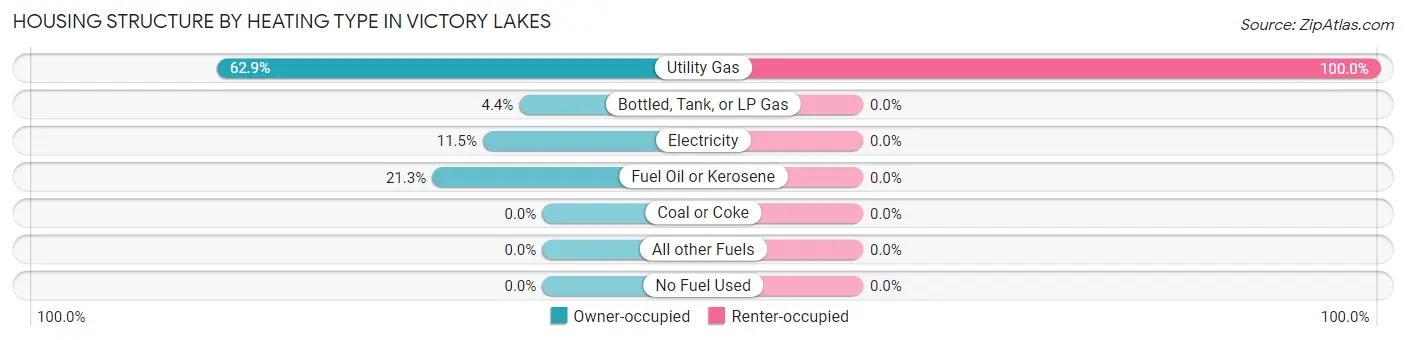
| Heating Type | Owner-occupied | Renter-occupied |
| Utility Gas | 340 (62.8%) | 25 (100.0%) |
| Bottled, Tank, or LP Gas | 24 (4.4%) | 0 (0.0%) |
| Electricity | 62 (11.5%) | 0 (0.0%) |
| Fuel Oil or Kerosene | 115 (21.3%) | 0 (0.0%) |
| Coal or Coke | 0 (0.0%) | 0 (0.0%) |
| All other Fuels | 0 (0.0%) | 0 (0.0%) |
| No Fuel Used | 0 (0.0%) | 0 (0.0%) |
| Total | 541 (100.0%) | 25 (100.0%) |
Household Vehicle Usage in Victory Lakes
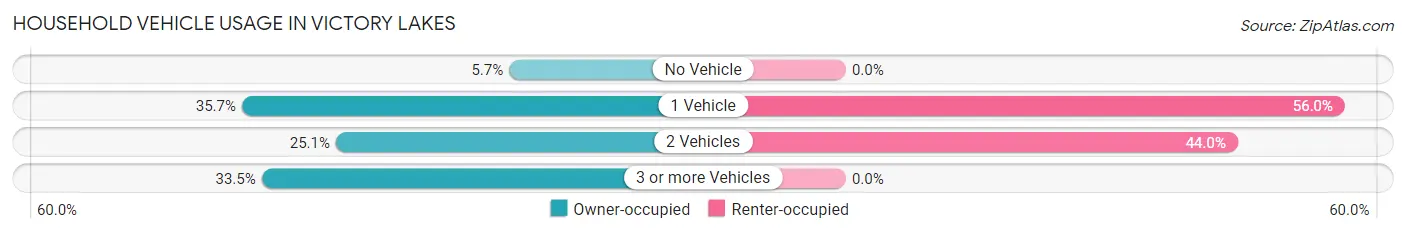
| Vehicles per Household | Owner-occupied | Renter-occupied |
| No Vehicle | 31 (5.7%) | 0 (0.0%) |
| 1 Vehicle | 193 (35.7%) | 14 (56.0%) |
| 2 Vehicles | 136 (25.1%) | 11 (44.0%) |
| 3 or more Vehicles | 181 (33.5%) | 0 (0.0%) |
| Total | 541 (100.0%) | 25 (100.0%) |
Real Estate & Mortgages in Victory Lakes
Real Estate and Mortgage Overview in Victory Lakes
| Characteristic | Without Mortgage | With Mortgage |
| Housing Units | 317 | 224 |
| Median Property Value | $174,000 | $225,500 |
| Median Household Income | $73,750 | $37 |
| Monthly Housing Costs | $884 | $14 |
| Real Estate Taxes | $6,368 | $0 |
Property Value by Mortgage Status in Victory Lakes
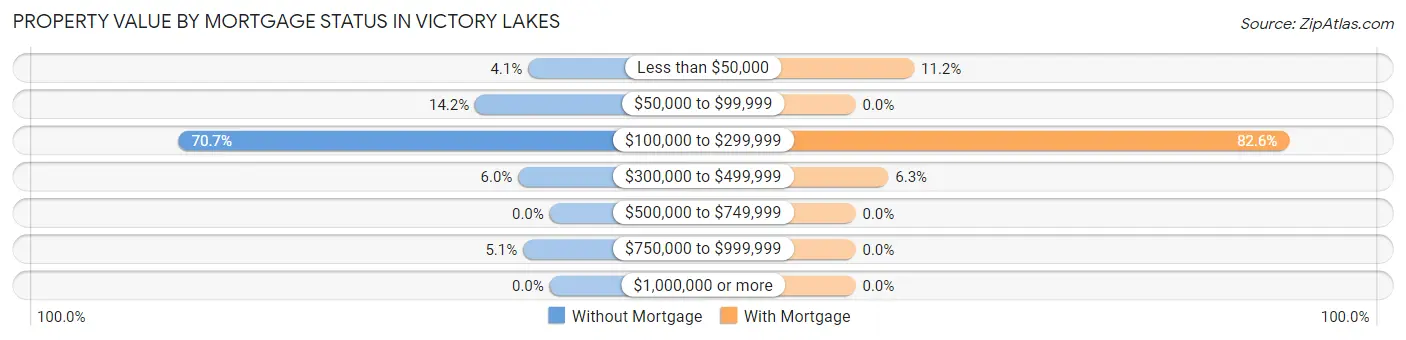
| Property Value | Without Mortgage | With Mortgage |
| Less than $50,000 | 13 (4.1%) | 25 (11.2%) |
| $50,000 to $99,999 | 45 (14.2%) | 0 (0.0%) |
| $100,000 to $299,999 | 224 (70.7%) | 185 (82.6%) |
| $300,000 to $499,999 | 19 (6.0%) | 14 (6.2%) |
| $500,000 to $749,999 | 0 (0.0%) | 0 (0.0%) |
| $750,000 to $999,999 | 16 (5.1%) | 0 (0.0%) |
| $1,000,000 or more | 0 (0.0%) | 0 (0.0%) |
| Total | 317 (100.0%) | 224 (100.0%) |
Household Income by Mortgage Status in Victory Lakes
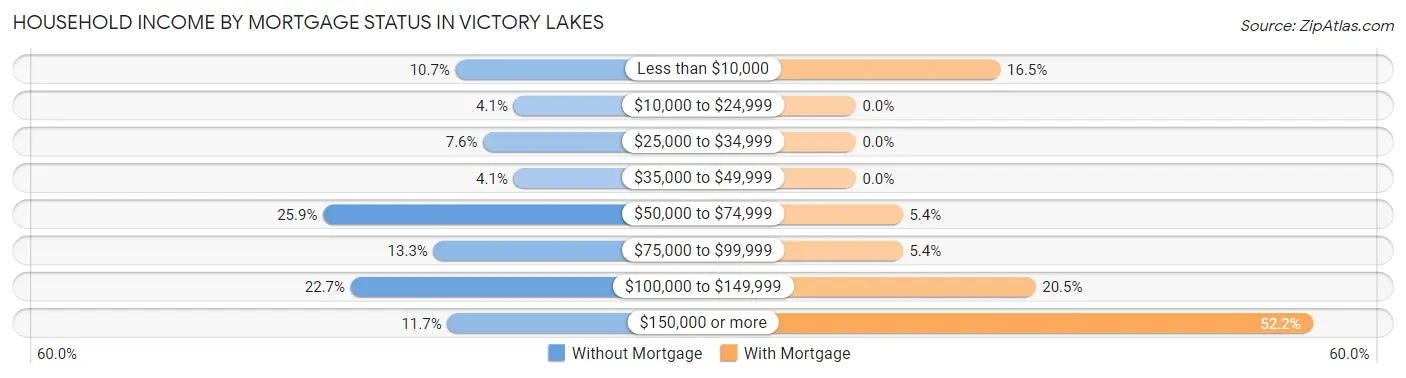
| Household Income | Without Mortgage | With Mortgage |
| Less than $10,000 | 34 (10.7%) | 37 (16.5%) |
| $10,000 to $24,999 | 13 (4.1%) | 0 (0.0%) |
| $25,000 to $34,999 | 24 (7.6%) | 0 (0.0%) |
| $35,000 to $49,999 | 13 (4.1%) | 0 (0.0%) |
| $50,000 to $74,999 | 82 (25.9%) | 12 (5.4%) |
| $75,000 to $99,999 | 42 (13.3%) | 12 (5.4%) |
| $100,000 to $149,999 | 72 (22.7%) | 46 (20.5%) |
| $150,000 or more | 37 (11.7%) | 117 (52.2%) |
| Total | 317 (100.0%) | 224 (100.0%) |
Property Value to Household Income Ratio in Victory Lakes
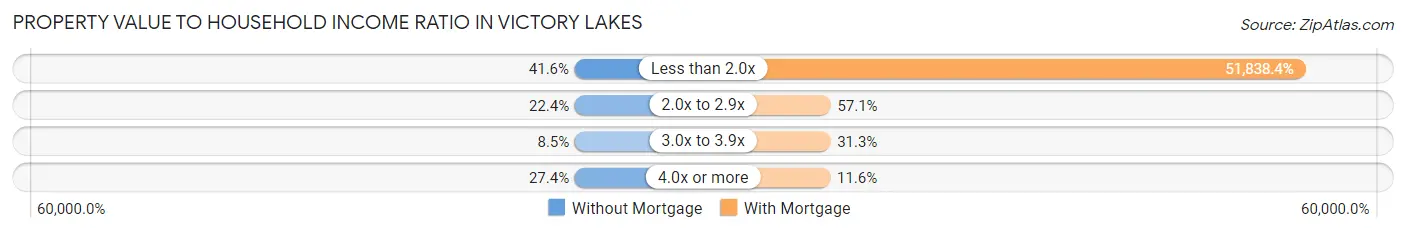
| Value-to-Income Ratio | Without Mortgage | With Mortgage |
| Less than 2.0x | 132 (41.6%) | 116,118 (51,838.4%) |
| 2.0x to 2.9x | 71 (22.4%) | 128 (57.1%) |
| 3.0x to 3.9x | 27 (8.5%) | 70 (31.2%) |
| 4.0x or more | 87 (27.4%) | 26 (11.6%) |
| Total | 317 (100.0%) | 224 (100.0%) |
Real Estate Taxes by Mortgage Status in Victory Lakes
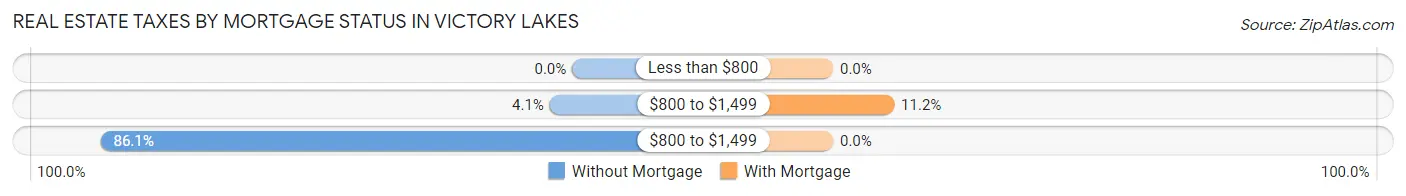
| Property Taxes | Without Mortgage | With Mortgage |
| Less than $800 | 0 (0.0%) | 0 (0.0%) |
| $800 to $1,499 | 13 (4.1%) | 25 (11.2%) |
| $800 to $1,499 | 273 (86.1%) | 0 (0.0%) |
| Total | 317 (100.0%) | 224 (100.0%) |
Health & Disability in Victory Lakes
Health Insurance Coverage by Age in Victory Lakes
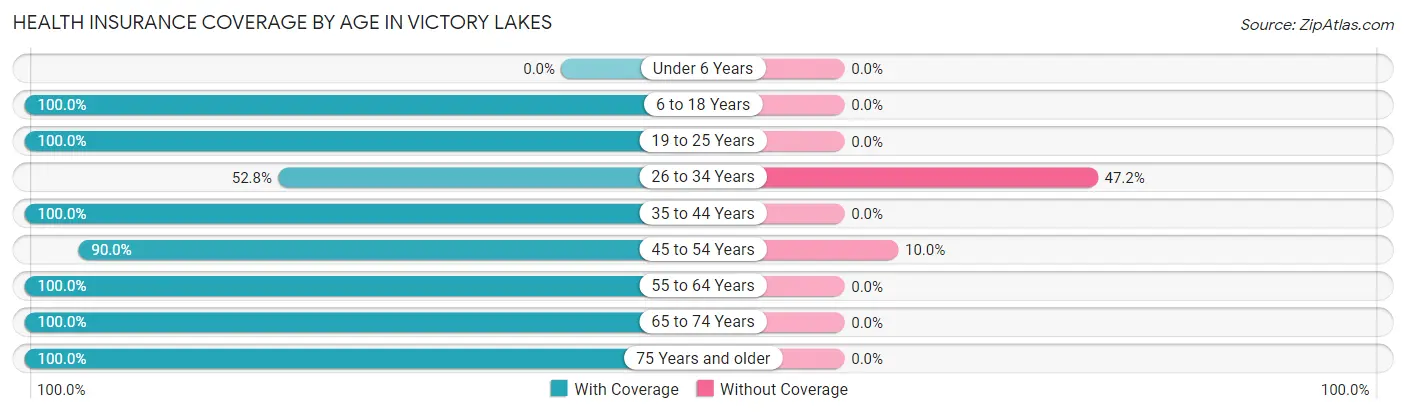
| Age Bracket | With Coverage | Without Coverage |
| Under 6 Years | 0 (0.0%) | 0 (0.0%) |
| 6 to 18 Years | 286 (100.0%) | 0 (0.0%) |
| 19 to 25 Years | 153 (100.0%) | 0 (0.0%) |
| 26 to 34 Years | 38 (52.8%) | 34 (47.2%) |
| 35 to 44 Years | 101 (100.0%) | 0 (0.0%) |
| 45 to 54 Years | 305 (90.0%) | 34 (10.0%) |
| 55 to 64 Years | 160 (100.0%) | 0 (0.0%) |
| 65 to 74 Years | 105 (100.0%) | 0 (0.0%) |
| 75 Years and older | 101 (100.0%) | 0 (0.0%) |
| Total | 1,249 (94.8%) | 68 (5.2%) |
Health Insurance Coverage by Citizenship Status in Victory Lakes
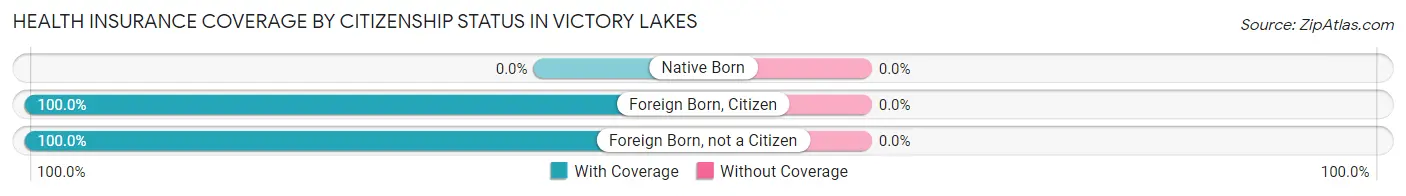
| Citizenship Status | With Coverage | Without Coverage |
| Native Born | 0 (0.0%) | 0 (0.0%) |
| Foreign Born, Citizen | 286 (100.0%) | 0 (0.0%) |
| Foreign Born, not a Citizen | 153 (100.0%) | 0 (0.0%) |
Health Insurance Coverage by Household Income in Victory Lakes
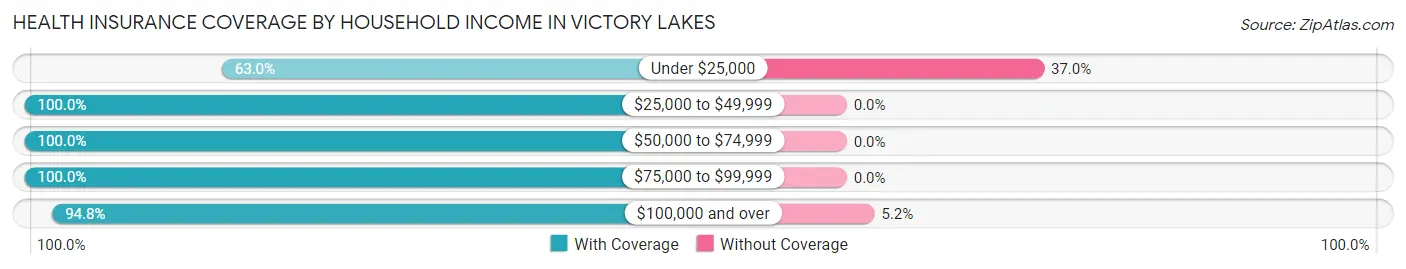
| Household Income | With Coverage | Without Coverage |
| Under $25,000 | 58 (63.0%) | 34 (37.0%) |
| $25,000 to $49,999 | 106 (100.0%) | 0 (0.0%) |
| $50,000 to $74,999 | 268 (100.0%) | 0 (0.0%) |
| $75,000 to $99,999 | 195 (100.0%) | 0 (0.0%) |
| $100,000 and over | 622 (94.8%) | 34 (5.2%) |
Public vs Private Health Insurance Coverage by Age in Victory Lakes
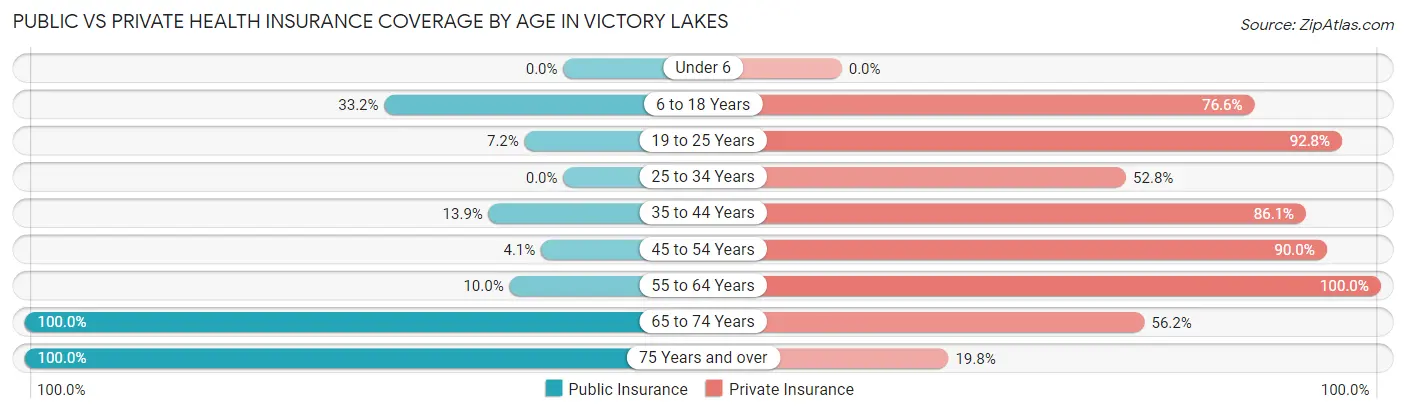
| Age Bracket | Public Insurance | Private Insurance |
| Under 6 | 0 (0.0%) | 0 (0.0%) |
| 6 to 18 Years | 95 (33.2%) | 219 (76.6%) |
| 19 to 25 Years | 11 (7.2%) | 142 (92.8%) |
| 25 to 34 Years | 0 (0.0%) | 38 (52.8%) |
| 35 to 44 Years | 14 (13.9%) | 87 (86.1%) |
| 45 to 54 Years | 14 (4.1%) | 305 (90.0%) |
| 55 to 64 Years | 16 (10.0%) | 160 (100.0%) |
| 65 to 74 Years | 105 (100.0%) | 59 (56.2%) |
| 75 Years and over | 101 (100.0%) | 20 (19.8%) |
| Total | 356 (27.0%) | 1,030 (78.2%) |
Disability Status by Sex by Age in Victory Lakes

| Age Bracket | Male | Female |
| Under 5 Years | 0 (0.0%) | 0 (0.0%) |
| 5 to 17 Years | 0 (0.0%) | 0 (0.0%) |
| 18 to 34 Years | 0 (0.0%) | 0 (0.0%) |
| 35 to 64 Years | 58 (16.6%) | 40 (15.9%) |
| 65 to 74 Years | 0 (0.0%) | 12 (17.6%) |
| 75 Years and over | 0 (0.0%) | 0 (0.0%) |
Disability Class by Sex by Age in Victory Lakes
Disability Class: Hearing Difficulty
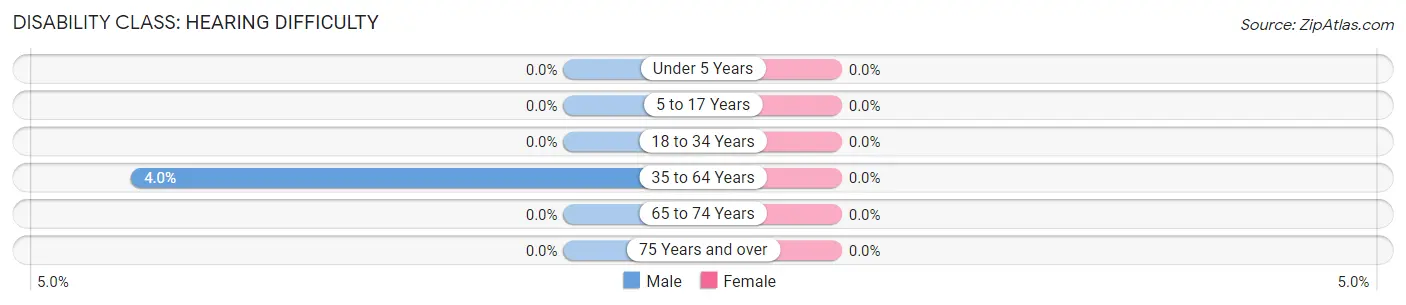
| Age Bracket | Male | Female |
| Under 5 Years | 0 (0.0%) | 0 (0.0%) |
| 5 to 17 Years | 0 (0.0%) | 0 (0.0%) |
| 18 to 34 Years | 0 (0.0%) | 0 (0.0%) |
| 35 to 64 Years | 14 (4.0%) | 0 (0.0%) |
| 65 to 74 Years | 0 (0.0%) | 0 (0.0%) |
| 75 Years and over | 0 (0.0%) | 0 (0.0%) |
Disability Class: Vision Difficulty
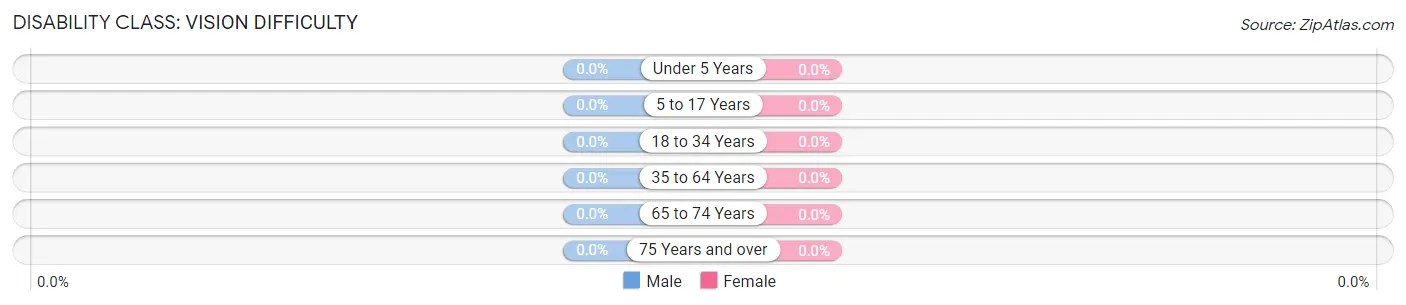
| Age Bracket | Male | Female |
| Under 5 Years | 0 (0.0%) | 0 (0.0%) |
| 5 to 17 Years | 0 (0.0%) | 0 (0.0%) |
| 18 to 34 Years | 0 (0.0%) | 0 (0.0%) |
| 35 to 64 Years | 0 (0.0%) | 0 (0.0%) |
| 65 to 74 Years | 0 (0.0%) | 0 (0.0%) |
| 75 Years and over | 0 (0.0%) | 0 (0.0%) |
Disability Class: Cognitive Difficulty
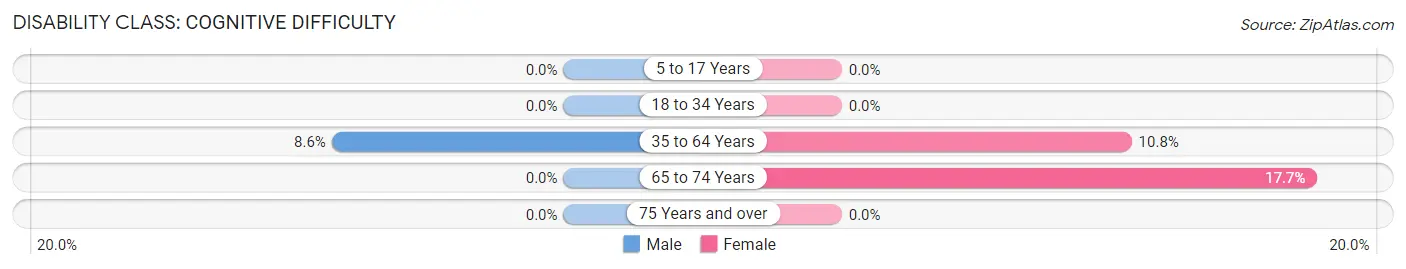
| Age Bracket | Male | Female |
| 5 to 17 Years | 0 (0.0%) | 0 (0.0%) |
| 18 to 34 Years | 0 (0.0%) | 0 (0.0%) |
| 35 to 64 Years | 30 (8.6%) | 27 (10.8%) |
| 65 to 74 Years | 0 (0.0%) | 12 (17.6%) |
| 75 Years and over | 0 (0.0%) | 0 (0.0%) |
Disability Class: Ambulatory Difficulty
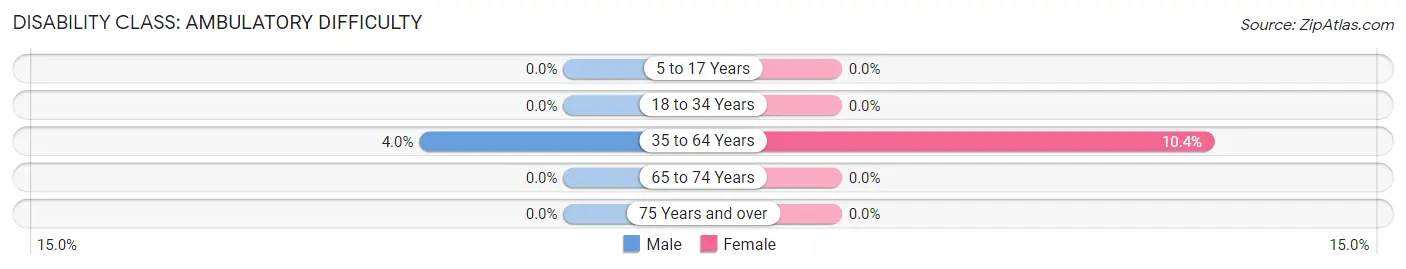
| Age Bracket | Male | Female |
| 5 to 17 Years | 0 (0.0%) | 0 (0.0%) |
| 18 to 34 Years | 0 (0.0%) | 0 (0.0%) |
| 35 to 64 Years | 14 (4.0%) | 26 (10.4%) |
| 65 to 74 Years | 0 (0.0%) | 0 (0.0%) |
| 75 Years and over | 0 (0.0%) | 0 (0.0%) |
Disability Class: Self-Care Difficulty
| Age Bracket | Male | Female |
| 5 to 17 Years | 0 (0.0%) | 0 (0.0%) |
| 18 to 34 Years | 0 (0.0%) | 0 (0.0%) |
| 35 to 64 Years | 0 (0.0%) | 0 (0.0%) |
| 65 to 74 Years | 0 (0.0%) | 0 (0.0%) |
| 75 Years and over | 0 (0.0%) | 0 (0.0%) |
Technology Access in Victory Lakes
Computing Device Access in Victory Lakes
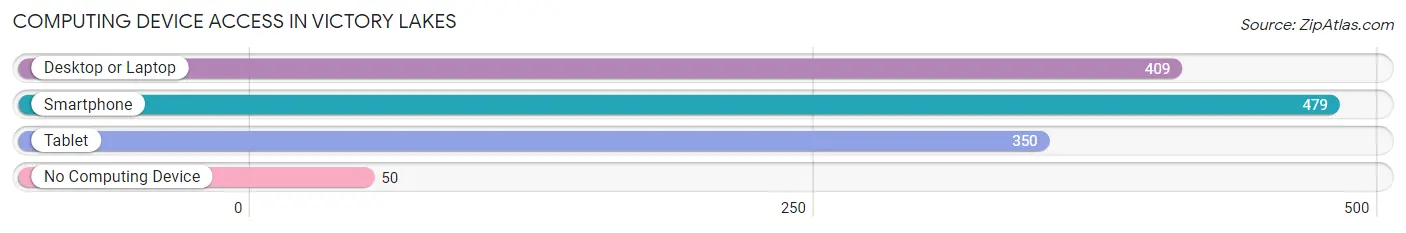
| Device Type | # Households | % Households |
| Desktop or Laptop | 409 | 72.3% |
| Smartphone | 479 | 84.6% |
| Tablet | 350 | 61.8% |
| No Computing Device | 50 | 8.8% |
| Total | 566 | 100.0% |
Internet Access in Victory Lakes
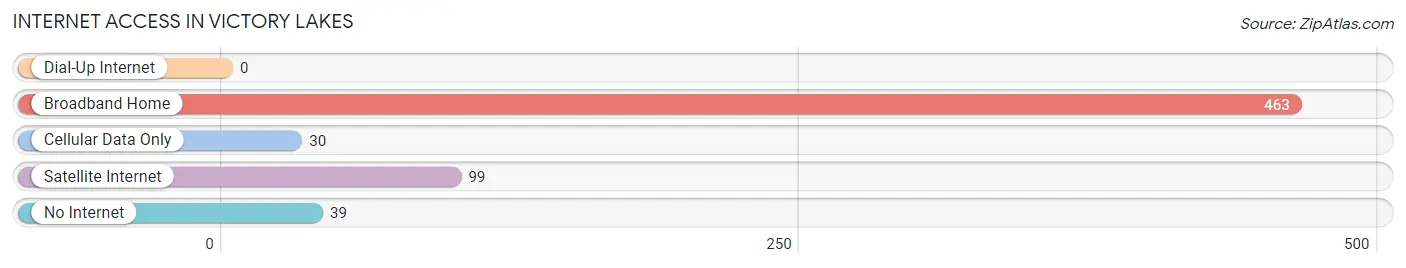
| Internet Type | # Households | % Households |
| Dial-Up Internet | 0 | 0.0% |
| Broadband Home | 463 | 81.8% |
| Cellular Data Only | 30 | 5.3% |
| Satellite Internet | 99 | 17.5% |
| No Internet | 39 | 6.9% |
| Total | 566 | 100.0% |
Victory Lakes Summary
Victory Lakes is a small borough located in Atlantic County, New Jersey. It is situated on the border of Egg Harbor Township and Hamilton Township, and is part of the Greater Atlantic City Metropolitan Area. The borough was incorporated in 1925 and has a population of approximately 1,500 people.
Geography
Victory Lakes is located in the Atlantic Coastal Plain region of New Jersey. It is situated on the border of Egg Harbor Township and Hamilton Township, and is part of the Greater Atlantic City Metropolitan Area. The borough is located at 39°30'N 74°37'W and has an area of 0.7 square miles. The terrain is mostly flat, with some rolling hills. The highest point in the borough is located at an elevation of approximately 40 feet above sea level.
The climate in Victory Lakes is classified as humid subtropical, with hot, humid summers and mild winters. The average annual temperature is around 60°F, with an average high of around 80°F in the summer and an average low of around 40°F in the winter. The average annual precipitation is around 45 inches.
Demographics
As of the 2010 census, Victory Lakes had a population of 1,521 people. The racial makeup of the borough was 94.3% White, 2.2% African American, 0.7% Asian, 0.4% from other races, and 2.4% from two or more races. Hispanic or Latino of any race were 2.2% of the population.
The median household income in Victory Lakes was $50,938 in 2010, and the median family income was $60,000. The per capita income was $25,938. About 8.3% of families and 10.2% of the population were below the poverty line, including 14.3% of those under age 18 and 6.3% of those age 65 or over.
Economy
Victory Lakes has a small, but diverse economy. The borough is home to a variety of businesses, including retail stores, restaurants, and professional services. The largest employers in the borough are the Atlantic City International Airport, the Atlantic City Convention Center, and the Atlantic City Boardwalk.
The borough also has a thriving tourism industry, with many visitors coming to the area to enjoy the beaches, boardwalk, and other attractions. The Atlantic City International Airport is located just outside of Victory Lakes, and provides easy access to the rest of the region.
History
Victory Lakes was originally part of Egg Harbor Township, but was incorporated as its own borough in 1925. The borough was named after the nearby Victory Lakes, which were created in the early 1900s as part of a drainage project.
The borough has a long history of agriculture, with many of the original settlers being farmers. The borough was also home to a number of resorts and hotels, which attracted visitors from all over the region.
In the 1950s, Victory Lakes began to experience a population boom, as many people moved to the area to take advantage of the booming economy. The borough continued to grow throughout the 1960s and 1970s, and by the 1980s, it had become a popular destination for tourists and retirees.
Today, Victory Lakes is a vibrant community with a diverse population and economy. The borough is home to a variety of businesses, and is a popular destination for tourists and retirees.
Common Questions
What is Per Capita Income in Victory Lakes?
Per Capita income in Victory Lakes is $40,446.
What is the Median Family Income in Victory Lakes?
Median Family Income in Victory Lakes is $92,857.
What is the Median Household income in Victory Lakes?
Median Household Income in Victory Lakes is $94,821.
What is Inequality or Gini Index in Victory Lakes?
Inequality or Gini Index in Victory Lakes is 0.30.
What is the Total Population of Victory Lakes?
Total Population of Victory Lakes is 1,322.
What is the Total Male Population of Victory Lakes?
Total Male Population of Victory Lakes is 675.
What is the Total Female Population of Victory Lakes?
Total Female Population of Victory Lakes is 647.
What is the Ratio of Males per 100 Females in Victory Lakes?
There are 104.33 Males per 100 Females in Victory Lakes.
What is the Ratio of Females per 100 Males in Victory Lakes?
There are 95.85 Females per 100 Males in Victory Lakes.
What is the Median Population Age in Victory Lakes?
Median Population Age in Victory Lakes is 45.7 Years.
What is the Average Family Size in Victory Lakes
Average Family Size in Victory Lakes is 2.8 People.
What is the Average Household Size in Victory Lakes
Average Household Size in Victory Lakes is 2.3 People.
How Large is the Labor Force in Victory Lakes?
There are 762 People in the Labor Forcein in Victory Lakes.
What is the Percentage of People in the Labor Force in Victory Lakes?
67.5% of People are in the Labor Force in Victory Lakes.
What is the Unemployment Rate in Victory Lakes?
Unemployment Rate in Victory Lakes is 10.6%.