Leonardo, NJ Map & Demographics
Leonardo Map
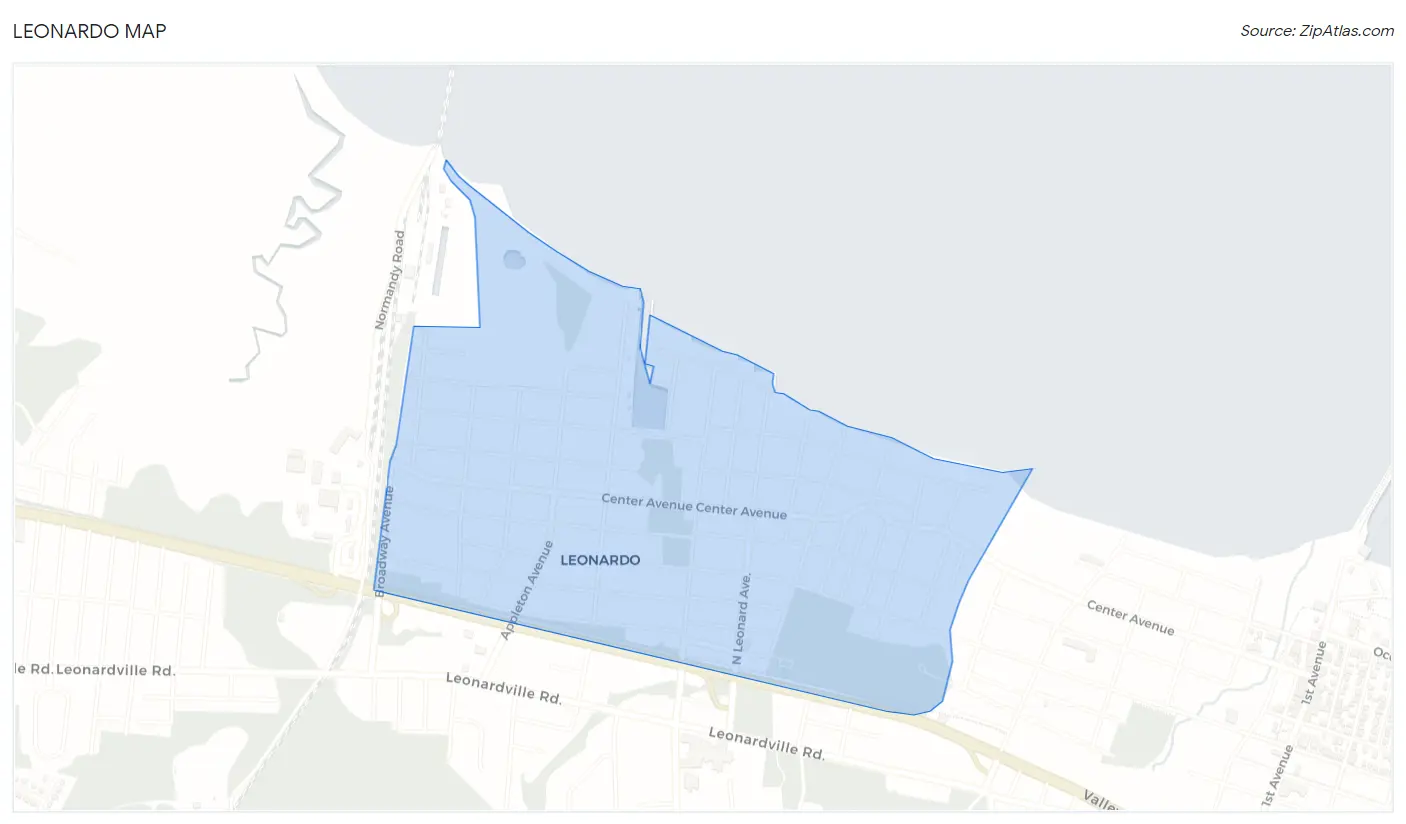
Leonardo Overview
$45,697
PER CAPITA INCOME
$124,273
AVG FAMILY INCOME
$113,750
AVG HOUSEHOLD INCOME
23.6%
WAGE / INCOME GAP [ % ]
76.4¢/ $1
WAGE / INCOME GAP [ $ ]
0.35
INEQUALITY / GINI INDEX
2,336
TOTAL POPULATION
1,209
MALE POPULATION
1,127
FEMALE POPULATION
107.28
MALES / 100 FEMALES
93.22
FEMALES / 100 MALES
37.1
MEDIAN AGE
3.1
AVG FAMILY SIZE
2.5
AVG HOUSEHOLD SIZE
1,355
LABOR FORCE [ PEOPLE ]
68.7%
PERCENT IN LABOR FORCE
5.6%
UNEMPLOYMENT RATE
Leonardo Zip Codes
Leonardo Area Codes
Income in Leonardo
Income Overview in Leonardo
Per Capita Income in Leonardo is $45,697, while median incomes of families and households are $124,273 and $113,750 respectively.
| Characteristic | Number | Measure |
| Per Capita Income | 2,336 | $45,697 |
| Median Family Income | 627 | $124,273 |
| Mean Family Income | 627 | $135,613 |
| Median Household Income | 925 | $113,750 |
| Mean Household Income | 925 | $114,736 |
| Income Deficit | 627 | $0 |
| Wage / Income Gap (%) | 2,336 | 23.57% |
| Wage / Income Gap ($) | 2,336 | 76.43¢ per $1 |
| Gini / Inequality Index | 2,336 | 0.35 |
Earnings by Sex in Leonardo
Average Earnings in Leonardo are $46,159, $57,627 for men and $44,044 for women, a difference of 23.6%.
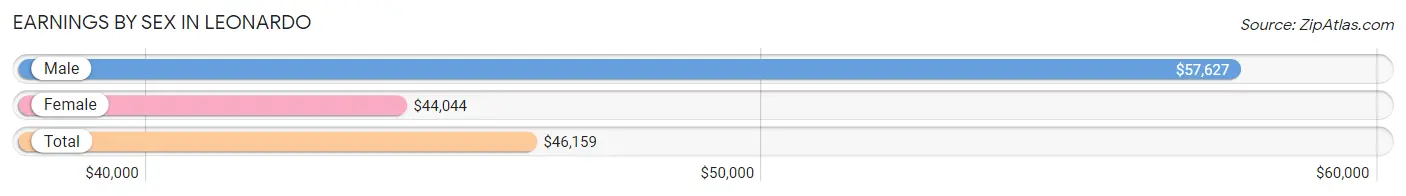
| Sex | Number | Average Earnings |
| Male | 728 (50.1%) | $57,627 |
| Female | 724 (49.9%) | $44,044 |
| Total | 1,452 (100.0%) | $46,159 |
Earnings by Sex by Income Bracket in Leonardo
The most common earnings brackets in Leonardo are $100,000+ for men (232 | 31.9%) and $65,000 to $74,999 for women (106 | 14.6%).
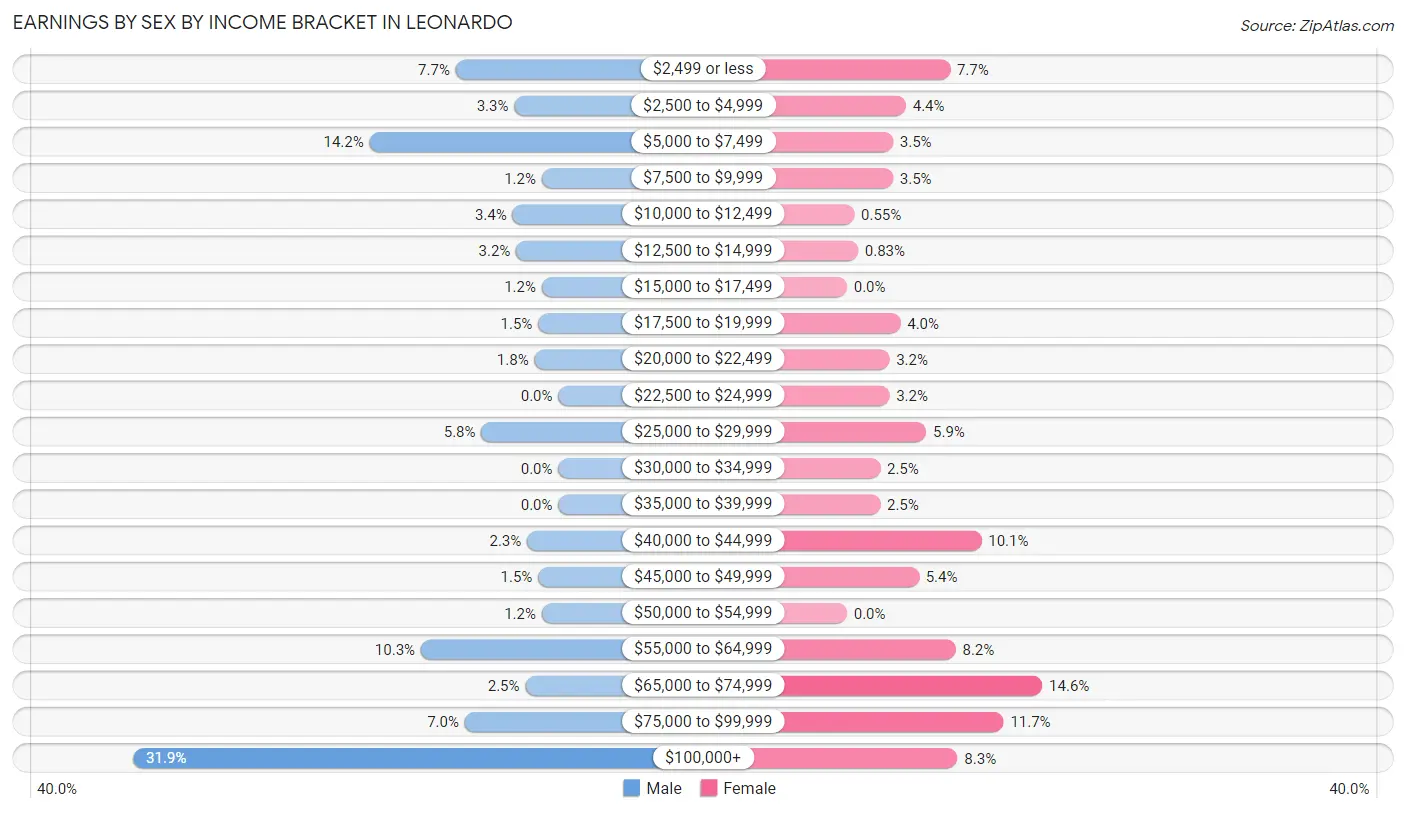
| Income | Male | Female |
| $2,499 or less | 56 (7.7%) | 56 (7.7%) |
| $2,500 to $4,999 | 24 (3.3%) | 32 (4.4%) |
| $5,000 to $7,499 | 103 (14.1%) | 25 (3.5%) |
| $7,500 to $9,999 | 9 (1.2%) | 25 (3.5%) |
| $10,000 to $12,499 | 25 (3.4%) | 4 (0.5%) |
| $12,500 to $14,999 | 23 (3.2%) | 6 (0.8%) |
| $15,000 to $17,499 | 9 (1.2%) | 0 (0.0%) |
| $17,500 to $19,999 | 11 (1.5%) | 29 (4.0%) |
| $20,000 to $22,499 | 13 (1.8%) | 23 (3.2%) |
| $22,500 to $24,999 | 0 (0.0%) | 23 (3.2%) |
| $25,000 to $29,999 | 42 (5.8%) | 43 (5.9%) |
| $30,000 to $34,999 | 0 (0.0%) | 18 (2.5%) |
| $35,000 to $39,999 | 0 (0.0%) | 18 (2.5%) |
| $40,000 to $44,999 | 17 (2.3%) | 73 (10.1%) |
| $45,000 to $49,999 | 11 (1.5%) | 39 (5.4%) |
| $50,000 to $54,999 | 9 (1.2%) | 0 (0.0%) |
| $55,000 to $64,999 | 75 (10.3%) | 59 (8.2%) |
| $65,000 to $74,999 | 18 (2.5%) | 106 (14.6%) |
| $75,000 to $99,999 | 51 (7.0%) | 85 (11.7%) |
| $100,000+ | 232 (31.9%) | 60 (8.3%) |
| Total | 728 (100.0%) | 724 (100.0%) |
Earnings by Sex by Educational Attainment in Leonardo
Average earnings in Leonardo are $98,235 for men and $46,985 for women, a difference of 52.2%. Men with an educational attainment of college or associate's degree enjoy the highest average annual earnings of $106,667, while those with bachelor's degree education earn the least with $58,606. Women with an educational attainment of bachelor's degree earn the most with the average annual earnings of $66,771, while those with college or associate's degree education have the smallest earnings of $41,719.
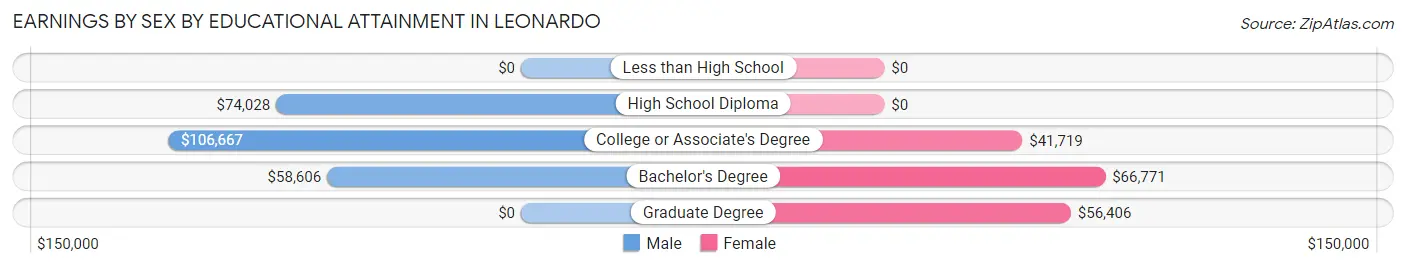
| Educational Attainment | Male Income | Female Income |
| Less than High School | - | - |
| High School Diploma | $74,028 | $0 |
| College or Associate's Degree | $106,667 | $41,719 |
| Bachelor's Degree | $58,606 | $66,771 |
| Graduate Degree | - | - |
| Total | $98,235 | $46,985 |
Family Income in Leonardo
Family Income Brackets in Leonardo
According to the Leonardo family income data, there are 212 families falling into the $100,000 to $149,999 income range, which is the most common income bracket and makes up 33.8% of all families.
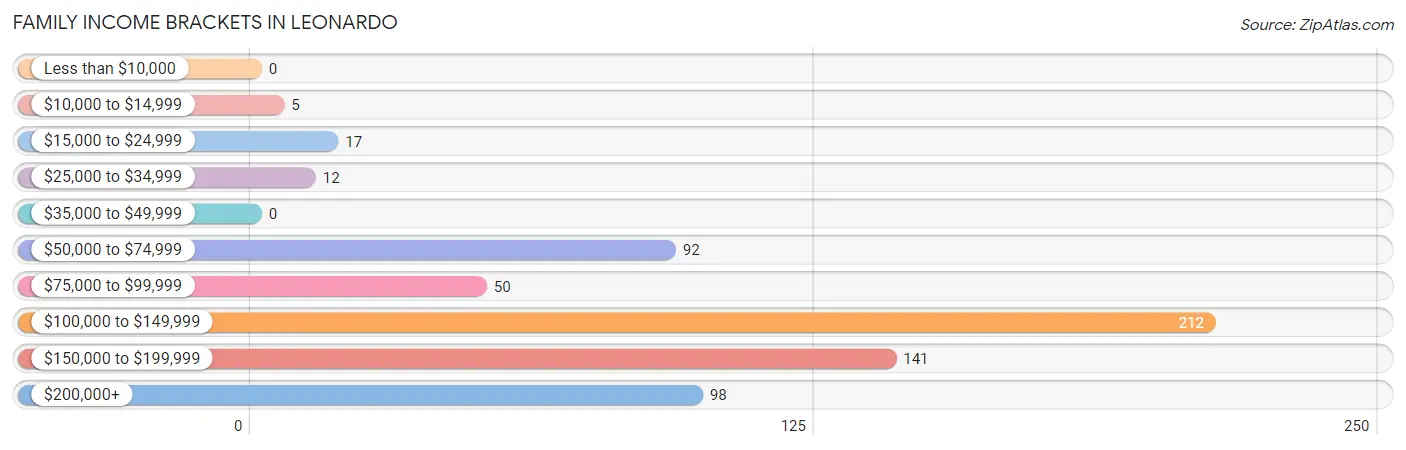
| Income Bracket | # Families | % Families |
| Less than $10,000 | 0 | 0.0% |
| $10,000 to $14,999 | 5 | 0.8% |
| $15,000 to $24,999 | 17 | 2.7% |
| $25,000 to $34,999 | 12 | 1.9% |
| $35,000 to $49,999 | 0 | 0.0% |
| $50,000 to $74,999 | 92 | 14.7% |
| $75,000 to $99,999 | 50 | 8.0% |
| $100,000 to $149,999 | 212 | 33.8% |
| $150,000 to $199,999 | 141 | 22.5% |
| $200,000+ | 98 | 15.6% |
Family Income by Famaliy Size in Leonardo
4-person families (109 | 17.4%) account for the highest median family income in Leonardo with $157,961 per family, while 2-person families (266 | 42.4%) have the highest median income of $63,550 per family member.
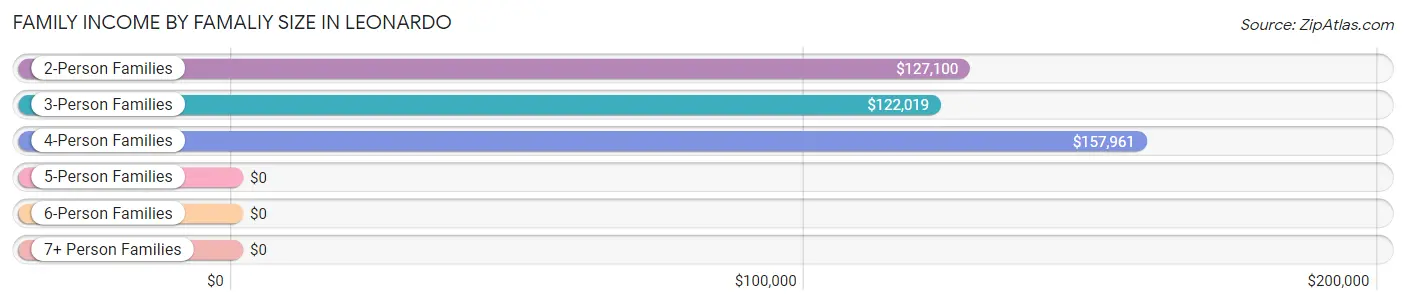
| Income Bracket | # Families | Median Income |
| 2-Person Families | 266 (42.4%) | $127,100 |
| 3-Person Families | 173 (27.6%) | $122,019 |
| 4-Person Families | 109 (17.4%) | $157,961 |
| 5-Person Families | 72 (11.5%) | $0 |
| 6-Person Families | 0 (0.0%) | $0 |
| 7+ Person Families | 7 (1.1%) | $0 |
| Total | 627 (100.0%) | $124,273 |
Family Income by Number of Earners in Leonardo
The median family income in Leonardo is $124,273, with families comprising 3+ earners (141) having the highest median family income of $133,750, while families with no earners (89) have the lowest median family income of $86,477, accounting for 22.5% and 14.2% of families, respectively.
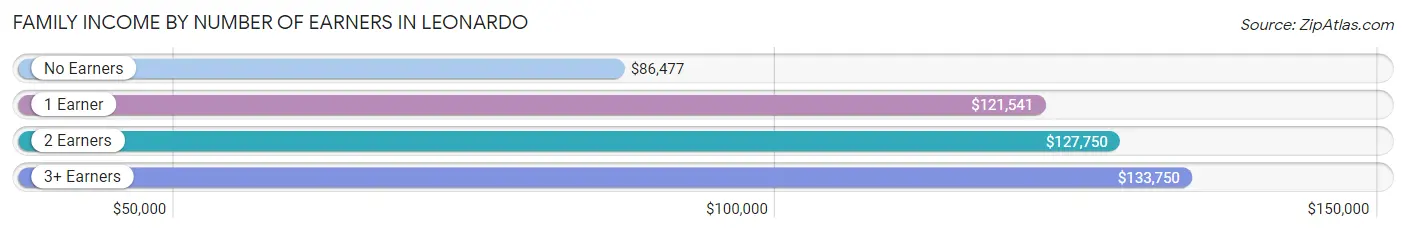
| Number of Earners | # Families | Median Income |
| No Earners | 89 (14.2%) | $86,477 |
| 1 Earner | 123 (19.6%) | $121,541 |
| 2 Earners | 274 (43.7%) | $127,750 |
| 3+ Earners | 141 (22.5%) | $133,750 |
| Total | 627 (100.0%) | $124,273 |
Household Income in Leonardo
Household Income Brackets in Leonardo
With 252 households falling in the category, the $100,000 to $149,999 income range is the most frequent in Leonardo, accounting for 27.2% of all households.
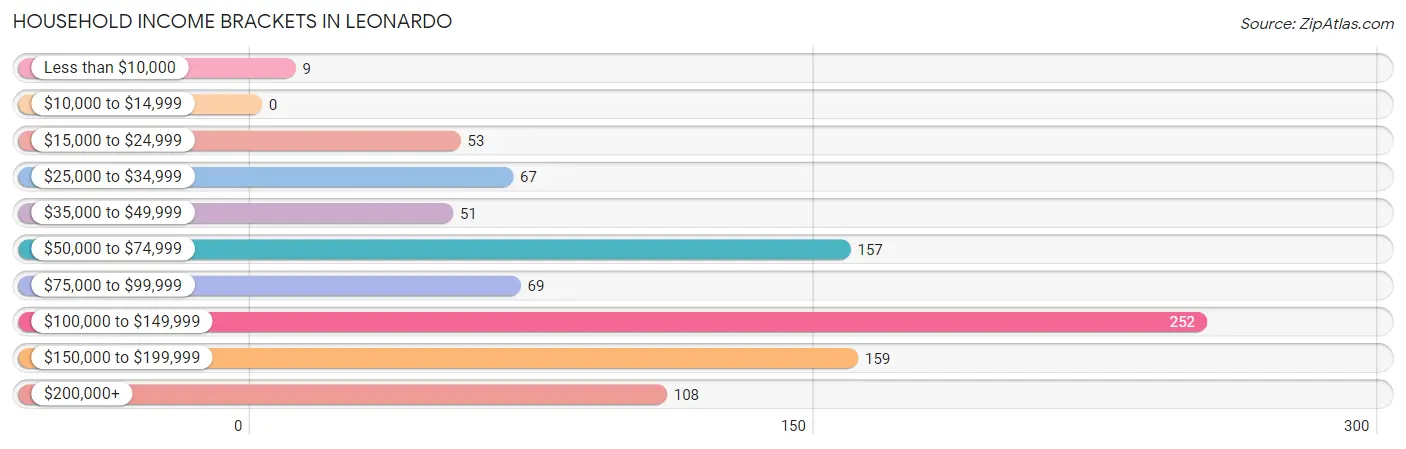
| Income Bracket | # Households | % Households |
| Less than $10,000 | 9 | 1.0% |
| $10,000 to $14,999 | 0 | 0.0% |
| $15,000 to $24,999 | 53 | 5.7% |
| $25,000 to $34,999 | 67 | 7.2% |
| $35,000 to $49,999 | 51 | 5.5% |
| $50,000 to $74,999 | 157 | 17.0% |
| $75,000 to $99,999 | 69 | 7.5% |
| $100,000 to $149,999 | 252 | 27.2% |
| $150,000 to $199,999 | 159 | 17.2% |
| $200,000+ | 108 | 11.7% |
Household Income by Householder Age in Leonardo
The median household income in Leonardo is $113,750, with the highest median household income of $122,471 found in the 45 to 64 years age bracket for the primary householder. A total of 353 households (38.2%) fall into this category. Meanwhile, the 15 to 24 years age bracket for the primary householder has the lowest median household income of $0, with 28 households (3.0%) in this group.
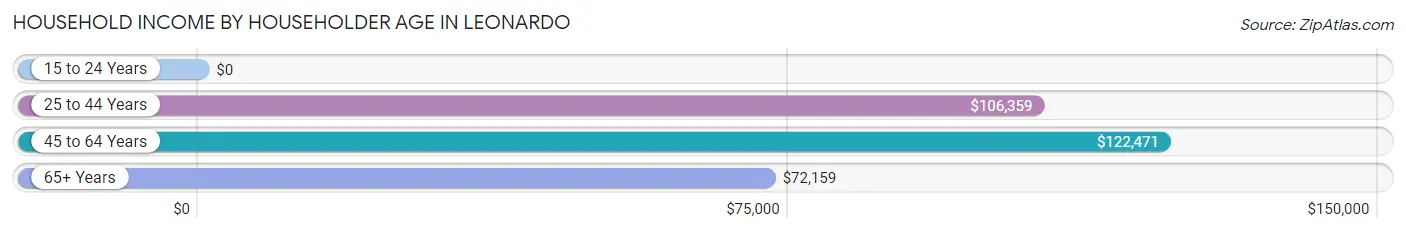
| Income Bracket | # Households | Median Income |
| 15 to 24 Years | 28 (3.0%) | $0 |
| 25 to 44 Years | 291 (31.5%) | $106,359 |
| 45 to 64 Years | 353 (38.2%) | $122,471 |
| 65+ Years | 253 (27.4%) | $72,159 |
| Total | 925 (100.0%) | $113,750 |
Poverty in Leonardo
Income Below Poverty by Sex and Age in Leonardo
With 3.3% poverty level for males and 5.1% for females among the residents of Leonardo, 75 year old and over males and 16 and 17 year old females are the most vulnerable to poverty, with 10 males (14.3%) and 6 females (23.1%) in their respective age groups living below the poverty level.
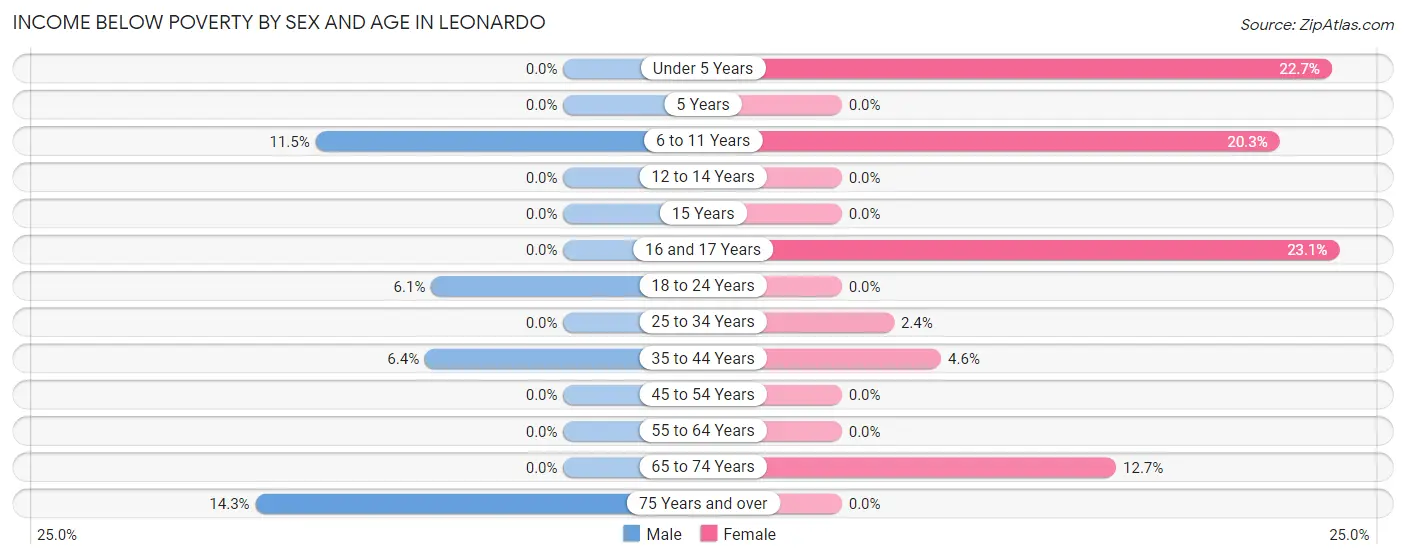
| Age Bracket | Male | Female |
| Under 5 Years | 0 (0.0%) | 5 (22.7%) |
| 5 Years | 0 (0.0%) | 0 (0.0%) |
| 6 to 11 Years | 13 (11.5%) | 13 (20.3%) |
| 12 to 14 Years | 0 (0.0%) | 0 (0.0%) |
| 15 Years | 0 (0.0%) | 0 (0.0%) |
| 16 and 17 Years | 0 (0.0%) | 6 (23.1%) |
| 18 to 24 Years | 10 (6.1%) | 0 (0.0%) |
| 25 to 34 Years | 0 (0.0%) | 5 (2.4%) |
| 35 to 44 Years | 7 (6.4%) | 7 (4.6%) |
| 45 to 54 Years | 0 (0.0%) | 0 (0.0%) |
| 55 to 64 Years | 0 (0.0%) | 0 (0.0%) |
| 65 to 74 Years | 0 (0.0%) | 21 (12.7%) |
| 75 Years and over | 10 (14.3%) | 0 (0.0%) |
| Total | 40 (3.3%) | 57 (5.1%) |
Income Above Poverty by Sex and Age in Leonardo
According to the poverty statistics in Leonardo, males aged under 5 years and females aged 5 years are the age groups that are most secure financially, with 100.0% of males and 100.0% of females in these age groups living above the poverty line.
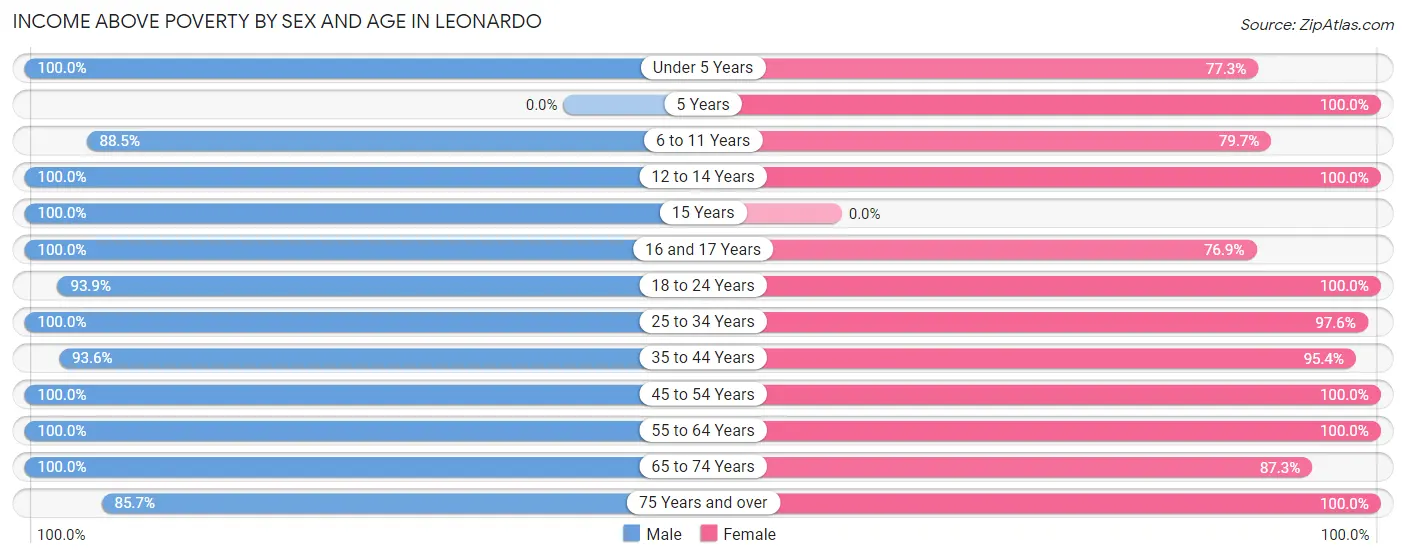
| Age Bracket | Male | Female |
| Under 5 Years | 54 (100.0%) | 17 (77.3%) |
| 5 Years | 0 (0.0%) | 16 (100.0%) |
| 6 to 11 Years | 100 (88.5%) | 51 (79.7%) |
| 12 to 14 Years | 65 (100.0%) | 18 (100.0%) |
| 15 Years | 12 (100.0%) | 0 (0.0%) |
| 16 and 17 Years | 78 (100.0%) | 20 (76.9%) |
| 18 to 24 Years | 153 (93.9%) | 99 (100.0%) |
| 25 to 34 Years | 160 (100.0%) | 202 (97.6%) |
| 35 to 44 Years | 102 (93.6%) | 145 (95.4%) |
| 45 to 54 Years | 145 (100.0%) | 189 (100.0%) |
| 55 to 64 Years | 96 (100.0%) | 143 (100.0%) |
| 65 to 74 Years | 144 (100.0%) | 144 (87.3%) |
| 75 Years and over | 60 (85.7%) | 26 (100.0%) |
| Total | 1,169 (96.7%) | 1,070 (94.9%) |
Income Below Poverty Among Married-Couple Families in Leonardo
The poverty statistics for married-couple families in Leonardo show that 3.7% or 17 of the total 462 families live below the poverty line. Families with 1 or 2 children have the highest poverty rate of 4.1%, comprising of 7 families. On the other hand, families with 3 or 4 children have the lowest poverty rate of 0.0%, which includes 0 families.
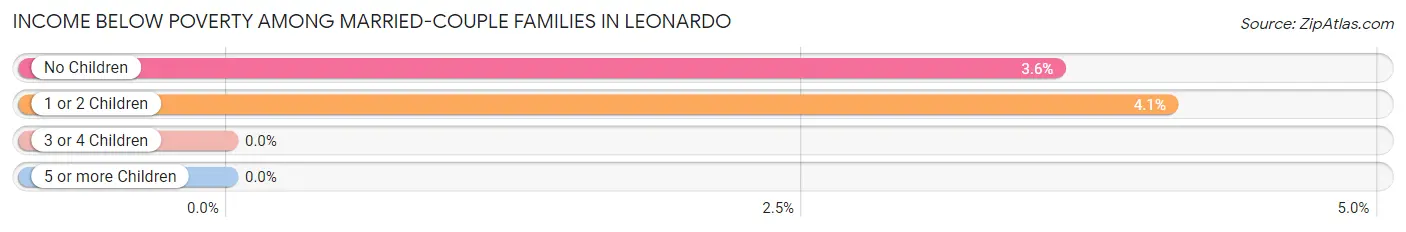
| Children | Above Poverty | Below Poverty |
| No Children | 268 (96.4%) | 10 (3.6%) |
| 1 or 2 Children | 164 (95.9%) | 7 (4.1%) |
| 3 or 4 Children | 13 (100.0%) | 0 (0.0%) |
| 5 or more Children | 0 (0.0%) | 0 (0.0%) |
| Total | 445 (96.3%) | 17 (3.7%) |
Income Below Poverty Among Single-Parent Households in Leonardo
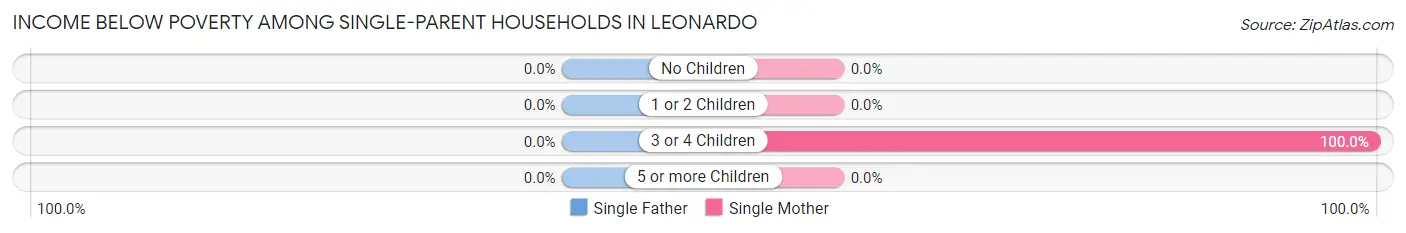
| Children | Single Father | Single Mother |
| No Children | 0 (0.0%) | 0 (0.0%) |
| 1 or 2 Children | 0 (0.0%) | 0 (0.0%) |
| 3 or 4 Children | 0 (0.0%) | 5 (100.0%) |
| 5 or more Children | 0 (0.0%) | 0 (0.0%) |
| Total | 0 (0.0%) | 5 (3.5%) |
Income Below Poverty Among Married-Couple vs Single-Parent Households in Leonardo
The poverty data for Leonardo shows that 17 of the married-couple family households (3.7%) and 5 of the single-parent households (3.0%) are living below the poverty level. Within the married-couple family households, those with 1 or 2 children have the highest poverty rate, with 7 households (4.1%) falling below the poverty line. Among the single-parent households, those with 3 or 4 children have the highest poverty rate, with 5 household (100.0%) living below poverty.
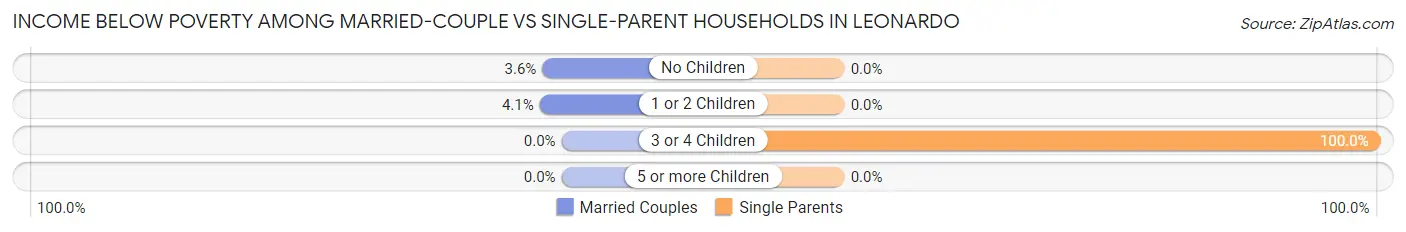
| Children | Married-Couple Families | Single-Parent Households |
| No Children | 10 (3.6%) | 0 (0.0%) |
| 1 or 2 Children | 7 (4.1%) | 0 (0.0%) |
| 3 or 4 Children | 0 (0.0%) | 5 (100.0%) |
| 5 or more Children | 0 (0.0%) | 0 (0.0%) |
| Total | 17 (3.7%) | 5 (3.0%) |
Race in Leonardo
The most populous races in Leonardo are White / Caucasian (2,178 | 93.2%), Asian (131 | 5.6%), and Hispanic or Latino (98 | 4.2%).
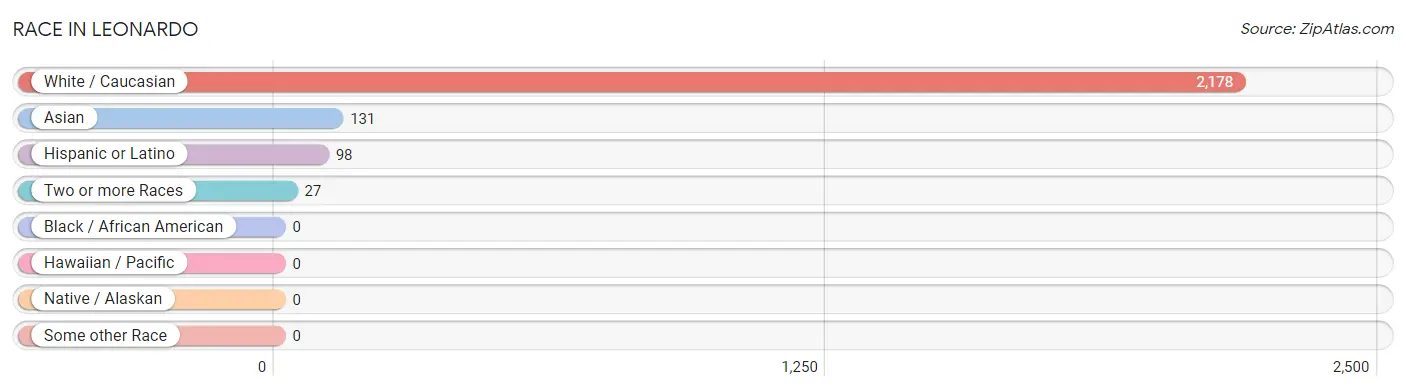
| Race | # Population | % Population |
| Asian | 131 | 5.6% |
| Black / African American | 0 | 0.0% |
| Hawaiian / Pacific | 0 | 0.0% |
| Hispanic or Latino | 98 | 4.2% |
| Native / Alaskan | 0 | 0.0% |
| White / Caucasian | 2,178 | 93.2% |
| Two or more Races | 27 | 1.2% |
| Some other Race | 0 | 0.0% |
| Total | 2,336 | 100.0% |
Ancestry in Leonardo
The most populous ancestries reported in Leonardo are Irish (535 | 22.9%), Italian (471 | 20.2%), German (437 | 18.7%), English (145 | 6.2%), and Indian (Asian) (123 | 5.3%), together accounting for 73.2% of all Leonardo residents.
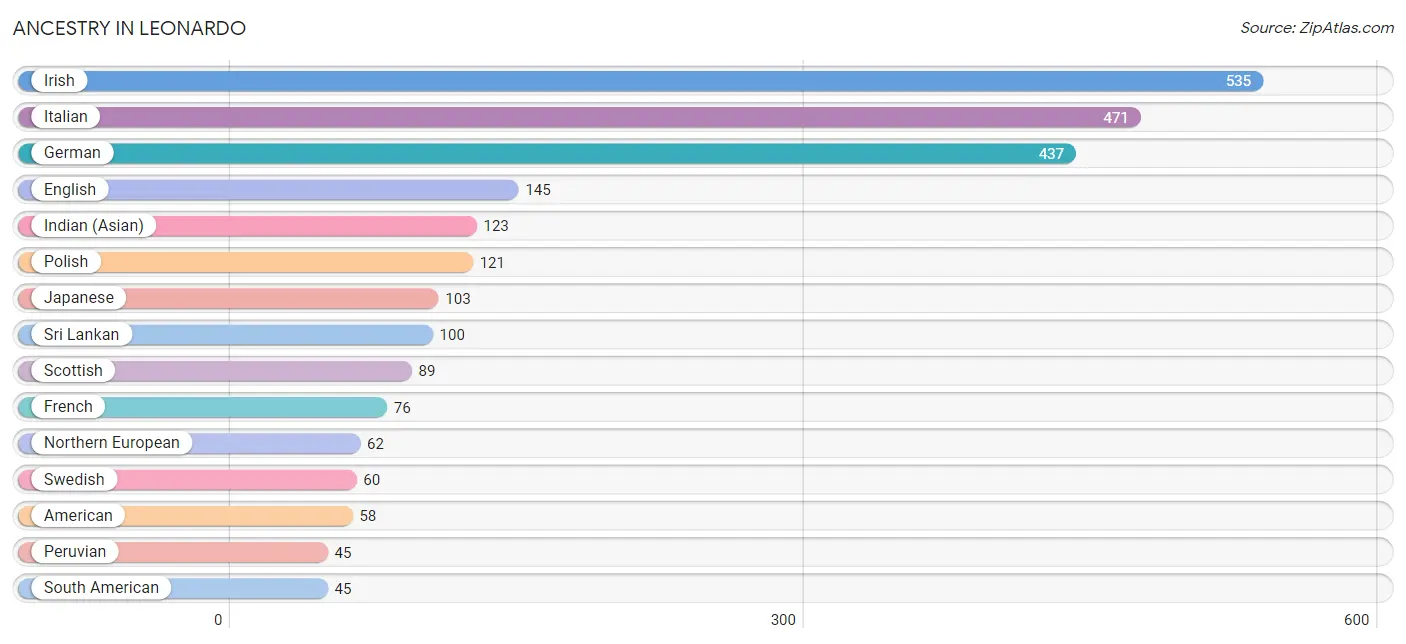
| Ancestry | # Population | % Population |
| American | 58 | 2.5% |
| Arab | 9 | 0.4% |
| Canadian | 7 | 0.3% |
| Czech | 8 | 0.3% |
| Dominican | 26 | 1.1% |
| Dutch | 19 | 0.8% |
| English | 145 | 6.2% |
| European | 21 | 0.9% |
| French | 76 | 3.3% |
| French Canadian | 9 | 0.4% |
| German | 437 | 18.7% |
| Hungarian | 16 | 0.7% |
| Icelander | 9 | 0.4% |
| Indian (Asian) | 123 | 5.3% |
| Irish | 535 | 22.9% |
| Italian | 471 | 20.2% |
| Japanese | 103 | 4.4% |
| Lithuanian | 17 | 0.7% |
| Northern European | 62 | 2.6% |
| Norwegian | 44 | 1.9% |
| Peruvian | 45 | 1.9% |
| Polish | 121 | 5.2% |
| Portuguese | 26 | 1.1% |
| Puerto Rican | 15 | 0.6% |
| Russian | 17 | 0.7% |
| Scotch-Irish | 22 | 0.9% |
| Scottish | 89 | 3.8% |
| South American | 45 | 1.9% |
| Spanish | 12 | 0.5% |
| Sri Lankan | 100 | 4.3% |
| Swedish | 60 | 2.6% |
| Swiss | 7 | 0.3% |
| Syrian | 9 | 0.4% |
| Thai | 8 | 0.3% |
| Ukrainian | 10 | 0.4% | View All 35 Rows |
Immigrants in Leonardo
The most numerous immigrant groups reported in Leonardo came from Asia (51 | 2.2%), South Eastern Asia (43 | 1.8%), Cambodia (23 | 1.0%), Latin America (21 | 0.9%), and Vietnam (20 | 0.9%), together accounting for 6.8% of all Leonardo residents.
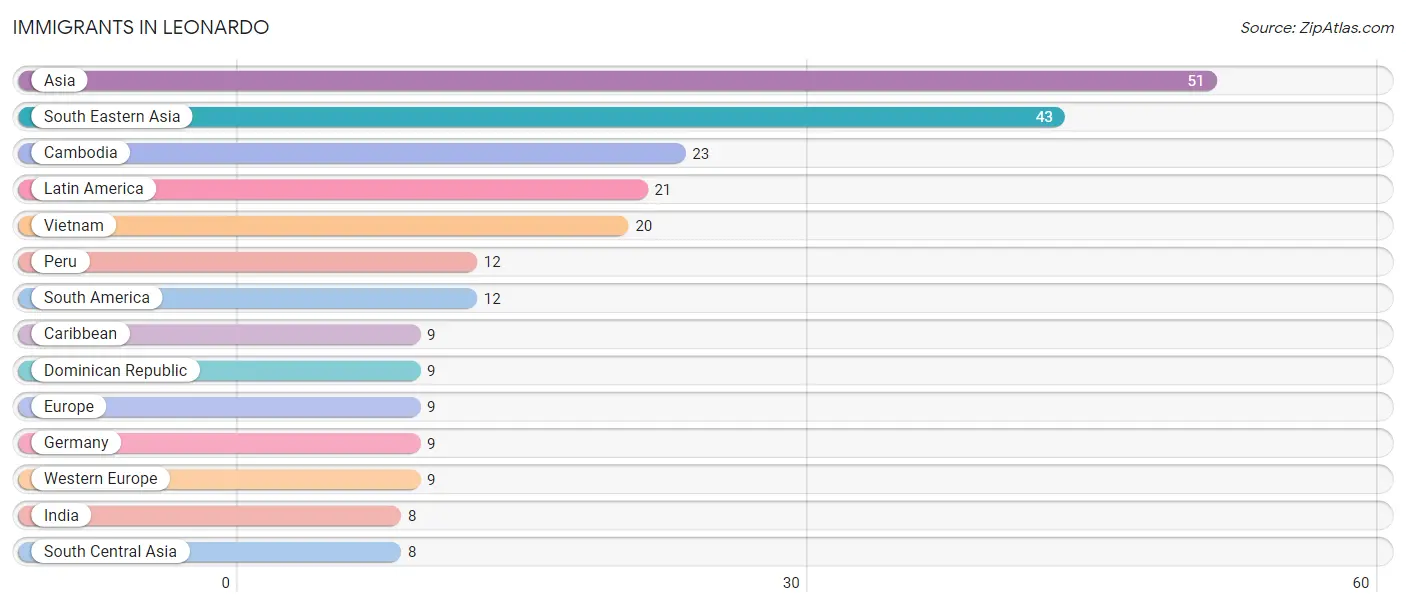
| Immigration Origin | # Population | % Population |
| Asia | 51 | 2.2% |
| Cambodia | 23 | 1.0% |
| Caribbean | 9 | 0.4% |
| Dominican Republic | 9 | 0.4% |
| Europe | 9 | 0.4% |
| Germany | 9 | 0.4% |
| India | 8 | 0.3% |
| Latin America | 21 | 0.9% |
| Peru | 12 | 0.5% |
| South America | 12 | 0.5% |
| South Central Asia | 8 | 0.3% |
| South Eastern Asia | 43 | 1.8% |
| Vietnam | 20 | 0.9% |
| Western Europe | 9 | 0.4% | View All 14 Rows |
Sex and Age in Leonardo
Sex and Age in Leonardo
The most populous age groups in Leonardo are 10 to 14 Years (144 | 11.9%) for men and 45 to 49 Years (127 | 11.3%) for women.
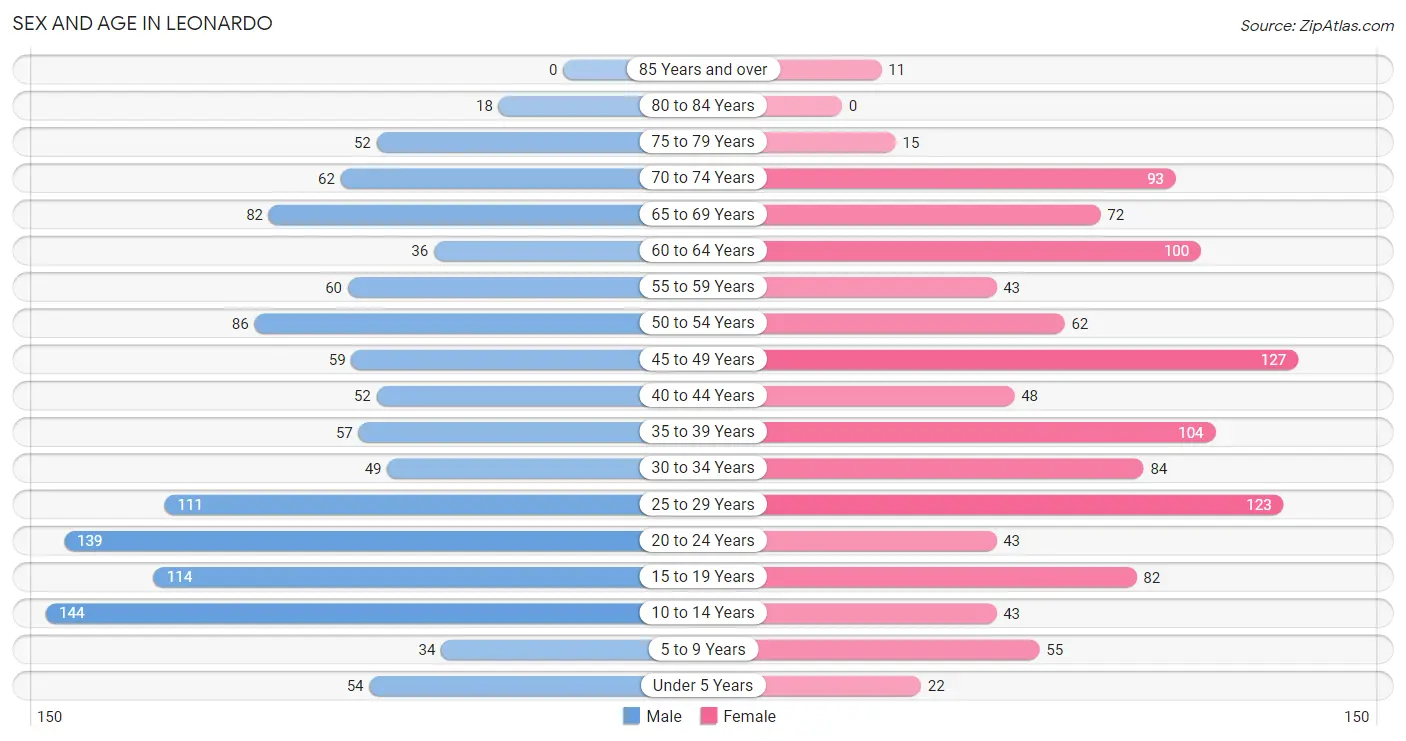
| Age Bracket | Male | Female |
| Under 5 Years | 54 (4.5%) | 22 (1.9%) |
| 5 to 9 Years | 34 (2.8%) | 55 (4.9%) |
| 10 to 14 Years | 144 (11.9%) | 43 (3.8%) |
| 15 to 19 Years | 114 (9.4%) | 82 (7.3%) |
| 20 to 24 Years | 139 (11.5%) | 43 (3.8%) |
| 25 to 29 Years | 111 (9.2%) | 123 (10.9%) |
| 30 to 34 Years | 49 (4.1%) | 84 (7.4%) |
| 35 to 39 Years | 57 (4.7%) | 104 (9.2%) |
| 40 to 44 Years | 52 (4.3%) | 48 (4.3%) |
| 45 to 49 Years | 59 (4.9%) | 127 (11.3%) |
| 50 to 54 Years | 86 (7.1%) | 62 (5.5%) |
| 55 to 59 Years | 60 (5.0%) | 43 (3.8%) |
| 60 to 64 Years | 36 (3.0%) | 100 (8.9%) |
| 65 to 69 Years | 82 (6.8%) | 72 (6.4%) |
| 70 to 74 Years | 62 (5.1%) | 93 (8.3%) |
| 75 to 79 Years | 52 (4.3%) | 15 (1.3%) |
| 80 to 84 Years | 18 (1.5%) | 0 (0.0%) |
| 85 Years and over | 0 (0.0%) | 11 (1.0%) |
| Total | 1,209 (100.0%) | 1,127 (100.0%) |
Families and Households in Leonardo
Median Family Size in Leonardo
The median family size in Leonardo is 3.15 persons per family, with married-couple families (462 | 73.7%) accounting for the largest median family size of 3.27 persons per family. On the other hand, single male/father families (21 | 3.4%) represent the smallest median family size with 2.00 persons per family.
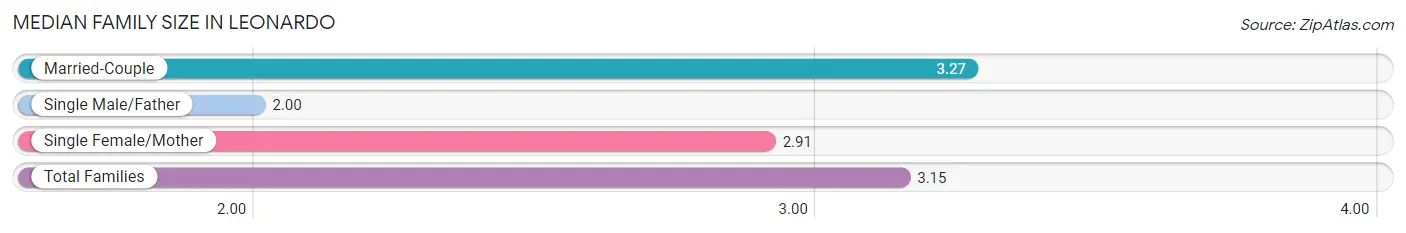
| Family Type | # Families | Family Size |
| Married-Couple | 462 (73.7%) | 3.27 |
| Single Male/Father | 21 (3.4%) | 2.00 |
| Single Female/Mother | 144 (23.0%) | 2.91 |
| Total Families | 627 (100.0%) | 3.15 |
Median Household Size in Leonardo
The median household size in Leonardo is 2.53 persons per household, with married-couple households (462 | 49.9%) accounting for the largest median household size of 3.27 persons per household. non-family households (298 | 32.2%) represent the smallest median household size with 1.14 persons per household.
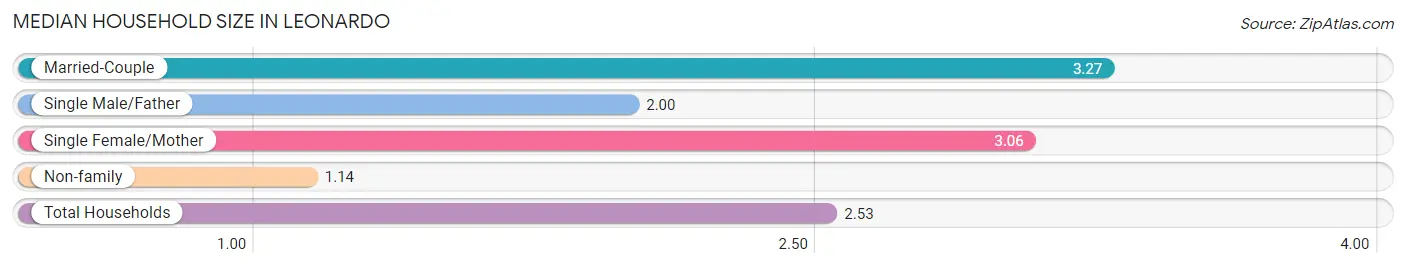
| Household Type | # Households | Household Size |
| Married-Couple | 462 (49.9%) | 3.27 |
| Single Male/Father | 21 (2.3%) | 2.00 |
| Single Female/Mother | 144 (15.6%) | 3.06 |
| Non-family | 298 (32.2%) | 1.14 |
| Total Households | 925 (100.0%) | 2.53 |
Household Size by Marriage Status in Leonardo
Out of a total of 925 households in Leonardo, 627 (67.8%) are family households, while 298 (32.2%) are nonfamily households. The most numerous type of family households are 2-person households, comprising 258, and the most common type of nonfamily households are 1-person households, comprising 256.
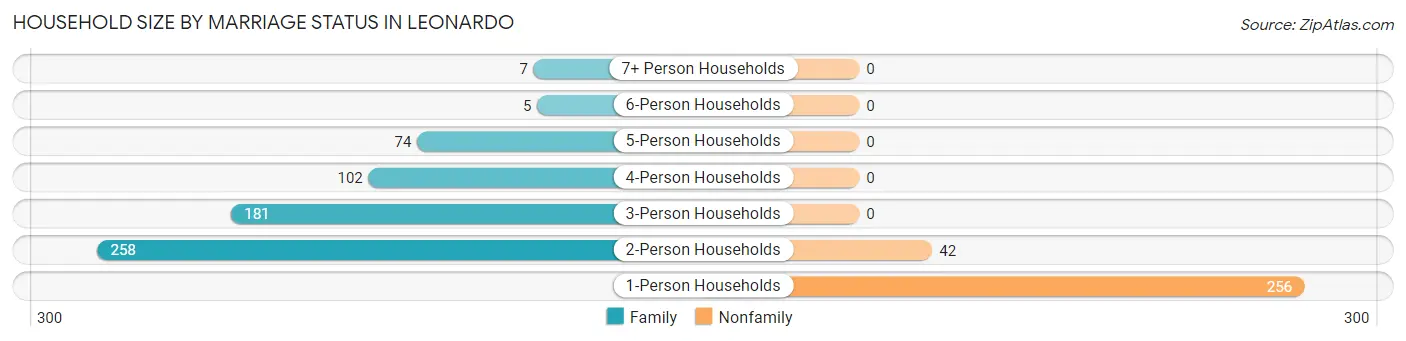
| Household Size | Family Households | Nonfamily Households |
| 1-Person Households | - | 256 (27.7%) |
| 2-Person Households | 258 (27.9%) | 42 (4.5%) |
| 3-Person Households | 181 (19.6%) | 0 (0.0%) |
| 4-Person Households | 102 (11.0%) | 0 (0.0%) |
| 5-Person Households | 74 (8.0%) | 0 (0.0%) |
| 6-Person Households | 5 (0.5%) | 0 (0.0%) |
| 7+ Person Households | 7 (0.8%) | 0 (0.0%) |
| Total | 627 (67.8%) | 298 (32.2%) |
Female Fertility in Leonardo
Fertility by Age in Leonardo
| Age Bracket | Women with Births | Births / 1,000 Women |
| 15 to 19 years | 0 (0.0%) | 0.0 |
| 20 to 34 years | 0 (0.0%) | 0.0 |
| 35 to 50 years | 0 (0.0%) | 0.0 |
| Total | 0 (0.0%) | 0.0 |
Fertility by Age by Marriage Status in Leonardo
| Age Bracket | Married | Unmarried |
| 15 to 19 years | 0 (0.0%) | 0 (0.0%) |
| 20 to 34 years | 0 (0.0%) | 0 (0.0%) |
| 35 to 50 years | 0 (0.0%) | 0 (0.0%) |
| Total | 0 (0.0%) | 0 (0.0%) |
Fertility by Education in Leonardo
| Educational Attainment | Women with Births | Births / 1,000 Women |
| Less than High School | 0 (0.0%) | 0.0 |
| High School Diploma | 0 (0.0%) | 0.0 |
| College or Associate's Degree | 0 (0.0%) | 0.0 |
| Bachelor's Degree | 0 (0.0%) | 0.0 |
| Graduate Degree | 0 (0.0%) | 0.0 |
| Total | 0 (0.0%) | 0.0 |
Fertility by Education by Marriage Status in Leonardo
| Educational Attainment | Married | Unmarried |
| Less than High School | 0 (0.0%) | 0 (0.0%) |
| High School Diploma | 0 (0.0%) | 0 (0.0%) |
| College or Associate's Degree | 0 (0.0%) | 0 (0.0%) |
| Bachelor's Degree | 0 (0.0%) | 0 (0.0%) |
| Graduate Degree | 0 (0.0%) | 0 (0.0%) |
| Total | 0 (0.0%) | 0 (0.0%) |
Employment Characteristics in Leonardo
Employment by Class of Employer in Leonardo
Among the 1,264 employed individuals in Leonardo, private company employees (987 | 78.1%), not-for-profit organizations (117 | 9.3%), and state government employees (57 | 4.5%) make up the most common classes of employment.
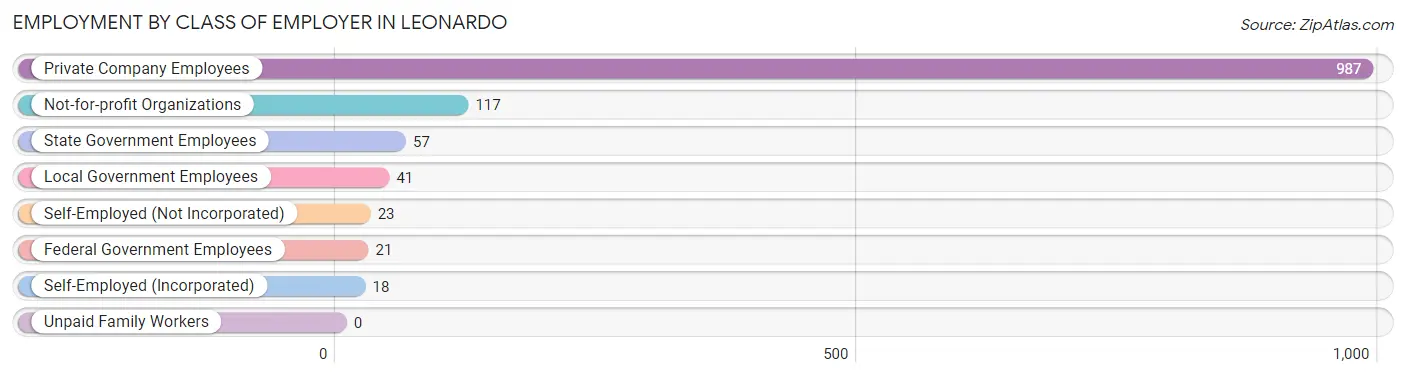
| Employer Class | # Employees | % Employees |
| Private Company Employees | 987 | 78.1% |
| Self-Employed (Incorporated) | 18 | 1.4% |
| Self-Employed (Not Incorporated) | 23 | 1.8% |
| Not-for-profit Organizations | 117 | 9.3% |
| Local Government Employees | 41 | 3.2% |
| State Government Employees | 57 | 4.5% |
| Federal Government Employees | 21 | 1.7% |
| Unpaid Family Workers | 0 | 0.0% |
| Total | 1,264 | 100.0% |
Employment Status by Age in Leonardo
According to the labor force statistics for Leonardo, out of the total population over 16 years of age (1,972), 68.7% or 1,355 individuals are in the labor force, with 5.6% or 76 of them unemployed. The age group with the highest labor force participation rate is 30 to 34 years, with 96.2% or 128 individuals in the labor force. Within the labor force, the 75 years and over age range has the highest percentage of unemployed individuals, with 52.6% or 10 of them being unemployed.
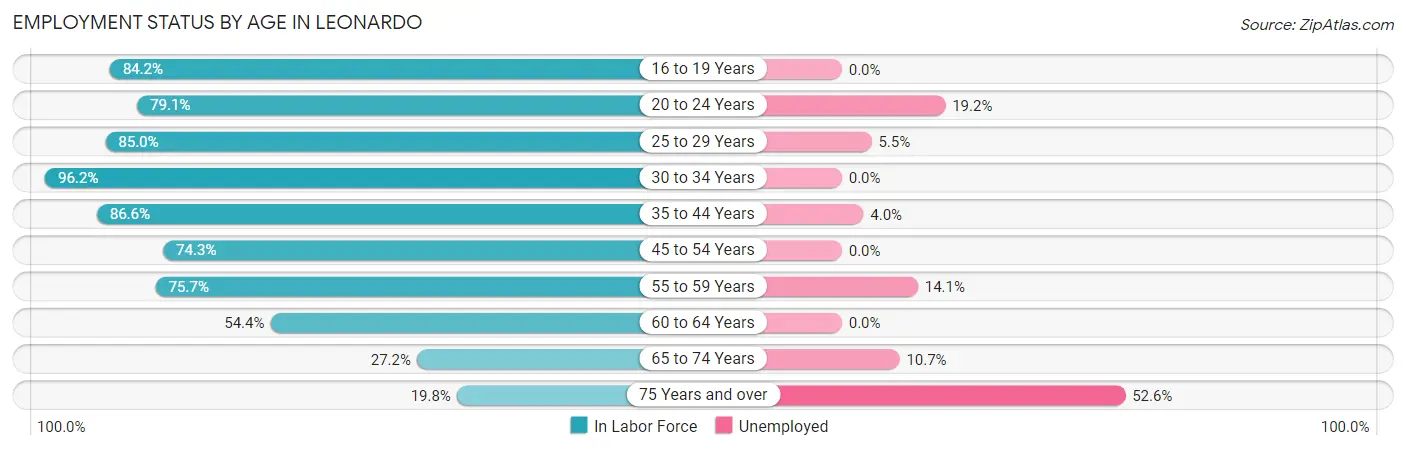
| Age Bracket | In Labor Force | Unemployed |
| 16 to 19 Years | 155 (84.2%) | 0 (0.0%) |
| 20 to 24 Years | 144 (79.1%) | 28 (19.2%) |
| 25 to 29 Years | 199 (85.0%) | 11 (5.5%) |
| 30 to 34 Years | 128 (96.2%) | 0 (0.0%) |
| 35 to 44 Years | 226 (86.6%) | 9 (4.0%) |
| 45 to 54 Years | 248 (74.3%) | 0 (0.0%) |
| 55 to 59 Years | 78 (75.7%) | 11 (14.1%) |
| 60 to 64 Years | 74 (54.4%) | 0 (0.0%) |
| 65 to 74 Years | 84 (27.2%) | 9 (10.7%) |
| 75 Years and over | 19 (19.8%) | 10 (52.6%) |
| Total | 1,355 (68.7%) | 76 (5.6%) |
Employment Status by Educational Attainment in Leonardo
According to labor force statistics for Leonardo, 79.4% of individuals (954) out of the total population between 25 and 64 years of age (1,201) are in the labor force, with 3.3% or 31 of them being unemployed. The group with the highest labor force participation rate are those with the educational attainment of bachelor's degree or higher, with 88.1% or 496 individuals in the labor force. Within the labor force, individuals with college / associate degree education have the highest percentage of unemployment, with 4.8% or 11 of them being unemployed.
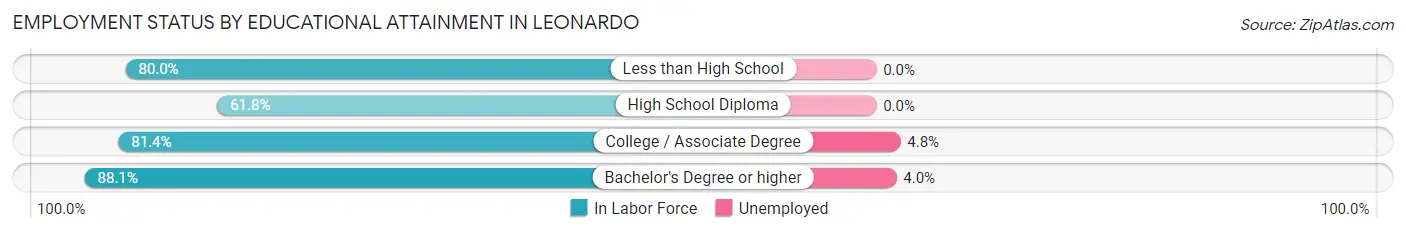
| Educational Attainment | In Labor Force | Unemployed |
| Less than High School | 36 (80.0%) | 0 (0.0%) |
| High School Diploma | 194 (61.8%) | 0 (0.0%) |
| College / Associate Degree | 227 (81.4%) | 13 (4.8%) |
| Bachelor's Degree or higher | 496 (88.1%) | 23 (4.0%) |
| Total | 954 (79.4%) | 40 (3.3%) |
Employment Occupations by Sex in Leonardo
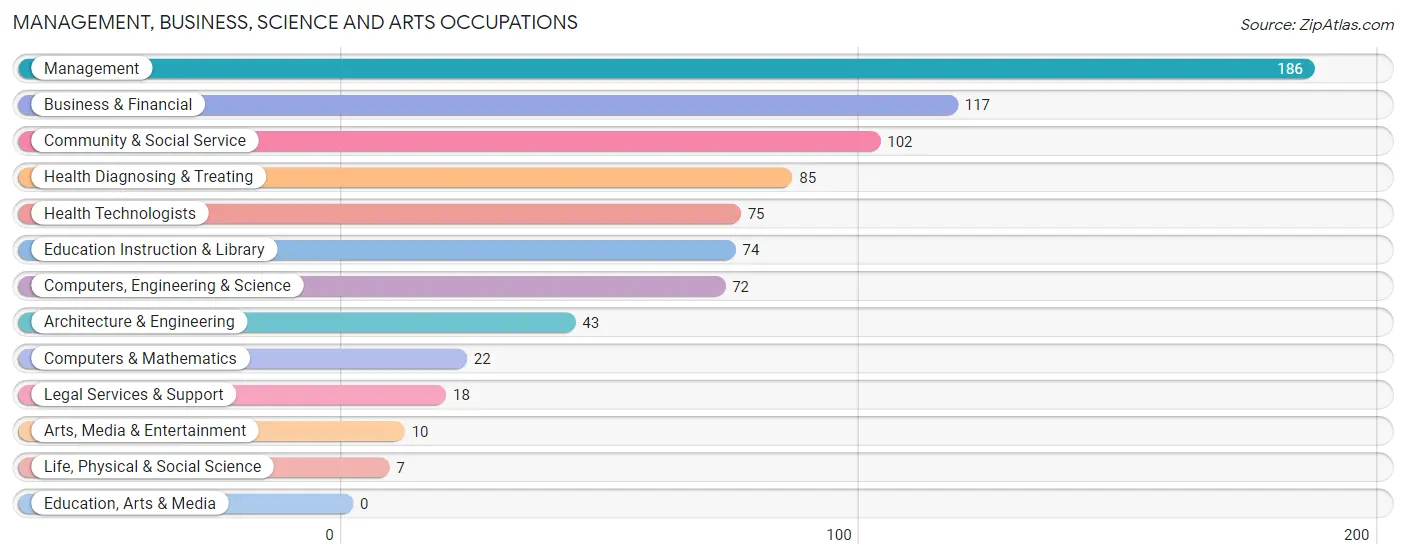
Management, Business, Science and Arts Occupations
The most common Management, Business, Science and Arts occupations in Leonardo are Management (186 | 14.7%), Business & Financial (117 | 9.2%), Community & Social Service (102 | 8.1%), Health Diagnosing & Treating (85 | 6.7%), and Health Technologists (75 | 5.9%).
Management, Business, Science and Arts Occupations by Sex
Within the Management, Business, Science and Arts occupations in Leonardo, the most male-oriented occupations are Computers, Engineering & Science (100.0%), Computers & Mathematics (100.0%), and Architecture & Engineering (100.0%), while the most female-oriented occupations are Legal Services & Support (100.0%), Health Diagnosing & Treating (88.2%), and Education Instruction & Library (87.8%).
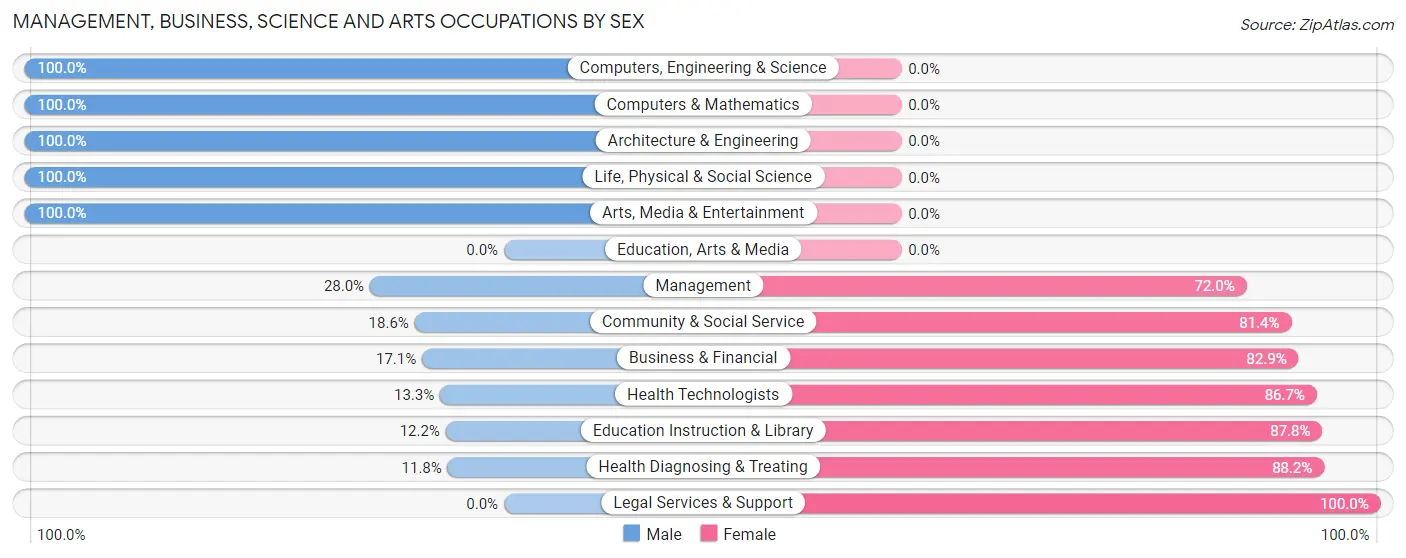
| Occupation | Male | Female |
| Management | 52 (28.0%) | 134 (72.0%) |
| Business & Financial | 20 (17.1%) | 97 (82.9%) |
| Computers, Engineering & Science | 72 (100.0%) | 0 (0.0%) |
| Computers & Mathematics | 22 (100.0%) | 0 (0.0%) |
| Architecture & Engineering | 43 (100.0%) | 0 (0.0%) |
| Life, Physical & Social Science | 7 (100.0%) | 0 (0.0%) |
| Community & Social Service | 19 (18.6%) | 83 (81.4%) |
| Education, Arts & Media | 0 (0.0%) | 0 (0.0%) |
| Legal Services & Support | 0 (0.0%) | 18 (100.0%) |
| Education Instruction & Library | 9 (12.2%) | 65 (87.8%) |
| Arts, Media & Entertainment | 10 (100.0%) | 0 (0.0%) |
| Health Diagnosing & Treating | 10 (11.8%) | 75 (88.2%) |
| Health Technologists | 10 (13.3%) | 65 (86.7%) |
| Total (Category) | 173 (30.8%) | 389 (69.2%) |
| Total (Overall) | 616 (48.7%) | 650 (51.3%) |
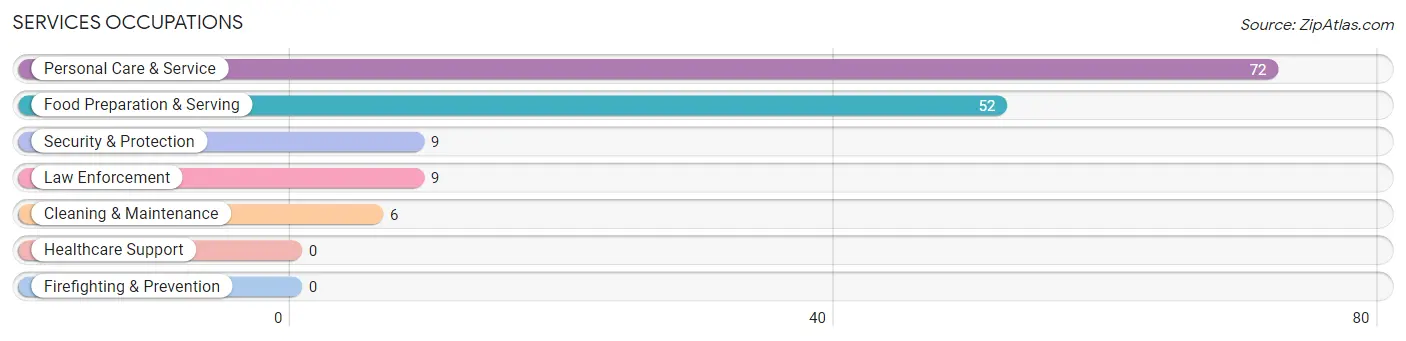
Services Occupations
The most common Services occupations in Leonardo are Personal Care & Service (72 | 5.7%), Food Preparation & Serving (52 | 4.1%), Security & Protection (9 | 0.7%), Law Enforcement (9 | 0.7%), and Cleaning & Maintenance (6 | 0.5%).
Services Occupations by Sex
Within the Services occupations in Leonardo, the most male-oriented occupations are Security & Protection (100.0%), Law Enforcement (100.0%), and Food Preparation & Serving (25.0%), while the most female-oriented occupations are Cleaning & Maintenance (100.0%), Personal Care & Service (100.0%), and Food Preparation & Serving (75.0%).
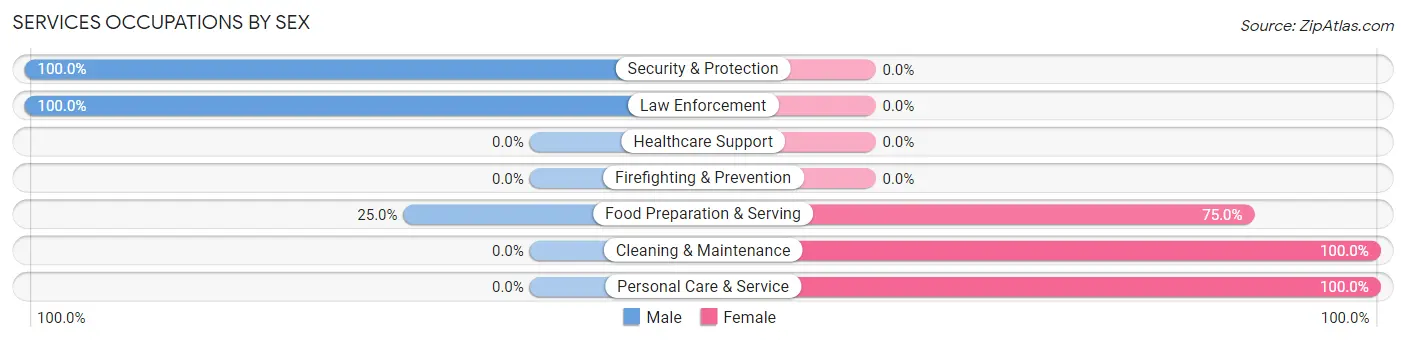
| Occupation | Male | Female |
| Healthcare Support | 0 (0.0%) | 0 (0.0%) |
| Security & Protection | 9 (100.0%) | 0 (0.0%) |
| Firefighting & Prevention | 0 (0.0%) | 0 (0.0%) |
| Law Enforcement | 9 (100.0%) | 0 (0.0%) |
| Food Preparation & Serving | 13 (25.0%) | 39 (75.0%) |
| Cleaning & Maintenance | 0 (0.0%) | 6 (100.0%) |
| Personal Care & Service | 0 (0.0%) | 72 (100.0%) |
| Total (Category) | 22 (15.8%) | 117 (84.2%) |
| Total (Overall) | 616 (48.7%) | 650 (51.3%) |
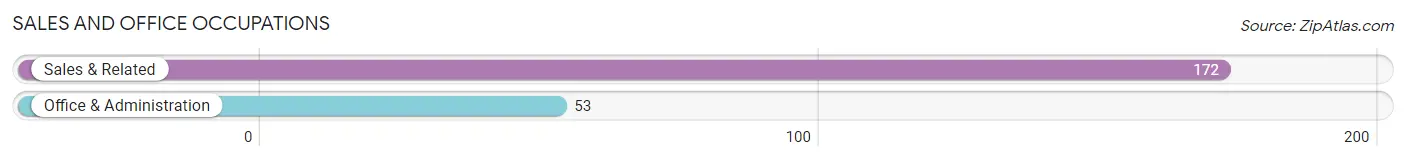
Sales and Office Occupations
The most common Sales and Office occupations in Leonardo are Sales & Related (172 | 13.6%), and Office & Administration (53 | 4.2%).
Sales and Office Occupations by Sex
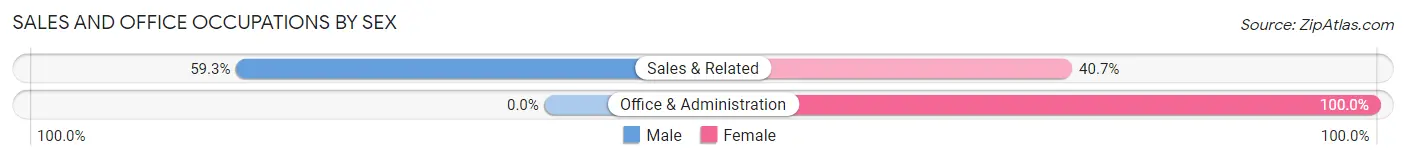
| Occupation | Male | Female |
| Sales & Related | 102 (59.3%) | 70 (40.7%) |
| Office & Administration | 0 (0.0%) | 53 (100.0%) |
| Total (Category) | 102 (45.3%) | 123 (54.7%) |
| Total (Overall) | 616 (48.7%) | 650 (51.3%) |
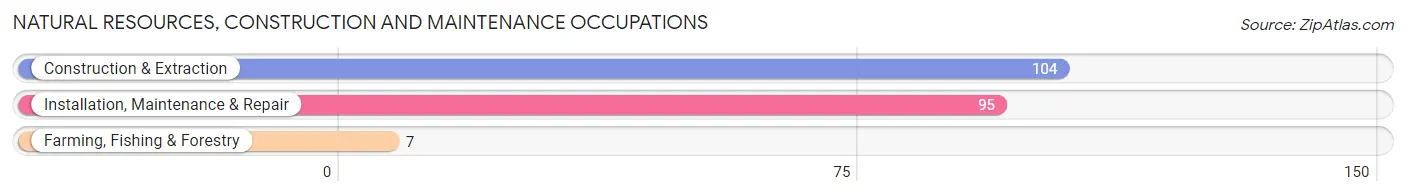
Natural Resources, Construction and Maintenance Occupations
The most common Natural Resources, Construction and Maintenance occupations in Leonardo are Construction & Extraction (104 | 8.2%), Installation, Maintenance & Repair (95 | 7.5%), and Farming, Fishing & Forestry (7 | 0.5%).
Natural Resources, Construction and Maintenance Occupations by Sex
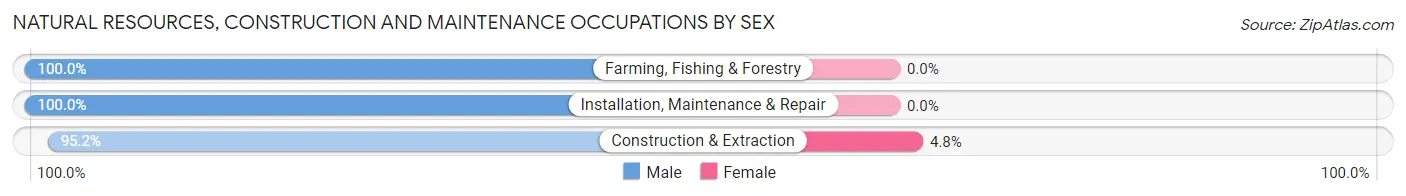
| Occupation | Male | Female |
| Farming, Fishing & Forestry | 7 (100.0%) | 0 (0.0%) |
| Construction & Extraction | 99 (95.2%) | 5 (4.8%) |
| Installation, Maintenance & Repair | 95 (100.0%) | 0 (0.0%) |
| Total (Category) | 201 (97.6%) | 5 (2.4%) |
| Total (Overall) | 616 (48.7%) | 650 (51.3%) |
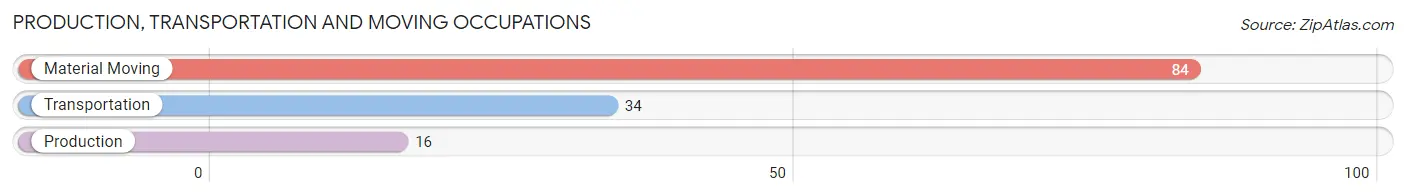
Production, Transportation and Moving Occupations
The most common Production, Transportation and Moving occupations in Leonardo are Material Moving (84 | 6.6%), Transportation (34 | 2.7%), and Production (16 | 1.3%).
Production, Transportation and Moving Occupations by Sex
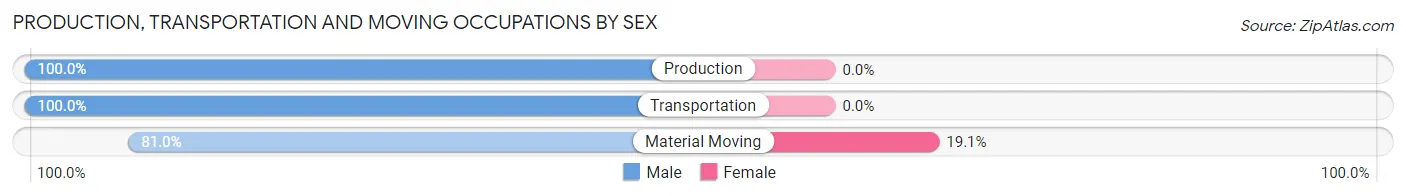
| Occupation | Male | Female |
| Production | 16 (100.0%) | 0 (0.0%) |
| Transportation | 34 (100.0%) | 0 (0.0%) |
| Material Moving | 68 (80.9%) | 16 (19.1%) |
| Total (Category) | 118 (88.1%) | 16 (11.9%) |
| Total (Overall) | 616 (48.7%) | 650 (51.3%) |
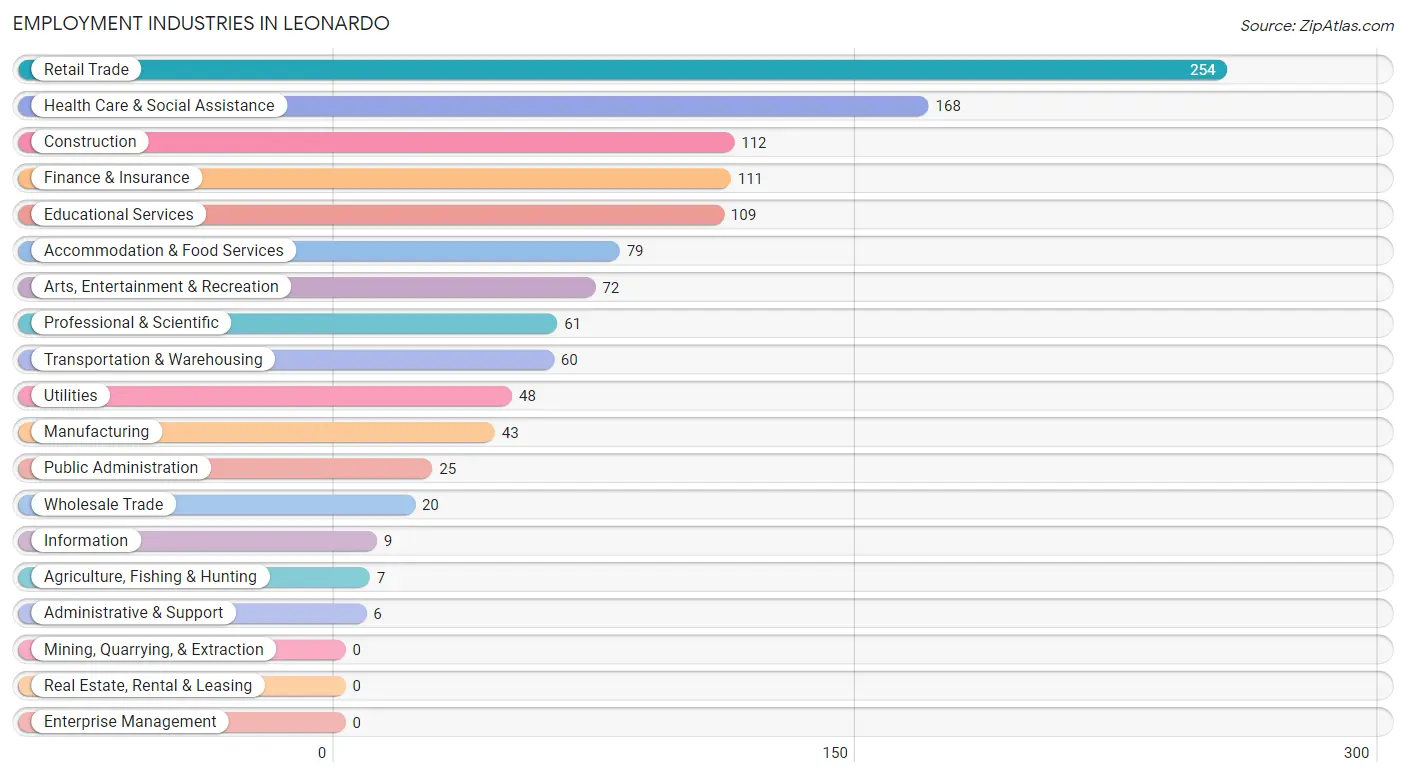
Employment Industries by Sex in Leonardo
Employment Industries in Leonardo
The major employment industries in Leonardo include Retail Trade (254 | 20.1%), Health Care & Social Assistance (168 | 13.3%), Construction (112 | 8.8%), Finance & Insurance (111 | 8.8%), and Educational Services (109 | 8.6%).
Employment Industries by Sex in Leonardo
The Leonardo industries that see more men than women are Agriculture, Fishing & Hunting (100.0%), Construction (100.0%), and Transportation & Warehousing (100.0%), whereas the industries that tend to have a higher number of women are Wholesale Trade (100.0%), Information (100.0%), and Arts, Entertainment & Recreation (100.0%).
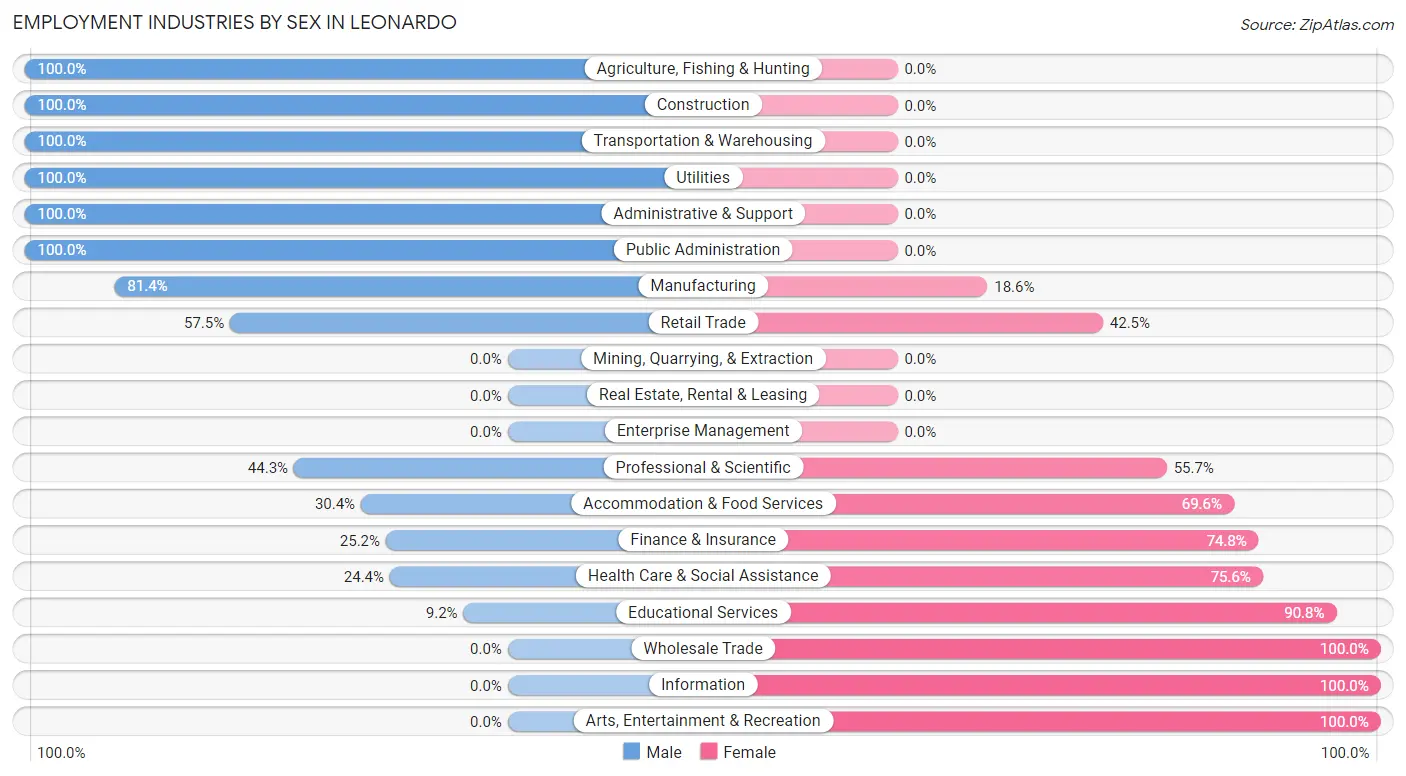
| Industry | Male | Female |
| Agriculture, Fishing & Hunting | 7 (100.0%) | 0 (0.0%) |
| Mining, Quarrying, & Extraction | 0 (0.0%) | 0 (0.0%) |
| Construction | 112 (100.0%) | 0 (0.0%) |
| Manufacturing | 35 (81.4%) | 8 (18.6%) |
| Wholesale Trade | 0 (0.0%) | 20 (100.0%) |
| Retail Trade | 146 (57.5%) | 108 (42.5%) |
| Transportation & Warehousing | 60 (100.0%) | 0 (0.0%) |
| Utilities | 48 (100.0%) | 0 (0.0%) |
| Information | 0 (0.0%) | 9 (100.0%) |
| Finance & Insurance | 28 (25.2%) | 83 (74.8%) |
| Real Estate, Rental & Leasing | 0 (0.0%) | 0 (0.0%) |
| Professional & Scientific | 27 (44.3%) | 34 (55.7%) |
| Enterprise Management | 0 (0.0%) | 0 (0.0%) |
| Administrative & Support | 6 (100.0%) | 0 (0.0%) |
| Educational Services | 10 (9.2%) | 99 (90.8%) |
| Health Care & Social Assistance | 41 (24.4%) | 127 (75.6%) |
| Arts, Entertainment & Recreation | 0 (0.0%) | 72 (100.0%) |
| Accommodation & Food Services | 24 (30.4%) | 55 (69.6%) |
| Public Administration | 25 (100.0%) | 0 (0.0%) |
| Total | 616 (48.7%) | 650 (51.3%) |
Education in Leonardo
School Enrollment in Leonardo
The most common levels of schooling among the 638 students in Leonardo are high school (189 | 29.6%), college / undergraduate (164 | 25.7%), and middle school (122 | 19.1%).
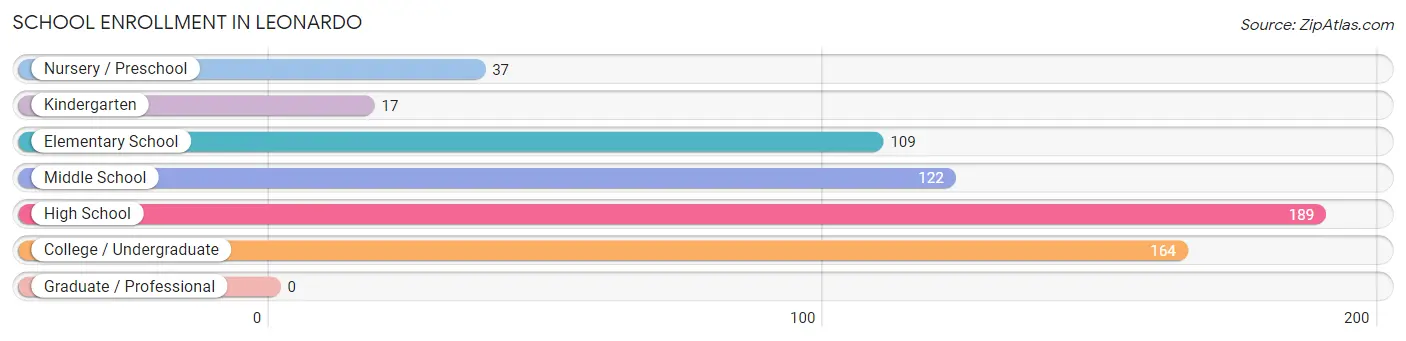
| School Level | # Students | % Students |
| Nursery / Preschool | 37 | 5.8% |
| Kindergarten | 17 | 2.7% |
| Elementary School | 109 | 17.1% |
| Middle School | 122 | 19.1% |
| High School | 189 | 29.6% |
| College / Undergraduate | 164 | 25.7% |
| Graduate / Professional | 0 | 0.0% |
| Total | 638 | 100.0% |
School Enrollment by Age by Funding Source in Leonardo
Out of a total of 638 students who are enrolled in schools in Leonardo, 62 (9.7%) attend a private institution, while the remaining 576 (90.3%) are enrolled in public schools. The age group of 3 to 4 year olds has the highest likelihood of being enrolled in private schools, with 26 (83.9% in the age bracket) enrolled. Conversely, the age group of 5 to 9 year old has the lowest likelihood of being enrolled in a private school, with 89 (100.0% in the age bracket) attending a public institution.
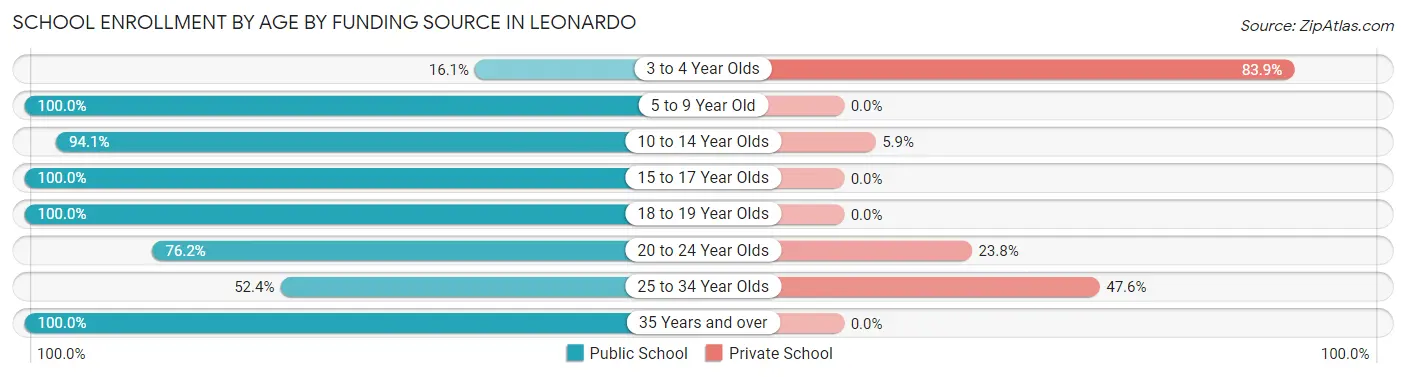
| Age Bracket | Public School | Private School |
| 3 to 4 Year Olds | 5 (16.1%) | 26 (83.9%) |
| 5 to 9 Year Old | 89 (100.0%) | 0 (0.0%) |
| 10 to 14 Year Olds | 176 (94.1%) | 11 (5.9%) |
| 15 to 17 Year Olds | 116 (100.0%) | 0 (0.0%) |
| 18 to 19 Year Olds | 69 (100.0%) | 0 (0.0%) |
| 20 to 24 Year Olds | 48 (76.2%) | 15 (23.8%) |
| 25 to 34 Year Olds | 11 (52.4%) | 10 (47.6%) |
| 35 Years and over | 62 (100.0%) | 0 (0.0%) |
| Total | 576 (90.3%) | 62 (9.7%) |
Educational Attainment by Field of Study in Leonardo
Business (118 | 16.7%), science & technology (104 | 14.7%), education (103 | 14.6%), literature & languages (73 | 10.3%), and arts & humanities (63 | 8.9%) are the most common fields of study among 705 individuals in Leonardo who have obtained a bachelor's degree or higher.
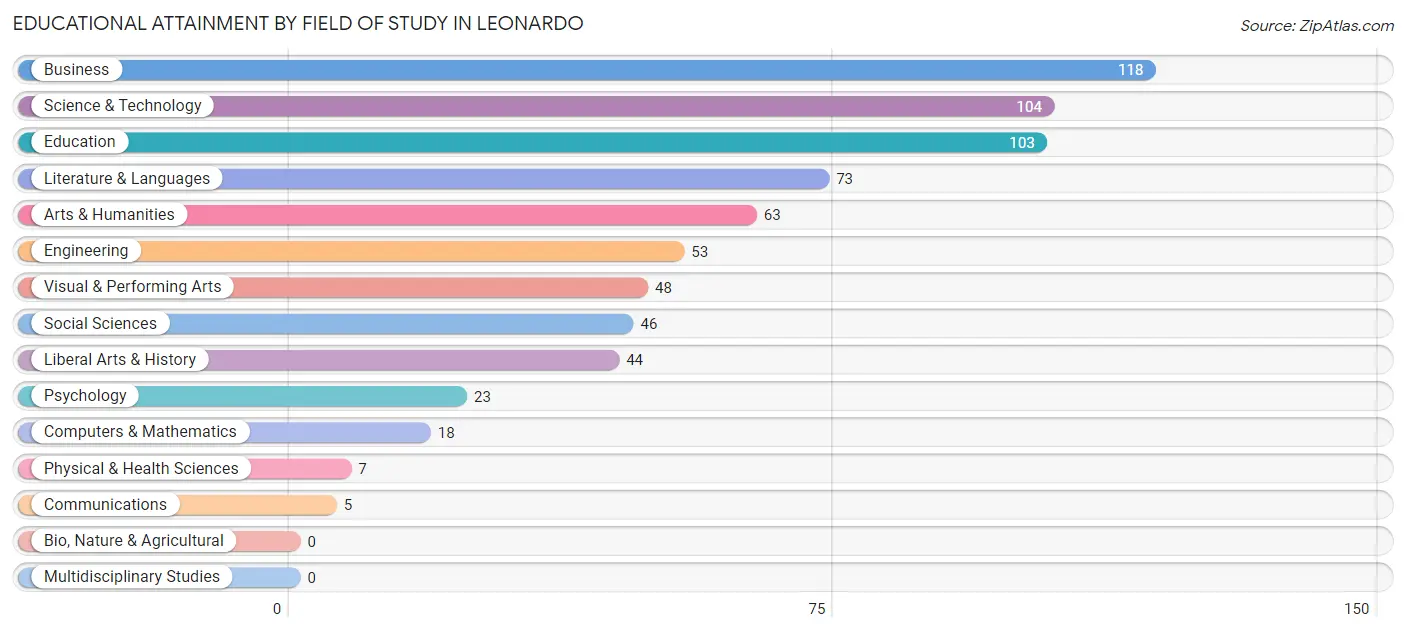
| Field of Study | # Graduates | % Graduates |
| Computers & Mathematics | 18 | 2.5% |
| Bio, Nature & Agricultural | 0 | 0.0% |
| Physical & Health Sciences | 7 | 1.0% |
| Psychology | 23 | 3.3% |
| Social Sciences | 46 | 6.5% |
| Engineering | 53 | 7.5% |
| Multidisciplinary Studies | 0 | 0.0% |
| Science & Technology | 104 | 14.7% |
| Business | 118 | 16.7% |
| Education | 103 | 14.6% |
| Literature & Languages | 73 | 10.3% |
| Liberal Arts & History | 44 | 6.2% |
| Visual & Performing Arts | 48 | 6.8% |
| Communications | 5 | 0.7% |
| Arts & Humanities | 63 | 8.9% |
| Total | 705 | 100.0% |
Transportation & Commute in Leonardo
Vehicle Availability by Sex in Leonardo
The most prevalent vehicle ownership categories in Leonardo are males with 2 vehicles (181, accounting for 29.5%) and females with 2 vehicles (230, making up 27.9%).
| Vehicles Available | Male | Female |
| No Vehicle | 11 (1.8%) | 0 (0.0%) |
| 1 Vehicle | 124 (20.2%) | 211 (32.5%) |
| 2 Vehicles | 181 (29.5%) | 230 (35.4%) |
| 3 Vehicles | 176 (28.7%) | 134 (20.6%) |
| 4 Vehicles | 27 (4.4%) | 36 (5.5%) |
| 5 or more Vehicles | 95 (15.5%) | 39 (6.0%) |
| Total | 614 (100.0%) | 650 (100.0%) |
Commute Time in Leonardo
The most frequently occuring commute durations in Leonardo are 30 to 34 minutes (220 commuters, 18.5%), 45 to 59 minutes (158 commuters, 13.3%), and 60 to 89 minutes (151 commuters, 12.7%).
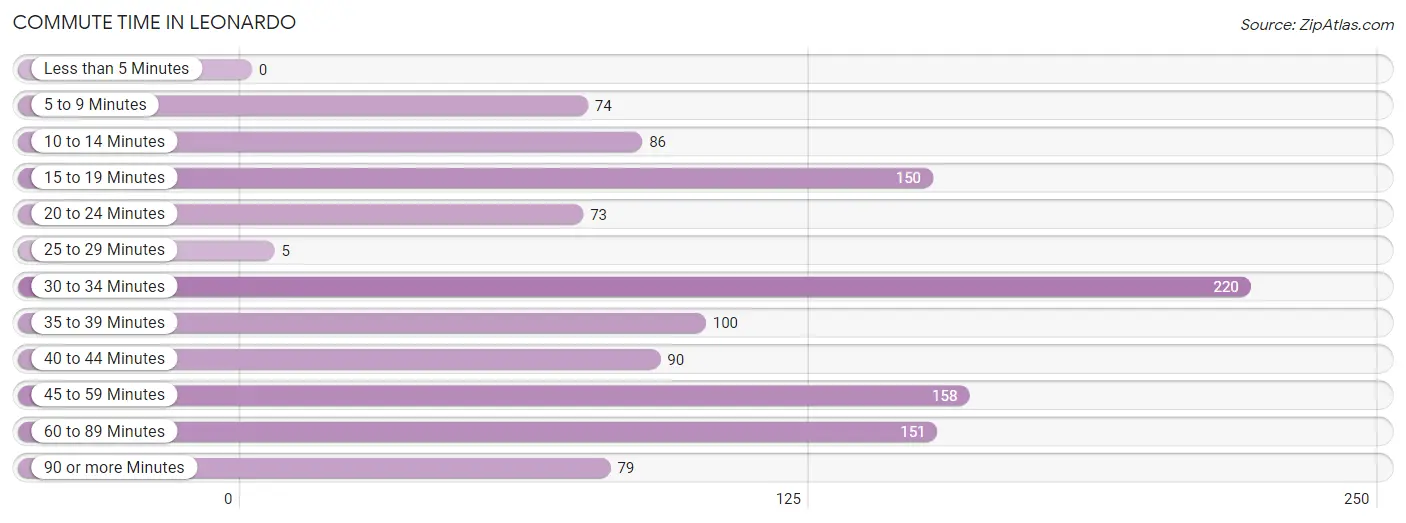
| Commute Time | # Commuters | % Commuters |
| Less than 5 Minutes | 0 | 0.0% |
| 5 to 9 Minutes | 74 | 6.2% |
| 10 to 14 Minutes | 86 | 7.2% |
| 15 to 19 Minutes | 150 | 12.7% |
| 20 to 24 Minutes | 73 | 6.2% |
| 25 to 29 Minutes | 5 | 0.4% |
| 30 to 34 Minutes | 220 | 18.5% |
| 35 to 39 Minutes | 100 | 8.4% |
| 40 to 44 Minutes | 90 | 7.6% |
| 45 to 59 Minutes | 158 | 13.3% |
| 60 to 89 Minutes | 151 | 12.7% |
| 90 or more Minutes | 79 | 6.7% |
Commute Time by Sex in Leonardo
The most common commute times in Leonardo are 45 to 59 minutes (124 commuters, 20.8%) for males and 15 to 19 minutes (106 commuters, 18.0%) for females.
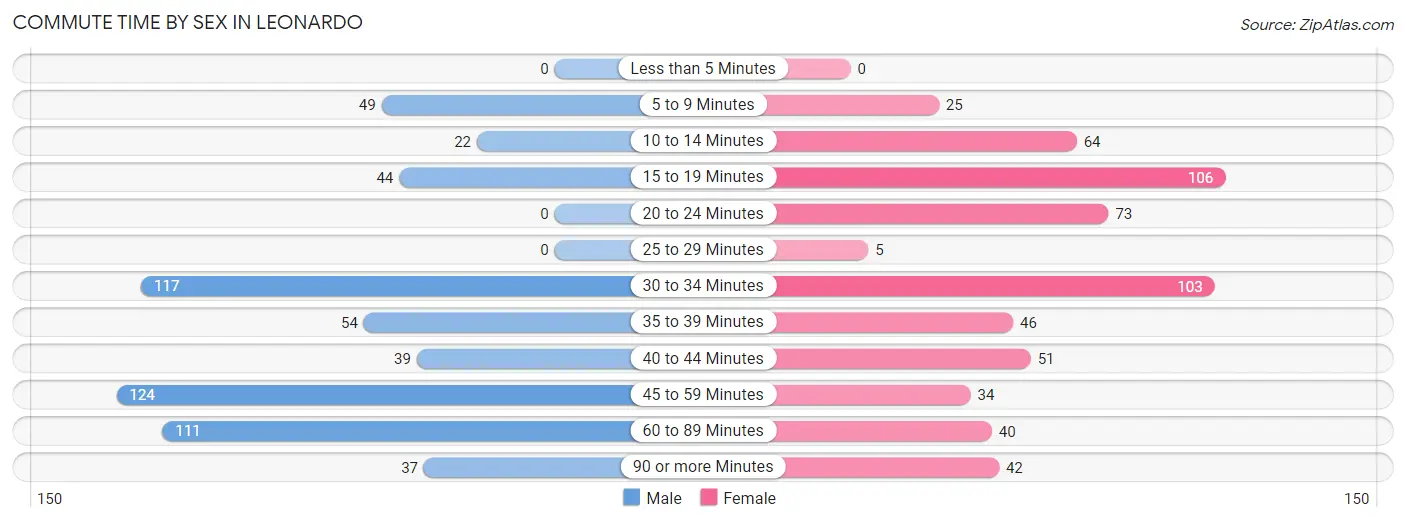
| Commute Time | Male | Female |
| Less than 5 Minutes | 0 (0.0%) | 0 (0.0%) |
| 5 to 9 Minutes | 49 (8.2%) | 25 (4.2%) |
| 10 to 14 Minutes | 22 (3.7%) | 64 (10.9%) |
| 15 to 19 Minutes | 44 (7.4%) | 106 (18.0%) |
| 20 to 24 Minutes | 0 (0.0%) | 73 (12.4%) |
| 25 to 29 Minutes | 0 (0.0%) | 5 (0.9%) |
| 30 to 34 Minutes | 117 (19.6%) | 103 (17.5%) |
| 35 to 39 Minutes | 54 (9.0%) | 46 (7.8%) |
| 40 to 44 Minutes | 39 (6.5%) | 51 (8.7%) |
| 45 to 59 Minutes | 124 (20.8%) | 34 (5.8%) |
| 60 to 89 Minutes | 111 (18.6%) | 40 (6.8%) |
| 90 or more Minutes | 37 (6.2%) | 42 (7.1%) |
Time of Departure to Work by Sex in Leonardo
The most frequent times of departure to work in Leonardo are 6:30 AM to 6:59 AM (141, 23.6%) for males and 4:00 PM to 11:59 PM (94, 16.0%) for females.
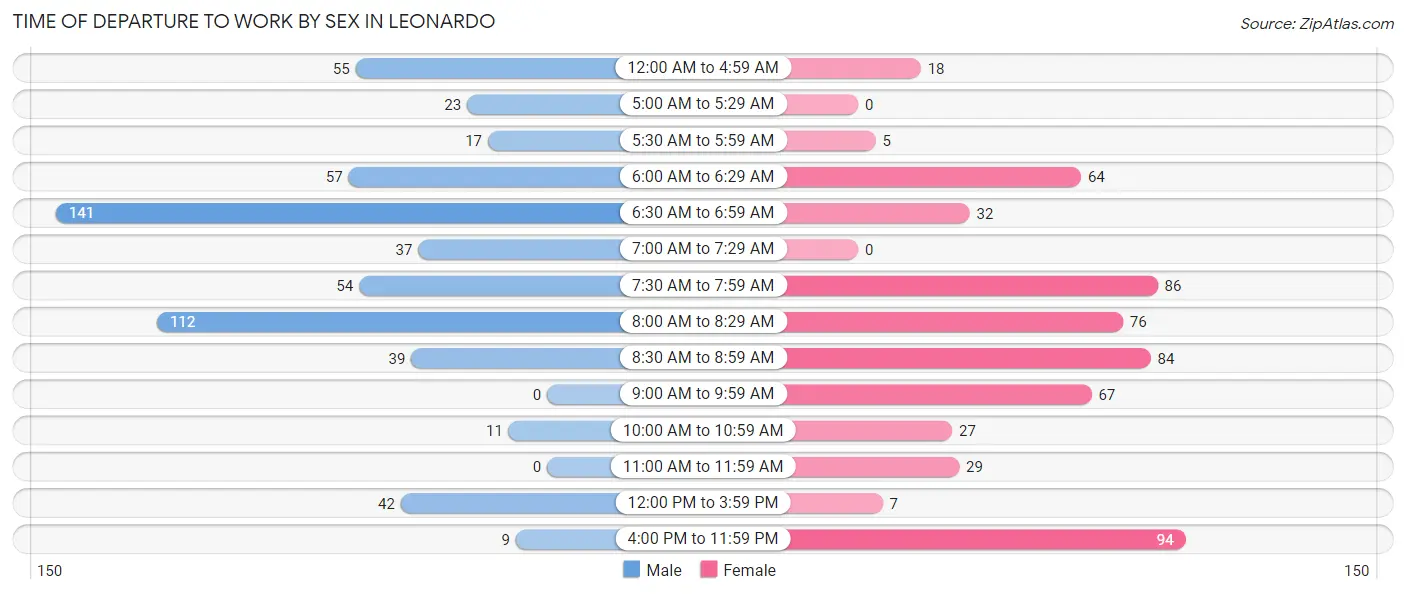
| Time of Departure | Male | Female |
| 12:00 AM to 4:59 AM | 55 (9.2%) | 18 (3.1%) |
| 5:00 AM to 5:29 AM | 23 (3.8%) | 0 (0.0%) |
| 5:30 AM to 5:59 AM | 17 (2.9%) | 5 (0.9%) |
| 6:00 AM to 6:29 AM | 57 (9.6%) | 64 (10.9%) |
| 6:30 AM to 6:59 AM | 141 (23.6%) | 32 (5.4%) |
| 7:00 AM to 7:29 AM | 37 (6.2%) | 0 (0.0%) |
| 7:30 AM to 7:59 AM | 54 (9.0%) | 86 (14.6%) |
| 8:00 AM to 8:29 AM | 112 (18.8%) | 76 (12.9%) |
| 8:30 AM to 8:59 AM | 39 (6.5%) | 84 (14.3%) |
| 9:00 AM to 9:59 AM | 0 (0.0%) | 67 (11.4%) |
| 10:00 AM to 10:59 AM | 11 (1.8%) | 27 (4.6%) |
| 11:00 AM to 11:59 AM | 0 (0.0%) | 29 (4.9%) |
| 12:00 PM to 3:59 PM | 42 (7.0%) | 7 (1.2%) |
| 4:00 PM to 11:59 PM | 9 (1.5%) | 94 (16.0%) |
| Total | 597 (100.0%) | 589 (100.0%) |
Housing Occupancy in Leonardo
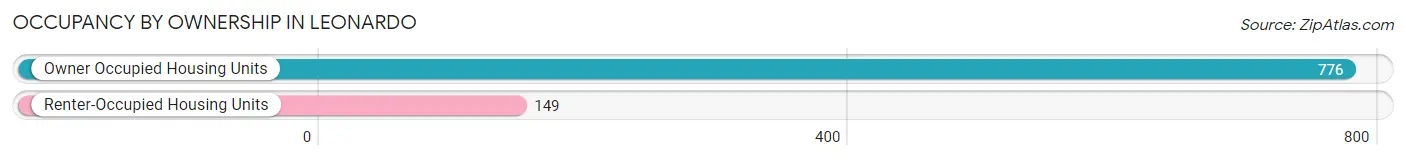
Occupancy by Ownership in Leonardo
Of the total 925 dwellings in Leonardo, owner-occupied units account for 776 (83.9%), while renter-occupied units make up 149 (16.1%).
| Occupancy | # Housing Units | % Housing Units |
| Owner Occupied Housing Units | 776 | 83.9% |
| Renter-Occupied Housing Units | 149 | 16.1% |
| Total Occupied Housing Units | 925 | 100.0% |
Occupancy by Household Size in Leonardo
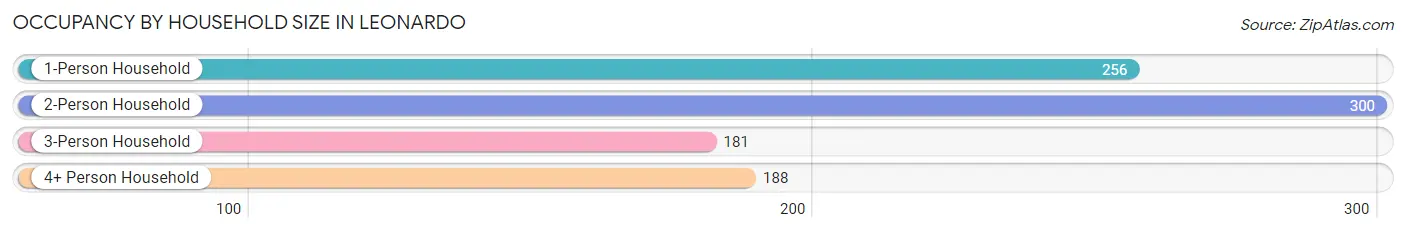
| Household Size | # Housing Units | % Housing Units |
| 1-Person Household | 256 | 27.7% |
| 2-Person Household | 300 | 32.4% |
| 3-Person Household | 181 | 19.6% |
| 4+ Person Household | 188 | 20.3% |
| Total Housing Units | 925 | 100.0% |
Occupancy by Ownership by Household Size in Leonardo
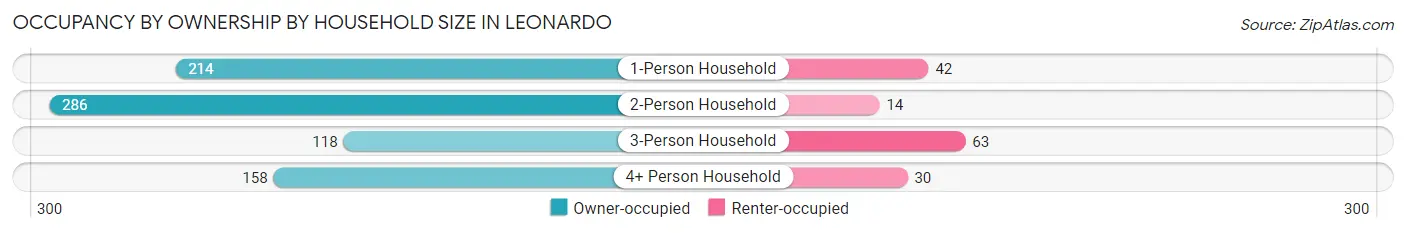
| Household Size | Owner-occupied | Renter-occupied |
| 1-Person Household | 214 (83.6%) | 42 (16.4%) |
| 2-Person Household | 286 (95.3%) | 14 (4.7%) |
| 3-Person Household | 118 (65.2%) | 63 (34.8%) |
| 4+ Person Household | 158 (84.0%) | 30 (16.0%) |
| Total Housing Units | 776 (83.9%) | 149 (16.1%) |
Occupancy by Educational Attainment in Leonardo
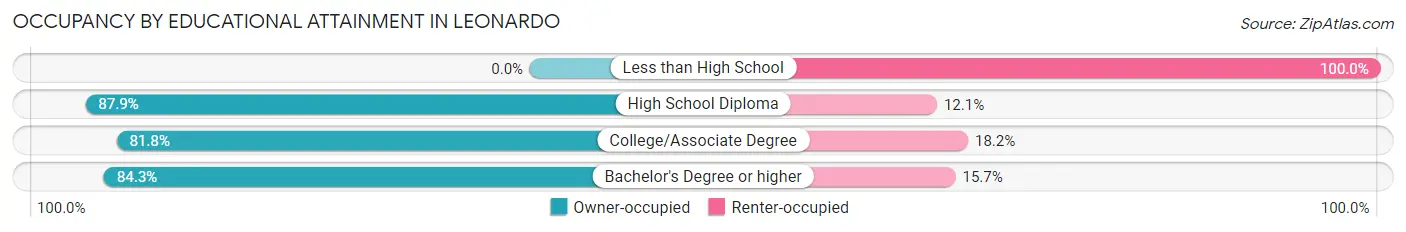
| Household Size | Owner-occupied | Renter-occupied |
| Less than High School | 0 (0.0%) | 9 (100.0%) |
| High School Diploma | 226 (87.9%) | 31 (12.1%) |
| College/Associate Degree | 175 (81.8%) | 39 (18.2%) |
| Bachelor's Degree or higher | 375 (84.3%) | 70 (15.7%) |
Occupancy by Age of Householder in Leonardo
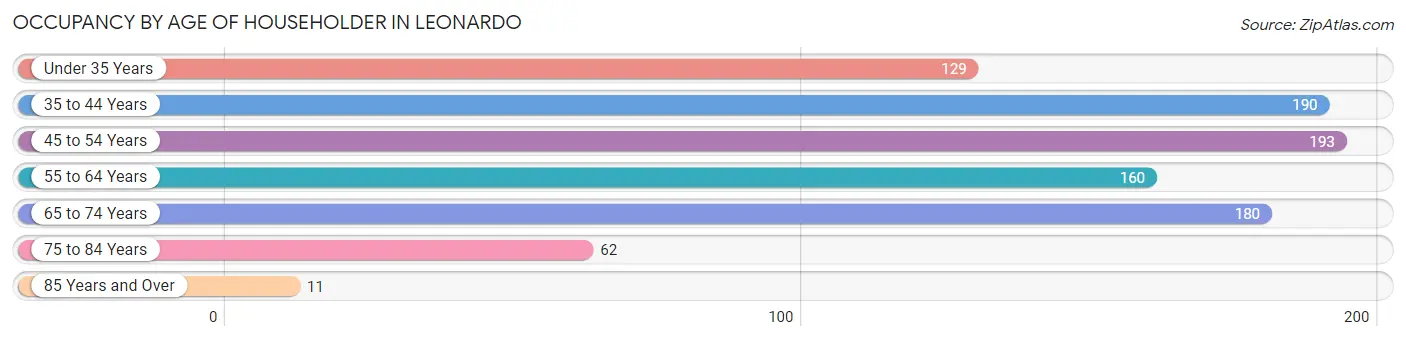
| Age Bracket | # Households | % Households |
| Under 35 Years | 129 | 14.0% |
| 35 to 44 Years | 190 | 20.5% |
| 45 to 54 Years | 193 | 20.9% |
| 55 to 64 Years | 160 | 17.3% |
| 65 to 74 Years | 180 | 19.5% |
| 75 to 84 Years | 62 | 6.7% |
| 85 Years and Over | 11 | 1.2% |
| Total | 925 | 100.0% |
Housing Finances in Leonardo
Median Income by Occupancy in Leonardo
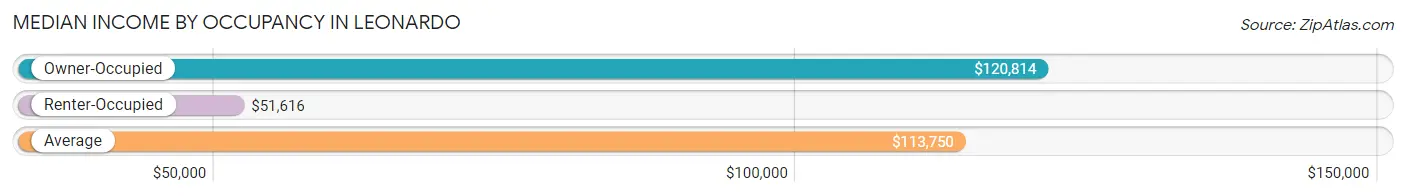
| Occupancy Type | # Households | Median Income |
| Owner-Occupied | 776 (83.9%) | $120,814 |
| Renter-Occupied | 149 (16.1%) | $51,616 |
| Average | 925 (100.0%) | $113,750 |
Occupancy by Householder Income Bracket in Leonardo
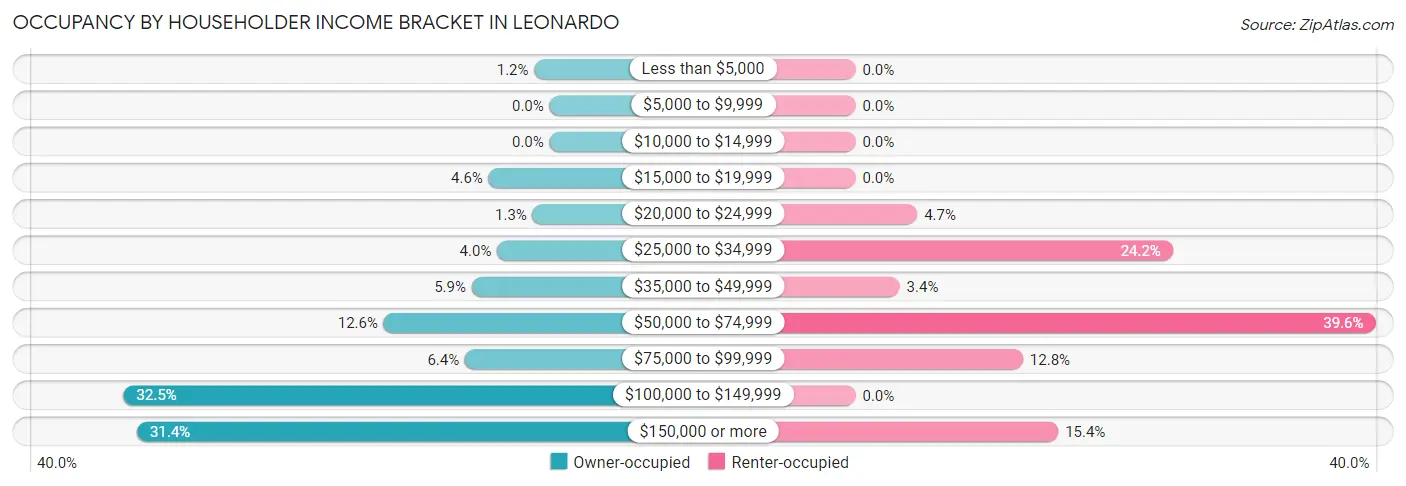
| Income Bracket | Owner-occupied | Renter-occupied |
| Less than $5,000 | 9 (1.2%) | 0 (0.0%) |
| $5,000 to $9,999 | 0 (0.0%) | 0 (0.0%) |
| $10,000 to $14,999 | 0 (0.0%) | 0 (0.0%) |
| $15,000 to $19,999 | 36 (4.6%) | 0 (0.0%) |
| $20,000 to $24,999 | 10 (1.3%) | 7 (4.7%) |
| $25,000 to $34,999 | 31 (4.0%) | 36 (24.2%) |
| $35,000 to $49,999 | 46 (5.9%) | 5 (3.4%) |
| $50,000 to $74,999 | 98 (12.6%) | 59 (39.6%) |
| $75,000 to $99,999 | 50 (6.4%) | 19 (12.8%) |
| $100,000 to $149,999 | 252 (32.5%) | 0 (0.0%) |
| $150,000 or more | 244 (31.4%) | 23 (15.4%) |
| Total | 776 (100.0%) | 149 (100.0%) |
Monthly Housing Cost Tiers in Leonardo
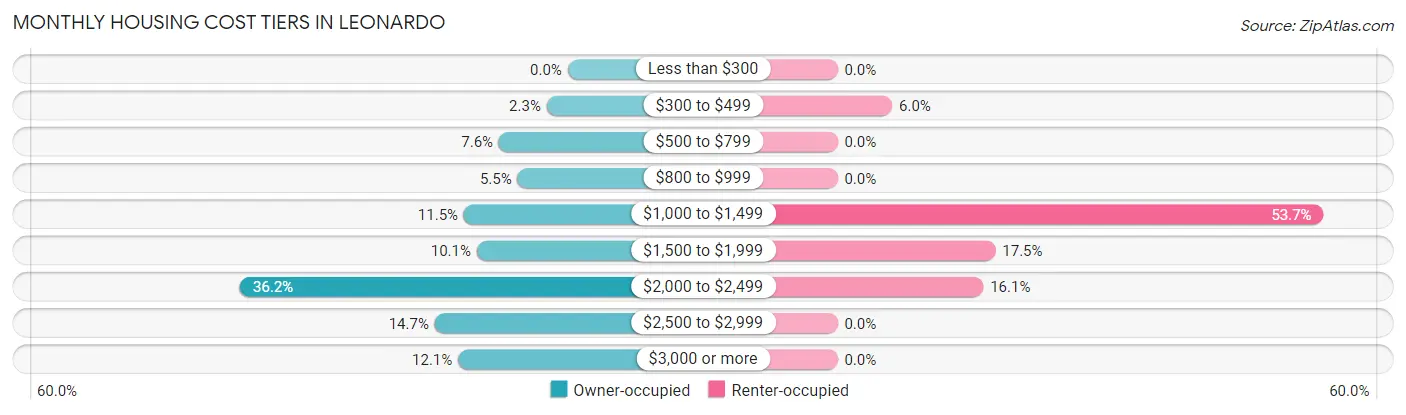
| Monthly Cost | Owner-occupied | Renter-occupied |
| Less than $300 | 0 (0.0%) | 0 (0.0%) |
| $300 to $499 | 18 (2.3%) | 9 (6.0%) |
| $500 to $799 | 59 (7.6%) | 0 (0.0%) |
| $800 to $999 | 43 (5.5%) | 0 (0.0%) |
| $1,000 to $1,499 | 89 (11.5%) | 80 (53.7%) |
| $1,500 to $1,999 | 78 (10.1%) | 26 (17.4%) |
| $2,000 to $2,499 | 281 (36.2%) | 24 (16.1%) |
| $2,500 to $2,999 | 114 (14.7%) | 0 (0.0%) |
| $3,000 or more | 94 (12.1%) | 0 (0.0%) |
| Total | 776 (100.0%) | 149 (100.0%) |
Physical Housing Characteristics in Leonardo
Housing Structures in Leonardo
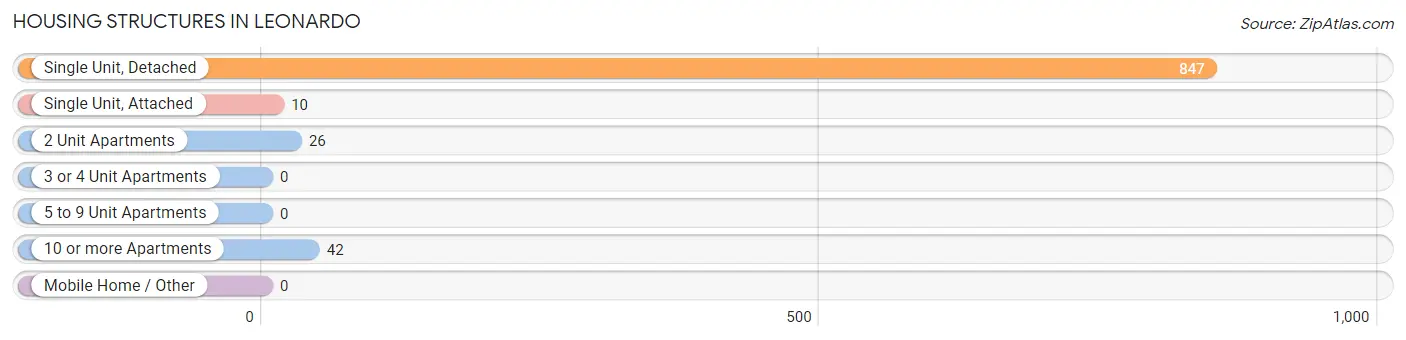
| Structure Type | # Housing Units | % Housing Units |
| Single Unit, Detached | 847 | 91.6% |
| Single Unit, Attached | 10 | 1.1% |
| 2 Unit Apartments | 26 | 2.8% |
| 3 or 4 Unit Apartments | 0 | 0.0% |
| 5 to 9 Unit Apartments | 0 | 0.0% |
| 10 or more Apartments | 42 | 4.5% |
| Mobile Home / Other | 0 | 0.0% |
| Total | 925 | 100.0% |
Housing Structures by Occupancy in Leonardo
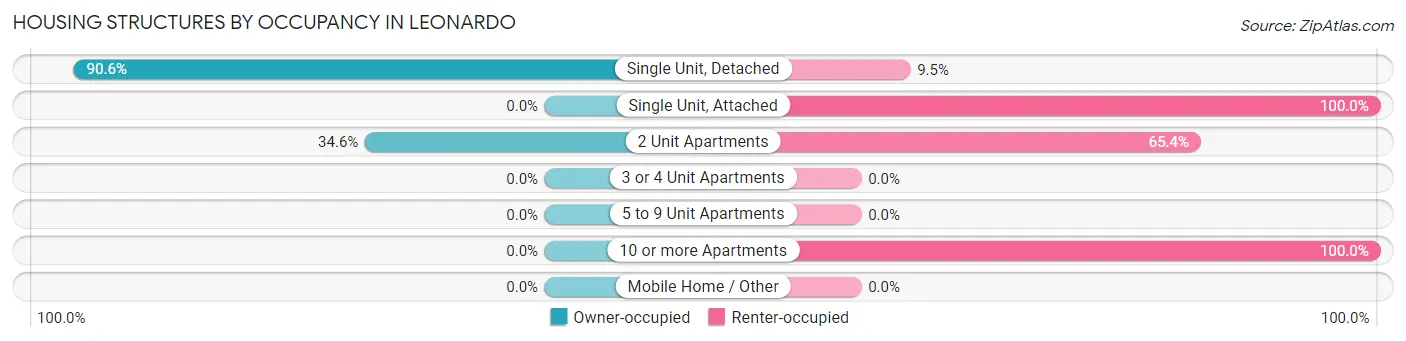
| Structure Type | Owner-occupied | Renter-occupied |
| Single Unit, Detached | 767 (90.5%) | 80 (9.5%) |
| Single Unit, Attached | 0 (0.0%) | 10 (100.0%) |
| 2 Unit Apartments | 9 (34.6%) | 17 (65.4%) |
| 3 or 4 Unit Apartments | 0 (0.0%) | 0 (0.0%) |
| 5 to 9 Unit Apartments | 0 (0.0%) | 0 (0.0%) |
| 10 or more Apartments | 0 (0.0%) | 42 (100.0%) |
| Mobile Home / Other | 0 (0.0%) | 0 (0.0%) |
| Total | 776 (83.9%) | 149 (16.1%) |
Housing Structures by Number of Rooms in Leonardo
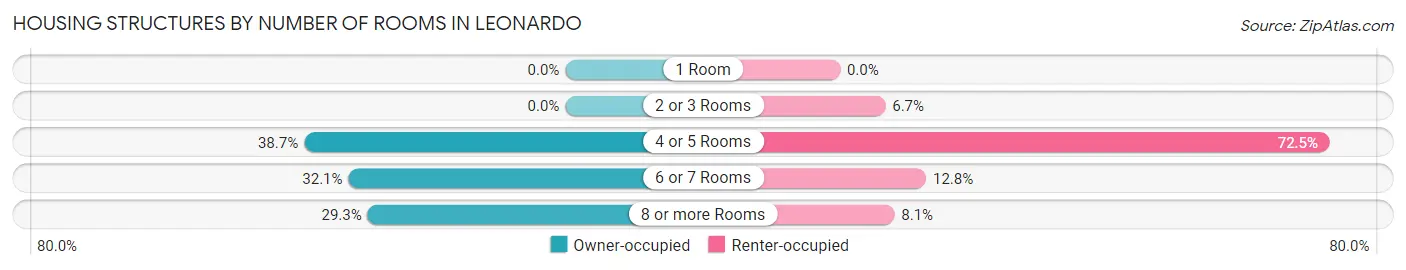
| Number of Rooms | Owner-occupied | Renter-occupied |
| 1 Room | 0 (0.0%) | 0 (0.0%) |
| 2 or 3 Rooms | 0 (0.0%) | 10 (6.7%) |
| 4 or 5 Rooms | 300 (38.7%) | 108 (72.5%) |
| 6 or 7 Rooms | 249 (32.1%) | 19 (12.8%) |
| 8 or more Rooms | 227 (29.2%) | 12 (8.1%) |
| Total | 776 (100.0%) | 149 (100.0%) |
Housing Structure by Heating Type in Leonardo
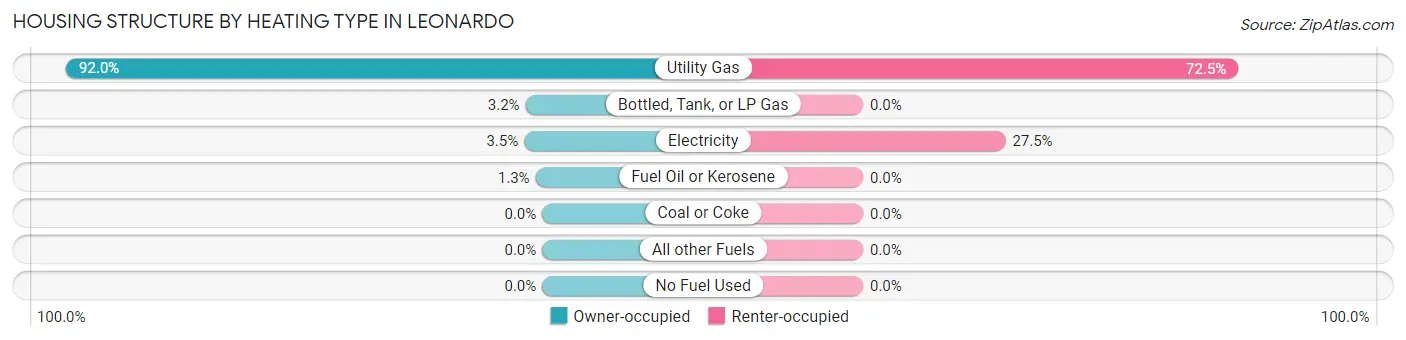
| Heating Type | Owner-occupied | Renter-occupied |
| Utility Gas | 714 (92.0%) | 108 (72.5%) |
| Bottled, Tank, or LP Gas | 25 (3.2%) | 0 (0.0%) |
| Electricity | 27 (3.5%) | 41 (27.5%) |
| Fuel Oil or Kerosene | 10 (1.3%) | 0 (0.0%) |
| Coal or Coke | 0 (0.0%) | 0 (0.0%) |
| All other Fuels | 0 (0.0%) | 0 (0.0%) |
| No Fuel Used | 0 (0.0%) | 0 (0.0%) |
| Total | 776 (100.0%) | 149 (100.0%) |
Household Vehicle Usage in Leonardo
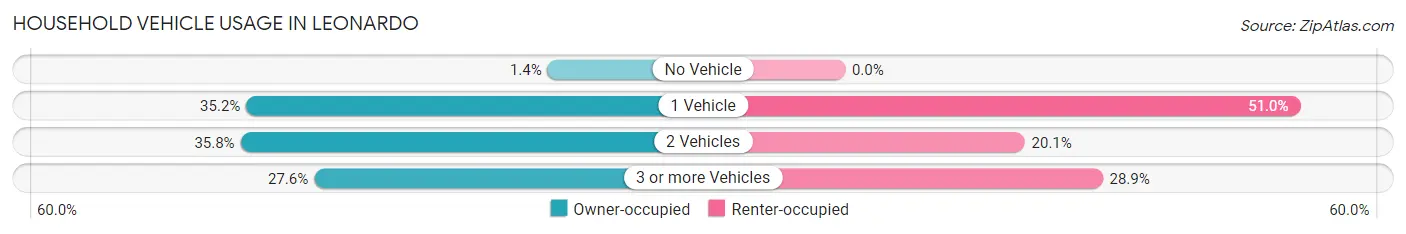
| Vehicles per Household | Owner-occupied | Renter-occupied |
| No Vehicle | 11 (1.4%) | 0 (0.0%) |
| 1 Vehicle | 273 (35.2%) | 76 (51.0%) |
| 2 Vehicles | 278 (35.8%) | 30 (20.1%) |
| 3 or more Vehicles | 214 (27.6%) | 43 (28.9%) |
| Total | 776 (100.0%) | 149 (100.0%) |
Real Estate & Mortgages in Leonardo
Real Estate and Mortgage Overview in Leonardo
| Characteristic | Without Mortgage | With Mortgage |
| Housing Units | 190 | 586 |
| Median Property Value | $345,200 | $406,500 |
| Median Household Income | $86,500 | $215 |
| Monthly Housing Costs | $875 | $94 |
| Real Estate Taxes | $6,296 | $15 |
Property Value by Mortgage Status in Leonardo
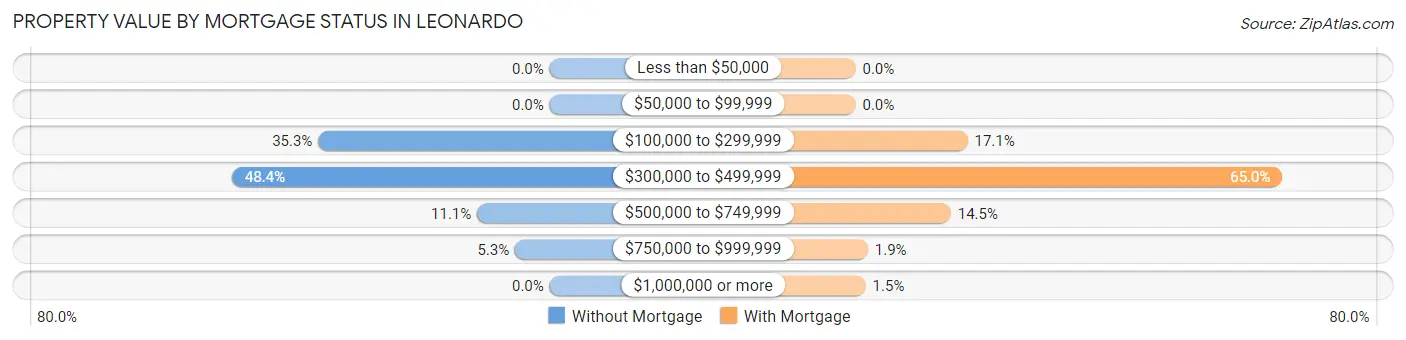
| Property Value | Without Mortgage | With Mortgage |
| Less than $50,000 | 0 (0.0%) | 0 (0.0%) |
| $50,000 to $99,999 | 0 (0.0%) | 0 (0.0%) |
| $100,000 to $299,999 | 67 (35.3%) | 100 (17.1%) |
| $300,000 to $499,999 | 92 (48.4%) | 381 (65.0%) |
| $500,000 to $749,999 | 21 (11.1%) | 85 (14.5%) |
| $750,000 to $999,999 | 10 (5.3%) | 11 (1.9%) |
| $1,000,000 or more | 0 (0.0%) | 9 (1.5%) |
| Total | 190 (100.0%) | 586 (100.0%) |
Household Income by Mortgage Status in Leonardo
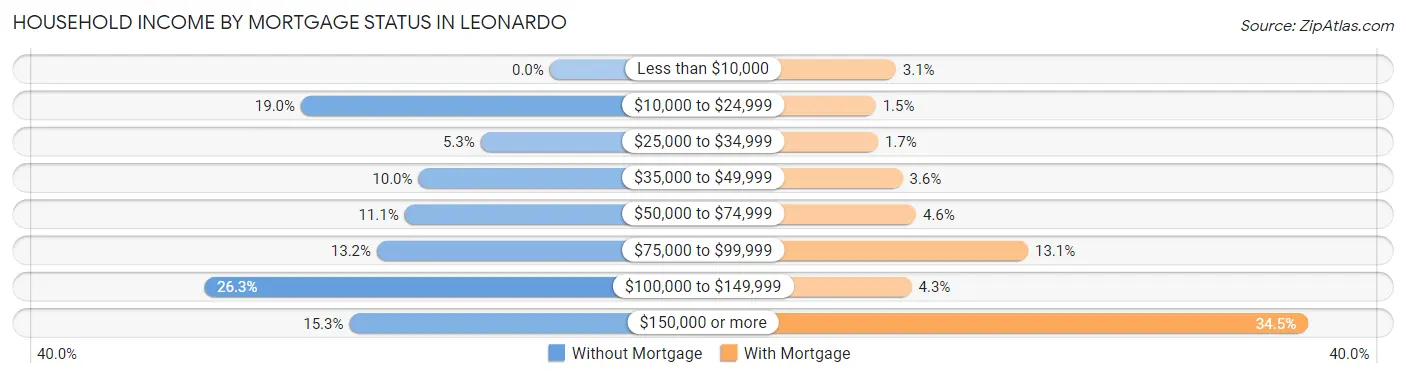
| Household Income | Without Mortgage | With Mortgage |
| Less than $10,000 | 0 (0.0%) | 18 (3.1%) |
| $10,000 to $24,999 | 36 (19.0%) | 9 (1.5%) |
| $25,000 to $34,999 | 10 (5.3%) | 10 (1.7%) |
| $35,000 to $49,999 | 19 (10.0%) | 21 (3.6%) |
| $50,000 to $74,999 | 21 (11.1%) | 27 (4.6%) |
| $75,000 to $99,999 | 25 (13.2%) | 77 (13.1%) |
| $100,000 to $149,999 | 50 (26.3%) | 25 (4.3%) |
| $150,000 or more | 29 (15.3%) | 202 (34.5%) |
| Total | 190 (100.0%) | 586 (100.0%) |
Property Value to Household Income Ratio in Leonardo
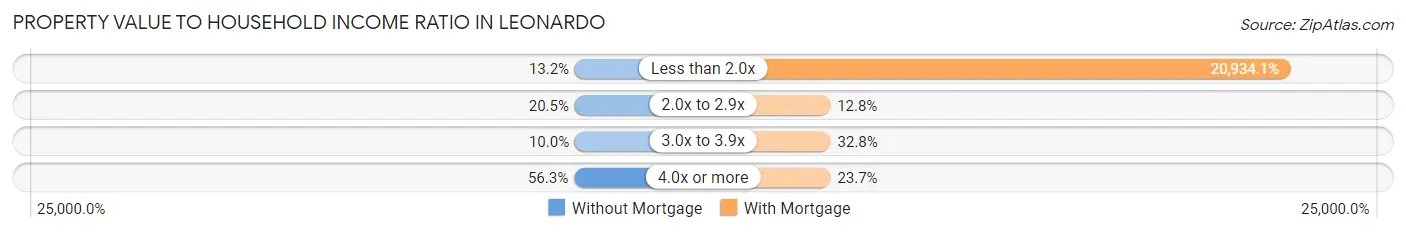
| Value-to-Income Ratio | Without Mortgage | With Mortgage |
| Less than 2.0x | 25 (13.2%) | 122,674 (20,934.1%) |
| 2.0x to 2.9x | 39 (20.5%) | 75 (12.8%) |
| 3.0x to 3.9x | 19 (10.0%) | 192 (32.8%) |
| 4.0x or more | 107 (56.3%) | 139 (23.7%) |
| Total | 190 (100.0%) | 586 (100.0%) |
Real Estate Taxes by Mortgage Status in Leonardo
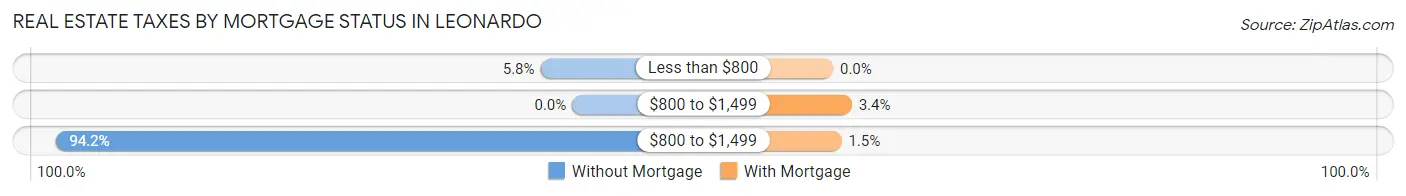
| Property Taxes | Without Mortgage | With Mortgage |
| Less than $800 | 11 (5.8%) | 0 (0.0%) |
| $800 to $1,499 | 0 (0.0%) | 20 (3.4%) |
| $800 to $1,499 | 179 (94.2%) | 9 (1.5%) |
| Total | 190 (100.0%) | 586 (100.0%) |
Health & Disability in Leonardo
Health Insurance Coverage by Age in Leonardo
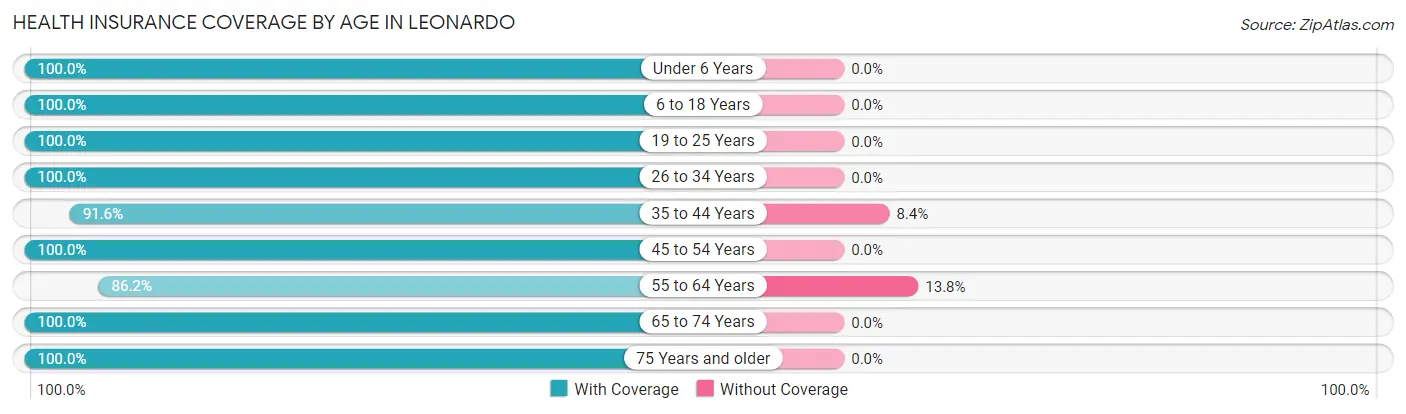
| Age Bracket | With Coverage | Without Coverage |
| Under 6 Years | 92 (100.0%) | 0 (0.0%) |
| 6 to 18 Years | 414 (100.0%) | 0 (0.0%) |
| 19 to 25 Years | 221 (100.0%) | 0 (0.0%) |
| 26 to 34 Years | 356 (100.0%) | 0 (0.0%) |
| 35 to 44 Years | 239 (91.6%) | 22 (8.4%) |
| 45 to 54 Years | 334 (100.0%) | 0 (0.0%) |
| 55 to 64 Years | 206 (86.2%) | 33 (13.8%) |
| 65 to 74 Years | 309 (100.0%) | 0 (0.0%) |
| 75 Years and older | 96 (100.0%) | 0 (0.0%) |
| Total | 2,267 (97.6%) | 55 (2.4%) |
Health Insurance Coverage by Citizenship Status in Leonardo
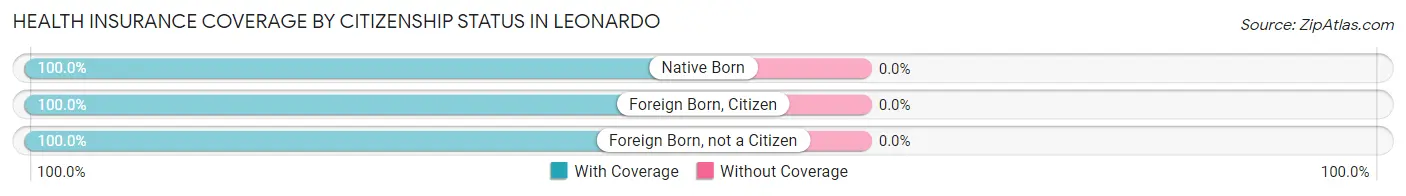
| Citizenship Status | With Coverage | Without Coverage |
| Native Born | 92 (100.0%) | 0 (0.0%) |
| Foreign Born, Citizen | 414 (100.0%) | 0 (0.0%) |
| Foreign Born, not a Citizen | 221 (100.0%) | 0 (0.0%) |
Health Insurance Coverage by Household Income in Leonardo
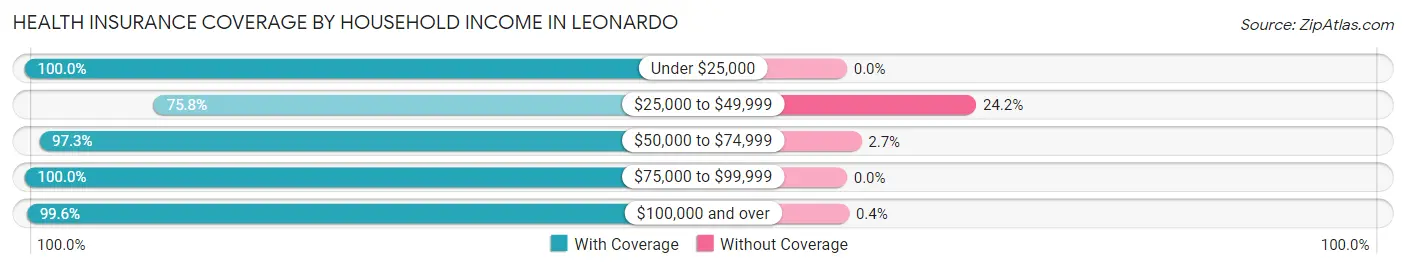
| Household Income | With Coverage | Without Coverage |
| Under $25,000 | 107 (100.0%) | 0 (0.0%) |
| $25,000 to $49,999 | 122 (75.8%) | 39 (24.2%) |
| $50,000 to $74,999 | 357 (97.3%) | 10 (2.7%) |
| $75,000 to $99,999 | 181 (100.0%) | 0 (0.0%) |
| $100,000 and over | 1,500 (99.6%) | 6 (0.4%) |
Public vs Private Health Insurance Coverage by Age in Leonardo
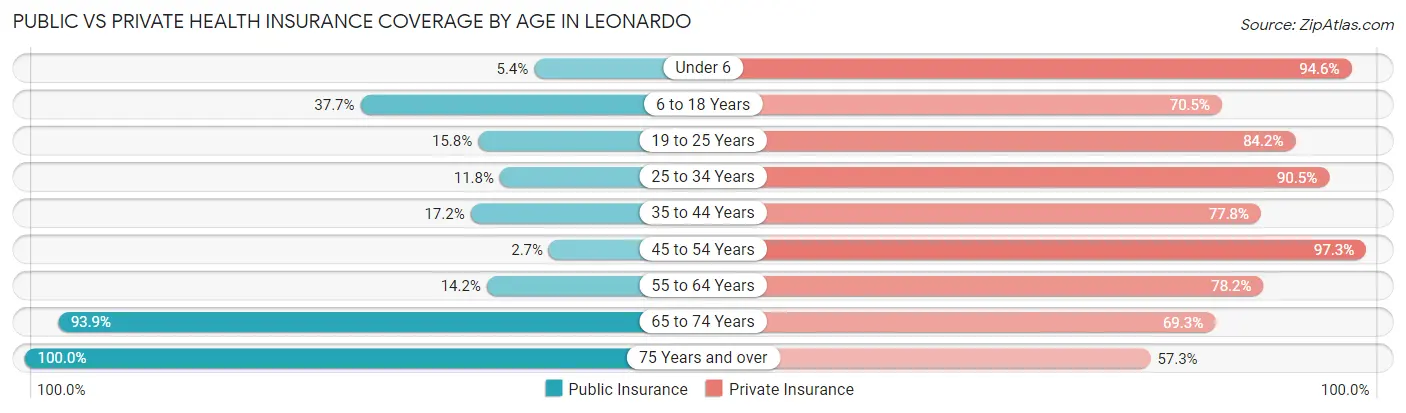
| Age Bracket | Public Insurance | Private Insurance |
| Under 6 | 5 (5.4%) | 87 (94.6%) |
| 6 to 18 Years | 156 (37.7%) | 292 (70.5%) |
| 19 to 25 Years | 35 (15.8%) | 186 (84.2%) |
| 25 to 34 Years | 42 (11.8%) | 322 (90.4%) |
| 35 to 44 Years | 45 (17.2%) | 203 (77.8%) |
| 45 to 54 Years | 9 (2.7%) | 325 (97.3%) |
| 55 to 64 Years | 34 (14.2%) | 187 (78.2%) |
| 65 to 74 Years | 290 (93.9%) | 214 (69.3%) |
| 75 Years and over | 96 (100.0%) | 55 (57.3%) |
| Total | 712 (30.7%) | 1,871 (80.6%) |
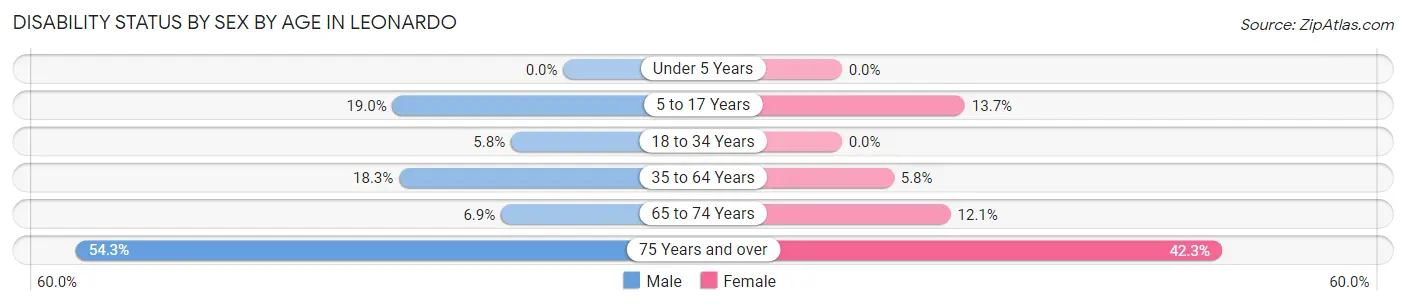
Disability Status by Sex by Age in Leonardo
| Age Bracket | Male | Female |
| Under 5 Years | 0 (0.0%) | 0 (0.0%) |
| 5 to 17 Years | 51 (19.0%) | 17 (13.7%) |
| 18 to 34 Years | 18 (5.8%) | 0 (0.0%) |
| 35 to 64 Years | 64 (18.3%) | 28 (5.8%) |
| 65 to 74 Years | 10 (6.9%) | 20 (12.1%) |
| 75 Years and over | 38 (54.3%) | 11 (42.3%) |
Disability Class by Sex by Age in Leonardo
Disability Class: Hearing Difficulty
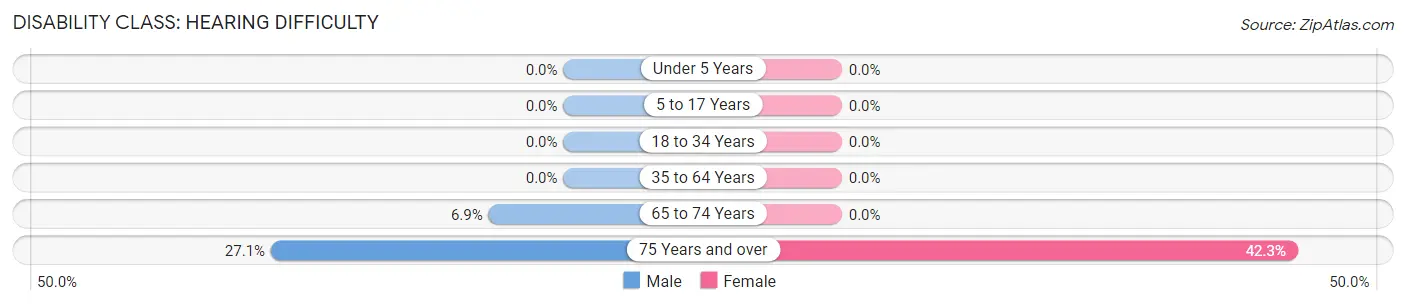
| Age Bracket | Male | Female |
| Under 5 Years | 0 (0.0%) | 0 (0.0%) |
| 5 to 17 Years | 0 (0.0%) | 0 (0.0%) |
| 18 to 34 Years | 0 (0.0%) | 0 (0.0%) |
| 35 to 64 Years | 0 (0.0%) | 0 (0.0%) |
| 65 to 74 Years | 10 (6.9%) | 0 (0.0%) |
| 75 Years and over | 19 (27.1%) | 11 (42.3%) |
Disability Class: Vision Difficulty
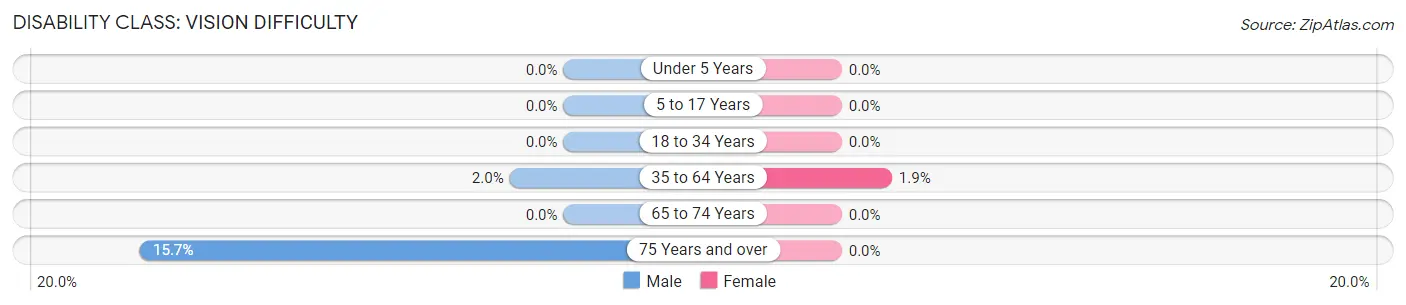
| Age Bracket | Male | Female |
| Under 5 Years | 0 (0.0%) | 0 (0.0%) |
| 5 to 17 Years | 0 (0.0%) | 0 (0.0%) |
| 18 to 34 Years | 0 (0.0%) | 0 (0.0%) |
| 35 to 64 Years | 7 (2.0%) | 9 (1.9%) |
| 65 to 74 Years | 0 (0.0%) | 0 (0.0%) |
| 75 Years and over | 11 (15.7%) | 0 (0.0%) |
Disability Class: Cognitive Difficulty
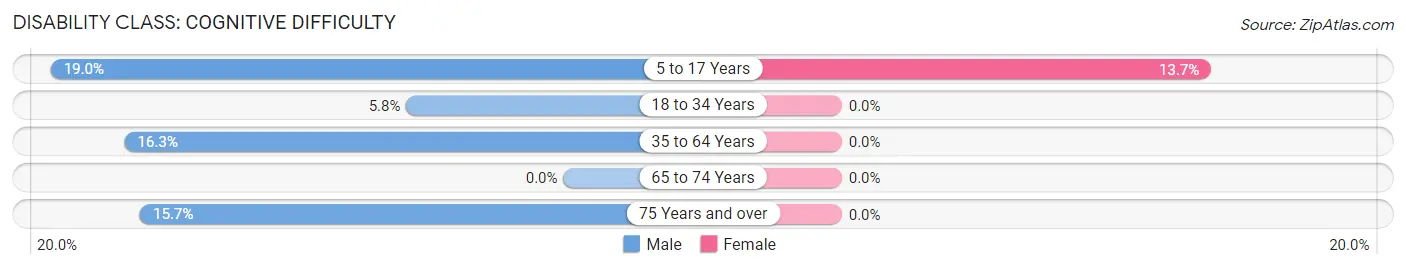
| Age Bracket | Male | Female |
| 5 to 17 Years | 51 (19.0%) | 17 (13.7%) |
| 18 to 34 Years | 18 (5.8%) | 0 (0.0%) |
| 35 to 64 Years | 57 (16.3%) | 0 (0.0%) |
| 65 to 74 Years | 0 (0.0%) | 0 (0.0%) |
| 75 Years and over | 11 (15.7%) | 0 (0.0%) |
Disability Class: Ambulatory Difficulty
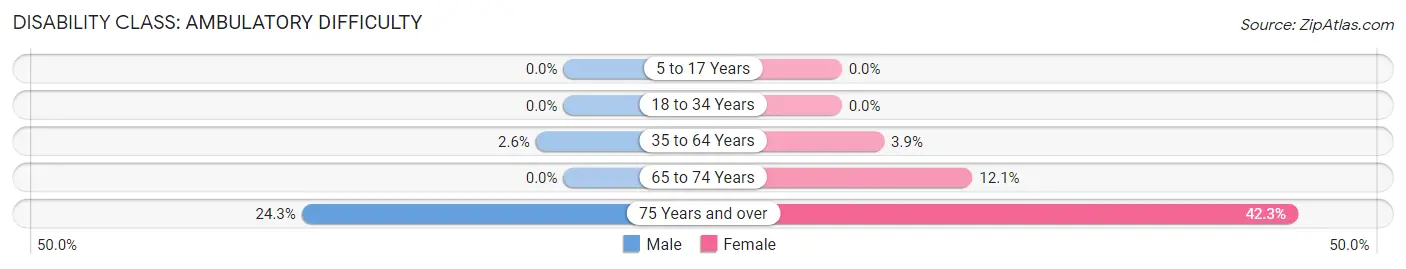
| Age Bracket | Male | Female |
| 5 to 17 Years | 0 (0.0%) | 0 (0.0%) |
| 18 to 34 Years | 0 (0.0%) | 0 (0.0%) |
| 35 to 64 Years | 9 (2.6%) | 19 (3.9%) |
| 65 to 74 Years | 0 (0.0%) | 20 (12.1%) |
| 75 Years and over | 17 (24.3%) | 11 (42.3%) |
Disability Class: Self-Care Difficulty
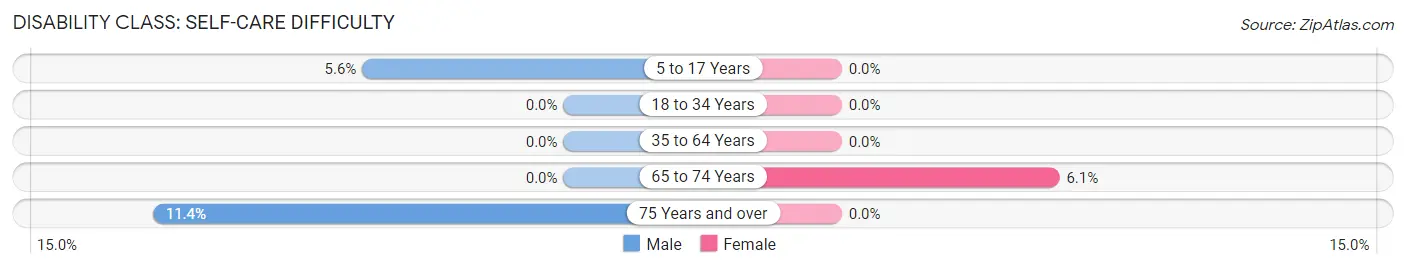
| Age Bracket | Male | Female |
| 5 to 17 Years | 15 (5.6%) | 0 (0.0%) |
| 18 to 34 Years | 0 (0.0%) | 0 (0.0%) |
| 35 to 64 Years | 0 (0.0%) | 0 (0.0%) |
| 65 to 74 Years | 0 (0.0%) | 10 (6.1%) |
| 75 Years and over | 8 (11.4%) | 0 (0.0%) |
Technology Access in Leonardo
Computing Device Access in Leonardo
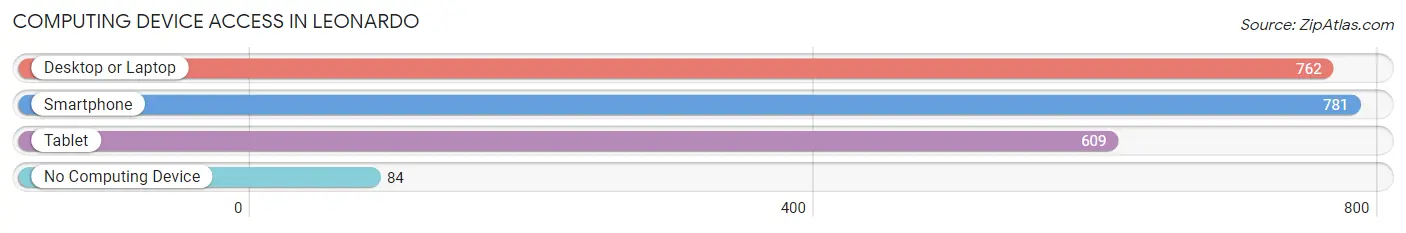
| Device Type | # Households | % Households |
| Desktop or Laptop | 762 | 82.4% |
| Smartphone | 781 | 84.4% |
| Tablet | 609 | 65.8% |
| No Computing Device | 84 | 9.1% |
| Total | 925 | 100.0% |
Internet Access in Leonardo
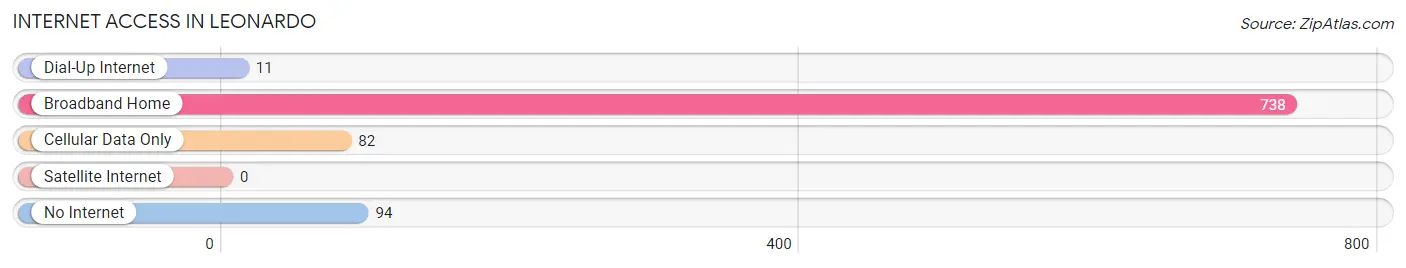
| Internet Type | # Households | % Households |
| Dial-Up Internet | 11 | 1.2% |
| Broadband Home | 738 | 79.8% |
| Cellular Data Only | 82 | 8.9% |
| Satellite Internet | 0 | 0.0% |
| No Internet | 94 | 10.2% |
| Total | 925 | 100.0% |
Leonardo Summary
Leonardo, NJ is a small borough located in Monmouth County, New Jersey. It is situated on the banks of the Navesink River and is part of the Bayshore region. The borough was incorporated in 1910 and has a population of approximately 2,000 people.
Geography
Leonardo is located at 40°21'25" North, 74°02'45" West (40.356944, -74.045278). It is bordered by the boroughs of Atlantic Highlands to the north, Highlands to the east, and Middletown to the south and west. The borough is situated on the banks of the Navesink River and is part of the Bayshore region. The total area of Leonardo is 0.7 square miles, all of which is land.
History
The area that is now Leonardo was originally inhabited by the Lenape Native Americans. The first European settlers arrived in the area in the late 17th century. The area was originally part of Middletown Township and was known as Navesink. In 1910, the area was incorporated as the borough of Leonardo.
Economy
The economy of Leonardo is largely based on tourism and services. The borough is home to several marinas, restaurants, and other businesses catering to tourists. The borough also has a few small manufacturing and industrial businesses.
Demographics
As of the 2010 census, the population of Leonardo was 2,077. The racial makeup of the borough was 94.2% White, 1.7% African American, 0.2% Native American, 1.3% Asian, 0.1% Pacific Islander, 1.2% from other races, and 1.4% from two or more races. Hispanic or Latino of any race were 5.2% of the population.
The median household income in Leonardo was $68,750, and the median family income was $76,250. The per capita income for the borough was $31,945. About 4.2% of families and 5.3% of the population were below the poverty line, including 6.2% of those under age 18 and 4.2% of those age 65 or over.
Common Questions
What is Per Capita Income in Leonardo?
Per Capita income in Leonardo is $45,697.
What is the Median Family Income in Leonardo?
Median Family Income in Leonardo is $124,273.
What is the Median Household income in Leonardo?
Median Household Income in Leonardo is $113,750.
What is Income or Wage Gap in Leonardo?
Income or Wage Gap in Leonardo is 23.6%.
Women in Leonardo earn 76.4 cents for every dollar earned by a man.
What is Inequality or Gini Index in Leonardo?
Inequality or Gini Index in Leonardo is 0.35.
What is the Total Population of Leonardo?
Total Population of Leonardo is 2,336.
What is the Total Male Population of Leonardo?
Total Male Population of Leonardo is 1,209.
What is the Total Female Population of Leonardo?
Total Female Population of Leonardo is 1,127.
What is the Ratio of Males per 100 Females in Leonardo?
There are 107.28 Males per 100 Females in Leonardo.
What is the Ratio of Females per 100 Males in Leonardo?
There are 93.22 Females per 100 Males in Leonardo.
What is the Median Population Age in Leonardo?
Median Population Age in Leonardo is 37.1 Years.
What is the Average Family Size in Leonardo
Average Family Size in Leonardo is 3.1 People.
What is the Average Household Size in Leonardo
Average Household Size in Leonardo is 2.5 People.
How Large is the Labor Force in Leonardo?
There are 1,355 People in the Labor Forcein in Leonardo.
What is the Percentage of People in the Labor Force in Leonardo?
68.7% of People are in the Labor Force in Leonardo.
What is the Unemployment Rate in Leonardo?
Unemployment Rate in Leonardo is 5.6%.