Strathmore, NJ Map & Demographics
Strathmore Map
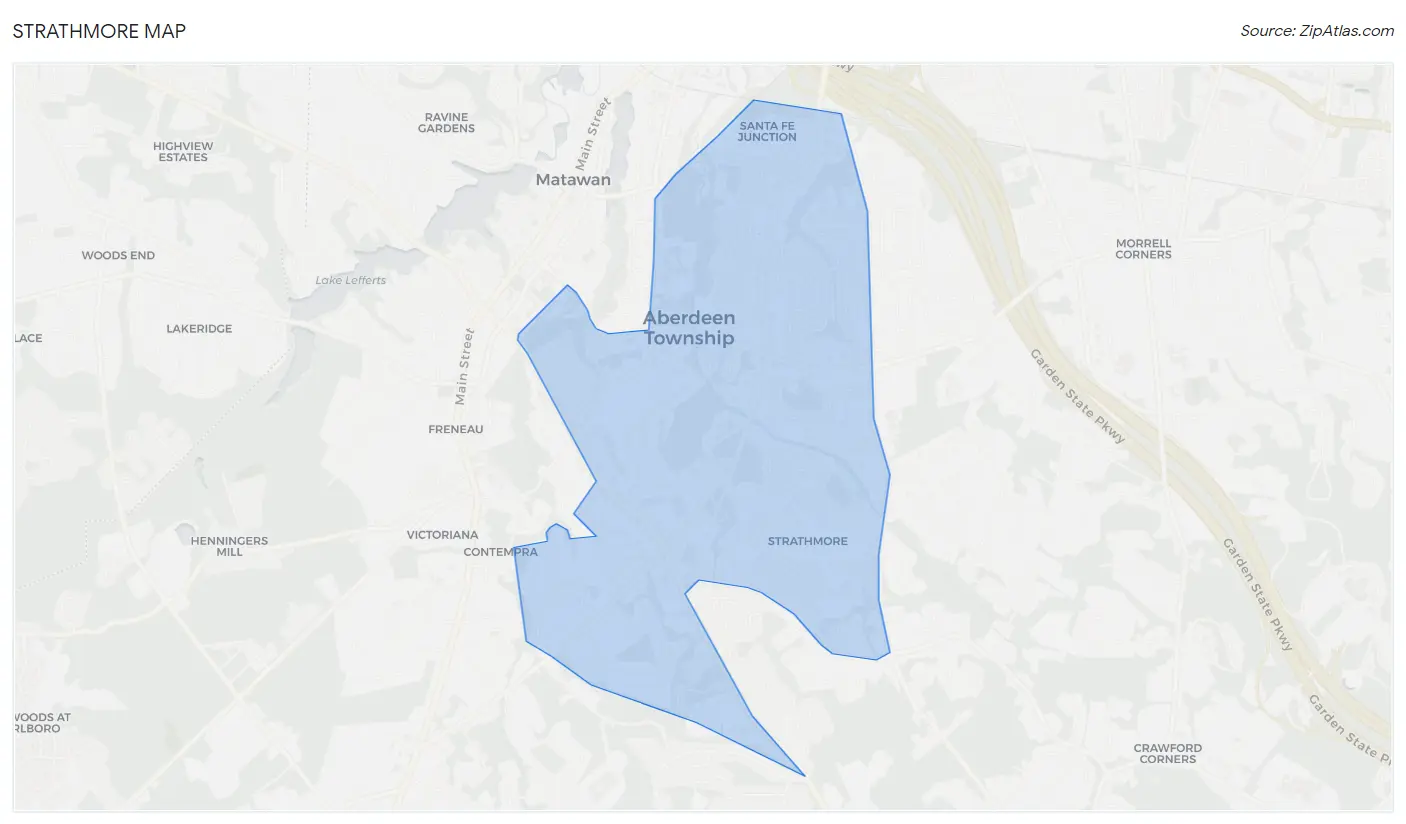
Strathmore Overview
$64,502
PER CAPITA INCOME
$162,538
AVG FAMILY INCOME
$153,988
AVG HOUSEHOLD INCOME
41.2%
WAGE / INCOME GAP [ % ]
58.8¢/ $1
WAGE / INCOME GAP [ $ ]
0.35
INEQUALITY / GINI INDEX
6,904
TOTAL POPULATION
3,456
MALE POPULATION
3,448
FEMALE POPULATION
100.23
MALES / 100 FEMALES
99.77
FEMALES / 100 MALES
44.0
MEDIAN AGE
3.0
AVG FAMILY SIZE
2.7
AVG HOUSEHOLD SIZE
4,109
LABOR FORCE [ PEOPLE ]
72.5%
PERCENT IN LABOR FORCE
5.2%
UNEMPLOYMENT RATE
Income in Strathmore
Income Overview in Strathmore
Per Capita Income in Strathmore is $64,502, while median incomes of families and households are $162,538 and $153,988 respectively.
| Characteristic | Number | Measure |
| Per Capita Income | 6,904 | $64,502 |
| Median Family Income | 2,050 | $162,538 |
| Mean Family Income | 2,050 | $189,100 |
| Median Household Income | 2,563 | $153,988 |
| Mean Household Income | 2,563 | $173,395 |
| Income Deficit | 2,050 | $0 |
| Wage / Income Gap (%) | 6,904 | 41.16% |
| Wage / Income Gap ($) | 6,904 | 58.84¢ per $1 |
| Gini / Inequality Index | 6,904 | 0.35 |
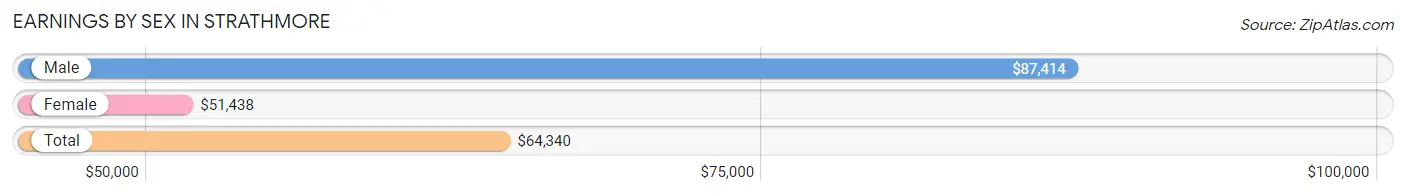
Earnings by Sex in Strathmore
Average Earnings in Strathmore are $64,340, $87,414 for men and $51,438 for women, a difference of 41.2%.
| Sex | Number | Average Earnings |
| Male | 2,198 (50.8%) | $87,414 |
| Female | 2,128 (49.2%) | $51,438 |
| Total | 4,326 (100.0%) | $64,340 |
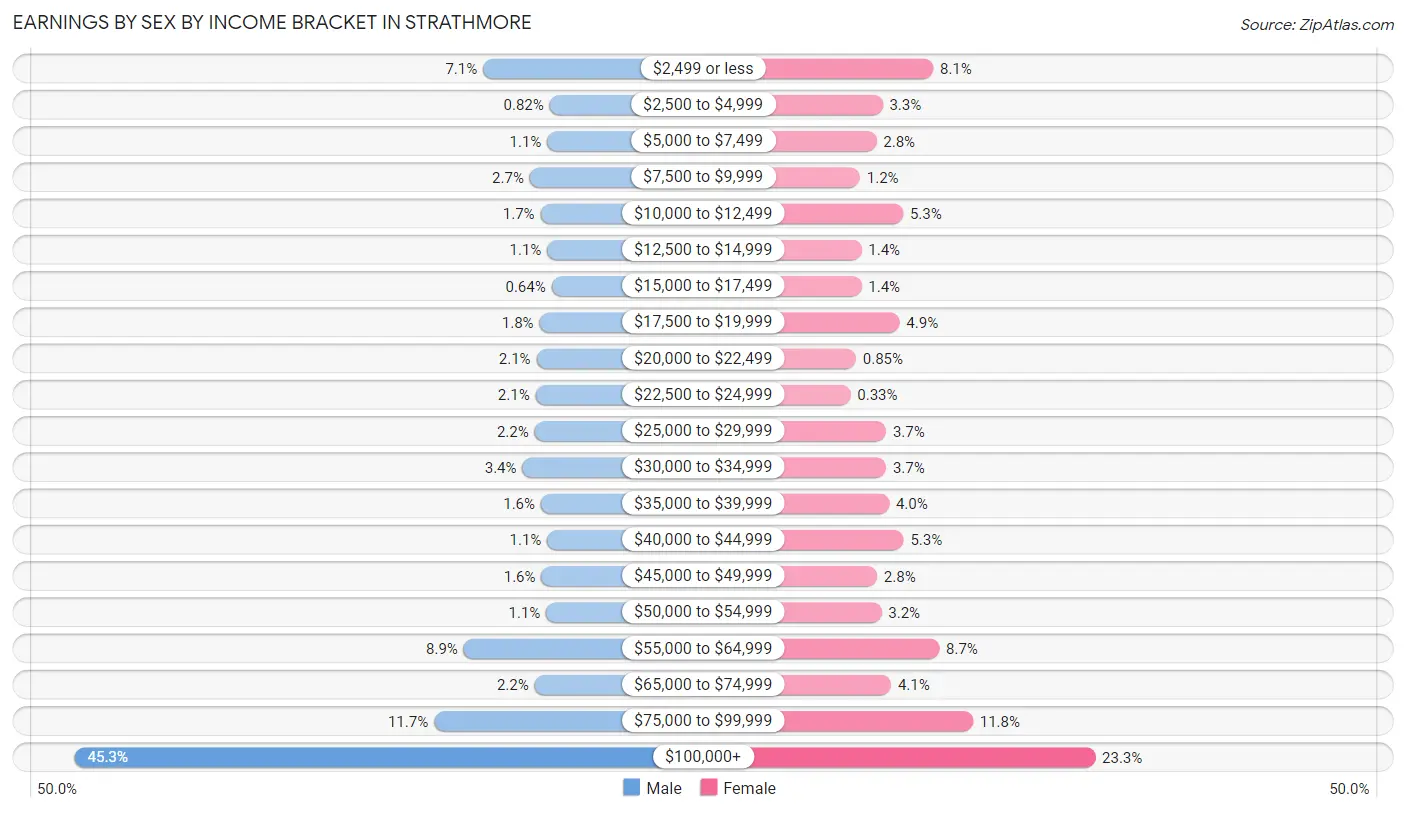
Earnings by Sex by Income Bracket in Strathmore
The most common earnings brackets in Strathmore are $100,000+ for men (996 | 45.3%) and $100,000+ for women (495 | 23.3%).
| Income | Male | Female |
| $2,499 or less | 155 (7.0%) | 172 (8.1%) |
| $2,500 to $4,999 | 18 (0.8%) | 71 (3.3%) |
| $5,000 to $7,499 | 23 (1.1%) | 59 (2.8%) |
| $7,500 to $9,999 | 59 (2.7%) | 26 (1.2%) |
| $10,000 to $12,499 | 37 (1.7%) | 112 (5.3%) |
| $12,500 to $14,999 | 23 (1.1%) | 29 (1.4%) |
| $15,000 to $17,499 | 14 (0.6%) | 29 (1.4%) |
| $17,500 to $19,999 | 39 (1.8%) | 105 (4.9%) |
| $20,000 to $22,499 | 45 (2.1%) | 18 (0.9%) |
| $22,500 to $24,999 | 47 (2.1%) | 7 (0.3%) |
| $25,000 to $29,999 | 49 (2.2%) | 78 (3.7%) |
| $30,000 to $34,999 | 74 (3.4%) | 78 (3.7%) |
| $35,000 to $39,999 | 36 (1.6%) | 84 (4.0%) |
| $40,000 to $44,999 | 23 (1.1%) | 113 (5.3%) |
| $45,000 to $49,999 | 35 (1.6%) | 60 (2.8%) |
| $50,000 to $54,999 | 25 (1.1%) | 69 (3.2%) |
| $55,000 to $64,999 | 195 (8.9%) | 184 (8.6%) |
| $65,000 to $74,999 | 49 (2.2%) | 88 (4.1%) |
| $75,000 to $99,999 | 256 (11.7%) | 251 (11.8%) |
| $100,000+ | 996 (45.3%) | 495 (23.3%) |
| Total | 2,198 (100.0%) | 2,128 (100.0%) |
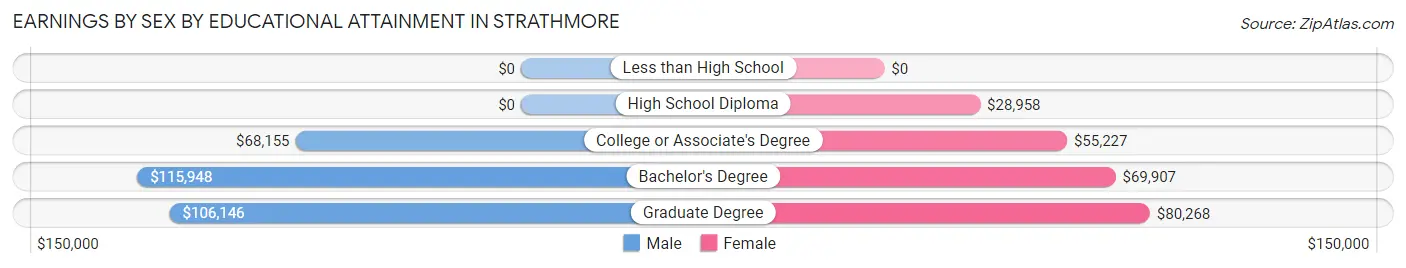
Earnings by Sex by Educational Attainment in Strathmore
Average earnings in Strathmore are $101,120 for men and $61,599 for women, a difference of 39.1%. Men with an educational attainment of bachelor's degree enjoy the highest average annual earnings of $115,948, while those with college or associate's degree education earn the least with $68,155. Women with an educational attainment of graduate degree earn the most with the average annual earnings of $80,268, while those with high school diploma education have the smallest earnings of $28,958.
| Educational Attainment | Male Income | Female Income |
| Less than High School | - | - |
| High School Diploma | - | - |
| College or Associate's Degree | $68,155 | $55,227 |
| Bachelor's Degree | $115,948 | $69,907 |
| Graduate Degree | $106,146 | $80,268 |
| Total | $101,120 | $61,599 |
Family Income in Strathmore
Family Income Brackets in Strathmore
According to the Strathmore family income data, there are 672 families falling into the $200,000+ income range, which is the most common income bracket and makes up 32.8% of all families.
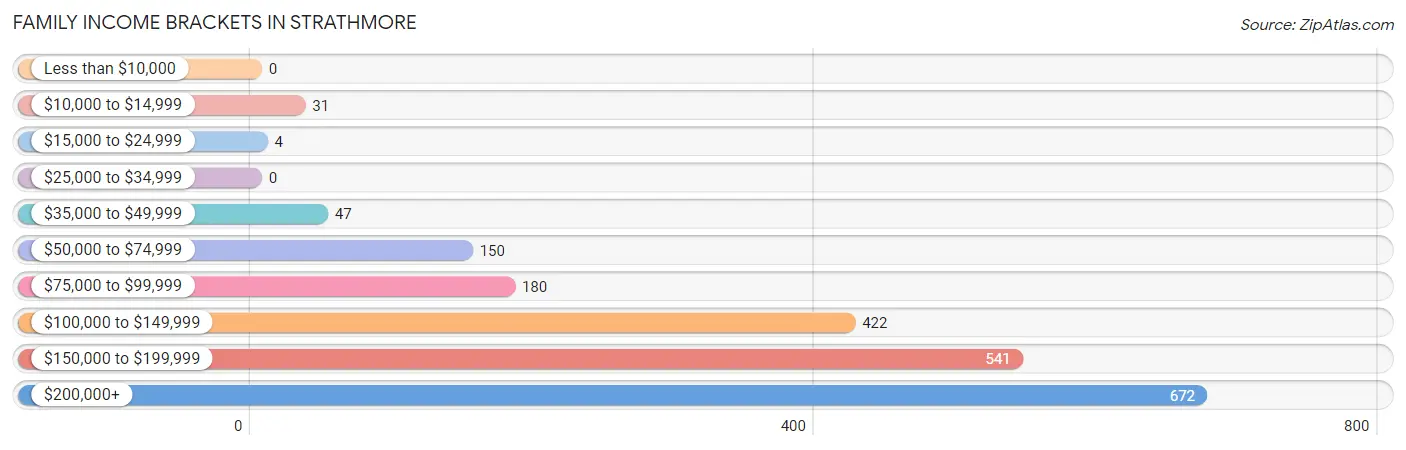
| Income Bracket | # Families | % Families |
| Less than $10,000 | 0 | 0.0% |
| $10,000 to $14,999 | 31 | 1.5% |
| $15,000 to $24,999 | 4 | 0.2% |
| $25,000 to $34,999 | 0 | 0.0% |
| $35,000 to $49,999 | 47 | 2.3% |
| $50,000 to $74,999 | 150 | 7.3% |
| $75,000 to $99,999 | 180 | 8.8% |
| $100,000 to $149,999 | 422 | 20.6% |
| $150,000 to $199,999 | 541 | 26.4% |
| $200,000+ | 672 | 32.8% |
Family Income by Famaliy Size in Strathmore
3-person families (540 | 26.3%) account for the highest median family income in Strathmore with $188,598 per family, while 2-person families (838 | 40.9%) have the highest median income of $77,952 per family member.
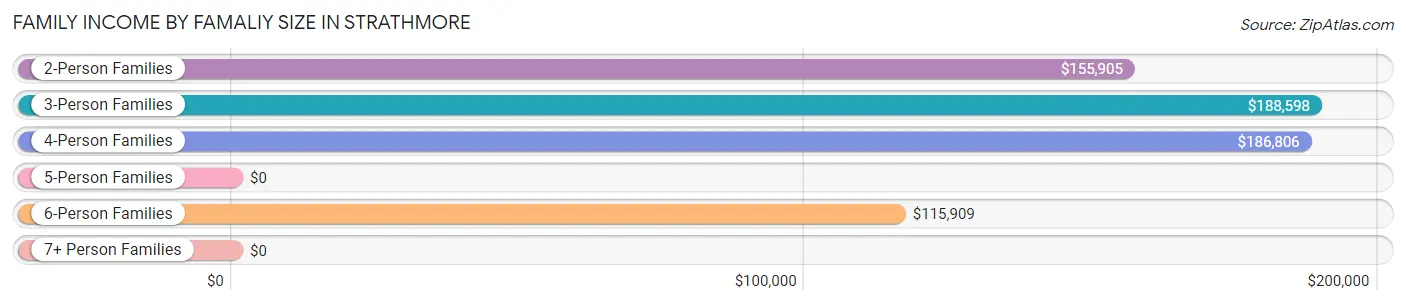
| Income Bracket | # Families | Median Income |
| 2-Person Families | 838 (40.9%) | $155,905 |
| 3-Person Families | 540 (26.3%) | $188,598 |
| 4-Person Families | 551 (26.9%) | $186,806 |
| 5-Person Families | 101 (4.9%) | $0 |
| 6-Person Families | 20 (1.0%) | $115,909 |
| 7+ Person Families | 0 (0.0%) | $0 |
| Total | 2,050 (100.0%) | $162,538 |
Family Income by Number of Earners in Strathmore
The median family income in Strathmore is $162,538, with families comprising 3+ earners (414) having the highest median family income of $188,306, while families with no earners (151) have the lowest median family income of $106,771, accounting for 20.2% and 7.4% of families, respectively.
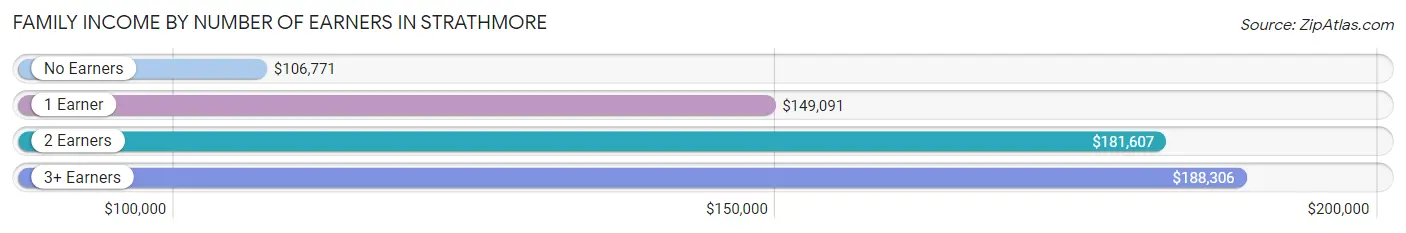
| Number of Earners | # Families | Median Income |
| No Earners | 151 (7.4%) | $106,771 |
| 1 Earner | 494 (24.1%) | $149,091 |
| 2 Earners | 991 (48.3%) | $181,607 |
| 3+ Earners | 414 (20.2%) | $188,306 |
| Total | 2,050 (100.0%) | $162,538 |
Household Income in Strathmore
Household Income Brackets in Strathmore
With 769 households falling in the category, the $200,000+ income range is the most frequent in Strathmore, accounting for 30.0% of all households. In contrast, only 13 households (0.5%) fall into the $15,000 to $24,999 income bracket, making it the least populous group.
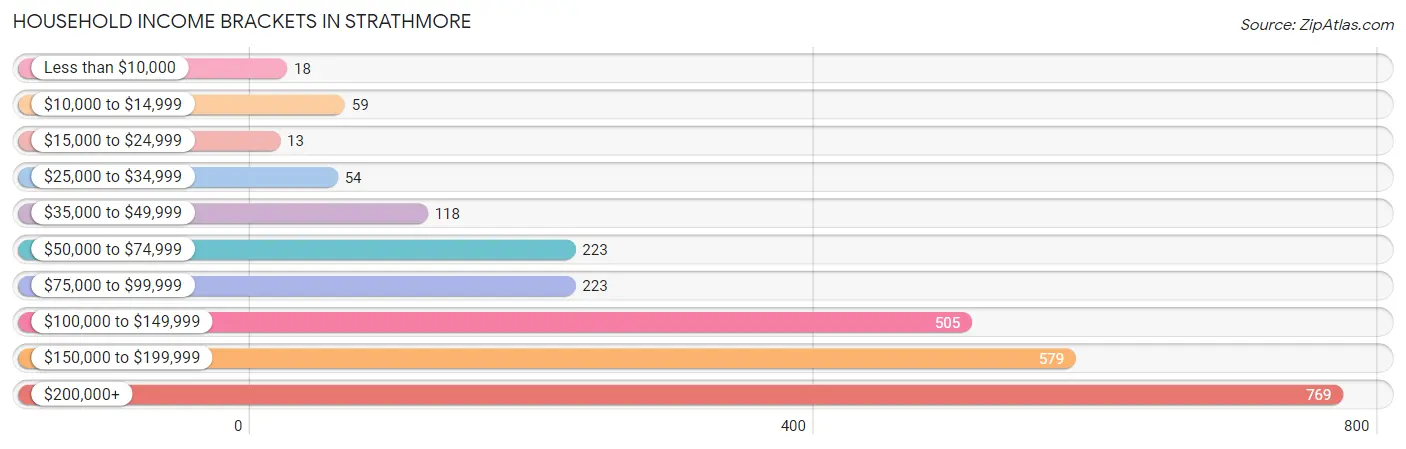
| Income Bracket | # Households | % Households |
| Less than $10,000 | 18 | 0.7% |
| $10,000 to $14,999 | 59 | 2.3% |
| $15,000 to $24,999 | 13 | 0.5% |
| $25,000 to $34,999 | 54 | 2.1% |
| $35,000 to $49,999 | 118 | 4.6% |
| $50,000 to $74,999 | 223 | 8.7% |
| $75,000 to $99,999 | 223 | 8.7% |
| $100,000 to $149,999 | 505 | 19.7% |
| $150,000 to $199,999 | 579 | 22.6% |
| $200,000+ | 769 | 30.0% |
Household Income by Householder Age in Strathmore
The median household income in Strathmore is $153,988, with the highest median household income of $168,971 found in the 25 to 44 years age bracket for the primary householder. A total of 658 households (25.7%) fall into this category.
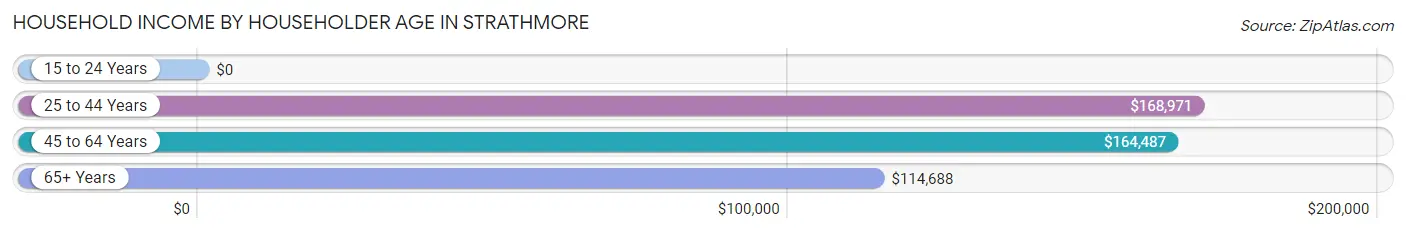
| Income Bracket | # Households | Median Income |
| 15 to 24 Years | 0 (0.0%) | $0 |
| 25 to 44 Years | 658 (25.7%) | $168,971 |
| 45 to 64 Years | 1,153 (45.0%) | $164,487 |
| 65+ Years | 752 (29.3%) | $114,688 |
| Total | 2,563 (100.0%) | $153,988 |
Poverty in Strathmore
Income Below Poverty by Sex and Age in Strathmore
With 2.5% poverty level for males and 2.1% for females among the residents of Strathmore, 12 to 14 year old males and 35 to 44 year old females are the most vulnerable to poverty, with 26 males (15.3%) and 39 females (9.5%) in their respective age groups living below the poverty level.
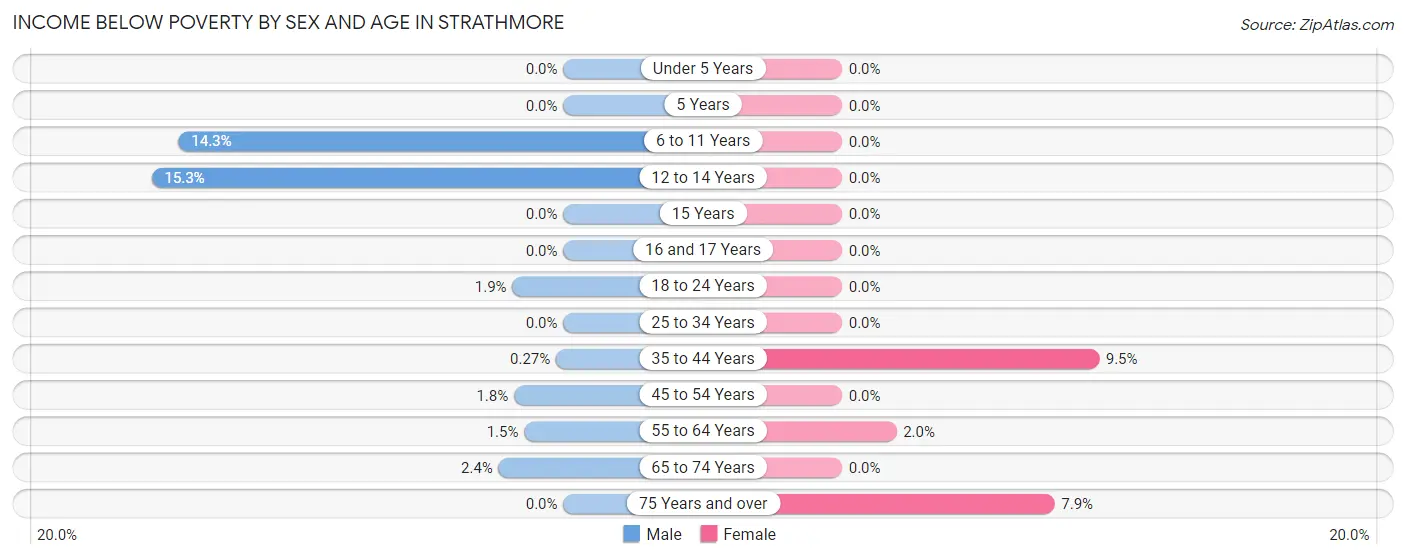
| Age Bracket | Male | Female |
| Under 5 Years | 0 (0.0%) | 0 (0.0%) |
| 5 Years | 0 (0.0%) | 0 (0.0%) |
| 6 to 11 Years | 27 (14.3%) | 0 (0.0%) |
| 12 to 14 Years | 26 (15.3%) | 0 (0.0%) |
| 15 Years | 0 (0.0%) | 0 (0.0%) |
| 16 and 17 Years | 0 (0.0%) | 0 (0.0%) |
| 18 to 24 Years | 5 (1.9%) | 0 (0.0%) |
| 25 to 34 Years | 0 (0.0%) | 0 (0.0%) |
| 35 to 44 Years | 1 (0.3%) | 39 (9.5%) |
| 45 to 54 Years | 9 (1.8%) | 0 (0.0%) |
| 55 to 64 Years | 8 (1.5%) | 11 (2.0%) |
| 65 to 74 Years | 8 (2.4%) | 0 (0.0%) |
| 75 Years and over | 0 (0.0%) | 22 (7.9%) |
| Total | 84 (2.5%) | 72 (2.1%) |
Income Above Poverty by Sex and Age in Strathmore
According to the poverty statistics in Strathmore, males aged under 5 years and females aged under 5 years are the age groups that are most secure financially, with 100.0% of males and 100.0% of females in these age groups living above the poverty line.
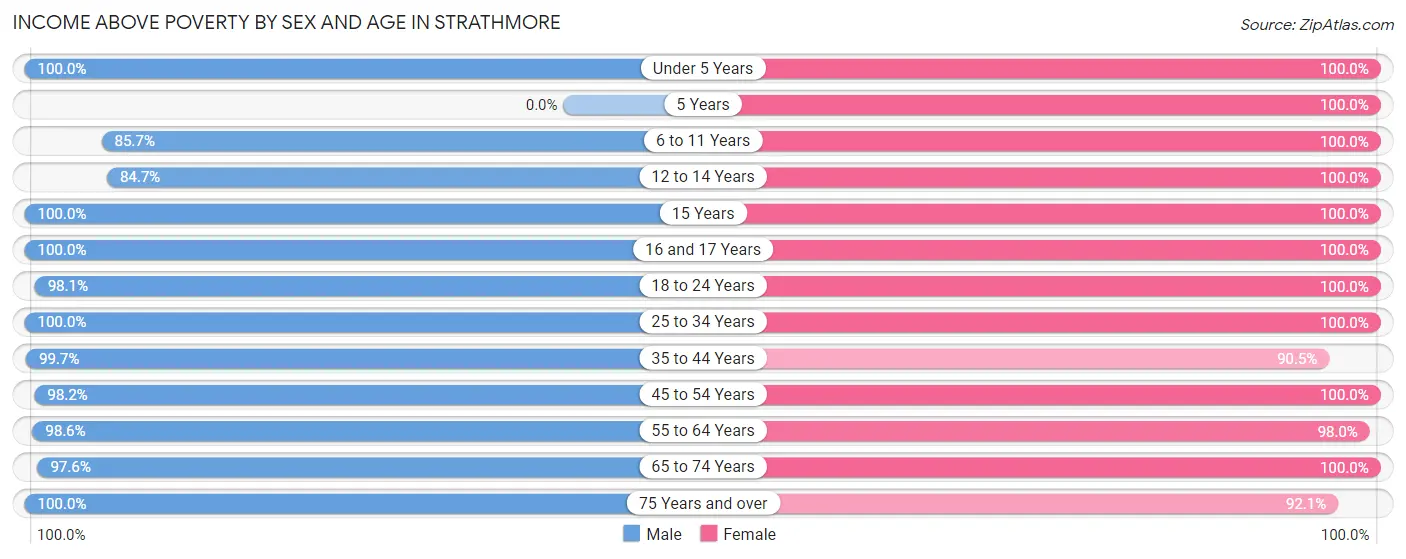
| Age Bracket | Male | Female |
| Under 5 Years | 295 (100.0%) | 112 (100.0%) |
| 5 Years | 0 (0.0%) | 76 (100.0%) |
| 6 to 11 Years | 162 (85.7%) | 128 (100.0%) |
| 12 to 14 Years | 144 (84.7%) | 168 (100.0%) |
| 15 Years | 37 (100.0%) | 9 (100.0%) |
| 16 and 17 Years | 82 (100.0%) | 169 (100.0%) |
| 18 to 24 Years | 260 (98.1%) | 198 (100.0%) |
| 25 to 34 Years | 402 (100.0%) | 398 (100.0%) |
| 35 to 44 Years | 363 (99.7%) | 370 (90.5%) |
| 45 to 54 Years | 482 (98.2%) | 523 (100.0%) |
| 55 to 64 Years | 543 (98.6%) | 534 (98.0%) |
| 65 to 74 Years | 325 (97.6%) | 417 (100.0%) |
| 75 Years and over | 242 (100.0%) | 257 (92.1%) |
| Total | 3,337 (97.5%) | 3,359 (97.9%) |
Income Below Poverty Among Married-Couple Families in Strathmore
The poverty statistics for married-couple families in Strathmore show that 0.2% or 4 of the total 1,783 families live below the poverty line. Families with no children have the highest poverty rate of 0.4%, comprising of 4 families. On the other hand, families with 1 or 2 children have the lowest poverty rate of 0.0%, which includes 0 families.
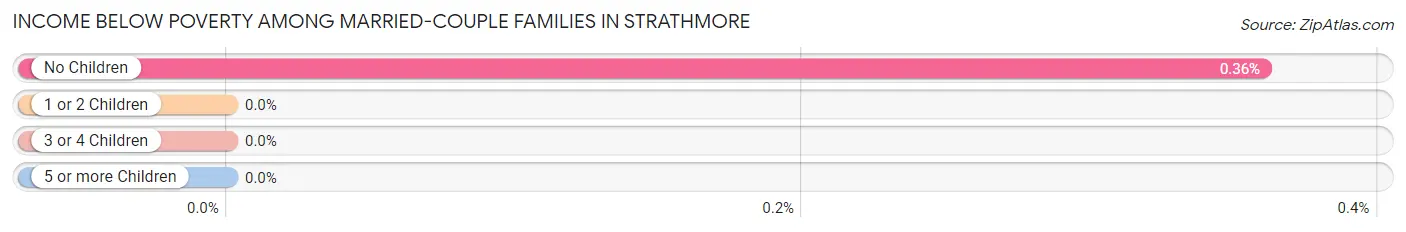
| Children | Above Poverty | Below Poverty |
| No Children | 1,102 (99.6%) | 4 (0.4%) |
| 1 or 2 Children | 627 (100.0%) | 0 (0.0%) |
| 3 or 4 Children | 50 (100.0%) | 0 (0.0%) |
| 5 or more Children | 0 (0.0%) | 0 (0.0%) |
| Total | 1,779 (99.8%) | 4 (0.2%) |
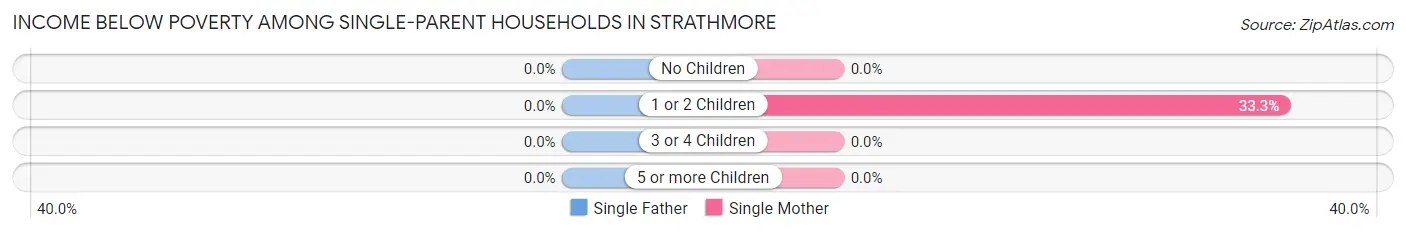
Income Below Poverty Among Single-Parent Households in Strathmore
| Children | Single Father | Single Mother |
| No Children | 0 (0.0%) | 0 (0.0%) |
| 1 or 2 Children | 0 (0.0%) | 27 (33.3%) |
| 3 or 4 Children | 0 (0.0%) | 0 (0.0%) |
| 5 or more Children | 0 (0.0%) | 0 (0.0%) |
| Total | 0 (0.0%) | 27 (15.0%) |
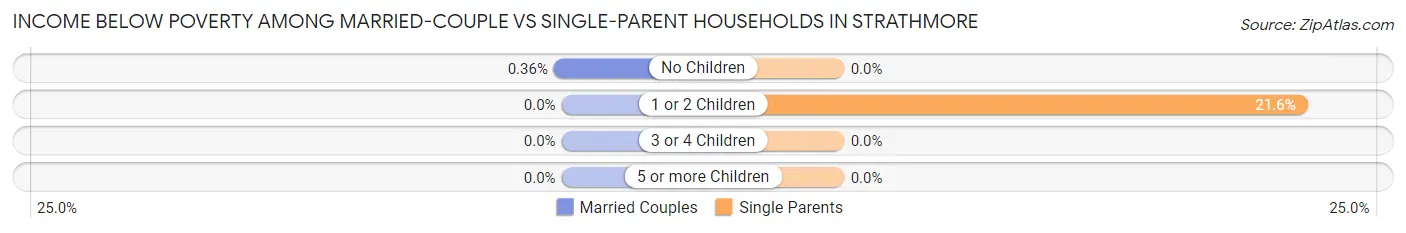
Income Below Poverty Among Married-Couple vs Single-Parent Households in Strathmore
The poverty data for Strathmore shows that 4 of the married-couple family households (0.2%) and 27 of the single-parent households (10.1%) are living below the poverty level. Within the married-couple family households, those with no children have the highest poverty rate, with 4 households (0.4%) falling below the poverty line. Among the single-parent households, those with 1 or 2 children have the highest poverty rate, with 27 household (21.6%) living below poverty.
| Children | Married-Couple Families | Single-Parent Households |
| No Children | 4 (0.4%) | 0 (0.0%) |
| 1 or 2 Children | 0 (0.0%) | 27 (21.6%) |
| 3 or 4 Children | 0 (0.0%) | 0 (0.0%) |
| 5 or more Children | 0 (0.0%) | 0 (0.0%) |
| Total | 4 (0.2%) | 27 (10.1%) |
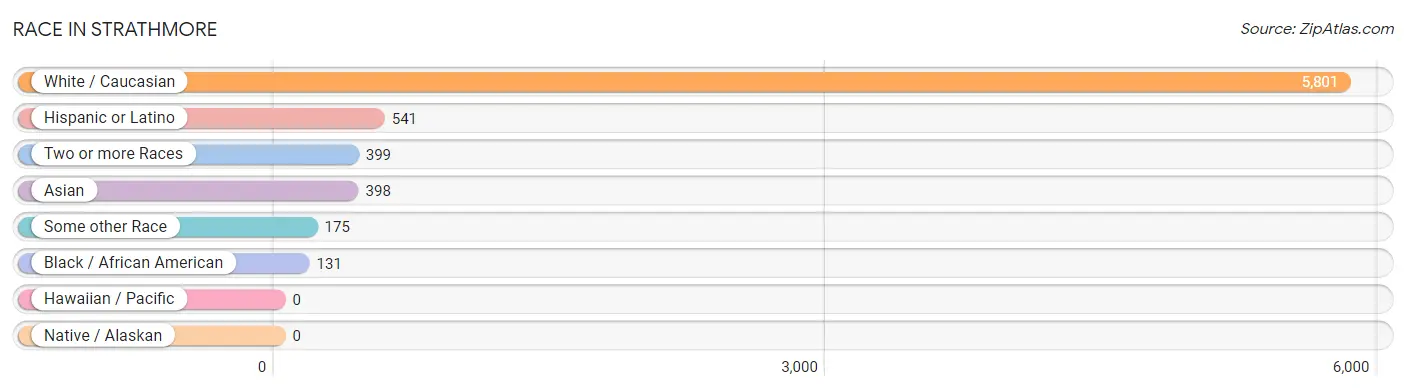
Race in Strathmore
The most populous races in Strathmore are White / Caucasian (5,801 | 84.0%), Hispanic or Latino (541 | 7.8%), and Two or more Races (399 | 5.8%).
| Race | # Population | % Population |
| Asian | 398 | 5.8% |
| Black / African American | 131 | 1.9% |
| Hawaiian / Pacific | 0 | 0.0% |
| Hispanic or Latino | 541 | 7.8% |
| Native / Alaskan | 0 | 0.0% |
| White / Caucasian | 5,801 | 84.0% |
| Two or more Races | 399 | 5.8% |
| Some other Race | 175 | 2.5% |
| Total | 6,904 | 100.0% |
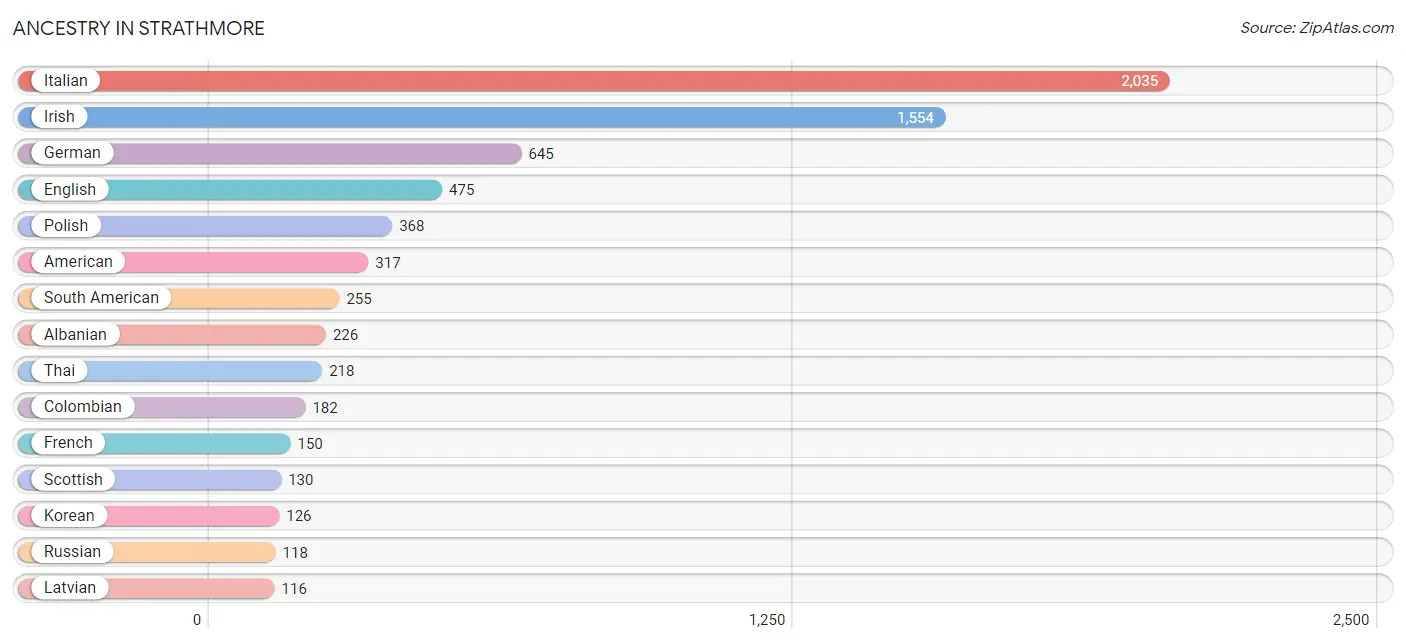
Ancestry in Strathmore
The most populous ancestries reported in Strathmore are Italian (2,035 | 29.5%), Irish (1,554 | 22.5%), German (645 | 9.3%), English (475 | 6.9%), and Polish (368 | 5.3%), together accounting for 73.5% of all Strathmore residents.
| Ancestry | # Population | % Population |
| African | 39 | 0.6% |
| Albanian | 226 | 3.3% |
| American | 317 | 4.6% |
| Arab | 111 | 1.6% |
| Argentinean | 7 | 0.1% |
| Australian | 15 | 0.2% |
| Austrian | 29 | 0.4% |
| Belgian | 10 | 0.1% |
| Bhutanese | 20 | 0.3% |
| Brazilian | 39 | 0.6% |
| British | 13 | 0.2% |
| British West Indian | 8 | 0.1% |
| Bulgarian | 30 | 0.4% |
| Burmese | 7 | 0.1% |
| Canadian | 20 | 0.3% |
| Central American | 55 | 0.8% |
| Colombian | 182 | 2.6% |
| Cuban | 26 | 0.4% |
| Czech | 54 | 0.8% |
| Danish | 71 | 1.0% |
| Delaware | 30 | 0.4% |
| Dominican | 71 | 1.0% |
| Dutch | 80 | 1.2% |
| Eastern European | 77 | 1.1% |
| Ecuadorian | 16 | 0.2% |
| Egyptian | 108 | 1.6% |
| English | 475 | 6.9% |
| European | 47 | 0.7% |
| Filipino | 40 | 0.6% |
| Finnish | 10 | 0.1% |
| French | 150 | 2.2% |
| French Canadian | 33 | 0.5% |
| German | 645 | 9.3% |
| Greek | 103 | 1.5% |
| Hungarian | 82 | 1.2% |
| Indian (Asian) | 40 | 0.6% |
| Iranian | 17 | 0.3% |
| Irish | 1,554 | 22.5% |
| Italian | 2,035 | 29.5% |
| Korean | 126 | 1.8% |
| Latvian | 116 | 1.7% |
| Mexican | 10 | 0.1% |
| Norwegian | 59 | 0.9% |
| Panamanian | 55 | 0.8% |
| Peruvian | 36 | 0.5% |
| Polish | 368 | 5.3% |
| Portuguese | 48 | 0.7% |
| Puerto Rican | 112 | 1.6% |
| Romanian | 8 | 0.1% |
| Russian | 118 | 1.7% |
| Scotch-Irish | 19 | 0.3% |
| Scottish | 130 | 1.9% |
| Senegalese | 27 | 0.4% |
| Slovak | 28 | 0.4% |
| South American | 255 | 3.7% |
| Subsaharan African | 66 | 1.0% |
| Swedish | 3 | 0.0% |
| Swiss | 25 | 0.4% |
| Thai | 218 | 3.2% |
| Ukrainian | 89 | 1.3% |
| Venezuelan | 14 | 0.2% |
| Welsh | 50 | 0.7% | View All 62 Rows |
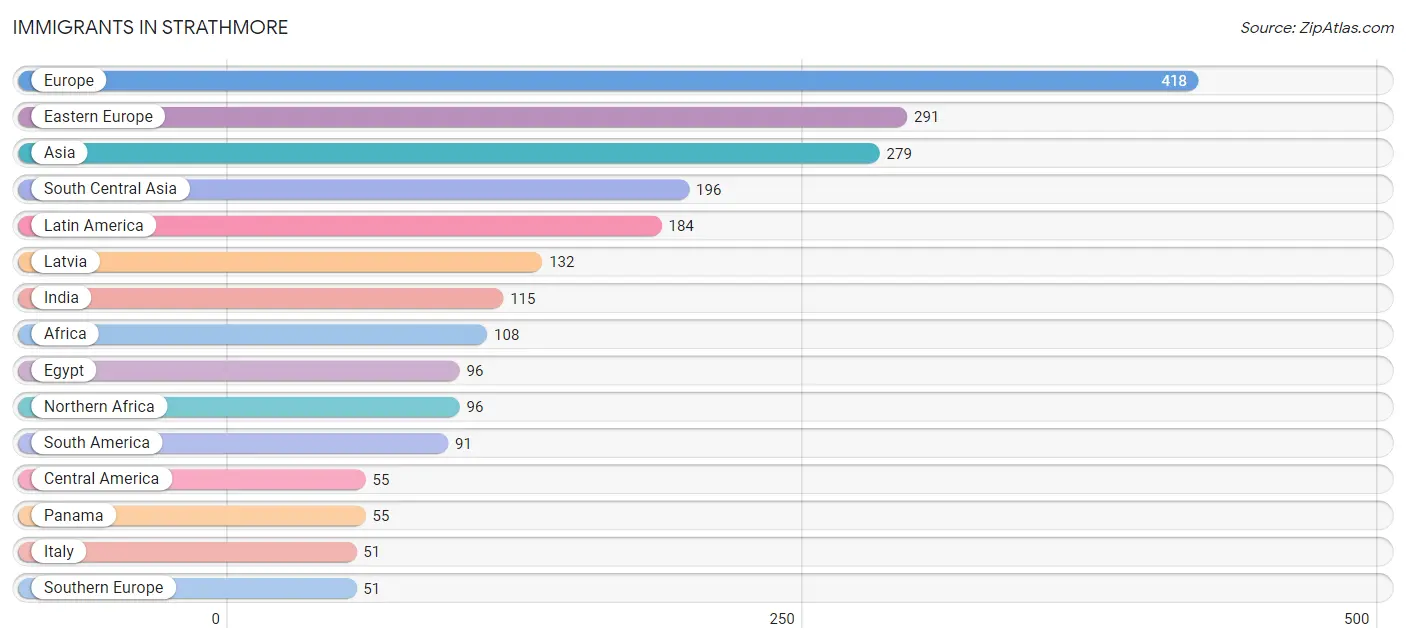
Immigrants in Strathmore
The most numerous immigrant groups reported in Strathmore came from Europe (418 | 6.0%), Eastern Europe (291 | 4.2%), Asia (279 | 4.0%), South Central Asia (196 | 2.8%), and Latin America (184 | 2.7%), together accounting for 19.8% of all Strathmore residents.
| Immigration Origin | # Population | % Population |
| Africa | 108 | 1.6% |
| Argentina | 7 | 0.1% |
| Asia | 279 | 4.0% |
| Brazil | 11 | 0.2% |
| Bulgaria | 14 | 0.2% |
| Canada | 10 | 0.1% |
| Caribbean | 38 | 0.5% |
| Central America | 55 | 0.8% |
| China | 23 | 0.3% |
| Colombia | 28 | 0.4% |
| Cuba | 10 | 0.1% |
| Dominican Republic | 20 | 0.3% |
| Eastern Asia | 30 | 0.4% |
| Eastern Europe | 291 | 4.2% |
| Egypt | 96 | 1.4% |
| England | 8 | 0.1% |
| Europe | 418 | 6.0% |
| Germany | 28 | 0.4% |
| Guyana | 45 | 0.6% |
| India | 115 | 1.7% |
| Ireland | 13 | 0.2% |
| Israel | 6 | 0.1% |
| Italy | 51 | 0.7% |
| Korea | 7 | 0.1% |
| Latin America | 184 | 2.7% |
| Latvia | 132 | 1.9% |
| Moldova | 27 | 0.4% |
| Nepal | 31 | 0.4% |
| Northern Africa | 96 | 1.4% |
| Northern Europe | 48 | 0.7% |
| Pakistan | 50 | 0.7% |
| Panama | 55 | 0.8% |
| Philippines | 40 | 0.6% |
| Poland | 15 | 0.2% |
| Russia | 9 | 0.1% |
| Senegal | 12 | 0.2% |
| South America | 91 | 1.3% |
| South Central Asia | 196 | 2.8% |
| South Eastern Asia | 40 | 0.6% |
| Southern Europe | 51 | 0.7% |
| St. Vincent and the Grenadines | 8 | 0.1% |
| Western Africa | 12 | 0.2% |
| Western Asia | 13 | 0.2% |
| Western Europe | 28 | 0.4% | View All 44 Rows |
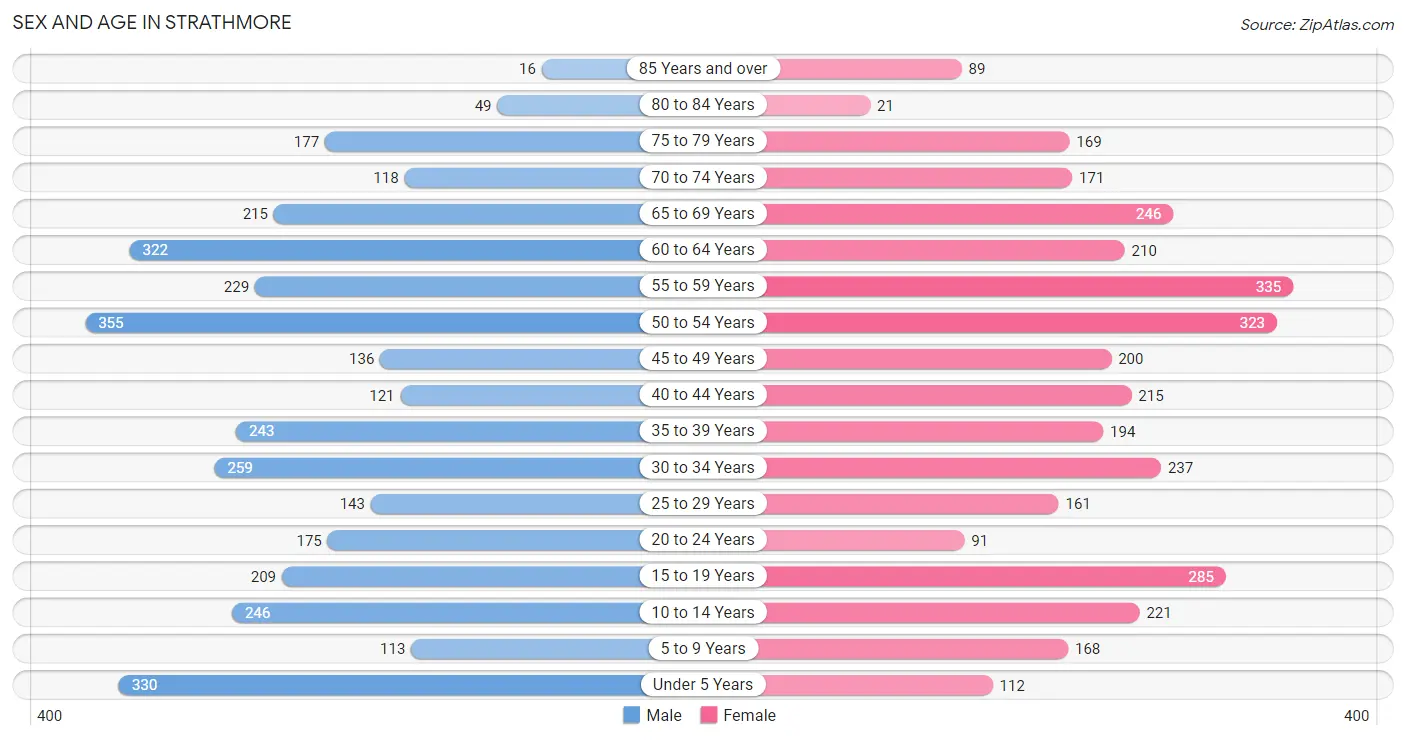
Sex and Age in Strathmore
Sex and Age in Strathmore
The most populous age groups in Strathmore are 50 to 54 Years (355 | 10.3%) for men and 55 to 59 Years (335 | 9.7%) for women.
| Age Bracket | Male | Female |
| Under 5 Years | 330 (9.6%) | 112 (3.3%) |
| 5 to 9 Years | 113 (3.3%) | 168 (4.9%) |
| 10 to 14 Years | 246 (7.1%) | 221 (6.4%) |
| 15 to 19 Years | 209 (6.0%) | 285 (8.3%) |
| 20 to 24 Years | 175 (5.1%) | 91 (2.6%) |
| 25 to 29 Years | 143 (4.1%) | 161 (4.7%) |
| 30 to 34 Years | 259 (7.5%) | 237 (6.9%) |
| 35 to 39 Years | 243 (7.0%) | 194 (5.6%) |
| 40 to 44 Years | 121 (3.5%) | 215 (6.2%) |
| 45 to 49 Years | 136 (3.9%) | 200 (5.8%) |
| 50 to 54 Years | 355 (10.3%) | 323 (9.4%) |
| 55 to 59 Years | 229 (6.6%) | 335 (9.7%) |
| 60 to 64 Years | 322 (9.3%) | 210 (6.1%) |
| 65 to 69 Years | 215 (6.2%) | 246 (7.1%) |
| 70 to 74 Years | 118 (3.4%) | 171 (5.0%) |
| 75 to 79 Years | 177 (5.1%) | 169 (4.9%) |
| 80 to 84 Years | 49 (1.4%) | 21 (0.6%) |
| 85 Years and over | 16 (0.5%) | 89 (2.6%) |
| Total | 3,456 (100.0%) | 3,448 (100.0%) |
Families and Households in Strathmore
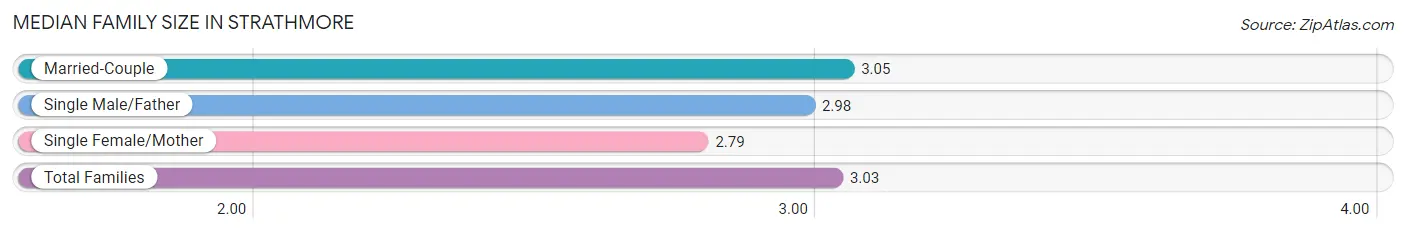
Median Family Size in Strathmore
The median family size in Strathmore is 3.03 persons per family, with married-couple families (1,783 | 87.0%) accounting for the largest median family size of 3.05 persons per family. On the other hand, single female/mother families (180 | 8.8%) represent the smallest median family size with 2.79 persons per family.
| Family Type | # Families | Family Size |
| Married-Couple | 1,783 (87.0%) | 3.05 |
| Single Male/Father | 87 (4.2%) | 2.98 |
| Single Female/Mother | 180 (8.8%) | 2.79 |
| Total Families | 2,050 (100.0%) | 3.03 |
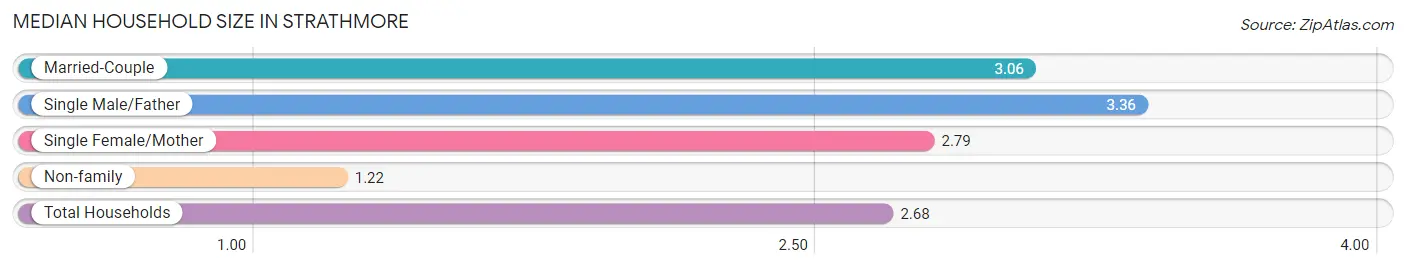
Median Household Size in Strathmore
The median household size in Strathmore is 2.68 persons per household, with single male/father households (87 | 3.4%) accounting for the largest median household size of 3.36 persons per household. non-family households (513 | 20.0%) represent the smallest median household size with 1.22 persons per household.
| Household Type | # Households | Household Size |
| Married-Couple | 1,783 (69.6%) | 3.06 |
| Single Male/Father | 87 (3.4%) | 3.36 |
| Single Female/Mother | 180 (7.0%) | 2.79 |
| Non-family | 513 (20.0%) | 1.22 |
| Total Households | 2,563 (100.0%) | 2.68 |
Household Size by Marriage Status in Strathmore
Out of a total of 2,563 households in Strathmore, 2,050 (80.0%) are family households, while 513 (20.0%) are nonfamily households. The most numerous type of family households are 2-person households, comprising 838, and the most common type of nonfamily households are 1-person households, comprising 437.
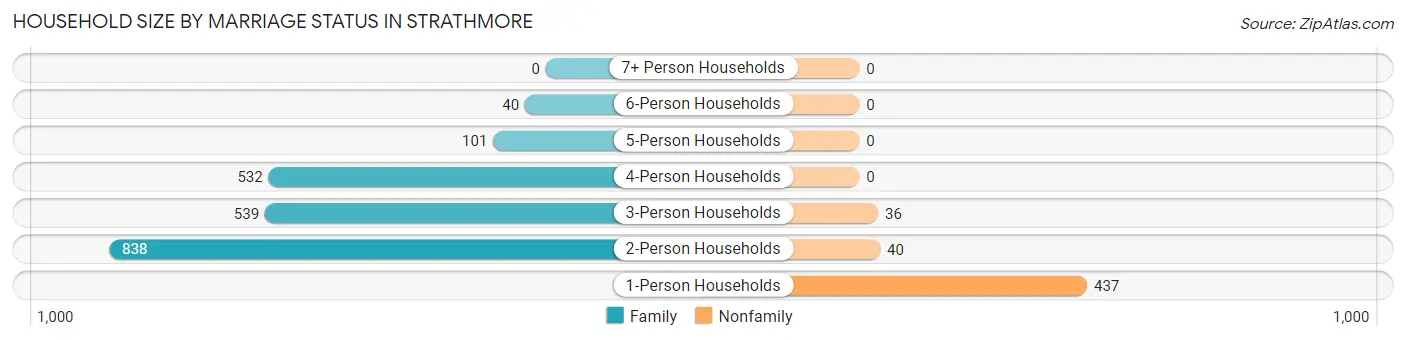
| Household Size | Family Households | Nonfamily Households |
| 1-Person Households | - | 437 (17.1%) |
| 2-Person Households | 838 (32.7%) | 40 (1.6%) |
| 3-Person Households | 539 (21.0%) | 36 (1.4%) |
| 4-Person Households | 532 (20.8%) | 0 (0.0%) |
| 5-Person Households | 101 (3.9%) | 0 (0.0%) |
| 6-Person Households | 40 (1.6%) | 0 (0.0%) |
| 7+ Person Households | 0 (0.0%) | 0 (0.0%) |
| Total | 2,050 (80.0%) | 513 (20.0%) |
Female Fertility in Strathmore
Fertility by Age in Strathmore
Average fertility rate in Strathmore is 51.0 births per 1,000 women. Women in the age bracket of 35 to 50 years have the highest fertility rate with 78.0 births per 1,000 women. Women in the age bracket of 35 to 50 years acount for 73.0% of all women with births.
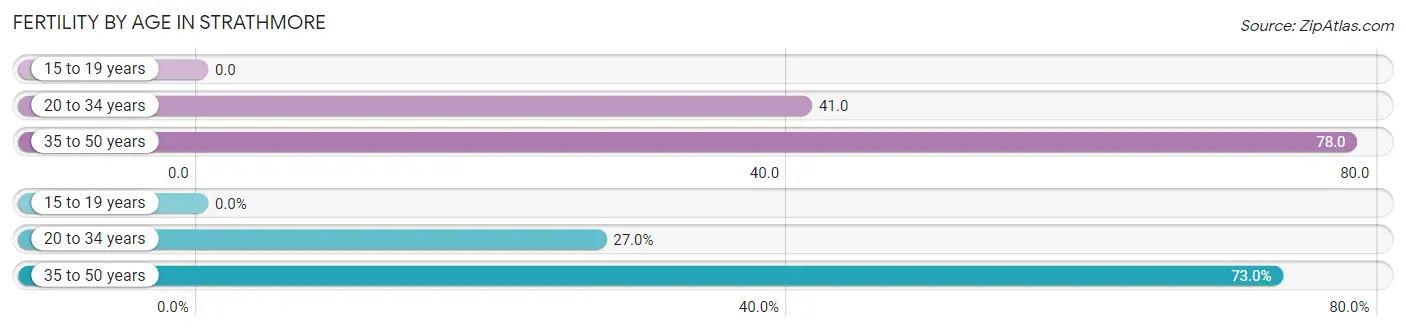
| Age Bracket | Women with Births | Births / 1,000 Women |
| 15 to 19 years | 0 (0.0%) | 0.0 |
| 20 to 34 years | 20 (27.0%) | 41.0 |
| 35 to 50 years | 54 (73.0%) | 78.0 |
| Total | 74 (100.0%) | 51.0 |
Fertility by Age by Marriage Status in Strathmore
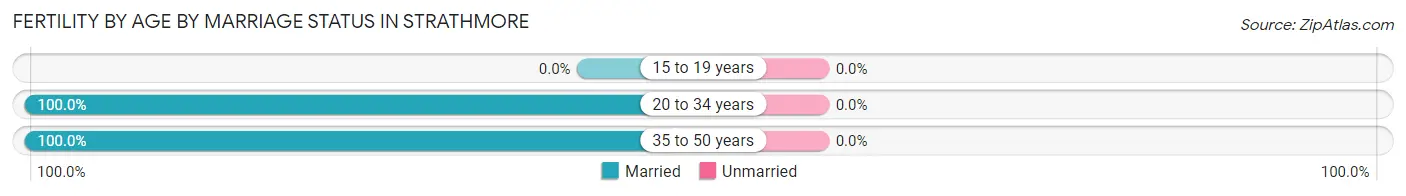
| Age Bracket | Married | Unmarried |
| 15 to 19 years | 0 (0.0%) | 0 (0.0%) |
| 20 to 34 years | 20 (100.0%) | 0 (0.0%) |
| 35 to 50 years | 54 (100.0%) | 0 (0.0%) |
| Total | 74 (100.0%) | 0 (0.0%) |
Fertility by Education in Strathmore
Average fertility rate in Strathmore is 51.0 births per 1,000 women. Women with the education attainment of college or associate's degree have the highest fertility rate of 132.0 births per 1,000 women, while women with the education attainment of less than high school have the lowest fertility at 20.0 births per 1,000 women. Women with the education attainment of college or associate's degree represent 32.4% of all women with births.
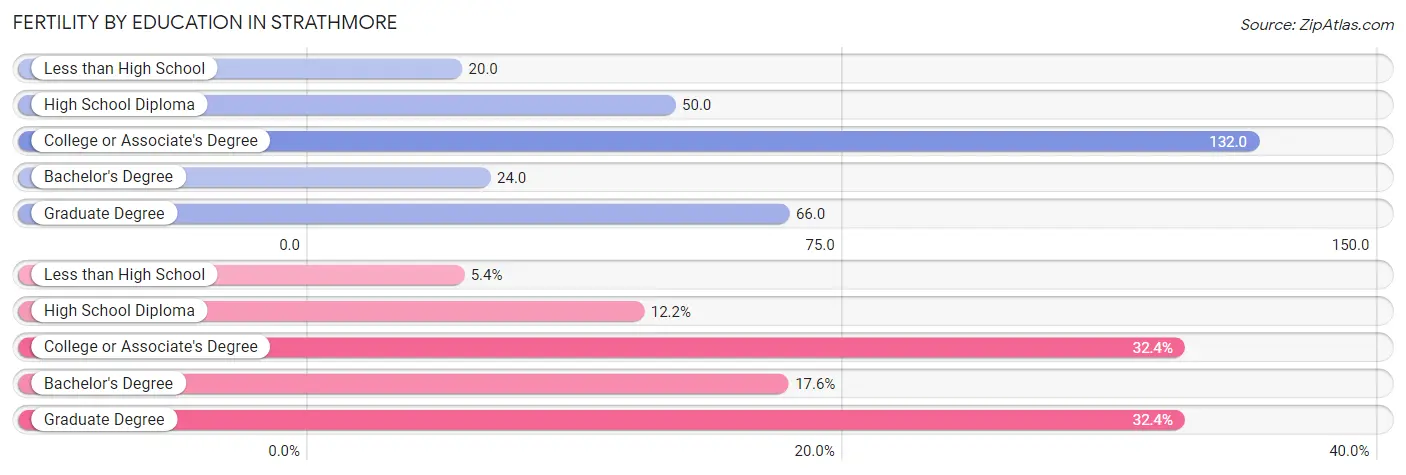
| Educational Attainment | Women with Births | Births / 1,000 Women |
| Less than High School | 4 (5.4%) | 20.0 |
| High School Diploma | 9 (12.2%) | 50.0 |
| College or Associate's Degree | 24 (32.4%) | 132.0 |
| Bachelor's Degree | 13 (17.6%) | 24.0 |
| Graduate Degree | 24 (32.4%) | 66.0 |
| Total | 74 (100.0%) | 51.0 |
Fertility by Education by Marriage Status in Strathmore
| Educational Attainment | Married | Unmarried |
| Less than High School | 4 (100.0%) | 0 (0.0%) |
| High School Diploma | 9 (100.0%) | 0 (0.0%) |
| College or Associate's Degree | 24 (100.0%) | 0 (0.0%) |
| Bachelor's Degree | 13 (100.0%) | 0 (0.0%) |
| Graduate Degree | 24 (100.0%) | 0 (0.0%) |
| Total | 74 (100.0%) | 0 (0.0%) |
Employment Characteristics in Strathmore
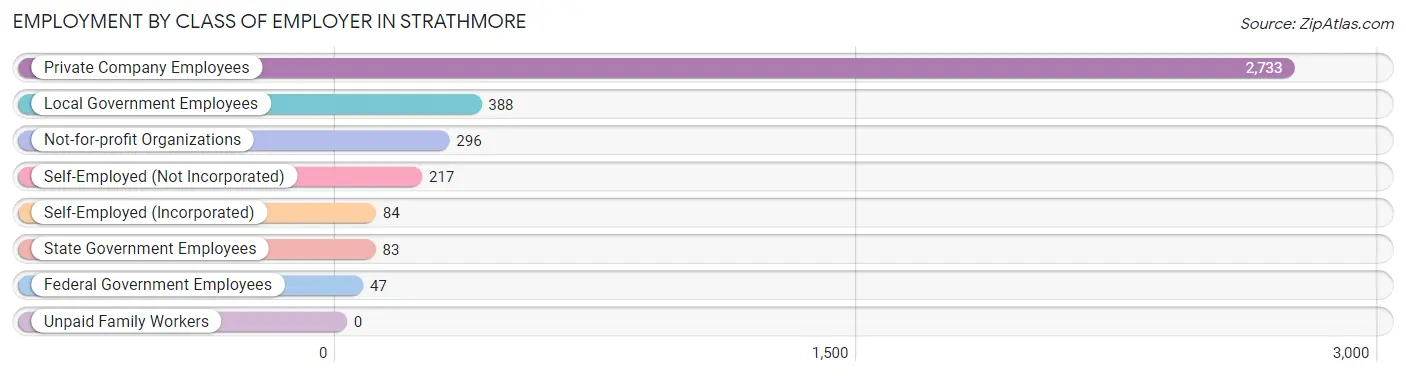
Employment by Class of Employer in Strathmore
Among the 3,848 employed individuals in Strathmore, private company employees (2,733 | 71.0%), local government employees (388 | 10.1%), and not-for-profit organizations (296 | 7.7%) make up the most common classes of employment.
| Employer Class | # Employees | % Employees |
| Private Company Employees | 2,733 | 71.0% |
| Self-Employed (Incorporated) | 84 | 2.2% |
| Self-Employed (Not Incorporated) | 217 | 5.6% |
| Not-for-profit Organizations | 296 | 7.7% |
| Local Government Employees | 388 | 10.1% |
| State Government Employees | 83 | 2.2% |
| Federal Government Employees | 47 | 1.2% |
| Unpaid Family Workers | 0 | 0.0% |
| Total | 3,848 | 100.0% |
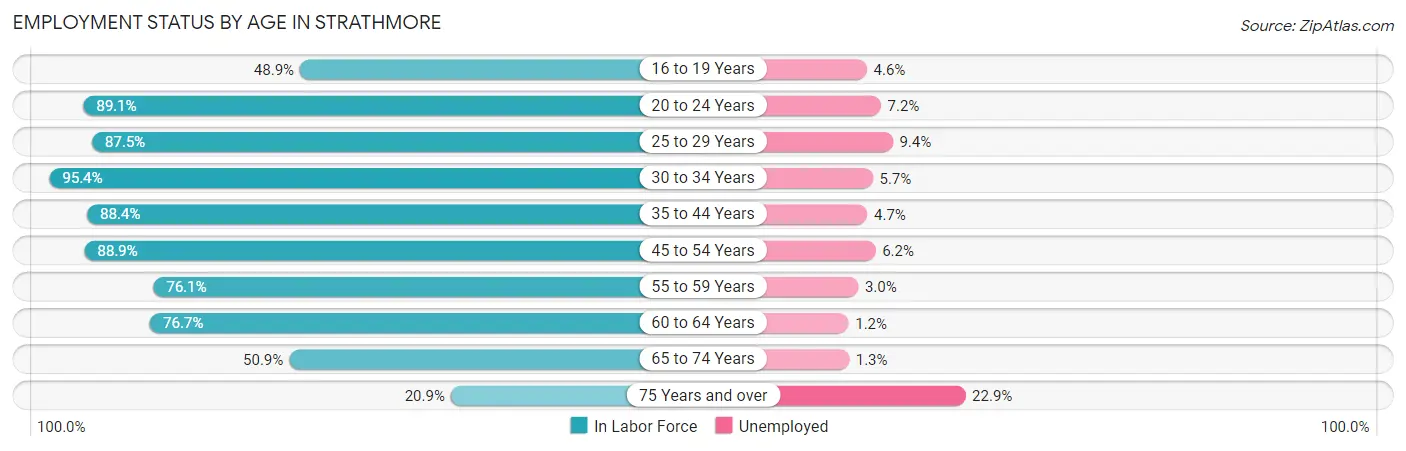
Employment Status by Age in Strathmore
According to the labor force statistics for Strathmore, out of the total population over 16 years of age (5,668), 72.5% or 4,109 individuals are in the labor force, with 5.2% or 214 of them unemployed. The age group with the highest labor force participation rate is 30 to 34 years, with 95.4% or 473 individuals in the labor force. Within the labor force, the 75 years and over age range has the highest percentage of unemployed individuals, with 22.9% or 25 of them being unemployed.
| Age Bracket | In Labor Force | Unemployed |
| 16 to 19 Years | 219 (48.9%) | 10 (4.6%) |
| 20 to 24 Years | 237 (89.1%) | 17 (7.2%) |
| 25 to 29 Years | 266 (87.5%) | 25 (9.4%) |
| 30 to 34 Years | 473 (95.4%) | 27 (5.7%) |
| 35 to 44 Years | 683 (88.4%) | 32 (4.7%) |
| 45 to 54 Years | 901 (88.9%) | 56 (6.2%) |
| 55 to 59 Years | 429 (76.1%) | 13 (3.0%) |
| 60 to 64 Years | 408 (76.7%) | 5 (1.2%) |
| 65 to 74 Years | 382 (50.9%) | 5 (1.3%) |
| 75 Years and over | 109 (20.9%) | 25 (22.9%) |
| Total | 4,109 (72.5%) | 214 (5.2%) |
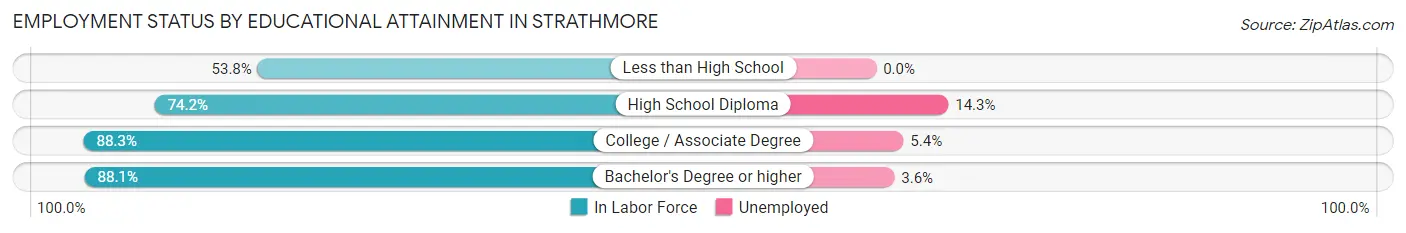
Employment Status by Educational Attainment in Strathmore
According to labor force statistics for Strathmore, 85.8% of individuals (3,160) out of the total population between 25 and 64 years of age (3,683) are in the labor force, with 5.0% or 158 of them being unemployed. The group with the highest labor force participation rate are those with the educational attainment of college / associate degree, with 88.3% or 644 individuals in the labor force. Within the labor force, individuals with high school diploma education have the highest percentage of unemployment, with 14.3% or 45 of them being unemployed.
| Educational Attainment | In Labor Force | Unemployed |
| Less than High School | 43 (53.8%) | 0 (0.0%) |
| High School Diploma | 314 (74.2%) | 60 (14.3%) |
| College / Associate Degree | 644 (88.3%) | 39 (5.4%) |
| Bachelor's Degree or higher | 2,159 (88.1%) | 88 (3.6%) |
| Total | 3,160 (85.8%) | 184 (5.0%) |
Employment Occupations by Sex in Strathmore
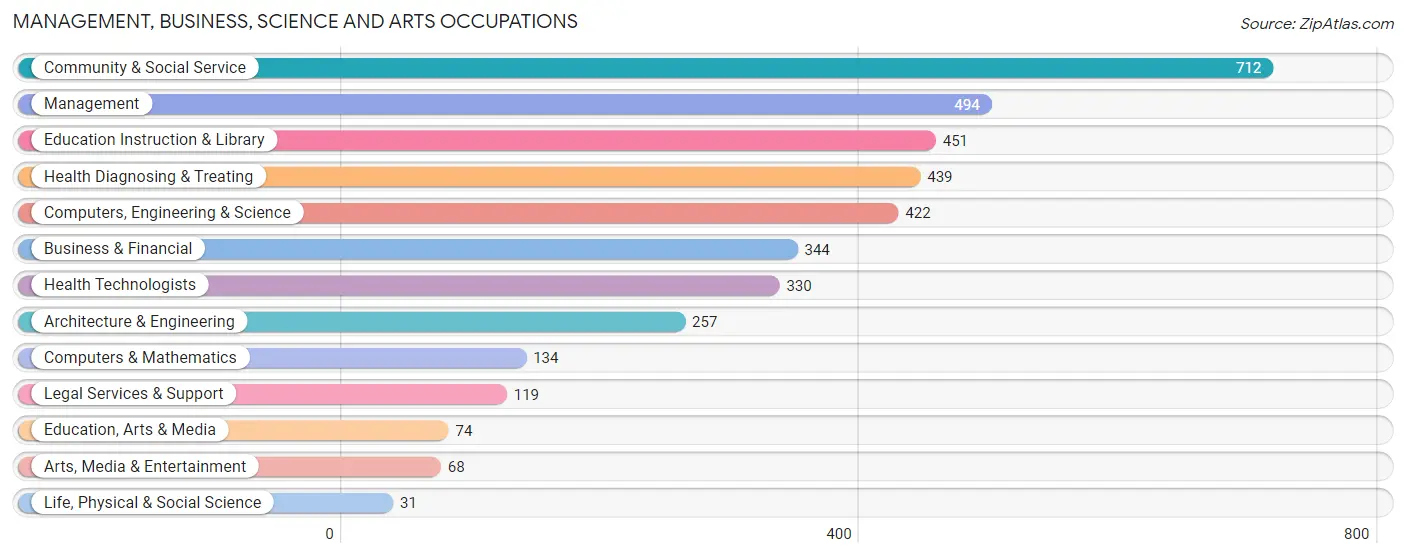
Management, Business, Science and Arts Occupations
The most common Management, Business, Science and Arts occupations in Strathmore are Community & Social Service (712 | 18.3%), Management (494 | 12.7%), Education Instruction & Library (451 | 11.6%), Health Diagnosing & Treating (439 | 11.3%), and Computers, Engineering & Science (422 | 10.8%).
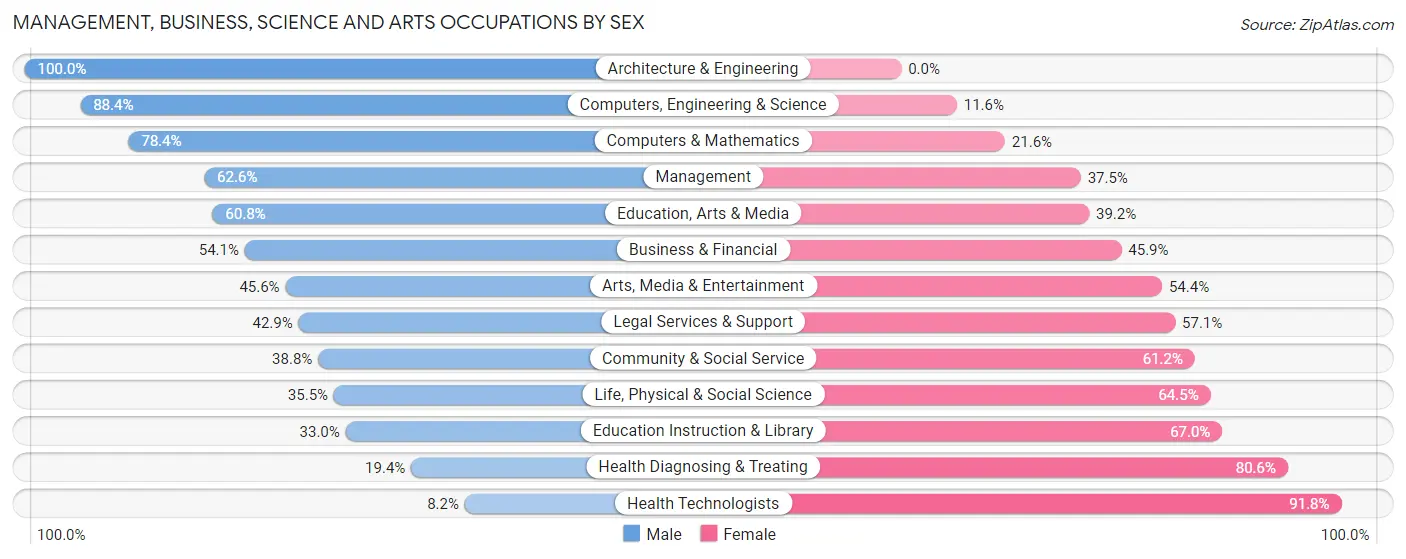
Management, Business, Science and Arts Occupations by Sex
Within the Management, Business, Science and Arts occupations in Strathmore, the most male-oriented occupations are Architecture & Engineering (100.0%), Computers, Engineering & Science (88.4%), and Computers & Mathematics (78.4%), while the most female-oriented occupations are Health Technologists (91.8%), Health Diagnosing & Treating (80.6%), and Education Instruction & Library (67.0%).
| Occupation | Male | Female |
| Management | 309 (62.5%) | 185 (37.4%) |
| Business & Financial | 186 (54.1%) | 158 (45.9%) |
| Computers, Engineering & Science | 373 (88.4%) | 49 (11.6%) |
| Computers & Mathematics | 105 (78.4%) | 29 (21.6%) |
| Architecture & Engineering | 257 (100.0%) | 0 (0.0%) |
| Life, Physical & Social Science | 11 (35.5%) | 20 (64.5%) |
| Community & Social Service | 276 (38.8%) | 436 (61.2%) |
| Education, Arts & Media | 45 (60.8%) | 29 (39.2%) |
| Legal Services & Support | 51 (42.9%) | 68 (57.1%) |
| Education Instruction & Library | 149 (33.0%) | 302 (67.0%) |
| Arts, Media & Entertainment | 31 (45.6%) | 37 (54.4%) |
| Health Diagnosing & Treating | 85 (19.4%) | 354 (80.6%) |
| Health Technologists | 27 (8.2%) | 303 (91.8%) |
| Total (Category) | 1,229 (51.0%) | 1,182 (49.0%) |
| Total (Overall) | 1,972 (50.7%) | 1,920 (49.3%) |
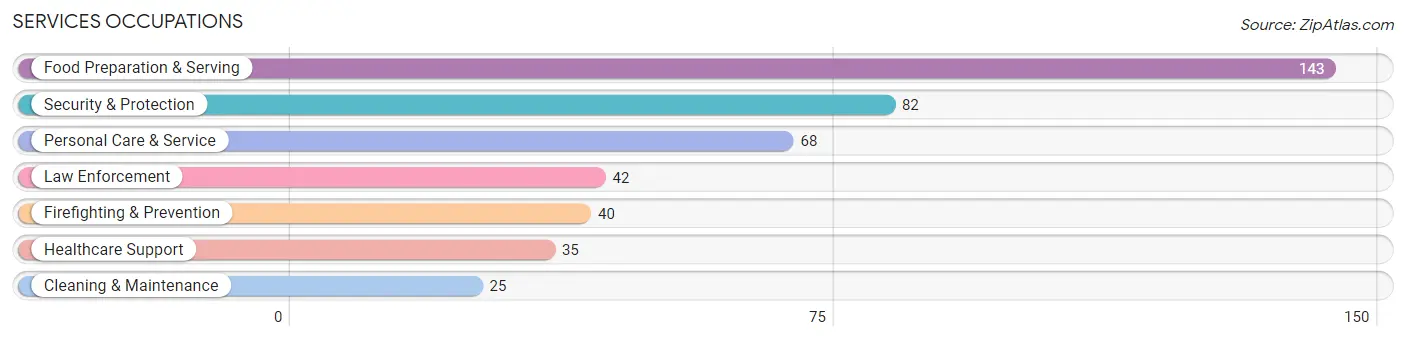
Services Occupations
The most common Services occupations in Strathmore are Food Preparation & Serving (143 | 3.7%), Security & Protection (82 | 2.1%), Personal Care & Service (68 | 1.8%), Law Enforcement (42 | 1.1%), and Firefighting & Prevention (40 | 1.0%).
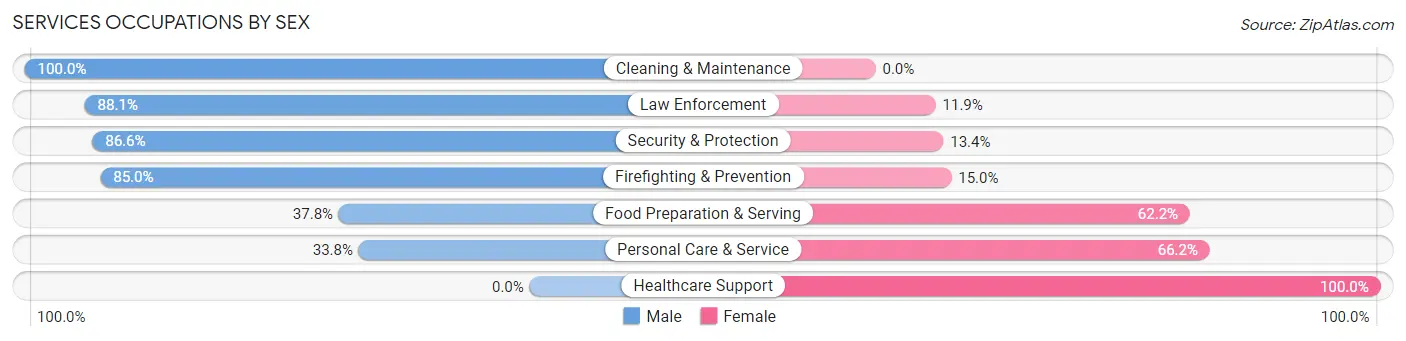
Services Occupations by Sex
Within the Services occupations in Strathmore, the most male-oriented occupations are Cleaning & Maintenance (100.0%), Law Enforcement (88.1%), and Security & Protection (86.6%), while the most female-oriented occupations are Healthcare Support (100.0%), Personal Care & Service (66.2%), and Food Preparation & Serving (62.2%).
| Occupation | Male | Female |
| Healthcare Support | 0 (0.0%) | 35 (100.0%) |
| Security & Protection | 71 (86.6%) | 11 (13.4%) |
| Firefighting & Prevention | 34 (85.0%) | 6 (15.0%) |
| Law Enforcement | 37 (88.1%) | 5 (11.9%) |
| Food Preparation & Serving | 54 (37.8%) | 89 (62.2%) |
| Cleaning & Maintenance | 25 (100.0%) | 0 (0.0%) |
| Personal Care & Service | 23 (33.8%) | 45 (66.2%) |
| Total (Category) | 173 (49.0%) | 180 (51.0%) |
| Total (Overall) | 1,972 (50.7%) | 1,920 (49.3%) |
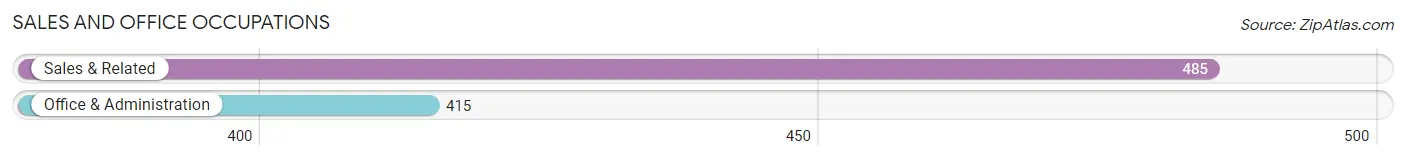
Sales and Office Occupations
The most common Sales and Office occupations in Strathmore are Sales & Related (485 | 12.5%), and Office & Administration (415 | 10.7%).
Sales and Office Occupations by Sex
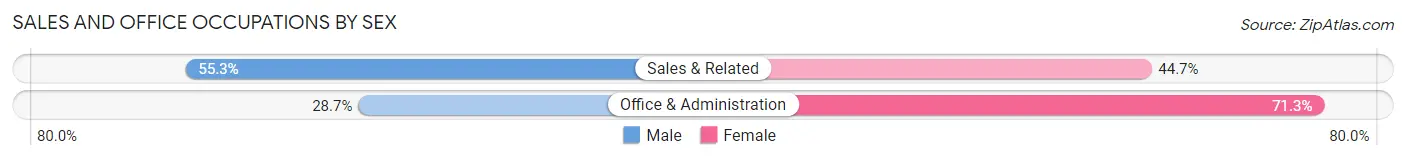
| Occupation | Male | Female |
| Sales & Related | 268 (55.3%) | 217 (44.7%) |
| Office & Administration | 119 (28.7%) | 296 (71.3%) |
| Total (Category) | 387 (43.0%) | 513 (57.0%) |
| Total (Overall) | 1,972 (50.7%) | 1,920 (49.3%) |
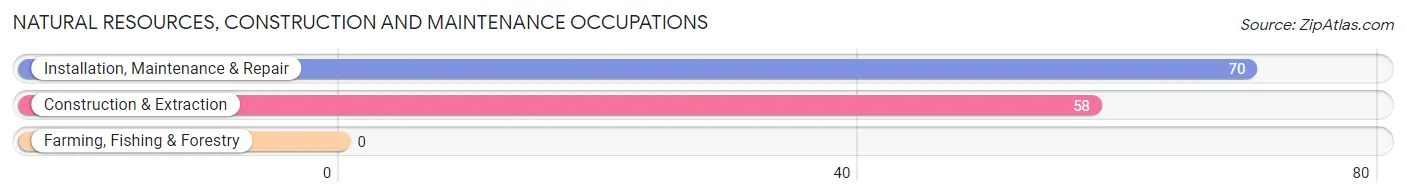
Natural Resources, Construction and Maintenance Occupations
The most common Natural Resources, Construction and Maintenance occupations in Strathmore are Installation, Maintenance & Repair (70 | 1.8%), and Construction & Extraction (58 | 1.5%).
Natural Resources, Construction and Maintenance Occupations by Sex
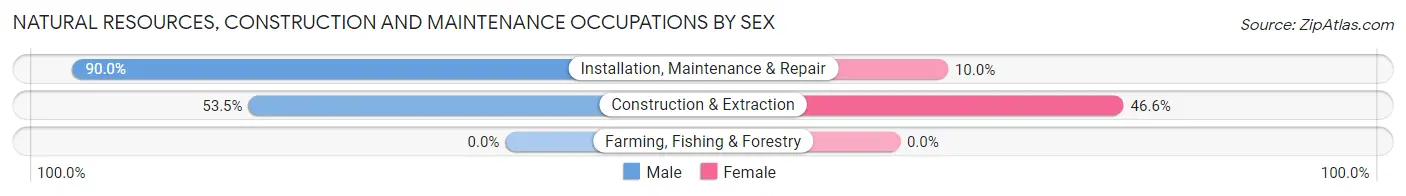
| Occupation | Male | Female |
| Farming, Fishing & Forestry | 0 (0.0%) | 0 (0.0%) |
| Construction & Extraction | 31 (53.4%) | 27 (46.6%) |
| Installation, Maintenance & Repair | 63 (90.0%) | 7 (10.0%) |
| Total (Category) | 94 (73.4%) | 34 (26.6%) |
| Total (Overall) | 1,972 (50.7%) | 1,920 (49.3%) |
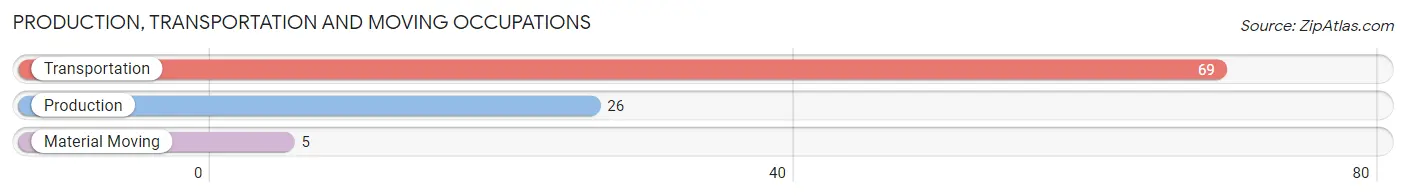
Production, Transportation and Moving Occupations
The most common Production, Transportation and Moving occupations in Strathmore are Transportation (69 | 1.8%), Production (26 | 0.7%), and Material Moving (5 | 0.1%).
Production, Transportation and Moving Occupations by Sex
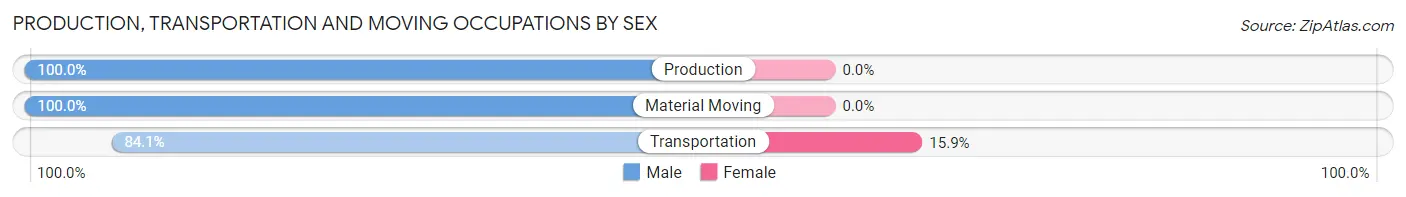
| Occupation | Male | Female |
| Production | 26 (100.0%) | 0 (0.0%) |
| Transportation | 58 (84.1%) | 11 (15.9%) |
| Material Moving | 5 (100.0%) | 0 (0.0%) |
| Total (Category) | 89 (89.0%) | 11 (11.0%) |
| Total (Overall) | 1,972 (50.7%) | 1,920 (49.3%) |
Employment Industries by Sex in Strathmore
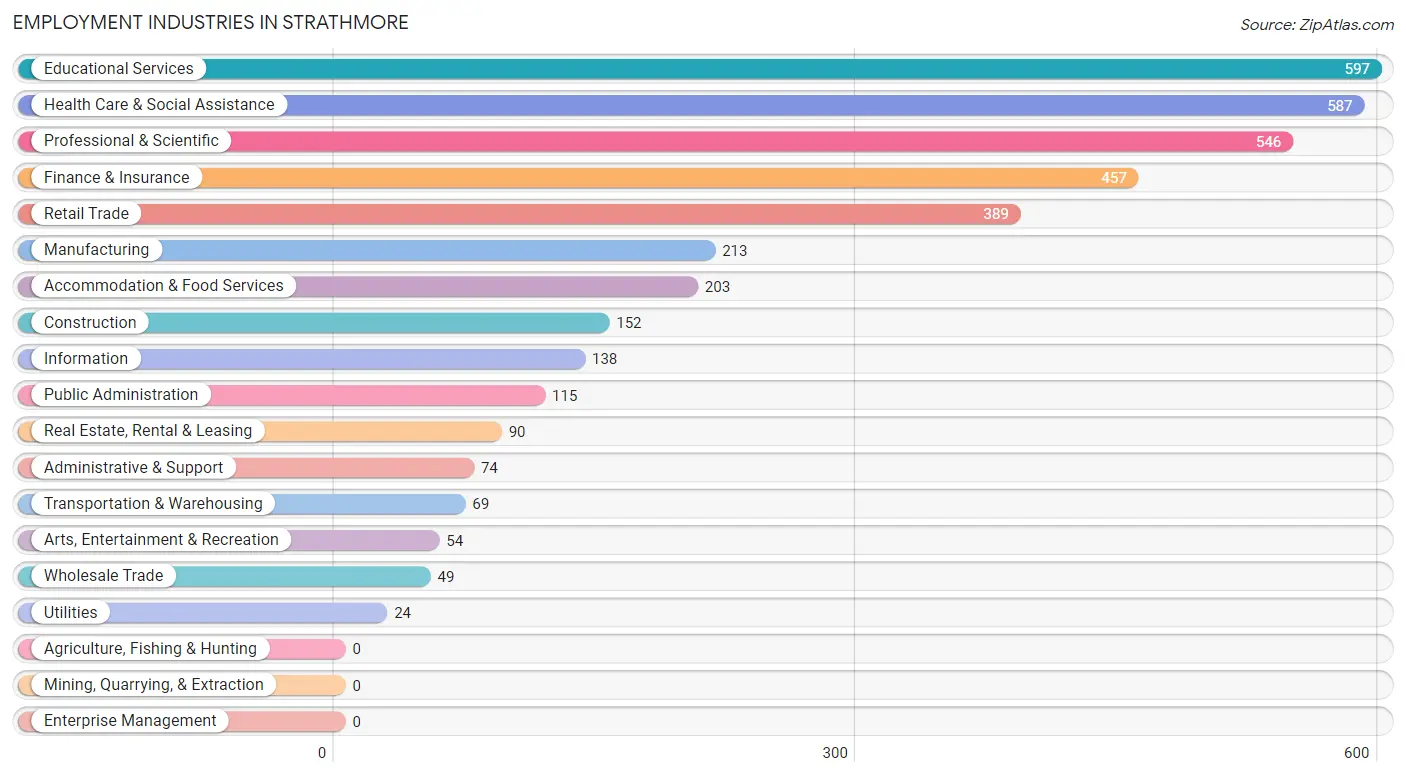
Employment Industries in Strathmore
The major employment industries in Strathmore include Educational Services (597 | 15.3%), Health Care & Social Assistance (587 | 15.1%), Professional & Scientific (546 | 14.0%), Finance & Insurance (457 | 11.7%), and Retail Trade (389 | 10.0%).
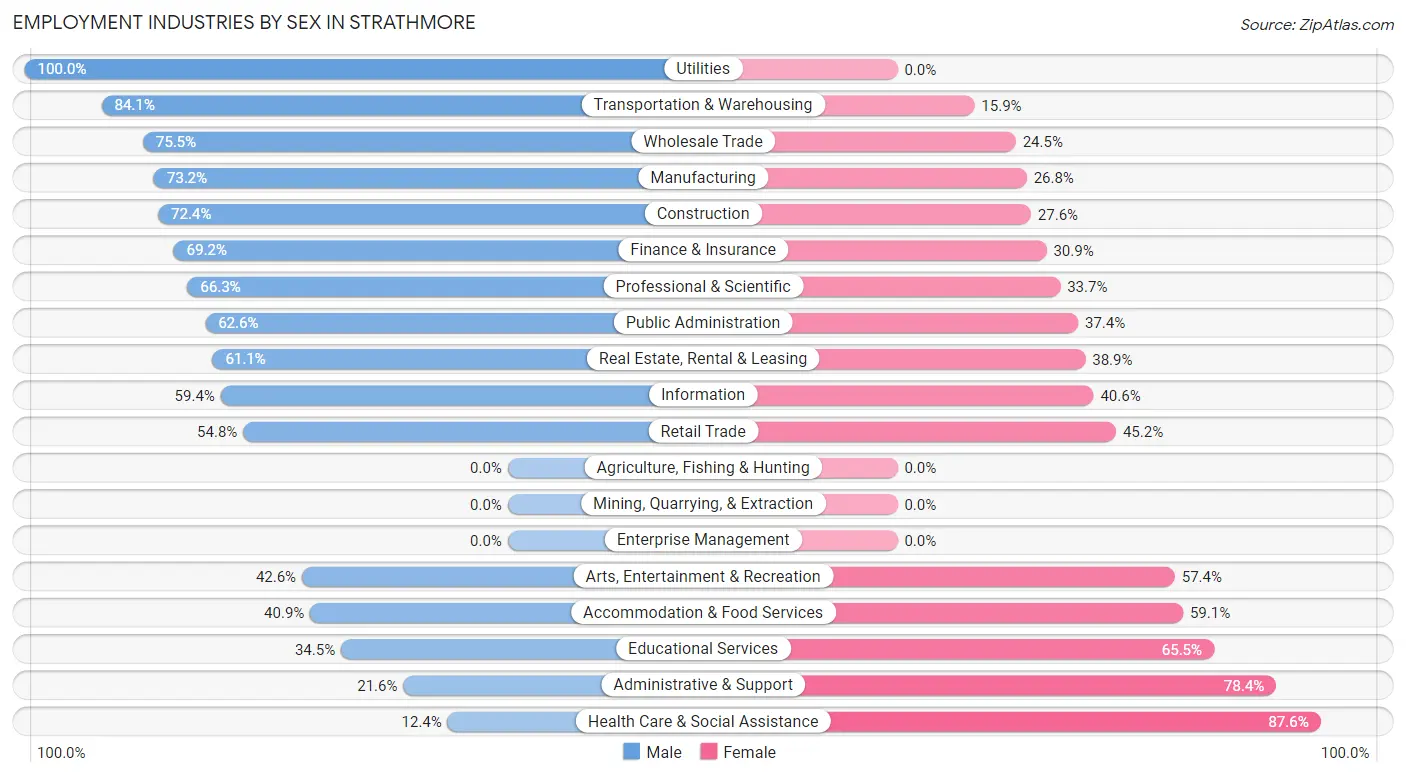
Employment Industries by Sex in Strathmore
The Strathmore industries that see more men than women are Utilities (100.0%), Transportation & Warehousing (84.1%), and Wholesale Trade (75.5%), whereas the industries that tend to have a higher number of women are Health Care & Social Assistance (87.6%), Administrative & Support (78.4%), and Educational Services (65.5%).
| Industry | Male | Female |
| Agriculture, Fishing & Hunting | 0 (0.0%) | 0 (0.0%) |
| Mining, Quarrying, & Extraction | 0 (0.0%) | 0 (0.0%) |
| Construction | 110 (72.4%) | 42 (27.6%) |
| Manufacturing | 156 (73.2%) | 57 (26.8%) |
| Wholesale Trade | 37 (75.5%) | 12 (24.5%) |
| Retail Trade | 213 (54.8%) | 176 (45.2%) |
| Transportation & Warehousing | 58 (84.1%) | 11 (15.9%) |
| Utilities | 24 (100.0%) | 0 (0.0%) |
| Information | 82 (59.4%) | 56 (40.6%) |
| Finance & Insurance | 316 (69.2%) | 141 (30.8%) |
| Real Estate, Rental & Leasing | 55 (61.1%) | 35 (38.9%) |
| Professional & Scientific | 362 (66.3%) | 184 (33.7%) |
| Enterprise Management | 0 (0.0%) | 0 (0.0%) |
| Administrative & Support | 16 (21.6%) | 58 (78.4%) |
| Educational Services | 206 (34.5%) | 391 (65.5%) |
| Health Care & Social Assistance | 73 (12.4%) | 514 (87.6%) |
| Arts, Entertainment & Recreation | 23 (42.6%) | 31 (57.4%) |
| Accommodation & Food Services | 83 (40.9%) | 120 (59.1%) |
| Public Administration | 72 (62.6%) | 43 (37.4%) |
| Total | 1,972 (50.7%) | 1,920 (49.3%) |
Education in Strathmore
School Enrollment in Strathmore
The most common levels of schooling among the 1,641 students in Strathmore are high school (399 | 24.3%), middle school (359 | 21.9%), and college / undergraduate (305 | 18.6%).
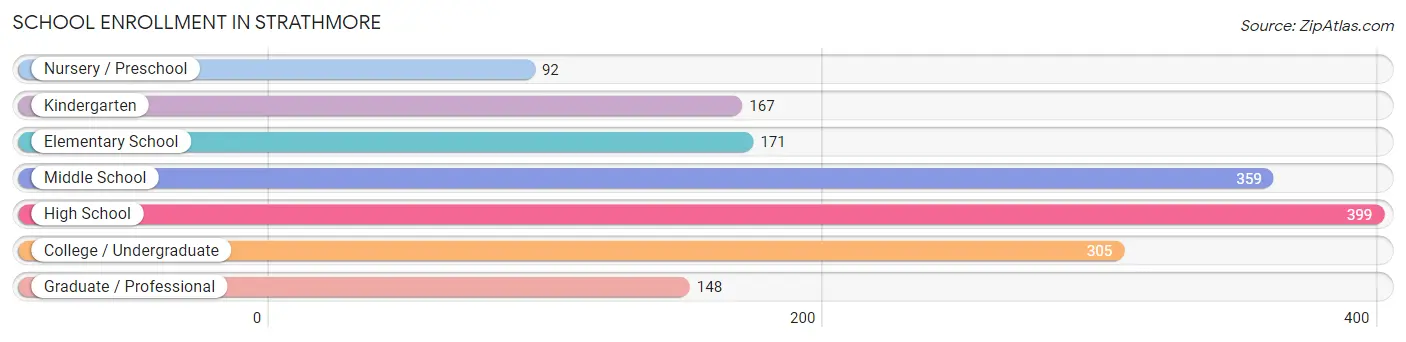
| School Level | # Students | % Students |
| Nursery / Preschool | 92 | 5.6% |
| Kindergarten | 167 | 10.2% |
| Elementary School | 171 | 10.4% |
| Middle School | 359 | 21.9% |
| High School | 399 | 24.3% |
| College / Undergraduate | 305 | 18.6% |
| Graduate / Professional | 148 | 9.0% |
| Total | 1,641 | 100.0% |
School Enrollment by Age by Funding Source in Strathmore
Out of a total of 1,641 students who are enrolled in schools in Strathmore, 471 (28.7%) attend a private institution, while the remaining 1,170 (71.3%) are enrolled in public schools. The age group of 3 to 4 year olds has the highest likelihood of being enrolled in private schools, with 129 (89.0% in the age bracket) enrolled. Conversely, the age group of 18 to 19 year olds has the lowest likelihood of being enrolled in a private school, with 193 (100.0% in the age bracket) attending a public institution.
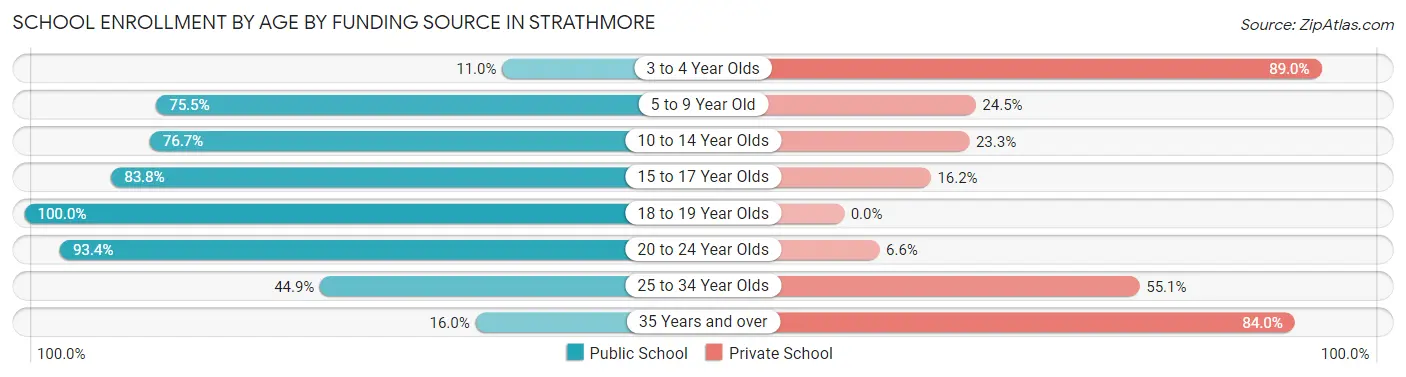
| Age Bracket | Public School | Private School |
| 3 to 4 Year Olds | 16 (11.0%) | 129 (89.0%) |
| 5 to 9 Year Old | 203 (75.5%) | 66 (24.5%) |
| 10 to 14 Year Olds | 358 (76.7%) | 109 (23.3%) |
| 15 to 17 Year Olds | 249 (83.8%) | 48 (16.2%) |
| 18 to 19 Year Olds | 193 (100.0%) | 0 (0.0%) |
| 20 to 24 Year Olds | 99 (93.4%) | 7 (6.6%) |
| 25 to 34 Year Olds | 40 (44.9%) | 49 (55.1%) |
| 35 Years and over | 12 (16.0%) | 63 (84.0%) |
| Total | 1,170 (71.3%) | 471 (28.7%) |
Educational Attainment by Field of Study in Strathmore
Business (846 | 24.7%), education (434 | 12.7%), science & technology (357 | 10.4%), computers & mathematics (265 | 7.7%), and social sciences (252 | 7.3%) are the most common fields of study among 3,430 individuals in Strathmore who have obtained a bachelor's degree or higher.
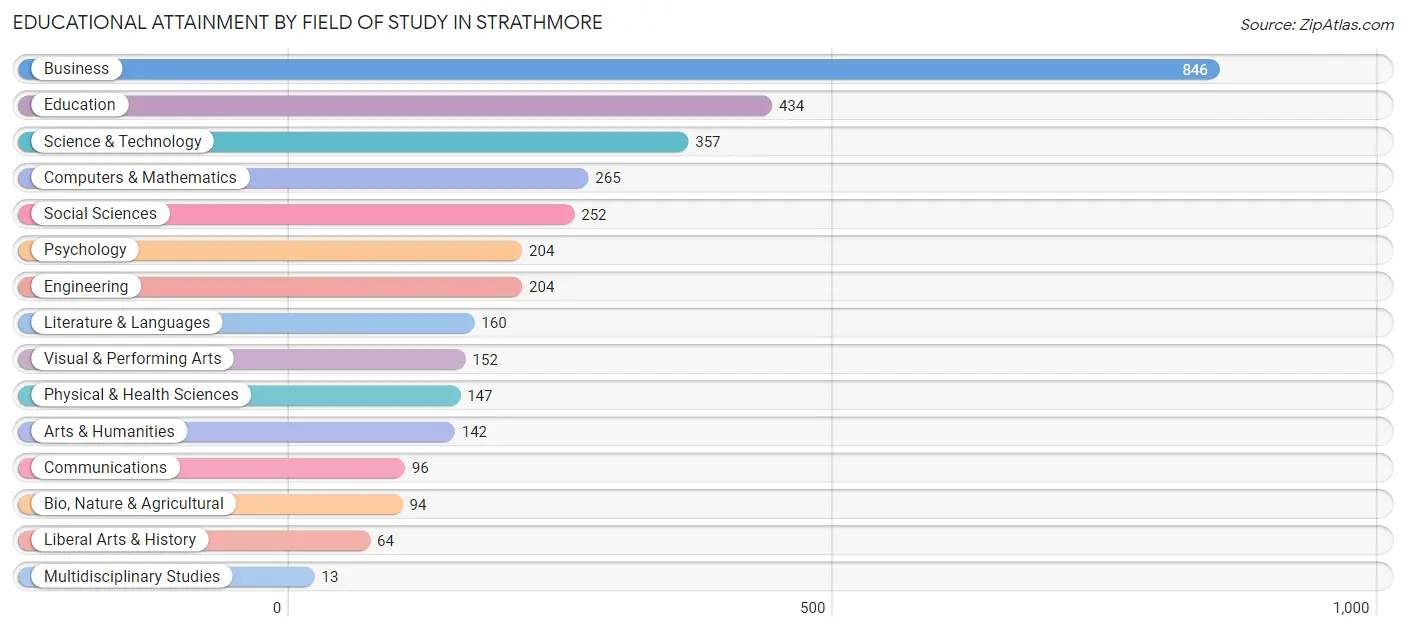
| Field of Study | # Graduates | % Graduates |
| Computers & Mathematics | 265 | 7.7% |
| Bio, Nature & Agricultural | 94 | 2.7% |
| Physical & Health Sciences | 147 | 4.3% |
| Psychology | 204 | 5.9% |
| Social Sciences | 252 | 7.3% |
| Engineering | 204 | 5.9% |
| Multidisciplinary Studies | 13 | 0.4% |
| Science & Technology | 357 | 10.4% |
| Business | 846 | 24.7% |
| Education | 434 | 12.7% |
| Literature & Languages | 160 | 4.7% |
| Liberal Arts & History | 64 | 1.9% |
| Visual & Performing Arts | 152 | 4.4% |
| Communications | 96 | 2.8% |
| Arts & Humanities | 142 | 4.1% |
| Total | 3,430 | 100.0% |
Transportation & Commute in Strathmore
Vehicle Availability by Sex in Strathmore
The most prevalent vehicle ownership categories in Strathmore are males with 2 vehicles (948, accounting for 48.7%) and females with 2 vehicles (1,020, making up 49.9%).
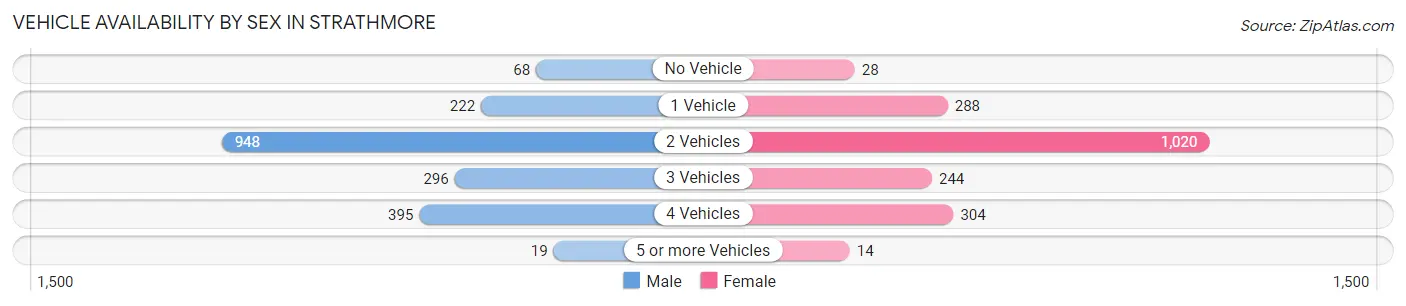
| Vehicles Available | Male | Female |
| No Vehicle | 68 (3.5%) | 28 (1.5%) |
| 1 Vehicle | 222 (11.4%) | 288 (15.2%) |
| 2 Vehicles | 948 (48.7%) | 1,020 (53.7%) |
| 3 Vehicles | 296 (15.2%) | 244 (12.9%) |
| 4 Vehicles | 395 (20.3%) | 304 (16.0%) |
| 5 or more Vehicles | 19 (1.0%) | 14 (0.7%) |
| Total | 1,948 (100.0%) | 1,898 (100.0%) |
Commute Time in Strathmore
The most frequently occuring commute durations in Strathmore are 60 to 89 minutes (483 commuters, 14.9%), 90 or more minutes (472 commuters, 14.6%), and 45 to 59 minutes (337 commuters, 10.4%).
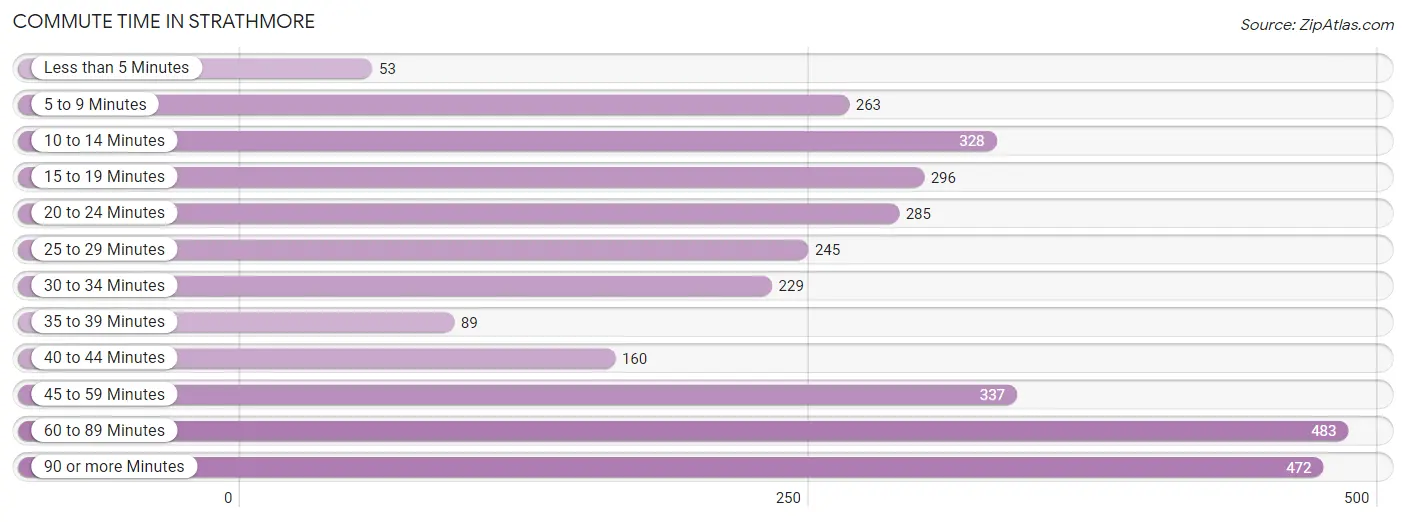
| Commute Time | # Commuters | % Commuters |
| Less than 5 Minutes | 53 | 1.6% |
| 5 to 9 Minutes | 263 | 8.1% |
| 10 to 14 Minutes | 328 | 10.1% |
| 15 to 19 Minutes | 296 | 9.1% |
| 20 to 24 Minutes | 285 | 8.8% |
| 25 to 29 Minutes | 245 | 7.6% |
| 30 to 34 Minutes | 229 | 7.1% |
| 35 to 39 Minutes | 89 | 2.8% |
| 40 to 44 Minutes | 160 | 4.9% |
| 45 to 59 Minutes | 337 | 10.4% |
| 60 to 89 Minutes | 483 | 14.9% |
| 90 or more Minutes | 472 | 14.6% |
Commute Time by Sex in Strathmore
The most common commute times in Strathmore are 60 to 89 minutes (314 commuters, 19.0%) for males and 20 to 24 minutes (253 commuters, 16.0%) for females.
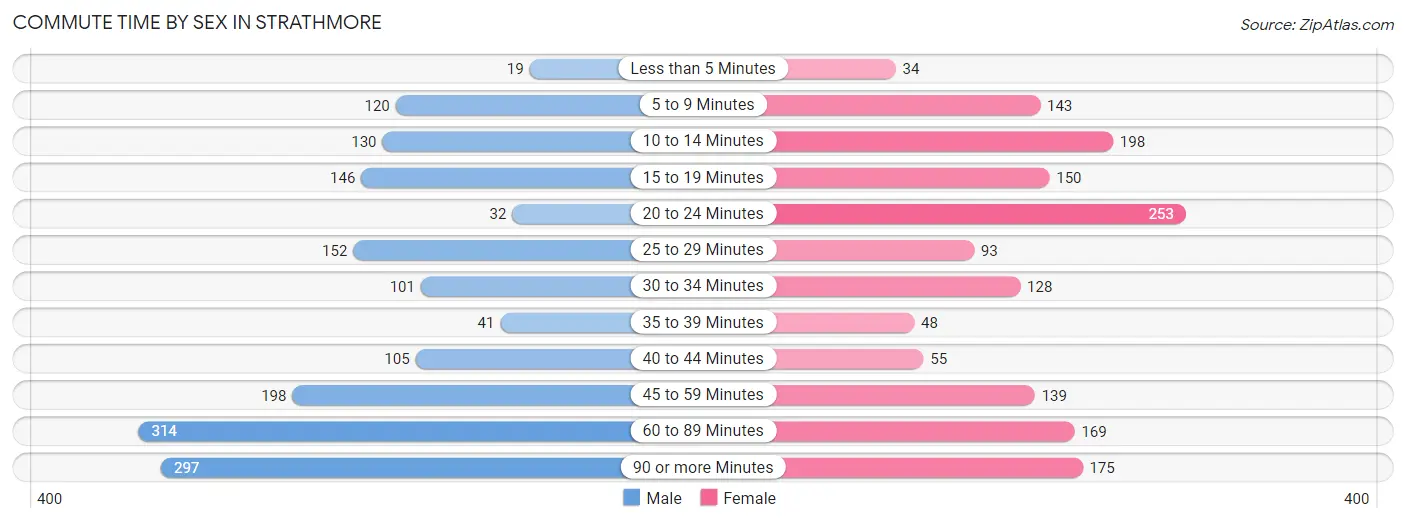
| Commute Time | Male | Female |
| Less than 5 Minutes | 19 (1.1%) | 34 (2.1%) |
| 5 to 9 Minutes | 120 (7.2%) | 143 (9.0%) |
| 10 to 14 Minutes | 130 (7.9%) | 198 (12.5%) |
| 15 to 19 Minutes | 146 (8.8%) | 150 (9.5%) |
| 20 to 24 Minutes | 32 (1.9%) | 253 (16.0%) |
| 25 to 29 Minutes | 152 (9.2%) | 93 (5.9%) |
| 30 to 34 Minutes | 101 (6.1%) | 128 (8.1%) |
| 35 to 39 Minutes | 41 (2.5%) | 48 (3.0%) |
| 40 to 44 Minutes | 105 (6.3%) | 55 (3.5%) |
| 45 to 59 Minutes | 198 (12.0%) | 139 (8.8%) |
| 60 to 89 Minutes | 314 (19.0%) | 169 (10.7%) |
| 90 or more Minutes | 297 (17.9%) | 175 (11.0%) |
Time of Departure to Work by Sex in Strathmore
The most frequent times of departure to work in Strathmore are 8:00 AM to 8:29 AM (224, 13.5%) for males and 8:00 AM to 8:29 AM (259, 16.3%) for females.
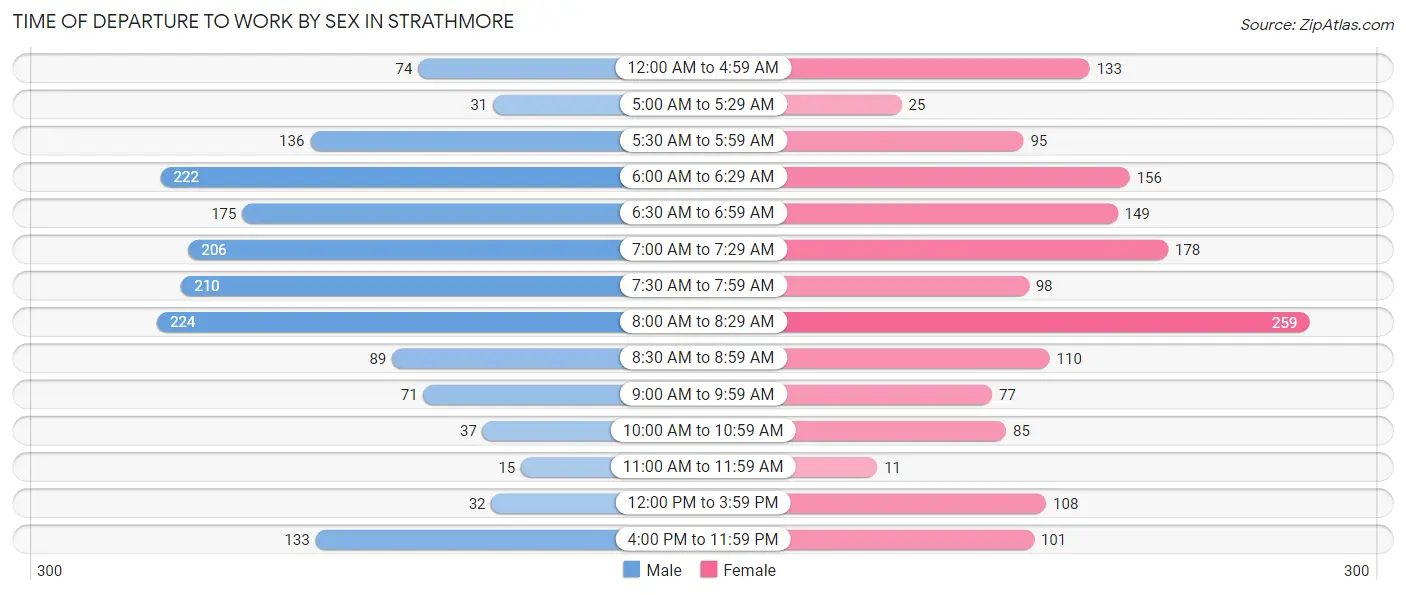
| Time of Departure | Male | Female |
| 12:00 AM to 4:59 AM | 74 (4.5%) | 133 (8.4%) |
| 5:00 AM to 5:29 AM | 31 (1.9%) | 25 (1.6%) |
| 5:30 AM to 5:59 AM | 136 (8.2%) | 95 (6.0%) |
| 6:00 AM to 6:29 AM | 222 (13.4%) | 156 (9.8%) |
| 6:30 AM to 6:59 AM | 175 (10.6%) | 149 (9.4%) |
| 7:00 AM to 7:29 AM | 206 (12.4%) | 178 (11.2%) |
| 7:30 AM to 7:59 AM | 210 (12.7%) | 98 (6.2%) |
| 8:00 AM to 8:29 AM | 224 (13.5%) | 259 (16.3%) |
| 8:30 AM to 8:59 AM | 89 (5.4%) | 110 (6.9%) |
| 9:00 AM to 9:59 AM | 71 (4.3%) | 77 (4.9%) |
| 10:00 AM to 10:59 AM | 37 (2.2%) | 85 (5.4%) |
| 11:00 AM to 11:59 AM | 15 (0.9%) | 11 (0.7%) |
| 12:00 PM to 3:59 PM | 32 (1.9%) | 108 (6.8%) |
| 4:00 PM to 11:59 PM | 133 (8.0%) | 101 (6.4%) |
| Total | 1,655 (100.0%) | 1,585 (100.0%) |
Housing Occupancy in Strathmore
Occupancy by Ownership in Strathmore
Of the total 2,563 dwellings in Strathmore, owner-occupied units account for 2,364 (92.2%), while renter-occupied units make up 199 (7.8%).
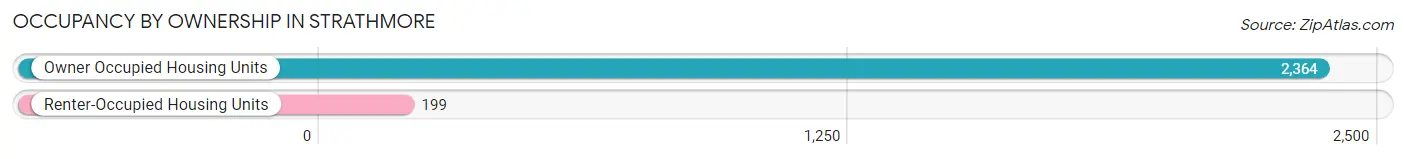
| Occupancy | # Housing Units | % Housing Units |
| Owner Occupied Housing Units | 2,364 | 92.2% |
| Renter-Occupied Housing Units | 199 | 7.8% |
| Total Occupied Housing Units | 2,563 | 100.0% |
Occupancy by Household Size in Strathmore
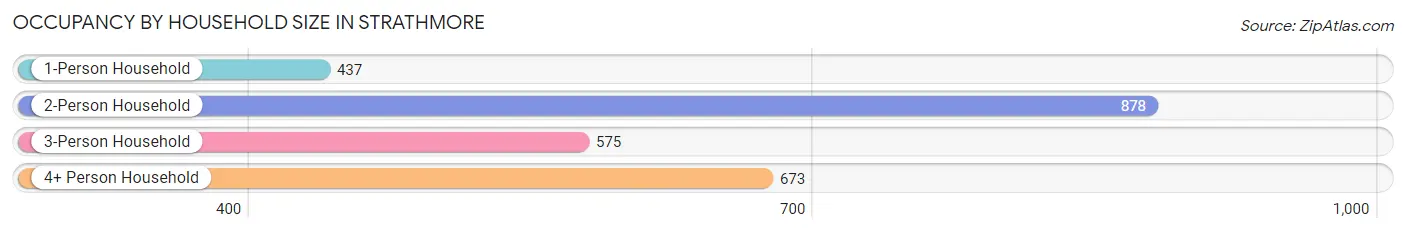
| Household Size | # Housing Units | % Housing Units |
| 1-Person Household | 437 | 17.1% |
| 2-Person Household | 878 | 34.3% |
| 3-Person Household | 575 | 22.4% |
| 4+ Person Household | 673 | 26.3% |
| Total Housing Units | 2,563 | 100.0% |
Occupancy by Ownership by Household Size in Strathmore
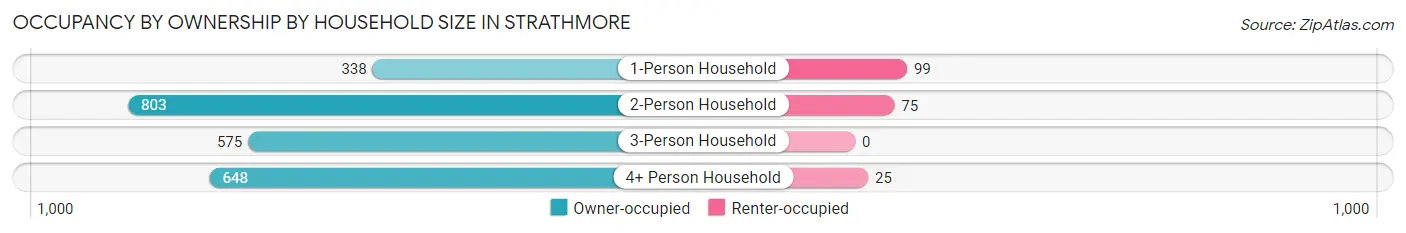
| Household Size | Owner-occupied | Renter-occupied |
| 1-Person Household | 338 (77.3%) | 99 (22.7%) |
| 2-Person Household | 803 (91.5%) | 75 (8.5%) |
| 3-Person Household | 575 (100.0%) | 0 (0.0%) |
| 4+ Person Household | 648 (96.3%) | 25 (3.7%) |
| Total Housing Units | 2,364 (92.2%) | 199 (7.8%) |
Occupancy by Educational Attainment in Strathmore
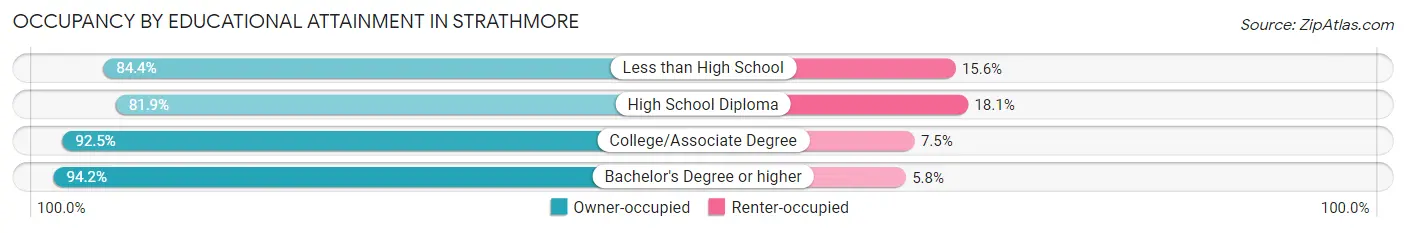
| Household Size | Owner-occupied | Renter-occupied |
| Less than High School | 27 (84.4%) | 5 (15.6%) |
| High School Diploma | 258 (81.9%) | 57 (18.1%) |
| College/Associate Degree | 493 (92.5%) | 40 (7.5%) |
| Bachelor's Degree or higher | 1,586 (94.2%) | 97 (5.8%) |
Occupancy by Age of Householder in Strathmore
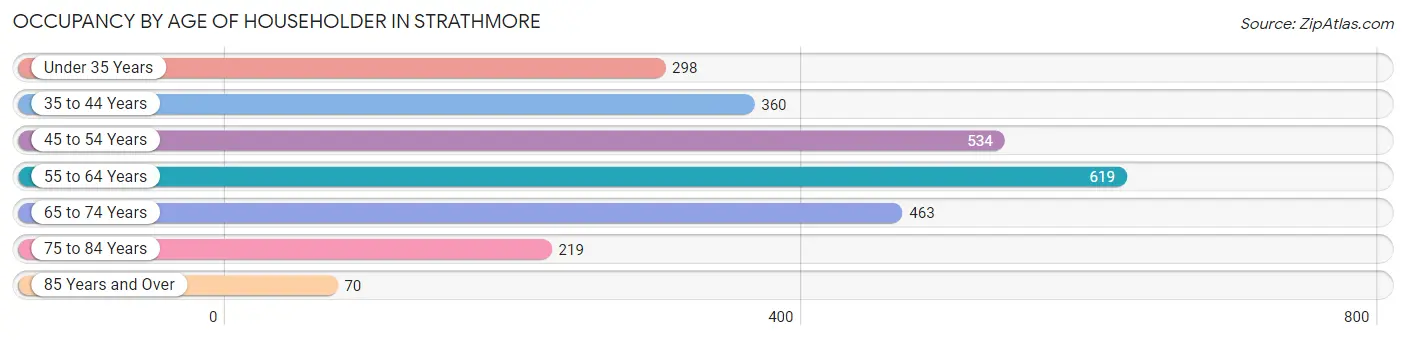
| Age Bracket | # Households | % Households |
| Under 35 Years | 298 | 11.6% |
| 35 to 44 Years | 360 | 14.1% |
| 45 to 54 Years | 534 | 20.8% |
| 55 to 64 Years | 619 | 24.1% |
| 65 to 74 Years | 463 | 18.1% |
| 75 to 84 Years | 219 | 8.5% |
| 85 Years and Over | 70 | 2.7% |
| Total | 2,563 | 100.0% |
Housing Finances in Strathmore
Median Income by Occupancy in Strathmore
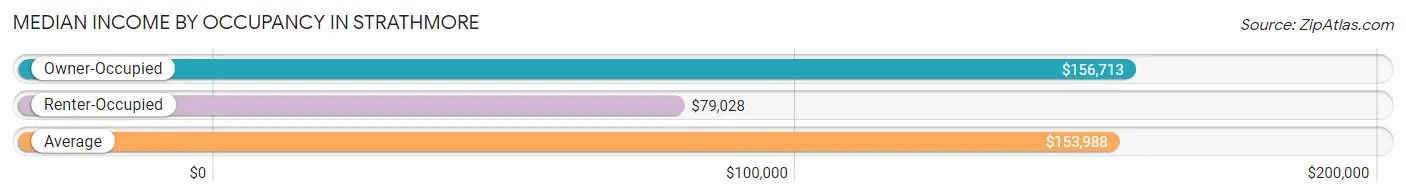
| Occupancy Type | # Households | Median Income |
| Owner-Occupied | 2,364 (92.2%) | $156,713 |
| Renter-Occupied | 199 (7.8%) | $79,028 |
| Average | 2,563 (100.0%) | $153,988 |
Occupancy by Householder Income Bracket in Strathmore
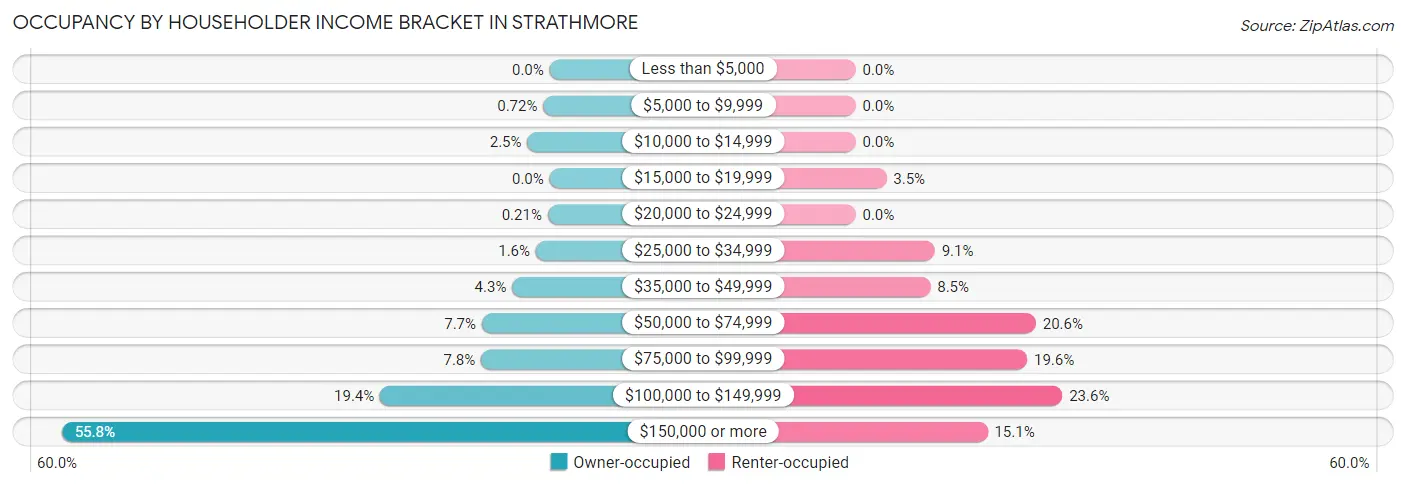
| Income Bracket | Owner-occupied | Renter-occupied |
| Less than $5,000 | 0 (0.0%) | 0 (0.0%) |
| $5,000 to $9,999 | 17 (0.7%) | 0 (0.0%) |
| $10,000 to $14,999 | 60 (2.5%) | 0 (0.0%) |
| $15,000 to $19,999 | 0 (0.0%) | 7 (3.5%) |
| $20,000 to $24,999 | 5 (0.2%) | 0 (0.0%) |
| $25,000 to $34,999 | 37 (1.6%) | 18 (9.0%) |
| $35,000 to $49,999 | 101 (4.3%) | 17 (8.5%) |
| $50,000 to $74,999 | 183 (7.7%) | 41 (20.6%) |
| $75,000 to $99,999 | 185 (7.8%) | 39 (19.6%) |
| $100,000 to $149,999 | 458 (19.4%) | 47 (23.6%) |
| $150,000 or more | 1,318 (55.7%) | 30 (15.1%) |
| Total | 2,364 (100.0%) | 199 (100.0%) |
Monthly Housing Cost Tiers in Strathmore
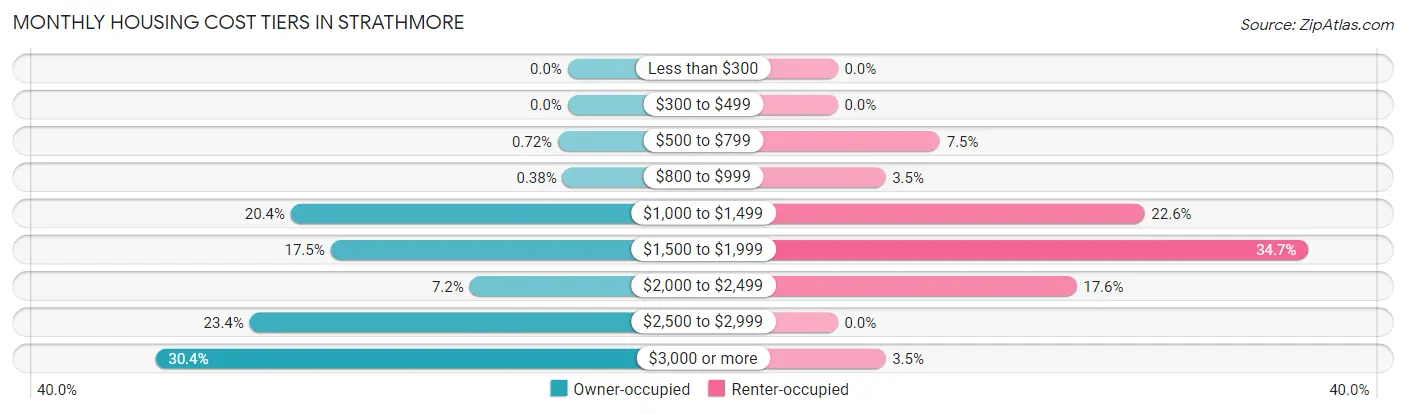
| Monthly Cost | Owner-occupied | Renter-occupied |
| Less than $300 | 0 (0.0%) | 0 (0.0%) |
| $300 to $499 | 0 (0.0%) | 0 (0.0%) |
| $500 to $799 | 17 (0.7%) | 15 (7.5%) |
| $800 to $999 | 9 (0.4%) | 7 (3.5%) |
| $1,000 to $1,499 | 482 (20.4%) | 45 (22.6%) |
| $1,500 to $1,999 | 413 (17.5%) | 69 (34.7%) |
| $2,000 to $2,499 | 171 (7.2%) | 35 (17.6%) |
| $2,500 to $2,999 | 554 (23.4%) | 0 (0.0%) |
| $3,000 or more | 718 (30.4%) | 7 (3.5%) |
| Total | 2,364 (100.0%) | 199 (100.0%) |
Physical Housing Characteristics in Strathmore
Housing Structures in Strathmore
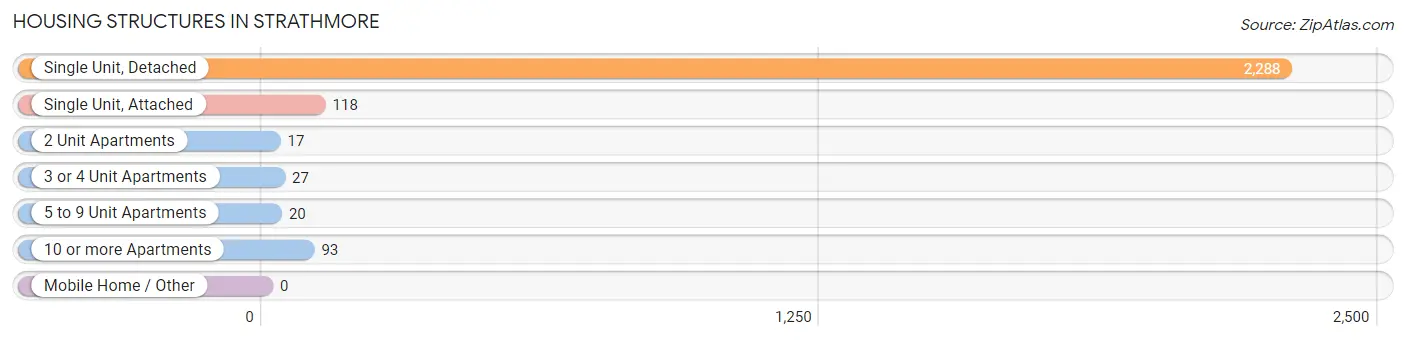
| Structure Type | # Housing Units | % Housing Units |
| Single Unit, Detached | 2,288 | 89.3% |
| Single Unit, Attached | 118 | 4.6% |
| 2 Unit Apartments | 17 | 0.7% |
| 3 or 4 Unit Apartments | 27 | 1.1% |
| 5 to 9 Unit Apartments | 20 | 0.8% |
| 10 or more Apartments | 93 | 3.6% |
| Mobile Home / Other | 0 | 0.0% |
| Total | 2,563 | 100.0% |
Housing Structures by Occupancy in Strathmore
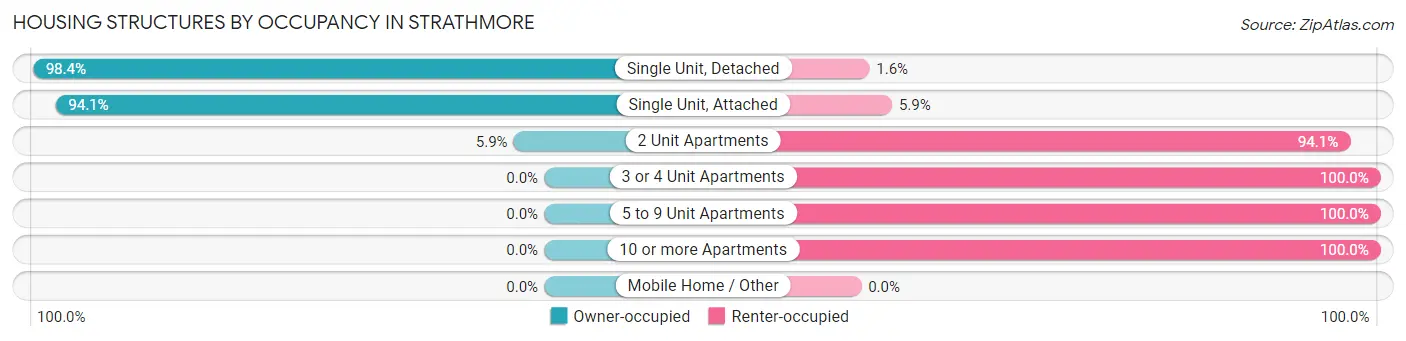
| Structure Type | Owner-occupied | Renter-occupied |
| Single Unit, Detached | 2,252 (98.4%) | 36 (1.6%) |
| Single Unit, Attached | 111 (94.1%) | 7 (5.9%) |
| 2 Unit Apartments | 1 (5.9%) | 16 (94.1%) |
| 3 or 4 Unit Apartments | 0 (0.0%) | 27 (100.0%) |
| 5 to 9 Unit Apartments | 0 (0.0%) | 20 (100.0%) |
| 10 or more Apartments | 0 (0.0%) | 93 (100.0%) |
| Mobile Home / Other | 0 (0.0%) | 0 (0.0%) |
| Total | 2,364 (92.2%) | 199 (7.8%) |
Housing Structures by Number of Rooms in Strathmore
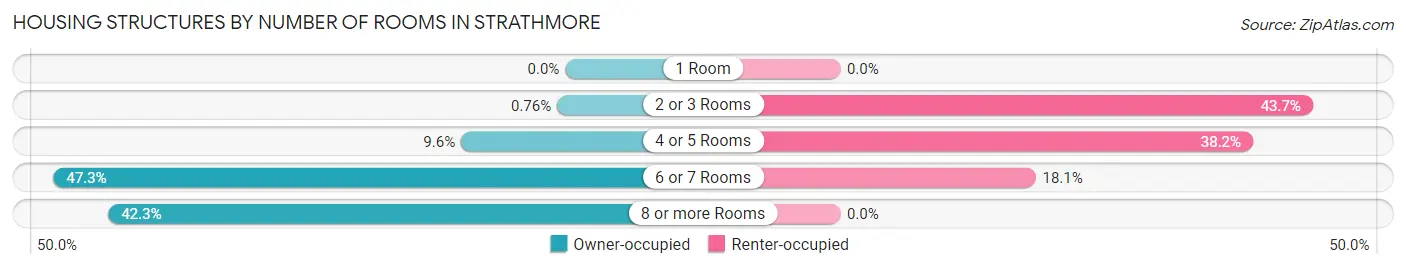
| Number of Rooms | Owner-occupied | Renter-occupied |
| 1 Room | 0 (0.0%) | 0 (0.0%) |
| 2 or 3 Rooms | 18 (0.8%) | 87 (43.7%) |
| 4 or 5 Rooms | 228 (9.6%) | 76 (38.2%) |
| 6 or 7 Rooms | 1,119 (47.3%) | 36 (18.1%) |
| 8 or more Rooms | 999 (42.3%) | 0 (0.0%) |
| Total | 2,364 (100.0%) | 199 (100.0%) |
Housing Structure by Heating Type in Strathmore
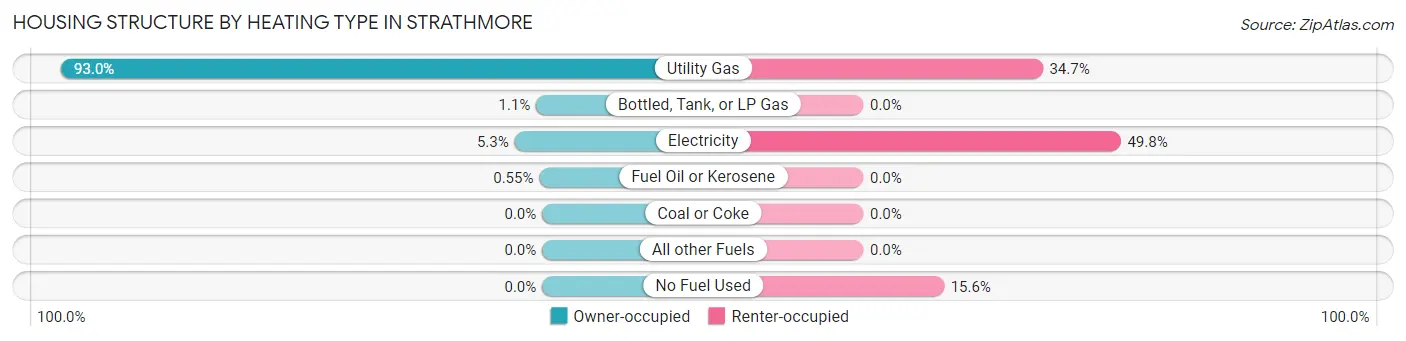
| Heating Type | Owner-occupied | Renter-occupied |
| Utility Gas | 2,198 (93.0%) | 69 (34.7%) |
| Bottled, Tank, or LP Gas | 27 (1.1%) | 0 (0.0%) |
| Electricity | 126 (5.3%) | 99 (49.7%) |
| Fuel Oil or Kerosene | 13 (0.5%) | 0 (0.0%) |
| Coal or Coke | 0 (0.0%) | 0 (0.0%) |
| All other Fuels | 0 (0.0%) | 0 (0.0%) |
| No Fuel Used | 0 (0.0%) | 31 (15.6%) |
| Total | 2,364 (100.0%) | 199 (100.0%) |
Household Vehicle Usage in Strathmore
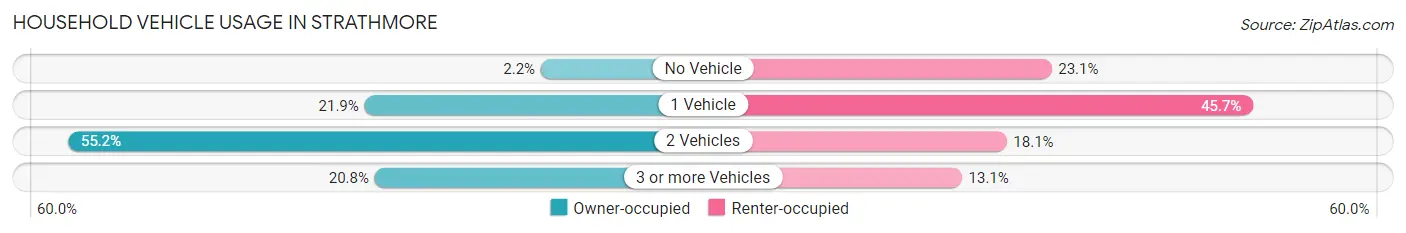
| Vehicles per Household | Owner-occupied | Renter-occupied |
| No Vehicle | 51 (2.2%) | 46 (23.1%) |
| 1 Vehicle | 518 (21.9%) | 91 (45.7%) |
| 2 Vehicles | 1,304 (55.2%) | 36 (18.1%) |
| 3 or more Vehicles | 491 (20.8%) | 26 (13.1%) |
| Total | 2,364 (100.0%) | 199 (100.0%) |
Real Estate & Mortgages in Strathmore
Real Estate and Mortgage Overview in Strathmore
| Characteristic | Without Mortgage | With Mortgage |
| Housing Units | 859 | 1,505 |
| Median Property Value | $485,200 | $471,200 |
| Median Household Income | $151,823 | $871 |
| Monthly Housing Costs | $1,467 | $718 |
| Real Estate Taxes | $10,001 | $0 |
Property Value by Mortgage Status in Strathmore
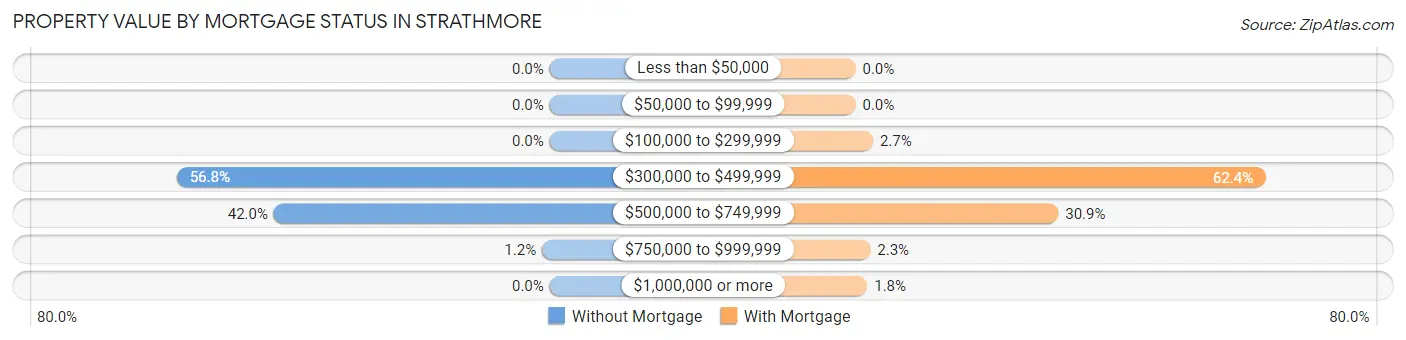
| Property Value | Without Mortgage | With Mortgage |
| Less than $50,000 | 0 (0.0%) | 0 (0.0%) |
| $50,000 to $99,999 | 0 (0.0%) | 0 (0.0%) |
| $100,000 to $299,999 | 0 (0.0%) | 40 (2.7%) |
| $300,000 to $499,999 | 488 (56.8%) | 939 (62.4%) |
| $500,000 to $749,999 | 361 (42.0%) | 465 (30.9%) |
| $750,000 to $999,999 | 10 (1.2%) | 34 (2.3%) |
| $1,000,000 or more | 0 (0.0%) | 27 (1.8%) |
| Total | 859 (100.0%) | 1,505 (100.0%) |
Household Income by Mortgage Status in Strathmore
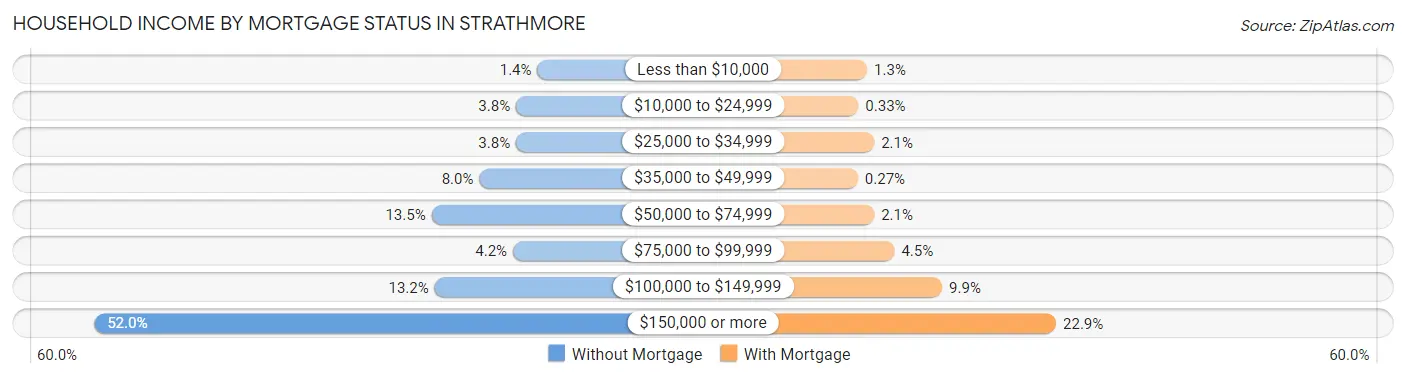
| Household Income | Without Mortgage | With Mortgage |
| Less than $10,000 | 12 (1.4%) | 20 (1.3%) |
| $10,000 to $24,999 | 33 (3.8%) | 5 (0.3%) |
| $25,000 to $34,999 | 33 (3.8%) | 32 (2.1%) |
| $35,000 to $49,999 | 69 (8.0%) | 4 (0.3%) |
| $50,000 to $74,999 | 116 (13.5%) | 32 (2.1%) |
| $75,000 to $99,999 | 36 (4.2%) | 67 (4.4%) |
| $100,000 to $149,999 | 113 (13.2%) | 149 (9.9%) |
| $150,000 or more | 447 (52.0%) | 345 (22.9%) |
| Total | 859 (100.0%) | 1,505 (100.0%) |
Property Value to Household Income Ratio in Strathmore
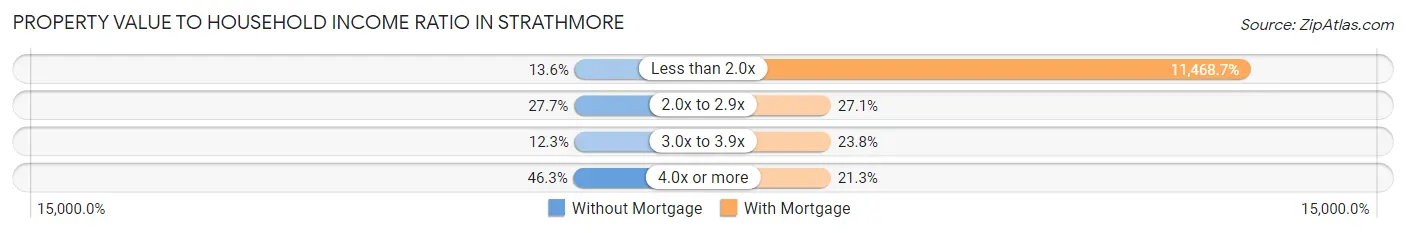
| Value-to-Income Ratio | Without Mortgage | With Mortgage |
| Less than 2.0x | 117 (13.6%) | 172,604 (11,468.7%) |
| 2.0x to 2.9x | 238 (27.7%) | 408 (27.1%) |
| 3.0x to 3.9x | 106 (12.3%) | 358 (23.8%) |
| 4.0x or more | 398 (46.3%) | 321 (21.3%) |
| Total | 859 (100.0%) | 1,505 (100.0%) |
Real Estate Taxes by Mortgage Status in Strathmore
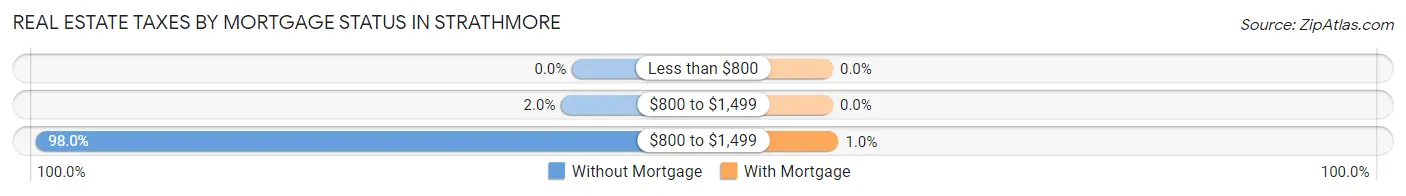
| Property Taxes | Without Mortgage | With Mortgage |
| Less than $800 | 0 (0.0%) | 0 (0.0%) |
| $800 to $1,499 | 17 (2.0%) | 0 (0.0%) |
| $800 to $1,499 | 842 (98.0%) | 15 (1.0%) |
| Total | 859 (100.0%) | 1,505 (100.0%) |
Health & Disability in Strathmore
Health Insurance Coverage by Age in Strathmore
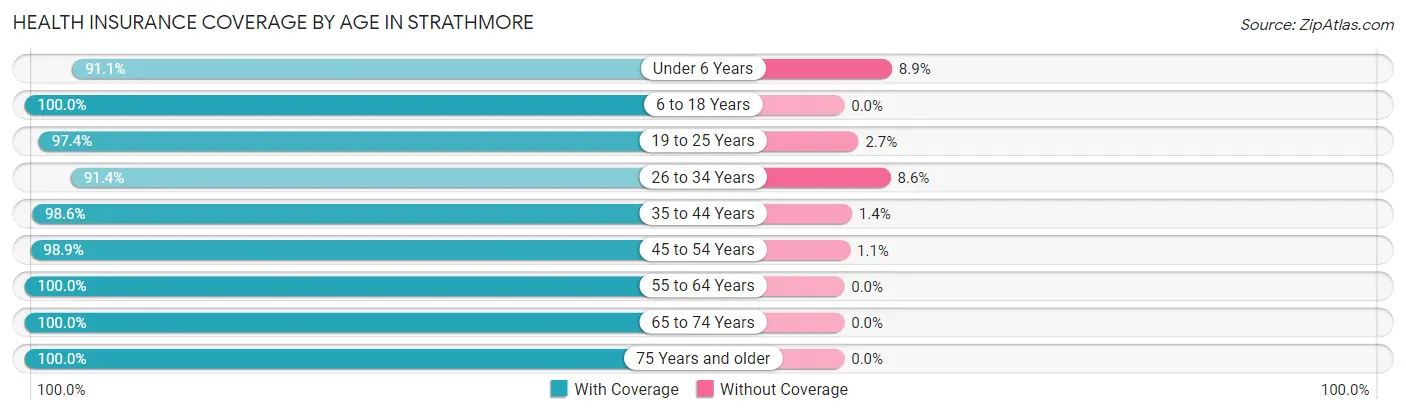
| Age Bracket | With Coverage | Without Coverage |
| Under 6 Years | 472 (91.1%) | 46 (8.9%) |
| 6 to 18 Years | 1,079 (100.0%) | 0 (0.0%) |
| 19 to 25 Years | 367 (97.4%) | 10 (2.6%) |
| 26 to 34 Years | 709 (91.4%) | 67 (8.6%) |
| 35 to 44 Years | 762 (98.6%) | 11 (1.4%) |
| 45 to 54 Years | 1,003 (98.9%) | 11 (1.1%) |
| 55 to 64 Years | 1,096 (100.0%) | 0 (0.0%) |
| 65 to 74 Years | 750 (100.0%) | 0 (0.0%) |
| 75 Years and older | 521 (100.0%) | 0 (0.0%) |
| Total | 6,759 (97.9%) | 145 (2.1%) |
Health Insurance Coverage by Citizenship Status in Strathmore
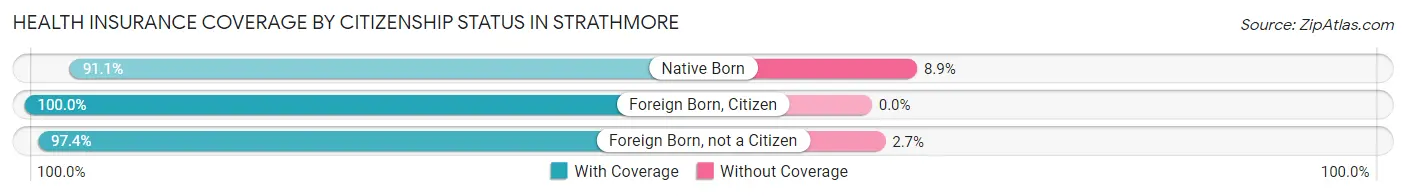
| Citizenship Status | With Coverage | Without Coverage |
| Native Born | 472 (91.1%) | 46 (8.9%) |
| Foreign Born, Citizen | 1,079 (100.0%) | 0 (0.0%) |
| Foreign Born, not a Citizen | 367 (97.4%) | 10 (2.6%) |
Health Insurance Coverage by Household Income in Strathmore
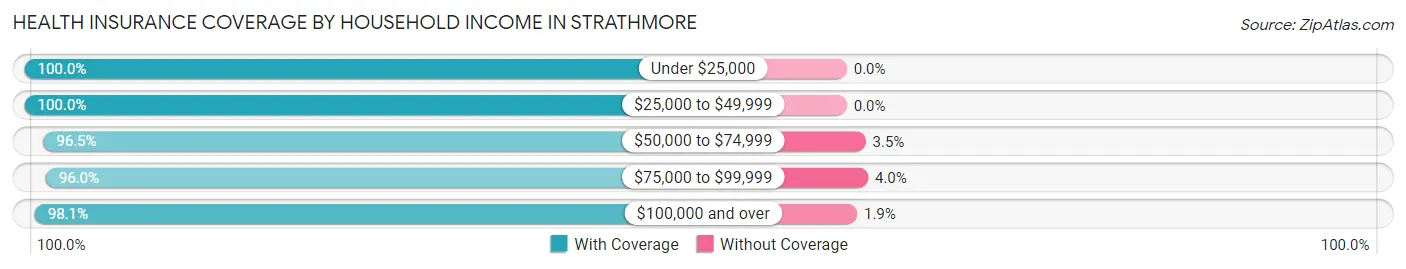
| Household Income | With Coverage | Without Coverage |
| Under $25,000 | 155 (100.0%) | 0 (0.0%) |
| $25,000 to $49,999 | 234 (100.0%) | 0 (0.0%) |
| $50,000 to $74,999 | 575 (96.5%) | 21 (3.5%) |
| $75,000 to $99,999 | 507 (96.0%) | 21 (4.0%) |
| $100,000 and over | 5,254 (98.1%) | 103 (1.9%) |
Public vs Private Health Insurance Coverage by Age in Strathmore
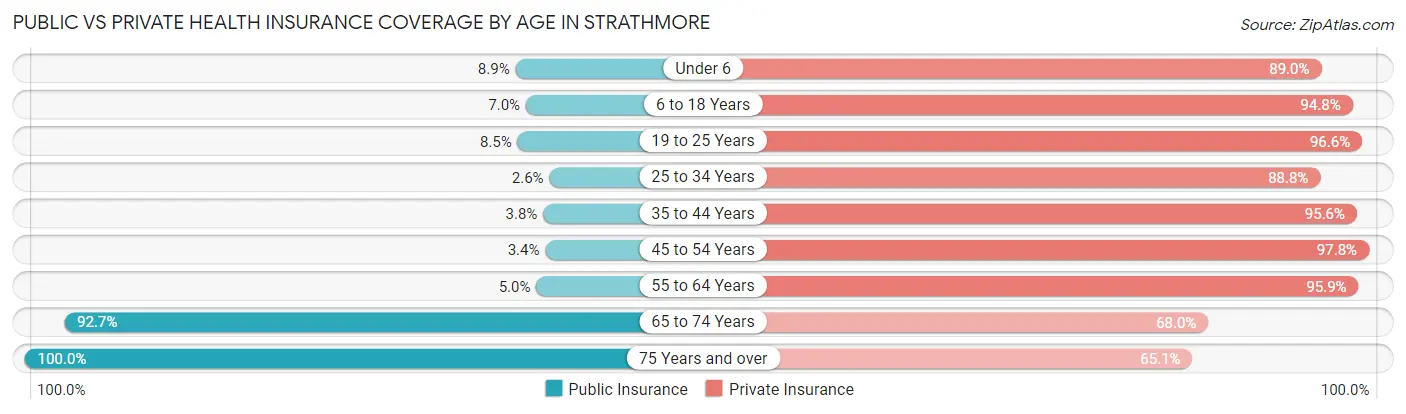
| Age Bracket | Public Insurance | Private Insurance |
| Under 6 | 46 (8.9%) | 461 (89.0%) |
| 6 to 18 Years | 75 (7.0%) | 1,023 (94.8%) |
| 19 to 25 Years | 32 (8.5%) | 364 (96.6%) |
| 25 to 34 Years | 20 (2.6%) | 689 (88.8%) |
| 35 to 44 Years | 29 (3.7%) | 739 (95.6%) |
| 45 to 54 Years | 34 (3.4%) | 992 (97.8%) |
| 55 to 64 Years | 55 (5.0%) | 1,051 (95.9%) |
| 65 to 74 Years | 695 (92.7%) | 510 (68.0%) |
| 75 Years and over | 521 (100.0%) | 339 (65.1%) |
| Total | 1,507 (21.8%) | 6,168 (89.3%) |
Disability Status by Sex by Age in Strathmore
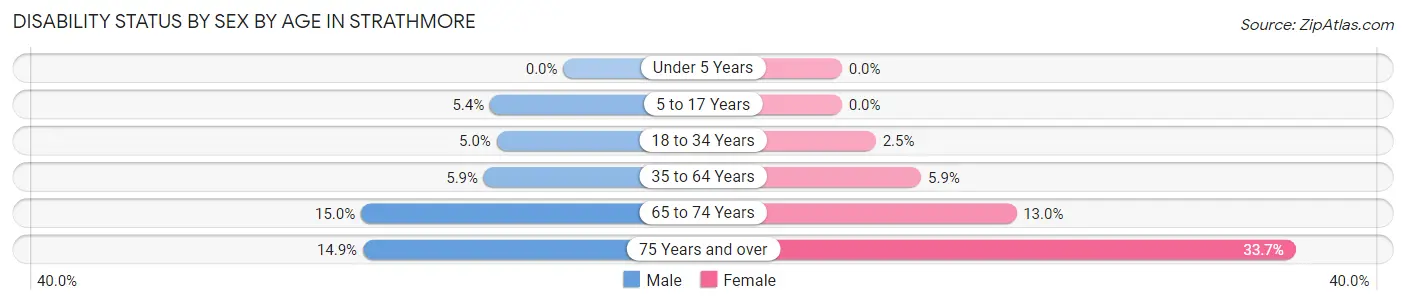
| Age Bracket | Male | Female |
| Under 5 Years | 0 (0.0%) | 0 (0.0%) |
| 5 to 17 Years | 26 (5.4%) | 0 (0.0%) |
| 18 to 34 Years | 33 (5.0%) | 15 (2.5%) |
| 35 to 64 Years | 83 (5.9%) | 87 (5.9%) |
| 65 to 74 Years | 50 (15.0%) | 54 (13.0%) |
| 75 Years and over | 36 (14.9%) | 94 (33.7%) |
Disability Class by Sex by Age in Strathmore
Disability Class: Hearing Difficulty
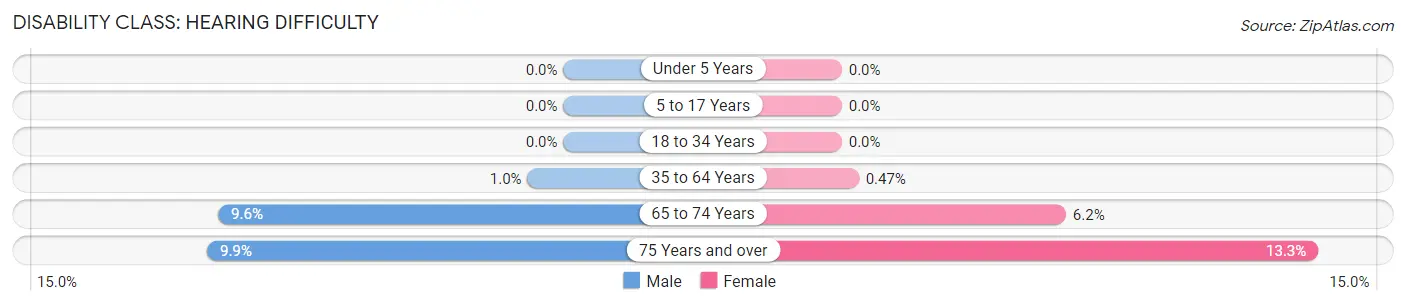
| Age Bracket | Male | Female |
| Under 5 Years | 0 (0.0%) | 0 (0.0%) |
| 5 to 17 Years | 0 (0.0%) | 0 (0.0%) |
| 18 to 34 Years | 0 (0.0%) | 0 (0.0%) |
| 35 to 64 Years | 14 (1.0%) | 7 (0.5%) |
| 65 to 74 Years | 32 (9.6%) | 26 (6.2%) |
| 75 Years and over | 24 (9.9%) | 37 (13.3%) |
Disability Class: Vision Difficulty
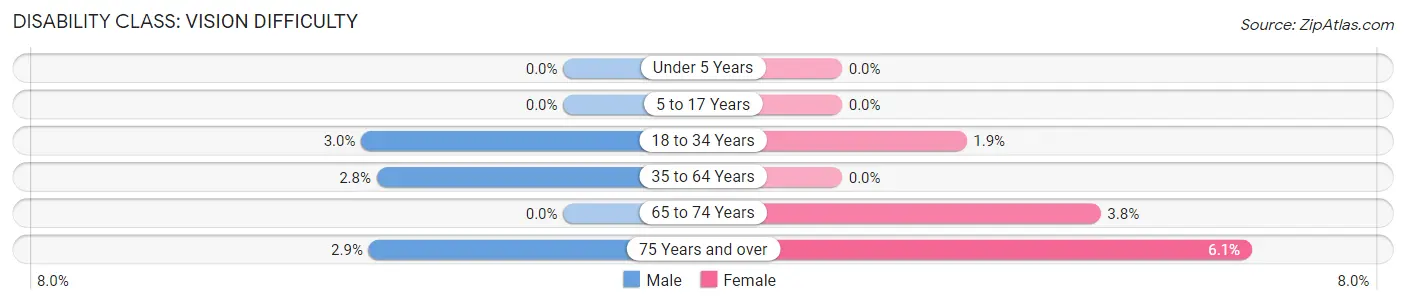
| Age Bracket | Male | Female |
| Under 5 Years | 0 (0.0%) | 0 (0.0%) |
| 5 to 17 Years | 0 (0.0%) | 0 (0.0%) |
| 18 to 34 Years | 20 (3.0%) | 11 (1.8%) |
| 35 to 64 Years | 39 (2.8%) | 0 (0.0%) |
| 65 to 74 Years | 0 (0.0%) | 16 (3.8%) |
| 75 Years and over | 7 (2.9%) | 17 (6.1%) |
Disability Class: Cognitive Difficulty
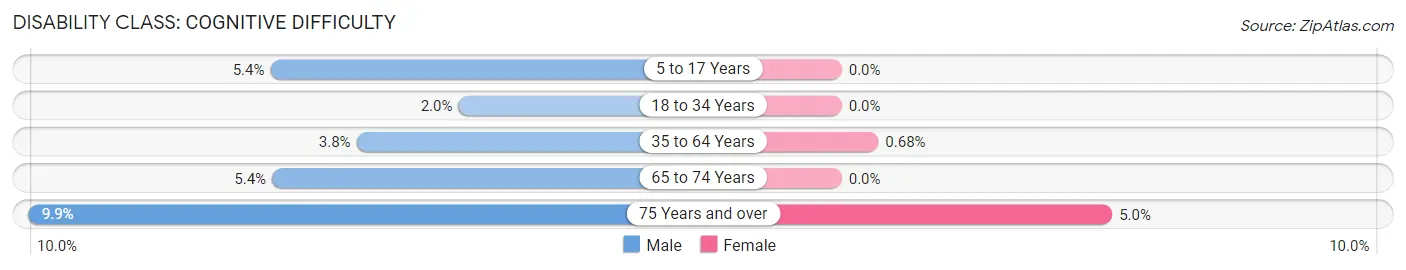
| Age Bracket | Male | Female |
| 5 to 17 Years | 26 (5.4%) | 0 (0.0%) |
| 18 to 34 Years | 13 (1.9%) | 0 (0.0%) |
| 35 to 64 Years | 54 (3.8%) | 10 (0.7%) |
| 65 to 74 Years | 18 (5.4%) | 0 (0.0%) |
| 75 Years and over | 24 (9.9%) | 14 (5.0%) |
Disability Class: Ambulatory Difficulty
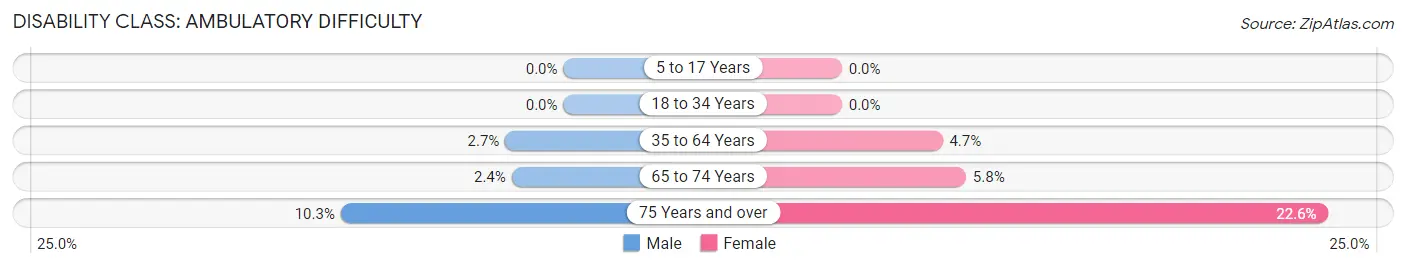
| Age Bracket | Male | Female |
| 5 to 17 Years | 0 (0.0%) | 0 (0.0%) |
| 18 to 34 Years | 0 (0.0%) | 0 (0.0%) |
| 35 to 64 Years | 38 (2.7%) | 69 (4.7%) |
| 65 to 74 Years | 8 (2.4%) | 24 (5.8%) |
| 75 Years and over | 25 (10.3%) | 63 (22.6%) |
Disability Class: Self-Care Difficulty
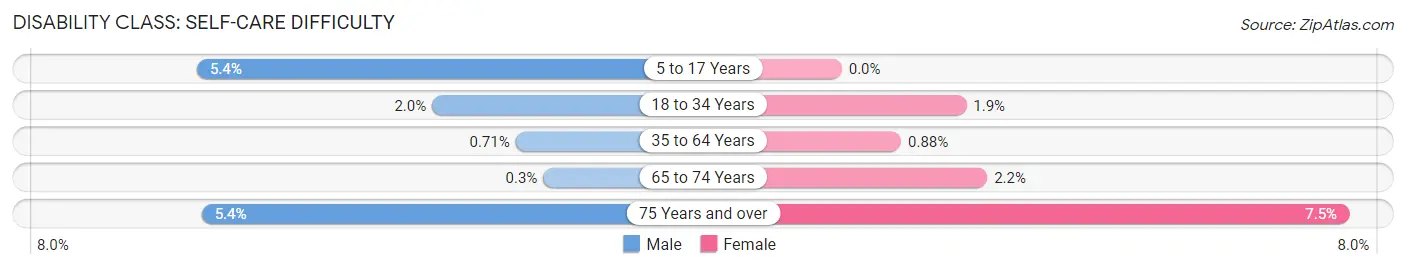
| Age Bracket | Male | Female |
| 5 to 17 Years | 26 (5.4%) | 0 (0.0%) |
| 18 to 34 Years | 13 (1.9%) | 11 (1.8%) |
| 35 to 64 Years | 10 (0.7%) | 13 (0.9%) |
| 65 to 74 Years | 1 (0.3%) | 9 (2.2%) |
| 75 Years and over | 13 (5.4%) | 21 (7.5%) |
Technology Access in Strathmore
Computing Device Access in Strathmore
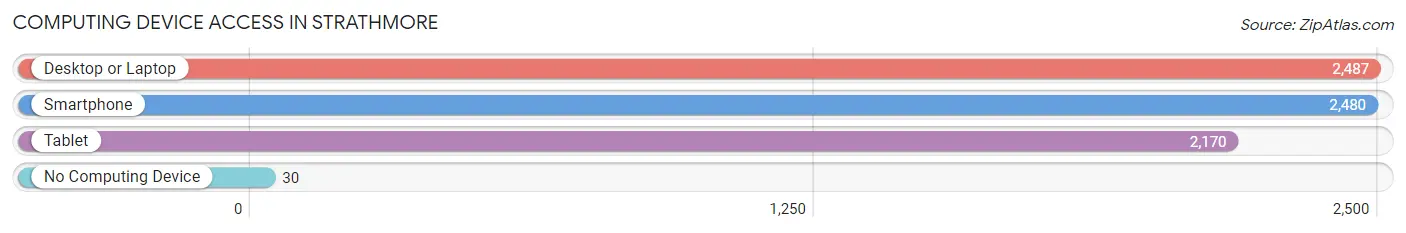
| Device Type | # Households | % Households |
| Desktop or Laptop | 2,487 | 97.0% |
| Smartphone | 2,480 | 96.8% |
| Tablet | 2,170 | 84.7% |
| No Computing Device | 30 | 1.2% |
| Total | 2,563 | 100.0% |
Internet Access in Strathmore
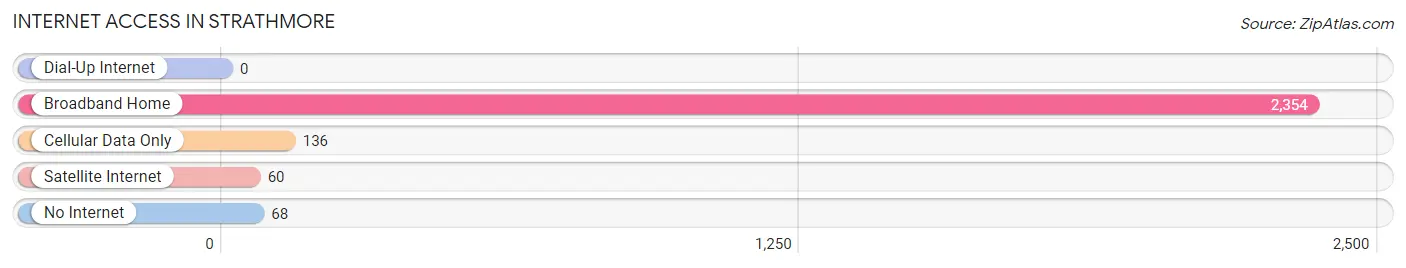
| Internet Type | # Households | % Households |
| Dial-Up Internet | 0 | 0.0% |
| Broadband Home | 2,354 | 91.8% |
| Cellular Data Only | 136 | 5.3% |
| Satellite Internet | 60 | 2.3% |
| No Internet | 68 | 2.6% |
| Total | 2,563 | 100.0% |
Strathmore Summary
Strathmore is a small borough located in Monmouth County, New Jersey. It is situated on the banks of the Manasquan River and is part of the Bayshore region. The borough was incorporated in 1925 and has a population of approximately 1,500 people.
History
The area that is now Strathmore was originally inhabited by the Lenape Native Americans. The first European settlers arrived in the area in the late 1600s and established a small fishing village. The village was known as “Strathmore” after the Scottish town of the same name. The name was chosen to honor the Scottish heritage of the settlers.
In the late 1800s, the area began to develop as a resort destination. The Manasquan River was a popular spot for fishing and boating, and the area was known for its beautiful beaches. The Strathmore Hotel was built in 1891 and was a popular destination for visitors.
In 1925, the area was incorporated as the Borough of Strathmore. The borough was named after the Scottish town of Strathmore and was intended to be a summer resort destination.
Geography
Strathmore is located in Monmouth County, New Jersey. It is situated on the banks of the Manasquan River and is part of the Bayshore region. The borough is bordered by the towns of Brielle, Manasquan, and Wall Township.
The borough has a total area of 0.7 square miles, all of which is land. The terrain is mostly flat and the borough is located at an elevation of approximately 10 feet above sea level.
Economy
The economy of Strathmore is largely based on tourism. The borough is home to several popular beaches, including Strathmore Beach and Manasquan Beach. The beaches are popular destinations for visitors from all over the region.
The borough is also home to several small businesses, including restaurants, shops, and other services. The borough is also home to a marina, which provides access to the Manasquan River.
Demographics
As of the 2010 census, the population of Strathmore was 1,521. The racial makeup of the borough was 94.3% White, 2.2% African American, 0.2% Native American, 0.9% Asian, 0.1% Pacific Islander, and 2.3% from other races. Hispanic or Latino of any race were 4.2% of the population.
The median household income in Strathmore was $68,750, and the median family income was $76,250. The per capita income for the borough was $31,945. About 4.3% of families and 5.3% of the population were below the poverty line.
Strathmore is a small borough with a rich history and a vibrant economy. The borough is home to several popular beaches and is a popular destination for visitors from all over the region. The borough has a diverse population and a strong economy, making it an attractive place to live and work.
Common Questions
What is Per Capita Income in Strathmore?
Per Capita income in Strathmore is $64,502.
What is the Median Family Income in Strathmore?
Median Family Income in Strathmore is $162,538.
What is the Median Household income in Strathmore?
Median Household Income in Strathmore is $153,988.
What is Income or Wage Gap in Strathmore?
Income or Wage Gap in Strathmore is 41.2%.
Women in Strathmore earn 58.8 cents for every dollar earned by a man.
What is Inequality or Gini Index in Strathmore?
Inequality or Gini Index in Strathmore is 0.35.
What is the Total Population of Strathmore?
Total Population of Strathmore is 6,904.
What is the Total Male Population of Strathmore?
Total Male Population of Strathmore is 3,456.
What is the Total Female Population of Strathmore?
Total Female Population of Strathmore is 3,448.
What is the Ratio of Males per 100 Females in Strathmore?
There are 100.23 Males per 100 Females in Strathmore.
What is the Ratio of Females per 100 Males in Strathmore?
There are 99.77 Females per 100 Males in Strathmore.
What is the Median Population Age in Strathmore?
Median Population Age in Strathmore is 44.0 Years.
What is the Average Family Size in Strathmore
Average Family Size in Strathmore is 3.0 People.
What is the Average Household Size in Strathmore
Average Household Size in Strathmore is 2.7 People.
How Large is the Labor Force in Strathmore?
There are 4,109 People in the Labor Forcein in Strathmore.
What is the Percentage of People in the Labor Force in Strathmore?
72.5% of People are in the Labor Force in Strathmore.
What is the Unemployment Rate in Strathmore?
Unemployment Rate in Strathmore is 5.2%.