Netcong borough, NJ Map & Demographics
Netcong borough Overview
$54,439
PER CAPITA INCOME
$93,371
AVG FAMILY INCOME
$83,125
AVG HOUSEHOLD INCOME
9.3%
WAGE / INCOME GAP [ % ]
90.7¢/ $1
WAGE / INCOME GAP [ $ ]
0.39
INEQUALITY / GINI INDEX
3,484
TOTAL POPULATION
1,654
MALE POPULATION
1,830
FEMALE POPULATION
90.38
MALES / 100 FEMALES
110.64
FEMALES / 100 MALES
43.8
MEDIAN AGE
2.5
AVG FAMILY SIZE
1.9
AVG HOUSEHOLD SIZE
2,134
LABOR FORCE [ PEOPLE ]
70.6%
PERCENT IN LABOR FORCE
2.1%
UNEMPLOYMENT RATE
Income in Netcong borough
Income Overview in Netcong borough
Per Capita Income in Netcong borough is $54,439, while median incomes of families and households are $93,371 and $83,125 respectively.
| Characteristic | Number | Measure |
| Per Capita Income | 3,484 | $54,439 |
| Median Family Income | 907 | $93,371 |
| Mean Family Income | 907 | $98,705 |
| Median Household Income | 1,870 | $83,125 |
| Mean Household Income | 1,870 | $101,924 |
| Income Deficit | 907 | $0 |
| Wage / Income Gap (%) | 3,484 | 9.31% |
| Wage / Income Gap ($) | 3,484 | 90.69¢ per $1 |
| Gini / Inequality Index | 3,484 | 0.39 |
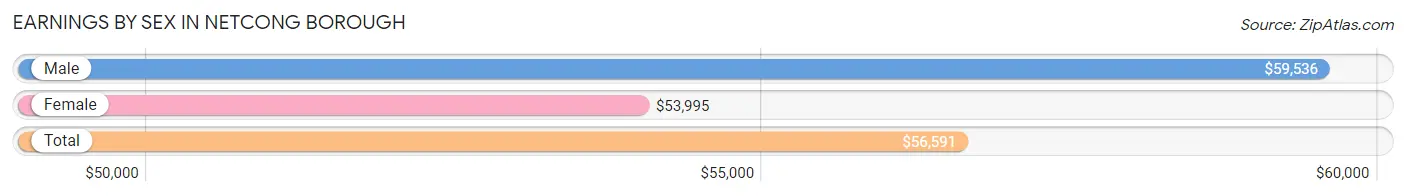
Earnings by Sex in Netcong borough
Average Earnings in Netcong borough are $56,591, $59,536 for men and $53,995 for women, a difference of 9.3%.
| Sex | Number | Average Earnings |
| Male | 1,121 (50.8%) | $59,536 |
| Female | 1,087 (49.2%) | $53,995 |
| Total | 2,208 (100.0%) | $56,591 |
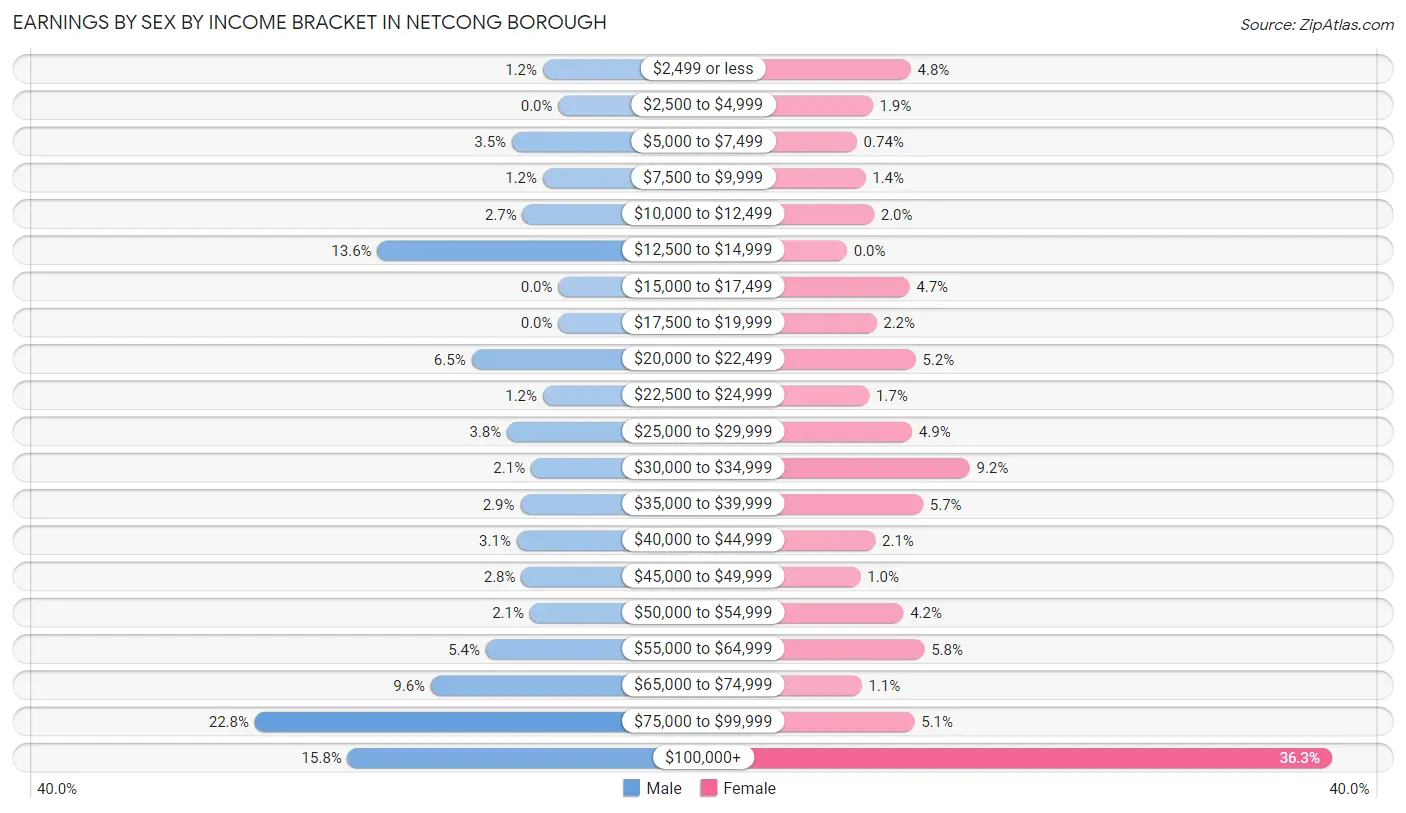
Earnings by Sex by Income Bracket in Netcong borough
The most common earnings brackets in Netcong borough are $75,000 to $99,999 for men (255 | 22.8%) and $100,000+ for women (395 | 36.3%).
| Income | Male | Female |
| $2,499 or less | 13 (1.2%) | 52 (4.8%) |
| $2,500 to $4,999 | 0 (0.0%) | 21 (1.9%) |
| $5,000 to $7,499 | 39 (3.5%) | 8 (0.7%) |
| $7,500 to $9,999 | 13 (1.2%) | 15 (1.4%) |
| $10,000 to $12,499 | 30 (2.7%) | 22 (2.0%) |
| $12,500 to $14,999 | 152 (13.6%) | 0 (0.0%) |
| $15,000 to $17,499 | 0 (0.0%) | 51 (4.7%) |
| $17,500 to $19,999 | 0 (0.0%) | 24 (2.2%) |
| $20,000 to $22,499 | 73 (6.5%) | 56 (5.1%) |
| $22,500 to $24,999 | 13 (1.2%) | 18 (1.7%) |
| $25,000 to $29,999 | 43 (3.8%) | 53 (4.9%) |
| $30,000 to $34,999 | 23 (2.1%) | 100 (9.2%) |
| $35,000 to $39,999 | 32 (2.9%) | 62 (5.7%) |
| $40,000 to $44,999 | 35 (3.1%) | 23 (2.1%) |
| $45,000 to $49,999 | 31 (2.8%) | 11 (1.0%) |
| $50,000 to $54,999 | 24 (2.1%) | 46 (4.2%) |
| $55,000 to $64,999 | 61 (5.4%) | 63 (5.8%) |
| $65,000 to $74,999 | 107 (9.6%) | 12 (1.1%) |
| $75,000 to $99,999 | 255 (22.8%) | 55 (5.1%) |
| $100,000+ | 177 (15.8%) | 395 (36.3%) |
| Total | 1,121 (100.0%) | 1,087 (100.0%) |
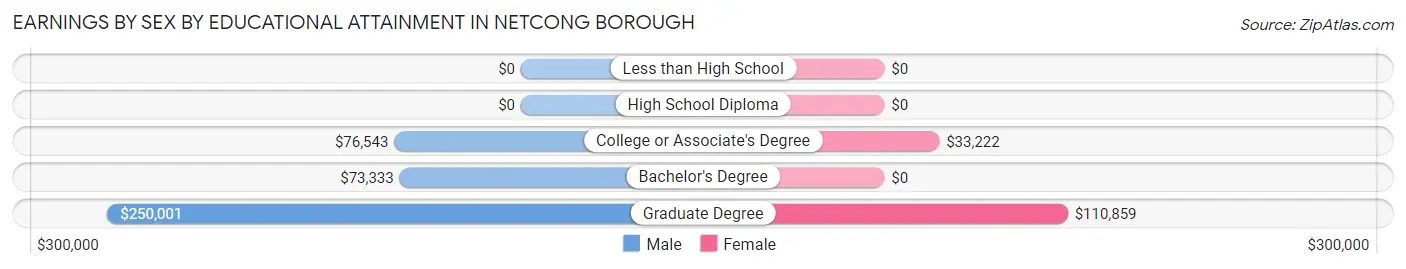
Earnings by Sex by Educational Attainment in Netcong borough
Average earnings in Netcong borough are $66,875 for men and $57,679 for women, a difference of 13.8%. Men with an educational attainment of graduate degree enjoy the highest average annual earnings of $250,001, while those with bachelor's degree education earn the least with $73,333. Women with an educational attainment of graduate degree earn the most with the average annual earnings of $110,859, while those with college or associate's degree education have the smallest earnings of $33,222.
| Educational Attainment | Male Income | Female Income |
| Less than High School | - | - |
| High School Diploma | - | - |
| College or Associate's Degree | $76,543 | $33,222 |
| Bachelor's Degree | $73,333 | $0 |
| Graduate Degree | $250,001 | $110,859 |
| Total | $66,875 | $57,679 |
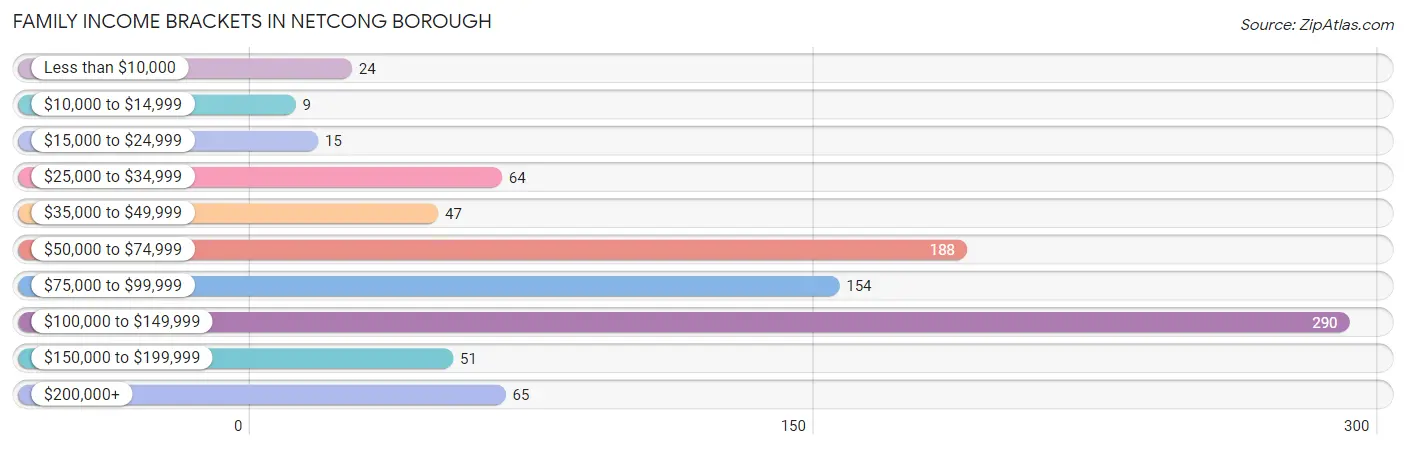
Family Income in Netcong borough
Family Income Brackets in Netcong borough
According to the Netcong borough family income data, there are 290 families falling into the $100,000 to $149,999 income range, which is the most common income bracket and makes up 32.0% of all families. Conversely, the $10,000 to $14,999 income bracket is the least frequent group with only 9 families (1.0%) belonging to this category.
| Income Bracket | # Families | % Families |
| Less than $10,000 | 24 | 2.6% |
| $10,000 to $14,999 | 9 | 1.0% |
| $15,000 to $24,999 | 15 | 1.7% |
| $25,000 to $34,999 | 64 | 7.1% |
| $35,000 to $49,999 | 47 | 5.2% |
| $50,000 to $74,999 | 188 | 20.7% |
| $75,000 to $99,999 | 154 | 17.0% |
| $100,000 to $149,999 | 290 | 32.0% |
| $150,000 to $199,999 | 51 | 5.6% |
| $200,000+ | 65 | 7.2% |
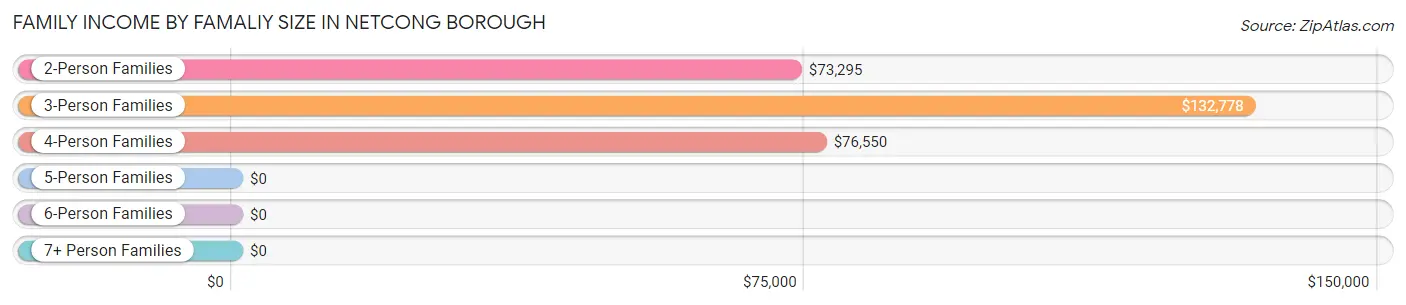
Family Income by Famaliy Size in Netcong borough
3-person families (192 | 21.2%) account for the highest median family income in Netcong borough with $132,778 per family, while 3-person families (192 | 21.2%) have the highest median income of $44,259 per family member.
| Income Bracket | # Families | Median Income |
| 2-Person Families | 603 (66.5%) | $73,295 |
| 3-Person Families | 192 (21.2%) | $132,778 |
| 4-Person Families | 85 (9.4%) | $76,550 |
| 5-Person Families | 16 (1.8%) | $0 |
| 6-Person Families | 11 (1.2%) | $0 |
| 7+ Person Families | 0 (0.0%) | $0 |
| Total | 907 (100.0%) | $93,371 |
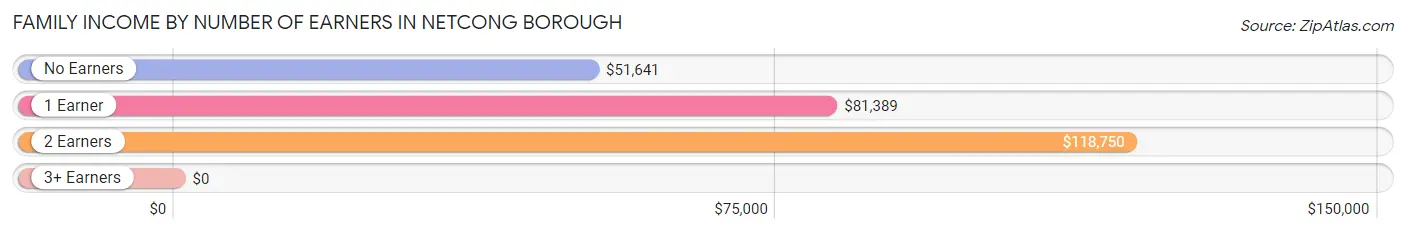
Family Income by Number of Earners in Netcong borough
| Number of Earners | # Families | Median Income |
| No Earners | 115 (12.7%) | $51,641 |
| 1 Earner | 366 (40.4%) | $81,389 |
| 2 Earners | 426 (47.0%) | $118,750 |
| 3+ Earners | 0 (0.0%) | $0 |
| Total | 907 (100.0%) | $93,371 |
Household Income in Netcong borough
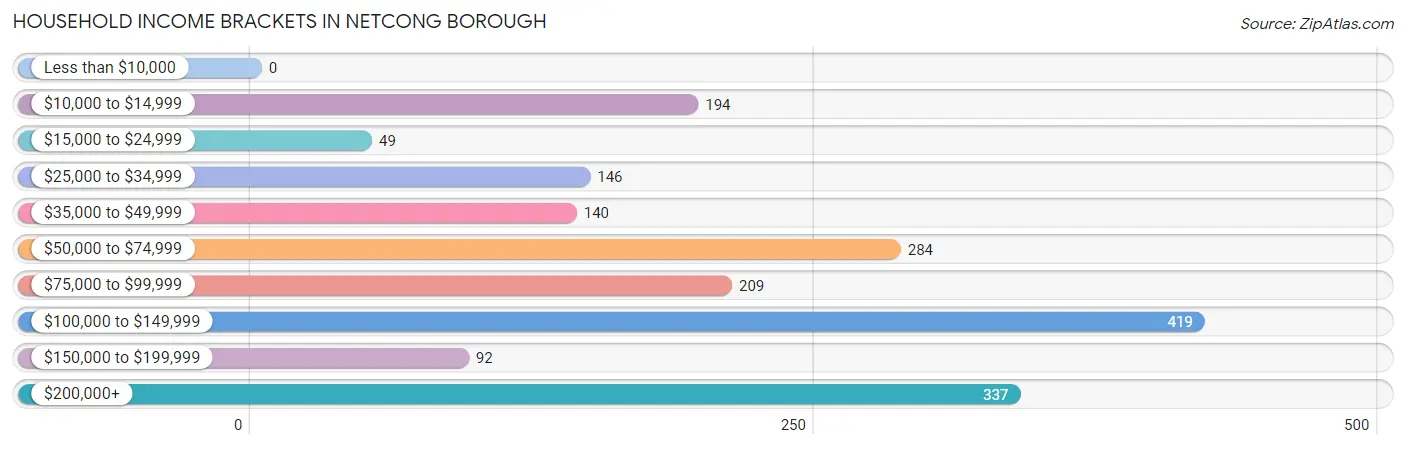
Household Income Brackets in Netcong borough
With 419 households falling in the category, the $100,000 to $149,999 income range is the most frequent in Netcong borough, accounting for 22.4% of all households.
| Income Bracket | # Households | % Households |
| Less than $10,000 | 0 | 0.0% |
| $10,000 to $14,999 | 194 | 10.4% |
| $15,000 to $24,999 | 49 | 2.6% |
| $25,000 to $34,999 | 146 | 7.8% |
| $35,000 to $49,999 | 140 | 7.5% |
| $50,000 to $74,999 | 284 | 15.2% |
| $75,000 to $99,999 | 209 | 11.2% |
| $100,000 to $149,999 | 419 | 22.4% |
| $150,000 to $199,999 | 92 | 4.9% |
| $200,000+ | 337 | 18.0% |
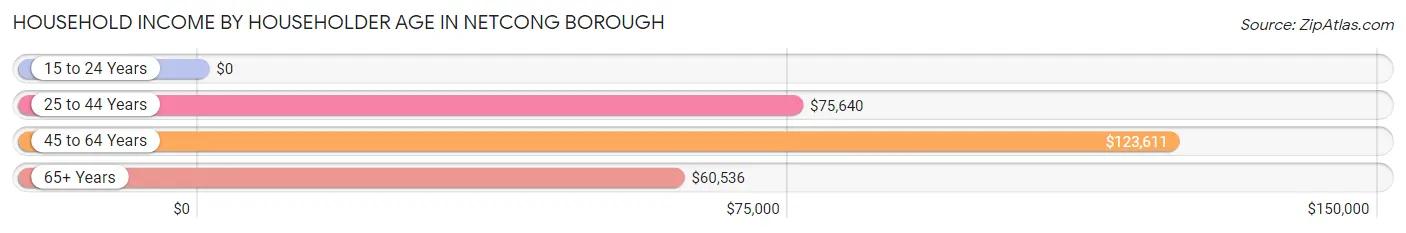
Household Income by Householder Age in Netcong borough
The median household income in Netcong borough is $83,125, with the highest median household income of $123,611 found in the 45 to 64 years age bracket for the primary householder. A total of 852 households (45.6%) fall into this category. Meanwhile, the 15 to 24 years age bracket for the primary householder has the lowest median household income of $0, with 43 households (2.3%) in this group.
| Income Bracket | # Households | Median Income |
| 15 to 24 Years | 43 (2.3%) | $0 |
| 25 to 44 Years | 637 (34.1%) | $75,640 |
| 45 to 64 Years | 852 (45.6%) | $123,611 |
| 65+ Years | 338 (18.1%) | $60,536 |
| Total | 1,870 (100.0%) | $83,125 |
Poverty in Netcong borough
Income Below Poverty by Sex and Age in Netcong borough
With 14.7% poverty level for males and 4.8% for females among the residents of Netcong borough, 25 to 34 year old males and 5 year old females are the most vulnerable to poverty, with 167 males (47.8%) and 21 females (58.3%) in their respective age groups living below the poverty level.
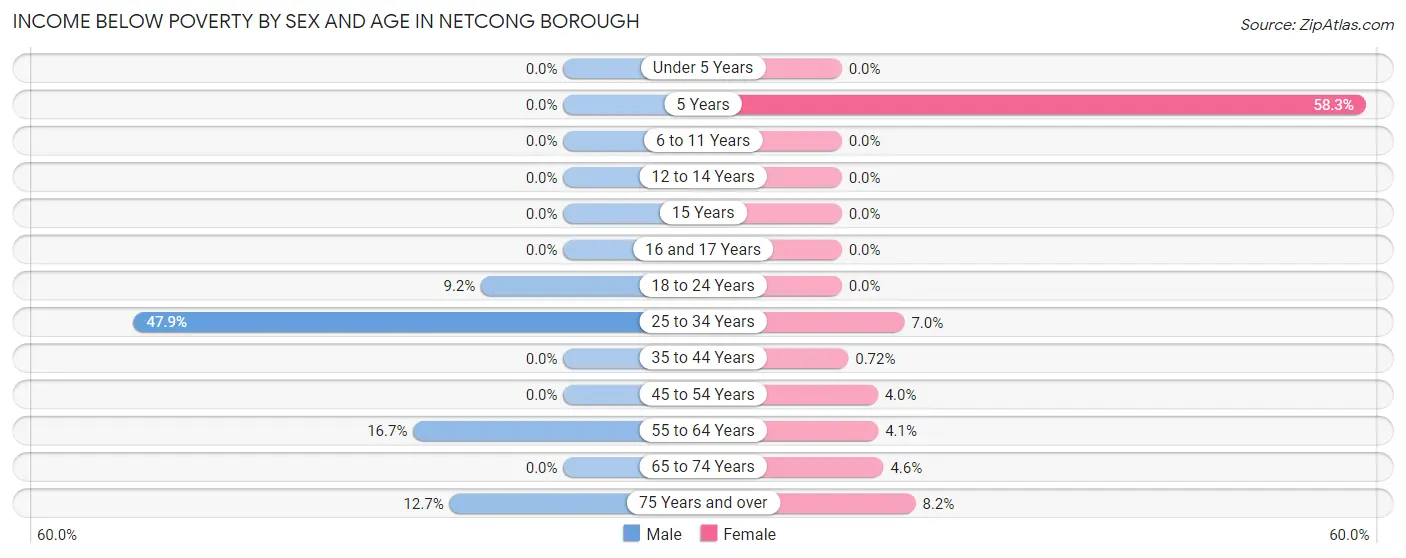
| Age Bracket | Male | Female |
| Under 5 Years | 0 (0.0%) | 0 (0.0%) |
| 5 Years | 0 (0.0%) | 21 (58.3%) |
| 6 to 11 Years | 0 (0.0%) | 0 (0.0%) |
| 12 to 14 Years | 0 (0.0%) | 0 (0.0%) |
| 15 Years | 0 (0.0%) | 0 (0.0%) |
| 16 and 17 Years | 0 (0.0%) | 0 (0.0%) |
| 18 to 24 Years | 12 (9.2%) | 0 (0.0%) |
| 25 to 34 Years | 167 (47.8%) | 15 (7.0%) |
| 35 to 44 Years | 0 (0.0%) | 1 (0.7%) |
| 45 to 54 Years | 0 (0.0%) | 9 (4.0%) |
| 55 to 64 Years | 54 (16.7%) | 21 (4.1%) |
| 65 to 74 Years | 0 (0.0%) | 9 (4.6%) |
| 75 Years and over | 9 (12.7%) | 11 (8.2%) |
| Total | 242 (14.7%) | 87 (4.8%) |
Income Above Poverty by Sex and Age in Netcong borough
According to the poverty statistics in Netcong borough, males aged under 5 years and females aged under 5 years are the age groups that are most secure financially, with 100.0% of males and 100.0% of females in these age groups living above the poverty line.
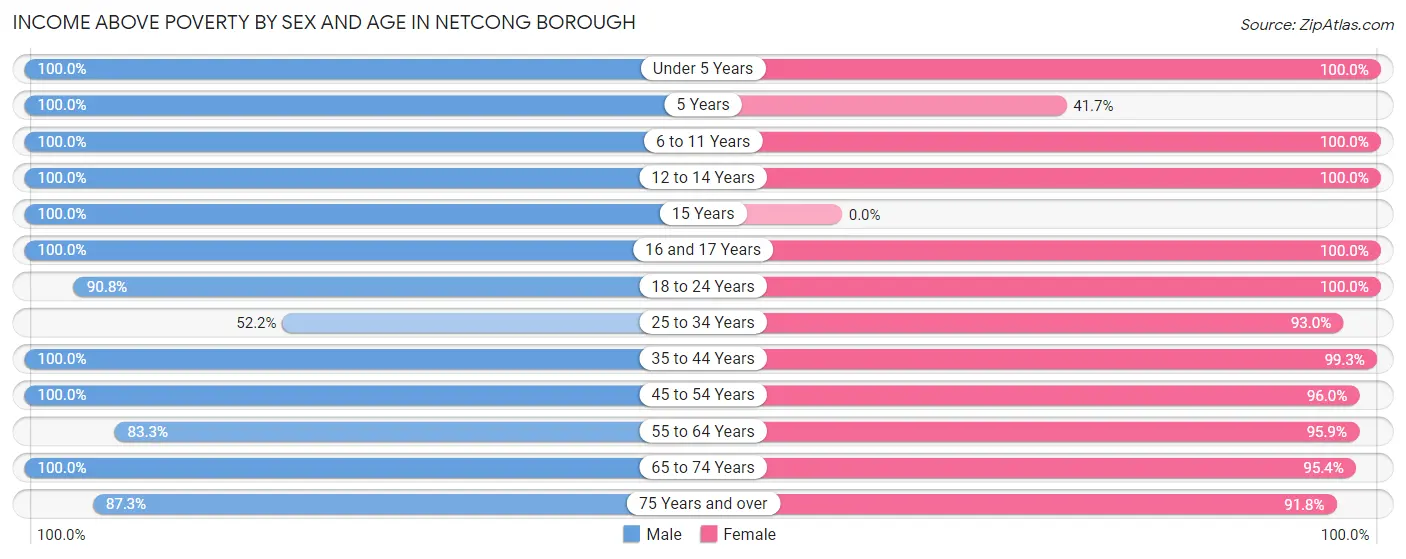
| Age Bracket | Male | Female |
| Under 5 Years | 66 (100.0%) | 129 (100.0%) |
| 5 Years | 21 (100.0%) | 15 (41.7%) |
| 6 to 11 Years | 60 (100.0%) | 54 (100.0%) |
| 12 to 14 Years | 49 (100.0%) | 17 (100.0%) |
| 15 Years | 20 (100.0%) | 0 (0.0%) |
| 16 and 17 Years | 19 (100.0%) | 47 (100.0%) |
| 18 to 24 Years | 119 (90.8%) | 123 (100.0%) |
| 25 to 34 Years | 182 (52.1%) | 200 (93.0%) |
| 35 to 44 Years | 287 (100.0%) | 138 (99.3%) |
| 45 to 54 Years | 143 (100.0%) | 216 (96.0%) |
| 55 to 64 Years | 269 (83.3%) | 496 (95.9%) |
| 65 to 74 Years | 105 (100.0%) | 185 (95.4%) |
| 75 Years and over | 62 (87.3%) | 123 (91.8%) |
| Total | 1,402 (85.3%) | 1,743 (95.3%) |
Income Below Poverty Among Married-Couple Families in Netcong borough
The poverty statistics for married-couple families in Netcong borough show that 4.1% or 24 of the total 588 families live below the poverty line. Families with no children have the highest poverty rate of 6.2%, comprising of 24 families. On the other hand, families with 1 or 2 children have the lowest poverty rate of 0.0%, which includes 0 families.
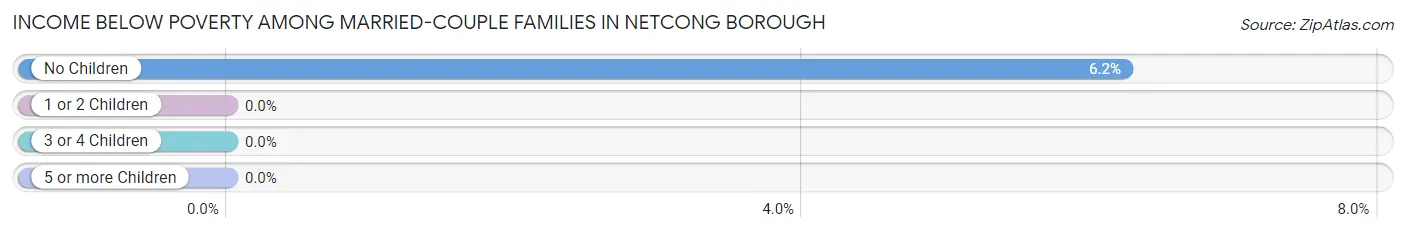
| Children | Above Poverty | Below Poverty |
| No Children | 361 (93.8%) | 24 (6.2%) |
| 1 or 2 Children | 176 (100.0%) | 0 (0.0%) |
| 3 or 4 Children | 27 (100.0%) | 0 (0.0%) |
| 5 or more Children | 0 (0.0%) | 0 (0.0%) |
| Total | 564 (95.9%) | 24 (4.1%) |
Income Below Poverty Among Single-Parent Households in Netcong borough
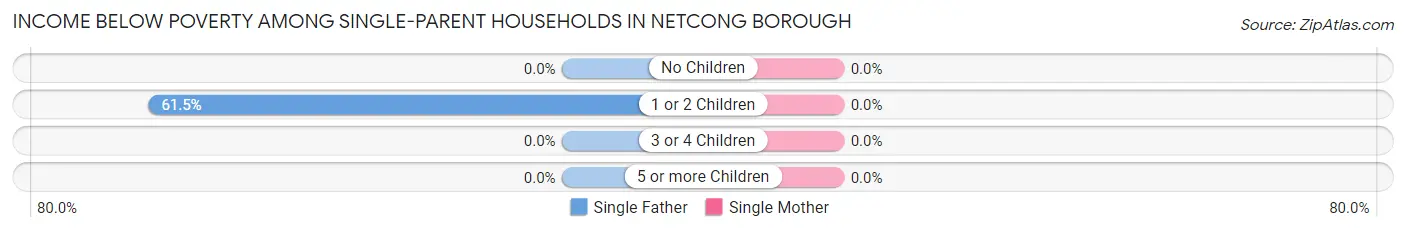
| Children | Single Father | Single Mother |
| No Children | 0 (0.0%) | 0 (0.0%) |
| 1 or 2 Children | 24 (61.5%) | 0 (0.0%) |
| 3 or 4 Children | 0 (0.0%) | 0 (0.0%) |
| 5 or more Children | 0 (0.0%) | 0 (0.0%) |
| Total | 24 (42.9%) | 0 (0.0%) |
Income Below Poverty Among Married-Couple vs Single-Parent Households in Netcong borough
The poverty data for Netcong borough shows that 24 of the married-couple family households (4.1%) and 24 of the single-parent households (7.5%) are living below the poverty level. Within the married-couple family households, those with no children have the highest poverty rate, with 24 households (6.2%) falling below the poverty line. Among the single-parent households, those with 1 or 2 children have the highest poverty rate, with 24 household (14.0%) living below poverty.
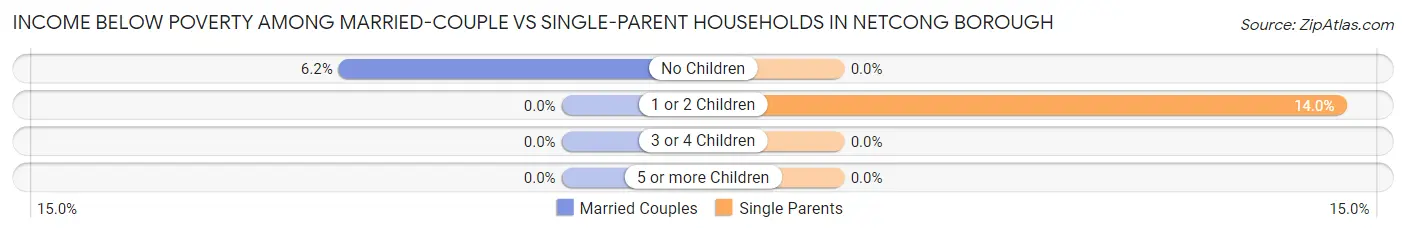
| Children | Married-Couple Families | Single-Parent Households |
| No Children | 24 (6.2%) | 0 (0.0%) |
| 1 or 2 Children | 0 (0.0%) | 24 (14.0%) |
| 3 or 4 Children | 0 (0.0%) | 0 (0.0%) |
| 5 or more Children | 0 (0.0%) | 0 (0.0%) |
| Total | 24 (4.1%) | 24 (7.5%) |
Race in Netcong borough
The most populous races in Netcong borough are White / Caucasian (2,868 | 82.3%), Hispanic or Latino (629 | 18.0%), and Black / African American (286 | 8.2%).
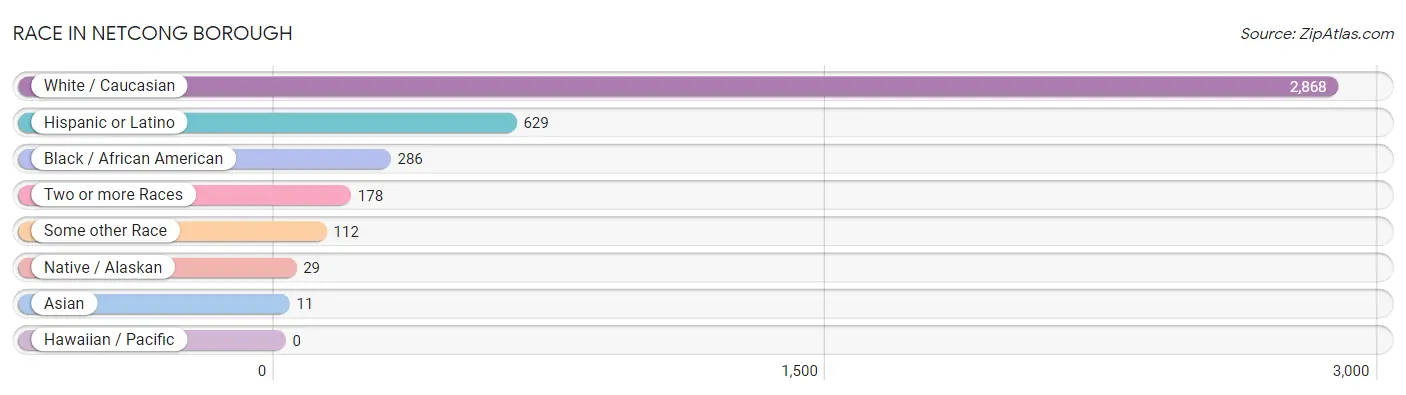
| Race | # Population | % Population |
| Asian | 11 | 0.3% |
| Black / African American | 286 | 8.2% |
| Hawaiian / Pacific | 0 | 0.0% |
| Hispanic or Latino | 629 | 18.0% |
| Native / Alaskan | 29 | 0.8% |
| White / Caucasian | 2,868 | 82.3% |
| Two or more Races | 178 | 5.1% |
| Some other Race | 112 | 3.2% |
| Total | 3,484 | 100.0% |
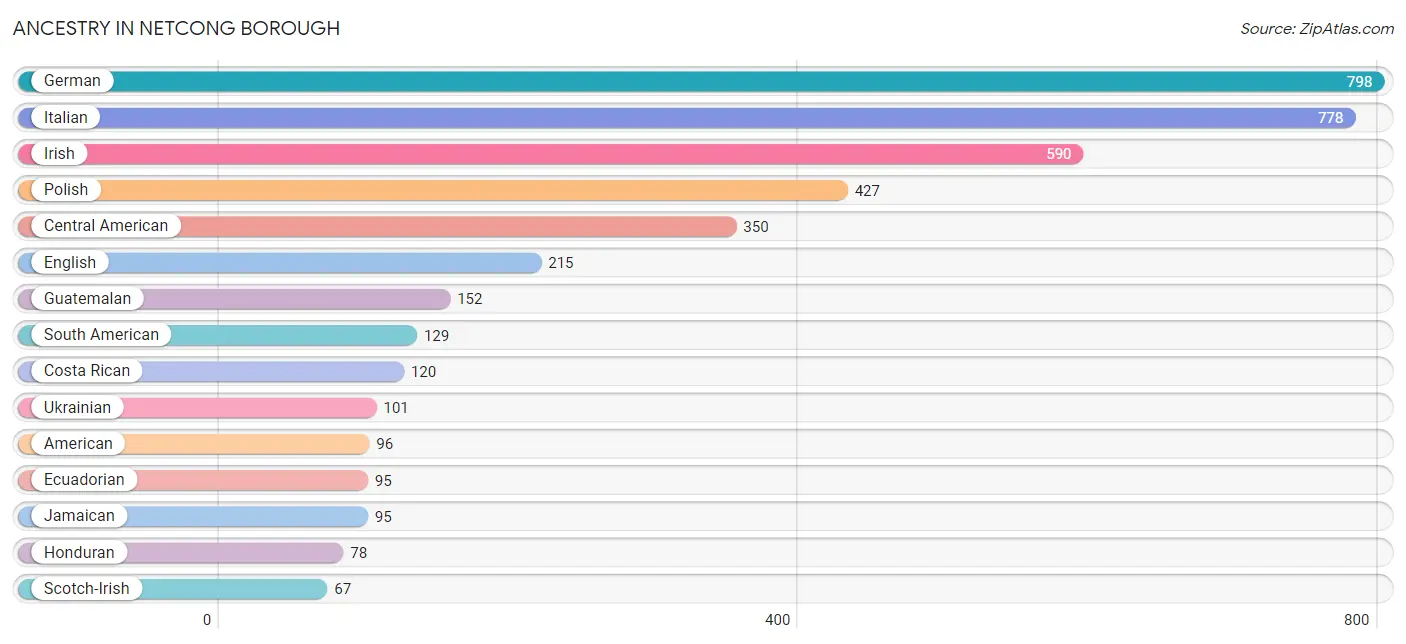
Ancestry in Netcong borough
The most populous ancestries reported in Netcong borough are German (798 | 22.9%), Italian (778 | 22.3%), Irish (590 | 16.9%), Polish (427 | 12.3%), and Central American (350 | 10.1%), together accounting for 84.5% of all Netcong borough residents.
| Ancestry | # Population | % Population |
| African | 22 | 0.6% |
| American | 96 | 2.8% |
| Arab | 11 | 0.3% |
| Argentinean | 15 | 0.4% |
| Armenian | 36 | 1.0% |
| Blackfeet | 28 | 0.8% |
| Burmese | 1 | 0.0% |
| Cape Verdean | 18 | 0.5% |
| Central American | 350 | 10.1% |
| Cherokee | 24 | 0.7% |
| Costa Rican | 120 | 3.4% |
| Crow | 24 | 0.7% |
| Czech | 46 | 1.3% |
| Dominican | 49 | 1.4% |
| Dutch | 61 | 1.8% |
| Ecuadorian | 95 | 2.7% |
| English | 215 | 6.2% |
| European | 8 | 0.2% |
| French | 15 | 0.4% |
| French Canadian | 15 | 0.4% |
| German | 798 | 22.9% |
| Greek | 19 | 0.5% |
| Guatemalan | 152 | 4.4% |
| Haitian | 25 | 0.7% |
| Honduran | 78 | 2.2% |
| Houma | 25 | 0.7% |
| Hungarian | 51 | 1.5% |
| Indian (Asian) | 10 | 0.3% |
| Irish | 590 | 16.9% |
| Israeli | 1 | 0.0% |
| Italian | 778 | 22.3% |
| Jamaican | 95 | 2.7% |
| Mexican | 13 | 0.4% |
| Norwegian | 12 | 0.3% |
| Peruvian | 19 | 0.5% |
| Polish | 427 | 12.3% |
| Puerto Rican | 54 | 1.5% |
| Russian | 32 | 0.9% |
| Scandinavian | 34 | 1.0% |
| Scotch-Irish | 67 | 1.9% |
| Scottish | 32 | 0.9% |
| Seminole | 9 | 0.3% |
| Slovak | 5 | 0.1% |
| South American | 129 | 3.7% |
| Spaniard | 34 | 1.0% |
| Subsaharan African | 40 | 1.1% |
| Swedish | 46 | 1.3% |
| Trinidadian and Tobagonian | 53 | 1.5% |
| Turkish | 46 | 1.3% |
| Ukrainian | 101 | 2.9% |
| Welsh | 62 | 1.8% | View All 51 Rows |
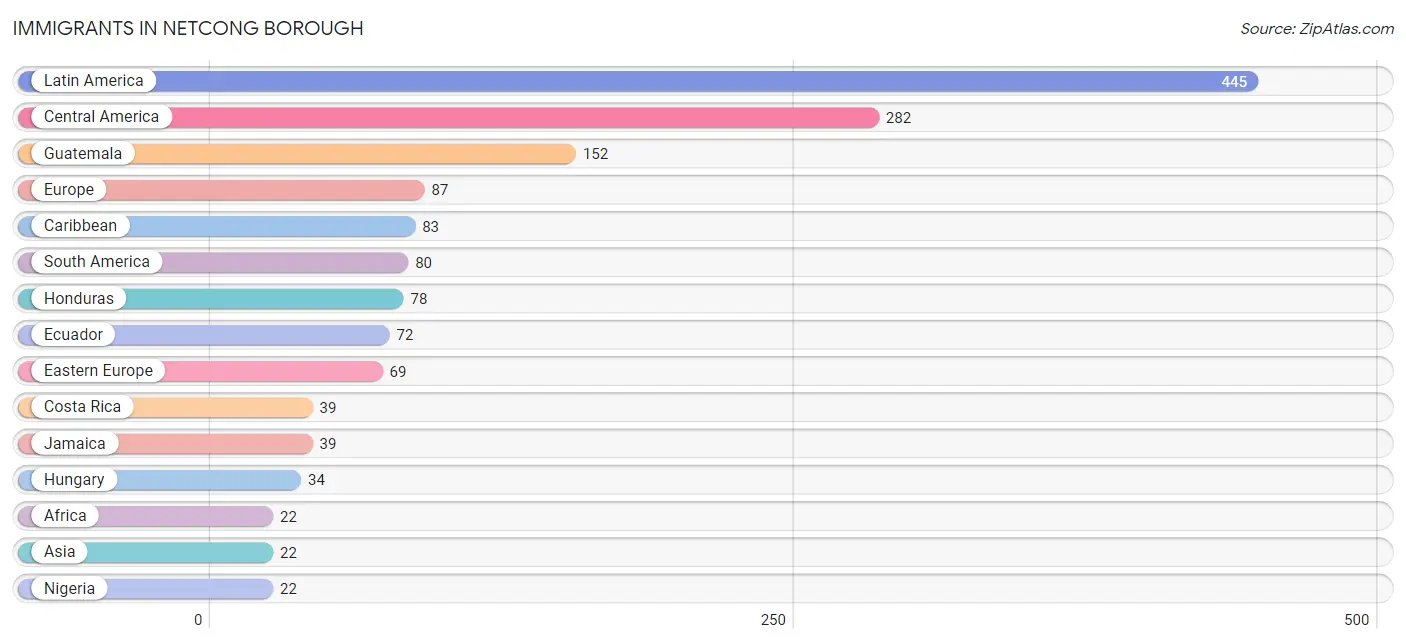
Immigrants in Netcong borough
The most numerous immigrant groups reported in Netcong borough came from Latin America (445 | 12.8%), Central America (282 | 8.1%), Guatemala (152 | 4.4%), Europe (87 | 2.5%), and Caribbean (83 | 2.4%), together accounting for 30.1% of all Netcong borough residents.
| Immigration Origin | # Population | % Population |
| Africa | 22 | 0.6% |
| Asia | 22 | 0.6% |
| Caribbean | 83 | 2.4% |
| Central America | 282 | 8.1% |
| China | 10 | 0.3% |
| Costa Rica | 39 | 1.1% |
| Dominican Republic | 12 | 0.3% |
| Eastern Asia | 11 | 0.3% |
| Eastern Europe | 69 | 2.0% |
| Ecuador | 72 | 2.1% |
| Europe | 87 | 2.5% |
| Germany | 10 | 0.3% |
| Guatemala | 152 | 4.4% |
| Haiti | 14 | 0.4% |
| Honduras | 78 | 2.2% |
| Hungary | 34 | 1.0% |
| Iran | 11 | 0.3% |
| Jamaica | 39 | 1.1% |
| Korea | 1 | 0.0% |
| Latin America | 445 | 12.8% |
| Mexico | 13 | 0.4% |
| Netherlands | 8 | 0.2% |
| Nigeria | 22 | 0.6% |
| Peru | 8 | 0.2% |
| Poland | 18 | 0.5% |
| Russia | 17 | 0.5% |
| South America | 80 | 2.3% |
| South Central Asia | 11 | 0.3% |
| Trinidad and Tobago | 18 | 0.5% |
| Western Africa | 22 | 0.6% |
| Western Europe | 18 | 0.5% | View All 31 Rows |
Sex and Age in Netcong borough
Sex and Age in Netcong borough
The most populous age groups in Netcong borough are 30 to 34 Years (236 | 14.3%) for men and 60 to 64 Years (297 | 16.2%) for women.
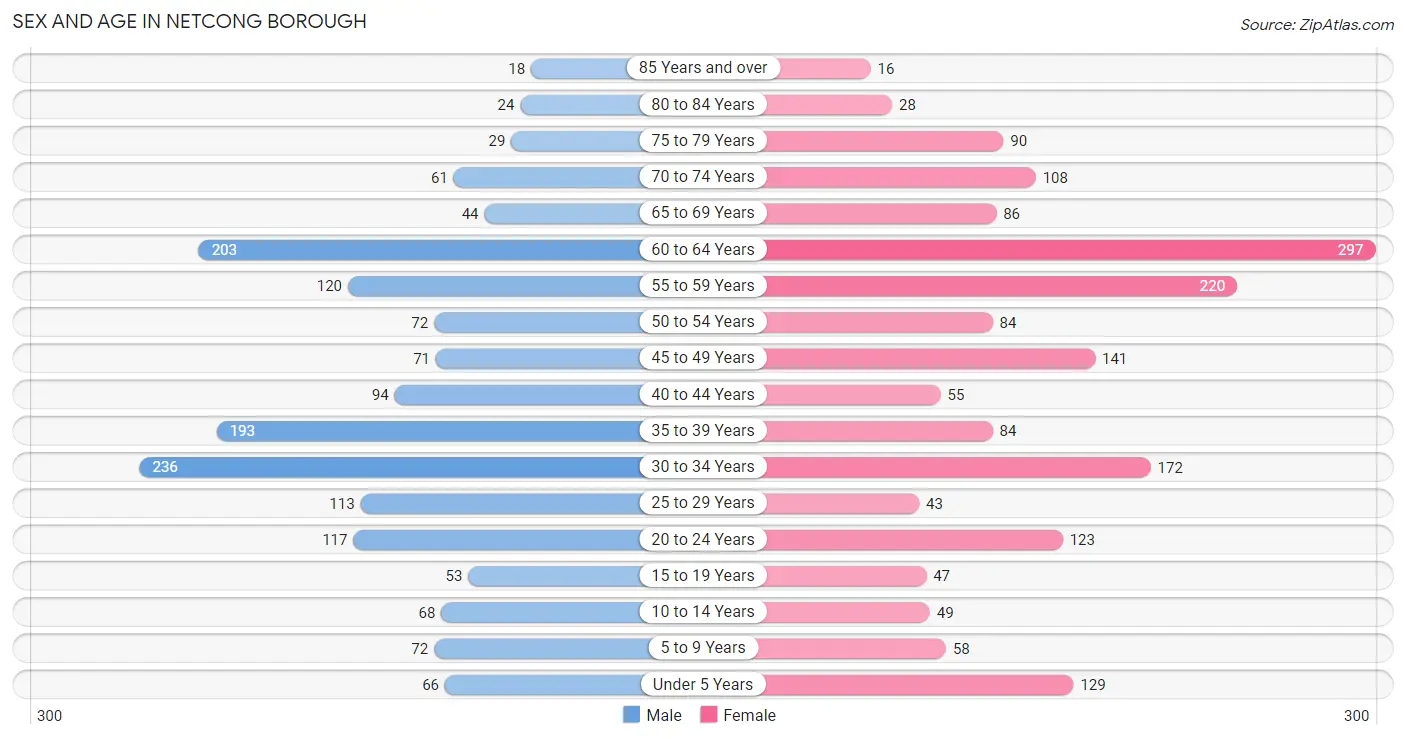
| Age Bracket | Male | Female |
| Under 5 Years | 66 (4.0%) | 129 (7.0%) |
| 5 to 9 Years | 72 (4.3%) | 58 (3.2%) |
| 10 to 14 Years | 68 (4.1%) | 49 (2.7%) |
| 15 to 19 Years | 53 (3.2%) | 47 (2.6%) |
| 20 to 24 Years | 117 (7.1%) | 123 (6.7%) |
| 25 to 29 Years | 113 (6.8%) | 43 (2.4%) |
| 30 to 34 Years | 236 (14.3%) | 172 (9.4%) |
| 35 to 39 Years | 193 (11.7%) | 84 (4.6%) |
| 40 to 44 Years | 94 (5.7%) | 55 (3.0%) |
| 45 to 49 Years | 71 (4.3%) | 141 (7.7%) |
| 50 to 54 Years | 72 (4.3%) | 84 (4.6%) |
| 55 to 59 Years | 120 (7.3%) | 220 (12.0%) |
| 60 to 64 Years | 203 (12.3%) | 297 (16.2%) |
| 65 to 69 Years | 44 (2.7%) | 86 (4.7%) |
| 70 to 74 Years | 61 (3.7%) | 108 (5.9%) |
| 75 to 79 Years | 29 (1.8%) | 90 (4.9%) |
| 80 to 84 Years | 24 (1.5%) | 28 (1.5%) |
| 85 Years and over | 18 (1.1%) | 16 (0.9%) |
| Total | 1,654 (100.0%) | 1,830 (100.0%) |
Families and Households in Netcong borough
Median Family Size in Netcong borough
The median family size in Netcong borough is 2.49 persons per family, with married-couple families (588 | 64.8%) accounting for the largest median family size of 2.58 persons per family. On the other hand, single male/father families (56 | 6.2%) represent the smallest median family size with 2.21 persons per family.
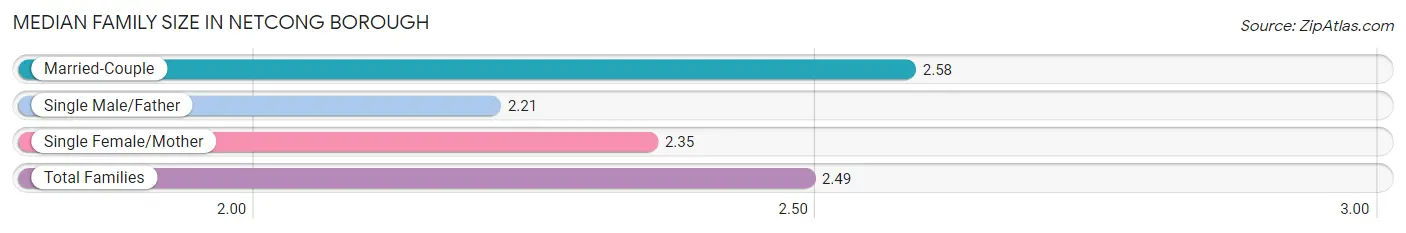
| Family Type | # Families | Family Size |
| Married-Couple | 588 (64.8%) | 2.58 |
| Single Male/Father | 56 (6.2%) | 2.21 |
| Single Female/Mother | 263 (29.0%) | 2.35 |
| Total Families | 907 (100.0%) | 2.49 |
Median Household Size in Netcong borough
The median household size in Netcong borough is 1.86 persons per household, with single male/father households (56 | 3.0%) accounting for the largest median household size of 3.36 persons per household. non-family households (963 | 51.5%) represent the smallest median household size with 1.15 persons per household.
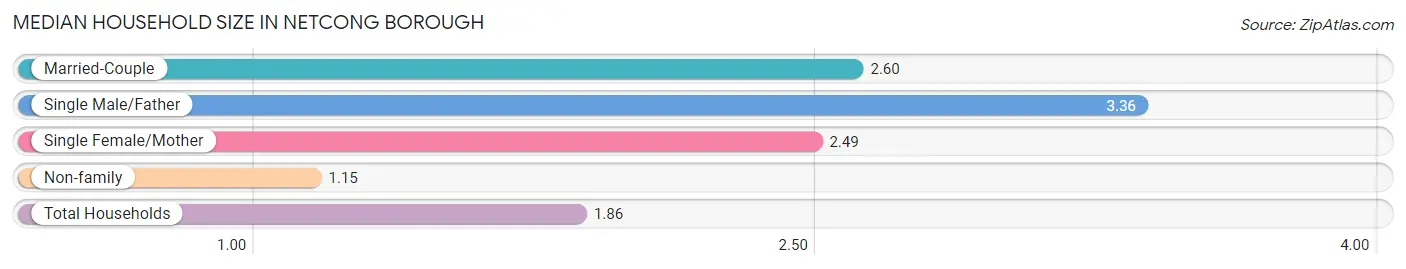
| Household Type | # Households | Household Size |
| Married-Couple | 588 (31.4%) | 2.60 |
| Single Male/Father | 56 (3.0%) | 3.36 |
| Single Female/Mother | 263 (14.1%) | 2.49 |
| Non-family | 963 (51.5%) | 1.15 |
| Total Households | 1,870 (100.0%) | 1.86 |
Household Size by Marriage Status in Netcong borough
Out of a total of 1,870 households in Netcong borough, 907 (48.5%) are family households, while 963 (51.5%) are nonfamily households. The most numerous type of family households are 2-person households, comprising 554, and the most common type of nonfamily households are 1-person households, comprising 810.
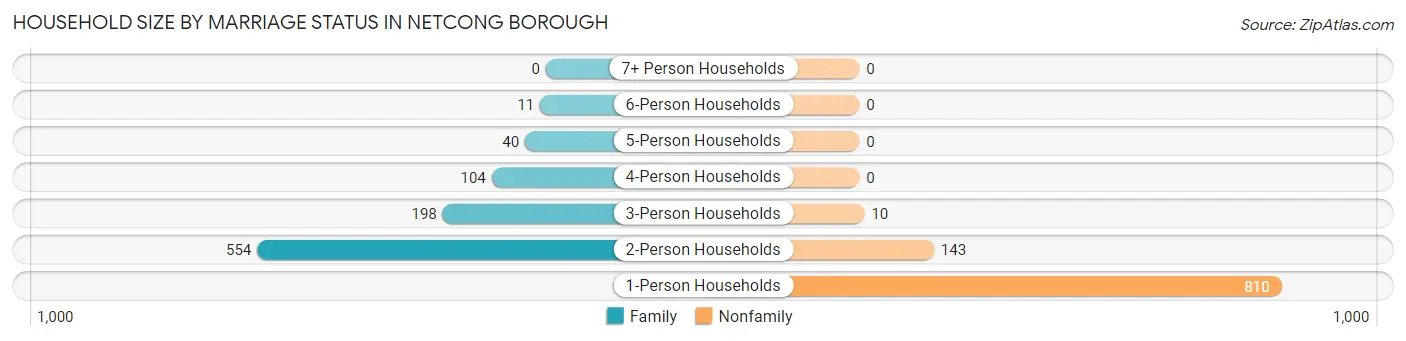
| Household Size | Family Households | Nonfamily Households |
| 1-Person Households | - | 810 (43.3%) |
| 2-Person Households | 554 (29.6%) | 143 (7.6%) |
| 3-Person Households | 198 (10.6%) | 10 (0.5%) |
| 4-Person Households | 104 (5.6%) | 0 (0.0%) |
| 5-Person Households | 40 (2.1%) | 0 (0.0%) |
| 6-Person Households | 11 (0.6%) | 0 (0.0%) |
| 7+ Person Households | 0 (0.0%) | 0 (0.0%) |
| Total | 907 (48.5%) | 963 (51.5%) |
Female Fertility in Netcong borough
Fertility by Age in Netcong borough
Average fertility rate in Netcong borough is 86.0 births per 1,000 women. Women in the age bracket of 20 to 34 years have the highest fertility rate with 95.0 births per 1,000 women. Women in the age bracket of 20 to 34 years acount for 54.2% of all women with births.
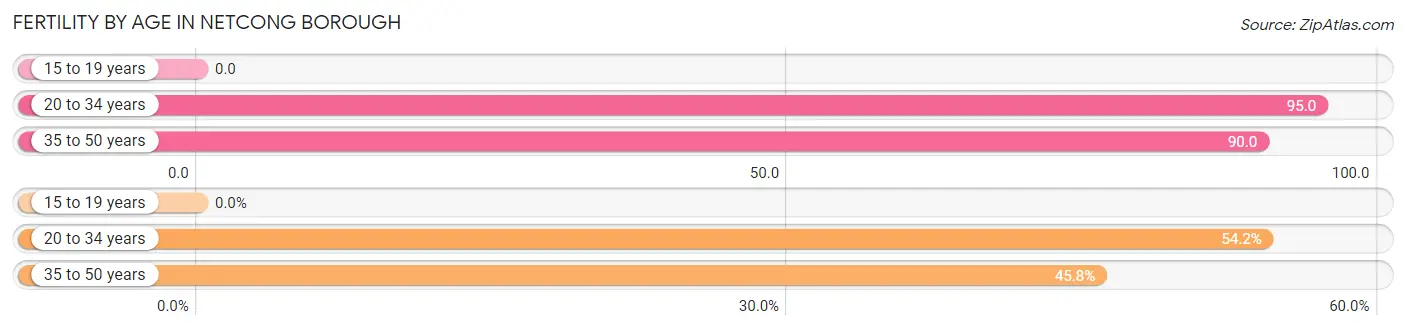
| Age Bracket | Women with Births | Births / 1,000 Women |
| 15 to 19 years | 0 (0.0%) | 0.0 |
| 20 to 34 years | 32 (54.2%) | 95.0 |
| 35 to 50 years | 27 (45.8%) | 90.0 |
| Total | 59 (100.0%) | 86.0 |
Fertility by Age by Marriage Status in Netcong borough
67.8% of women with births (59) in Netcong borough are married. The highest percentage of unmarried women with births falls into 20 to 34 years age bracket with 59.4% of them unmarried at the time of birth, while the lowest percentage of unmarried women with births belong to 35 to 50 years age bracket with 0.0% of them unmarried.
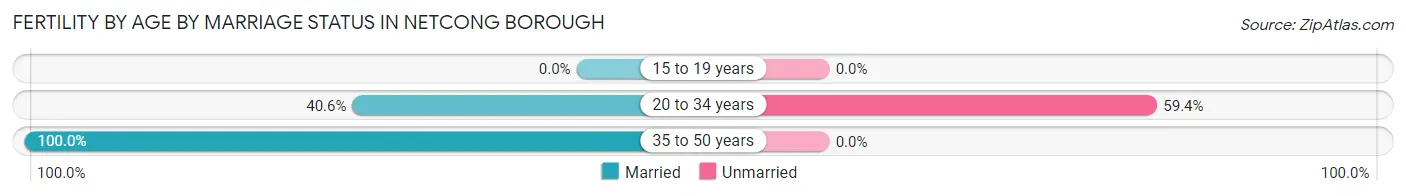
| Age Bracket | Married | Unmarried |
| 15 to 19 years | 0 (0.0%) | 0 (0.0%) |
| 20 to 34 years | 13 (40.6%) | 19 (59.4%) |
| 35 to 50 years | 27 (100.0%) | 0 (0.0%) |
| Total | 40 (67.8%) | 19 (32.2%) |
Fertility by Education in Netcong borough
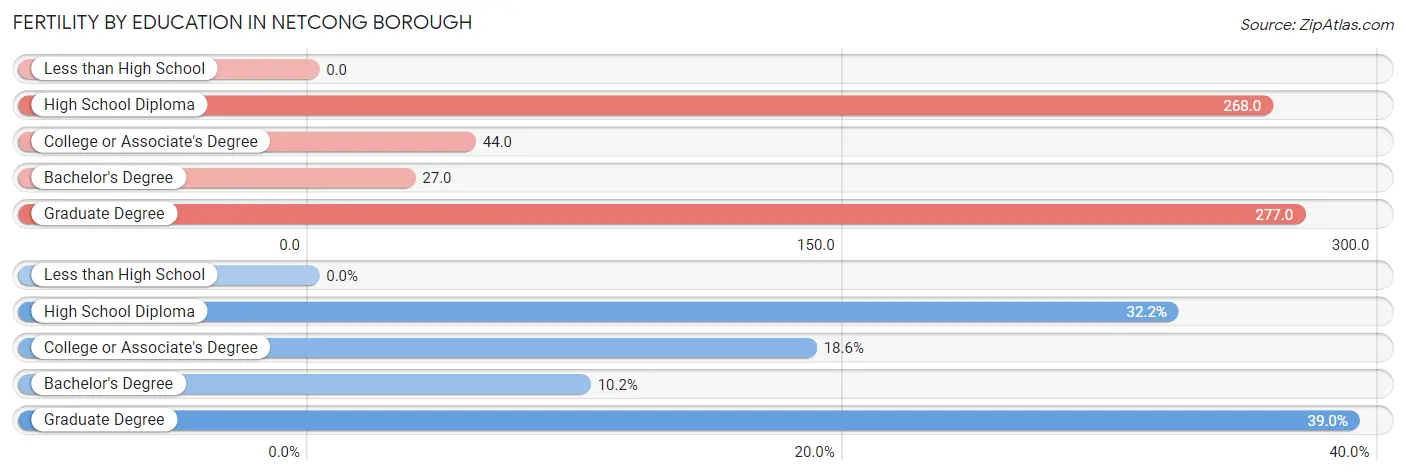
| Educational Attainment | Women with Births | Births / 1,000 Women |
| Less than High School | 0 (0.0%) | 0.0 |
| High School Diploma | 19 (32.2%) | 268.0 |
| College or Associate's Degree | 11 (18.6%) | 44.0 |
| Bachelor's Degree | 6 (10.2%) | 27.0 |
| Graduate Degree | 23 (39.0%) | 277.0 |
| Total | 59 (100.0%) | 86.0 |
Fertility by Education by Marriage Status in Netcong borough
32.2% of women with births in Netcong borough are unmarried. Women with the educational attainment of college or associate's degree are most likely to be married with 100.0% of them married at childbirth, while women with the educational attainment of high school diploma are least likely to be married with 100.0% of them unmarried at childbirth.
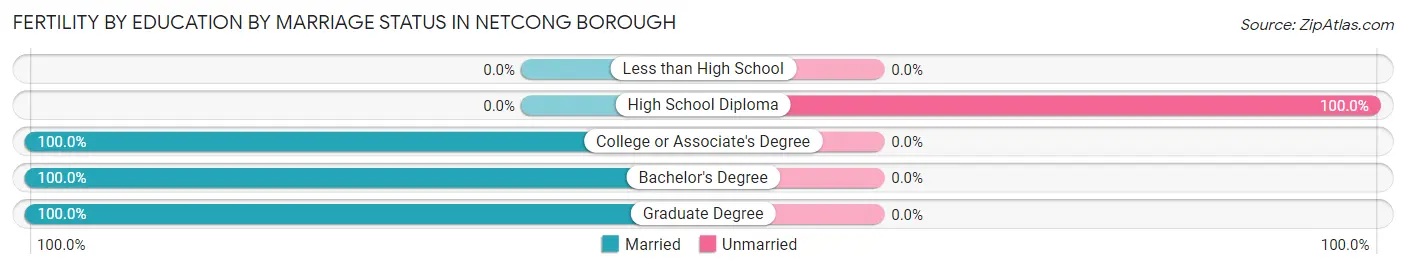
| Educational Attainment | Married | Unmarried |
| Less than High School | 0 (0.0%) | 0 (0.0%) |
| High School Diploma | 0 (0.0%) | 19 (100.0%) |
| College or Associate's Degree | 11 (100.0%) | 0 (0.0%) |
| Bachelor's Degree | 6 (100.0%) | 0 (0.0%) |
| Graduate Degree | 23 (100.0%) | 0 (0.0%) |
| Total | 40 (67.8%) | 19 (32.2%) |
Employment Characteristics in Netcong borough
Employment by Class of Employer in Netcong borough
Among the 1,928 employed individuals in Netcong borough, private company employees (1,389 | 72.0%), local government employees (164 | 8.5%), and not-for-profit organizations (152 | 7.9%) make up the most common classes of employment.
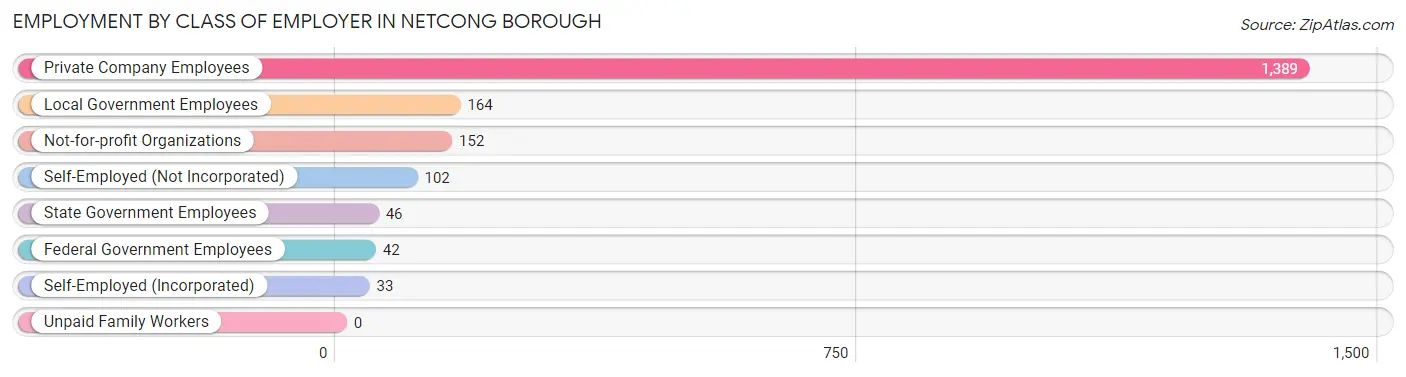
| Employer Class | # Employees | % Employees |
| Private Company Employees | 1,389 | 72.0% |
| Self-Employed (Incorporated) | 33 | 1.7% |
| Self-Employed (Not Incorporated) | 102 | 5.3% |
| Not-for-profit Organizations | 152 | 7.9% |
| Local Government Employees | 164 | 8.5% |
| State Government Employees | 46 | 2.4% |
| Federal Government Employees | 42 | 2.2% |
| Unpaid Family Workers | 0 | 0.0% |
| Total | 1,928 | 100.0% |
Employment Status by Age in Netcong borough
According to the labor force statistics for Netcong borough, out of the total population over 16 years of age (3,022), 70.6% or 2,134 individuals are in the labor force, with 2.1% or 45 of them unemployed. The age group with the highest labor force participation rate is 35 to 44 years, with 97.2% or 414 individuals in the labor force. Within the labor force, the 55 to 59 years age range has the highest percentage of unemployed individuals, with 10.6% or 24 of them being unemployed.
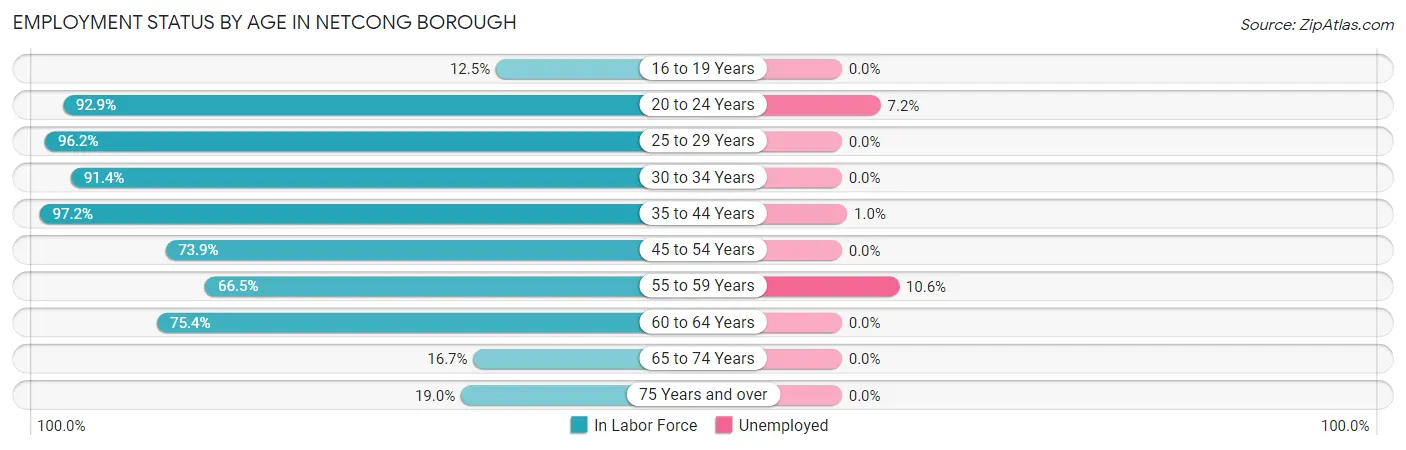
| Age Bracket | In Labor Force | Unemployed |
| 16 to 19 Years | 10 (12.5%) | 0 (0.0%) |
| 20 to 24 Years | 223 (92.9%) | 16 (7.2%) |
| 25 to 29 Years | 150 (96.2%) | 0 (0.0%) |
| 30 to 34 Years | 373 (91.4%) | 0 (0.0%) |
| 35 to 44 Years | 414 (97.2%) | 4 (1.0%) |
| 45 to 54 Years | 272 (73.9%) | 0 (0.0%) |
| 55 to 59 Years | 226 (66.5%) | 24 (10.6%) |
| 60 to 64 Years | 377 (75.4%) | 0 (0.0%) |
| 65 to 74 Years | 50 (16.7%) | 0 (0.0%) |
| 75 Years and over | 39 (19.0%) | 0 (0.0%) |
| Total | 2,134 (70.6%) | 45 (2.1%) |
Employment Status by Educational Attainment in Netcong borough
According to labor force statistics for Netcong borough, 82.4% of individuals (1,811) out of the total population between 25 and 64 years of age (2,198) are in the labor force, with 1.5% or 27 of them being unemployed. The group with the highest labor force participation rate are those with the educational attainment of bachelor's degree or higher, with 89.5% or 814 individuals in the labor force. Within the labor force, individuals with less than high school education have the highest percentage of unemployment, with 18.8% or 24 of them being unemployed.
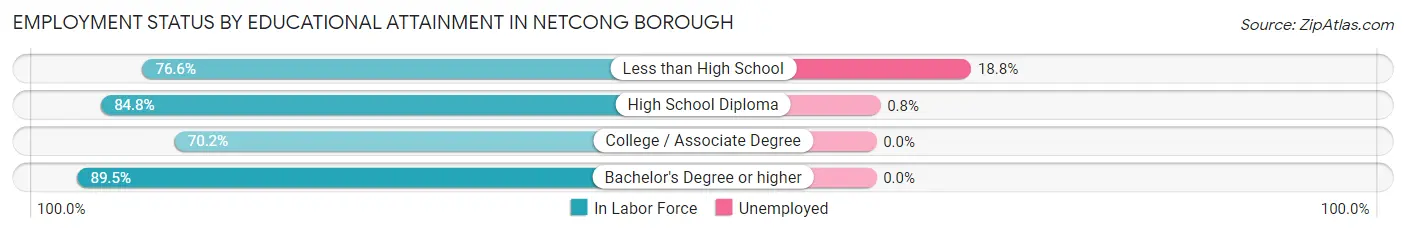
| Educational Attainment | In Labor Force | Unemployed |
| Less than High School | 128 (76.6%) | 31 (18.8%) |
| High School Diploma | 479 (84.8%) | 5 (0.8%) |
| College / Associate Degree | 391 (70.2%) | 0 (0.0%) |
| Bachelor's Degree or higher | 814 (89.5%) | 0 (0.0%) |
| Total | 1,811 (82.4%) | 33 (1.5%) |
Employment Occupations by Sex in Netcong borough
Management, Business, Science and Arts Occupations
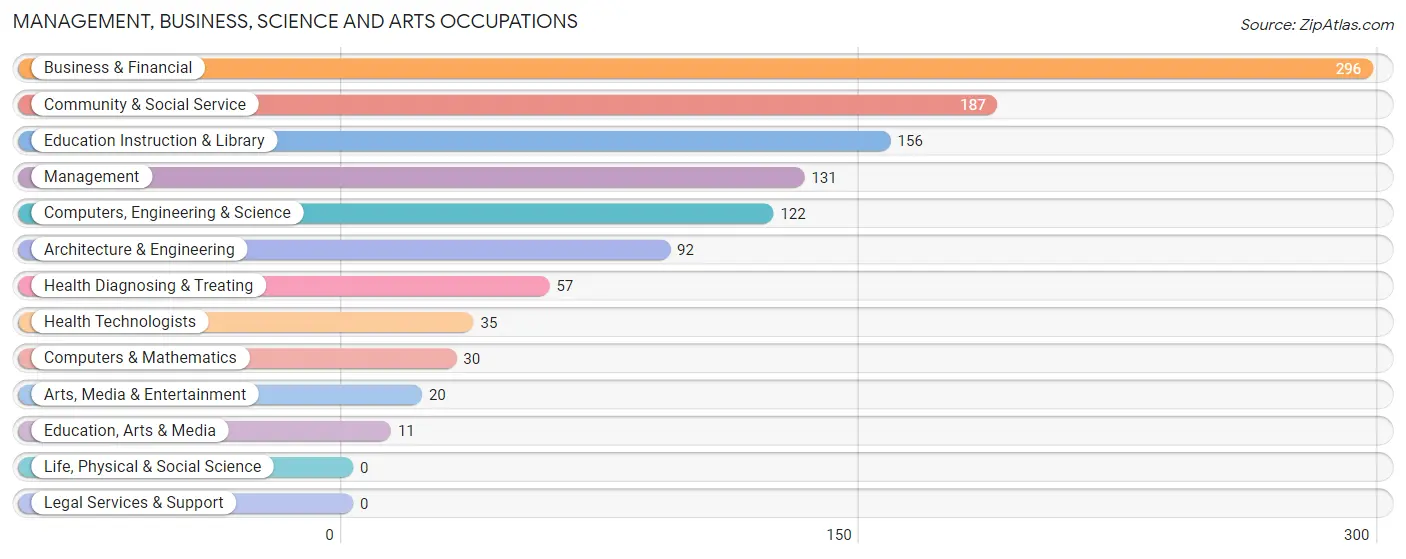
The most common Management, Business, Science and Arts occupations in Netcong borough are Business & Financial (296 | 14.2%), Community & Social Service (187 | 8.9%), Education Instruction & Library (156 | 7.5%), Management (131 | 6.3%), and Computers, Engineering & Science (122 | 5.8%).
Management, Business, Science and Arts Occupations by Sex
Within the Management, Business, Science and Arts occupations in Netcong borough, the most male-oriented occupations are Arts, Media & Entertainment (100.0%), Management (87.0%), and Architecture & Engineering (69.6%), while the most female-oriented occupations are Health Diagnosing & Treating (100.0%), Health Technologists (100.0%), and Education, Arts & Media (90.9%).
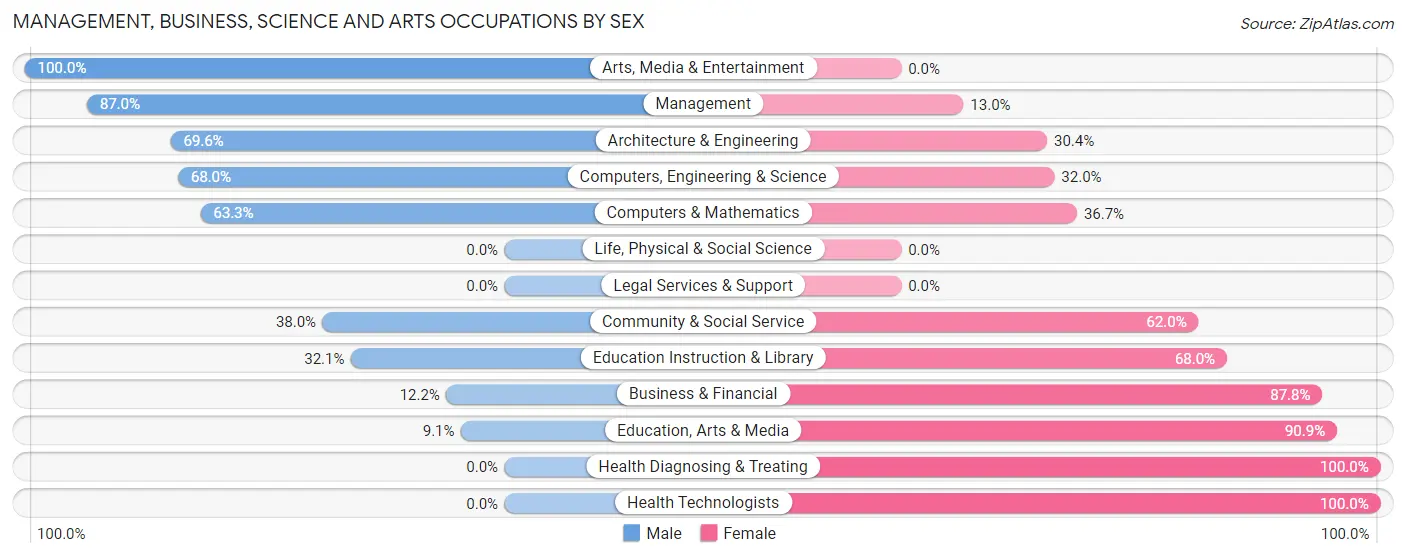
| Occupation | Male | Female |
| Management | 114 (87.0%) | 17 (13.0%) |
| Business & Financial | 36 (12.2%) | 260 (87.8%) |
| Computers, Engineering & Science | 83 (68.0%) | 39 (32.0%) |
| Computers & Mathematics | 19 (63.3%) | 11 (36.7%) |
| Architecture & Engineering | 64 (69.6%) | 28 (30.4%) |
| Life, Physical & Social Science | 0 (0.0%) | 0 (0.0%) |
| Community & Social Service | 71 (38.0%) | 116 (62.0%) |
| Education, Arts & Media | 1 (9.1%) | 10 (90.9%) |
| Legal Services & Support | 0 (0.0%) | 0 (0.0%) |
| Education Instruction & Library | 50 (32.1%) | 106 (67.9%) |
| Arts, Media & Entertainment | 20 (100.0%) | 0 (0.0%) |
| Health Diagnosing & Treating | 0 (0.0%) | 57 (100.0%) |
| Health Technologists | 0 (0.0%) | 35 (100.0%) |
| Total (Category) | 304 (38.3%) | 489 (61.7%) |
| Total (Overall) | 1,075 (51.4%) | 1,015 (48.6%) |
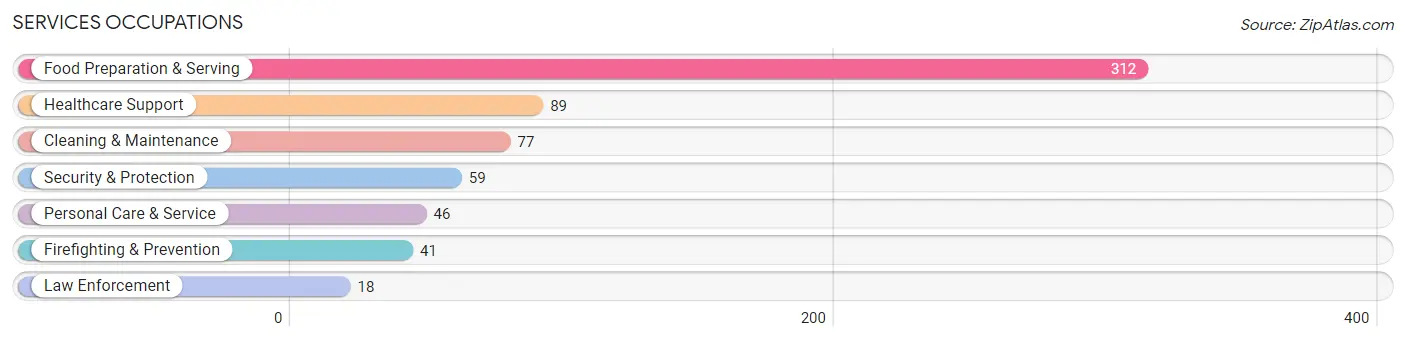
Services Occupations
The most common Services occupations in Netcong borough are Food Preparation & Serving (312 | 14.9%), Healthcare Support (89 | 4.3%), Cleaning & Maintenance (77 | 3.7%), Security & Protection (59 | 2.8%), and Personal Care & Service (46 | 2.2%).
Services Occupations by Sex
Within the Services occupations in Netcong borough, the most male-oriented occupations are Security & Protection (100.0%), Firefighting & Prevention (100.0%), and Law Enforcement (100.0%), while the most female-oriented occupations are Healthcare Support (100.0%), Personal Care & Service (100.0%), and Food Preparation & Serving (28.2%).
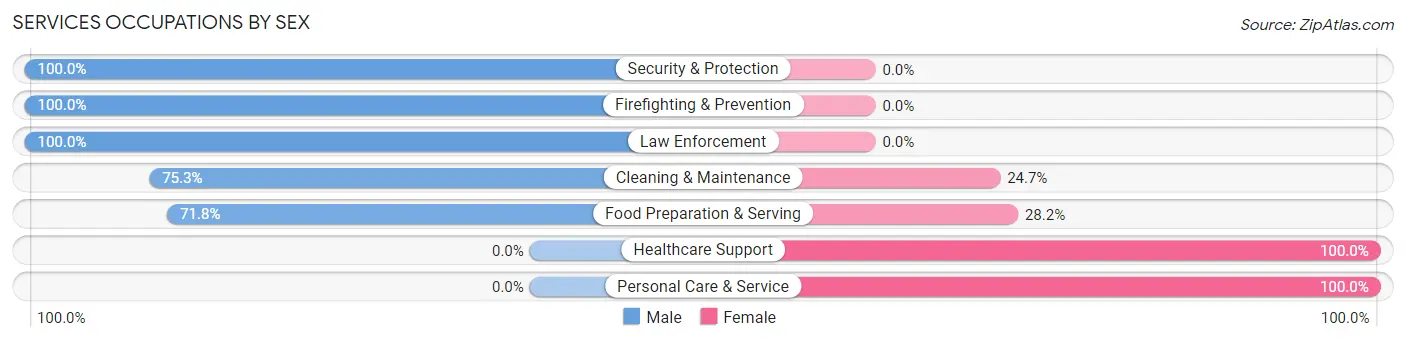
| Occupation | Male | Female |
| Healthcare Support | 0 (0.0%) | 89 (100.0%) |
| Security & Protection | 59 (100.0%) | 0 (0.0%) |
| Firefighting & Prevention | 41 (100.0%) | 0 (0.0%) |
| Law Enforcement | 18 (100.0%) | 0 (0.0%) |
| Food Preparation & Serving | 224 (71.8%) | 88 (28.2%) |
| Cleaning & Maintenance | 58 (75.3%) | 19 (24.7%) |
| Personal Care & Service | 0 (0.0%) | 46 (100.0%) |
| Total (Category) | 341 (58.5%) | 242 (41.5%) |
| Total (Overall) | 1,075 (51.4%) | 1,015 (48.6%) |
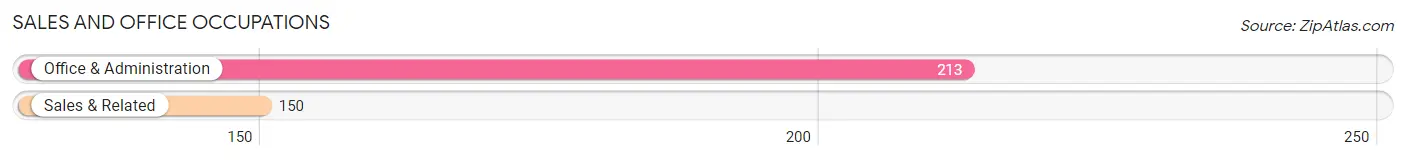
Sales and Office Occupations
The most common Sales and Office occupations in Netcong borough are Office & Administration (213 | 10.2%), and Sales & Related (150 | 7.2%).
Sales and Office Occupations by Sex
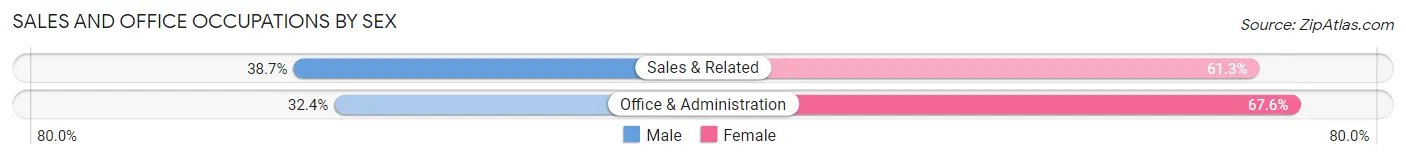
| Occupation | Male | Female |
| Sales & Related | 58 (38.7%) | 92 (61.3%) |
| Office & Administration | 69 (32.4%) | 144 (67.6%) |
| Total (Category) | 127 (35.0%) | 236 (65.0%) |
| Total (Overall) | 1,075 (51.4%) | 1,015 (48.6%) |
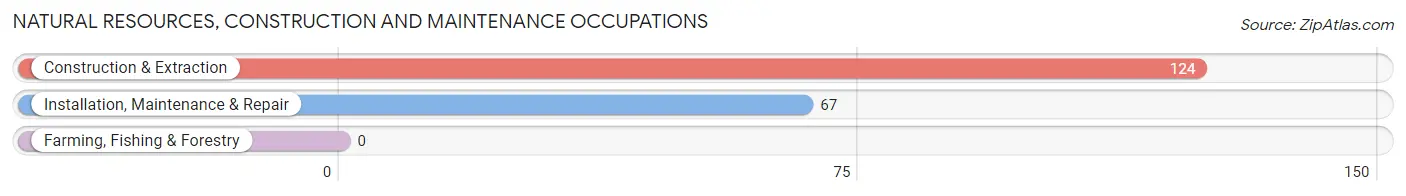
Natural Resources, Construction and Maintenance Occupations
The most common Natural Resources, Construction and Maintenance occupations in Netcong borough are Construction & Extraction (124 | 5.9%), and Installation, Maintenance & Repair (67 | 3.2%).
Natural Resources, Construction and Maintenance Occupations by Sex
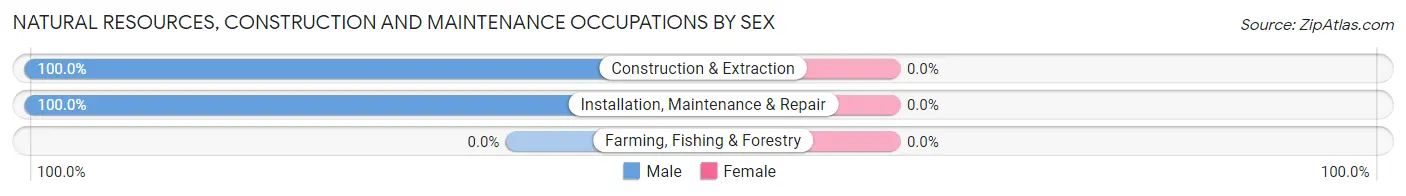
| Occupation | Male | Female |
| Farming, Fishing & Forestry | 0 (0.0%) | 0 (0.0%) |
| Construction & Extraction | 124 (100.0%) | 0 (0.0%) |
| Installation, Maintenance & Repair | 67 (100.0%) | 0 (0.0%) |
| Total (Category) | 191 (100.0%) | 0 (0.0%) |
| Total (Overall) | 1,075 (51.4%) | 1,015 (48.6%) |
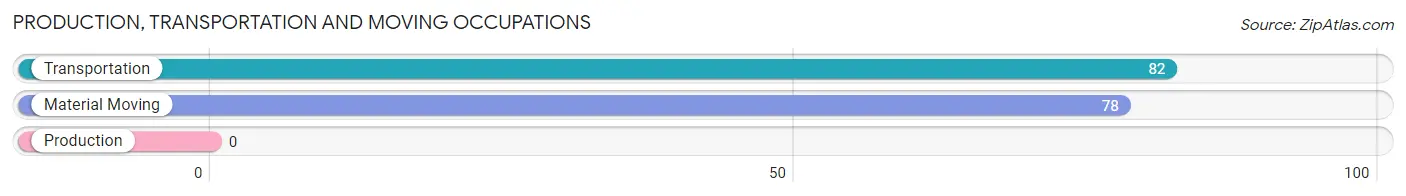
Production, Transportation and Moving Occupations
The most common Production, Transportation and Moving occupations in Netcong borough are Transportation (82 | 3.9%), and Material Moving (78 | 3.7%).
Production, Transportation and Moving Occupations by Sex
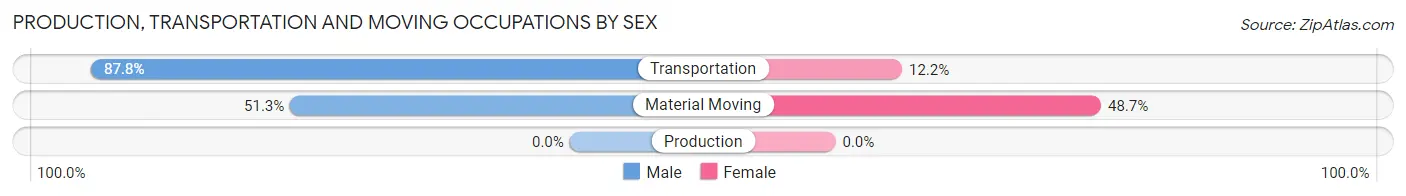
| Occupation | Male | Female |
| Production | 0 (0.0%) | 0 (0.0%) |
| Transportation | 72 (87.8%) | 10 (12.2%) |
| Material Moving | 40 (51.3%) | 38 (48.7%) |
| Total (Category) | 112 (70.0%) | 48 (30.0%) |
| Total (Overall) | 1,075 (51.4%) | 1,015 (48.6%) |
Employment Industries by Sex in Netcong borough
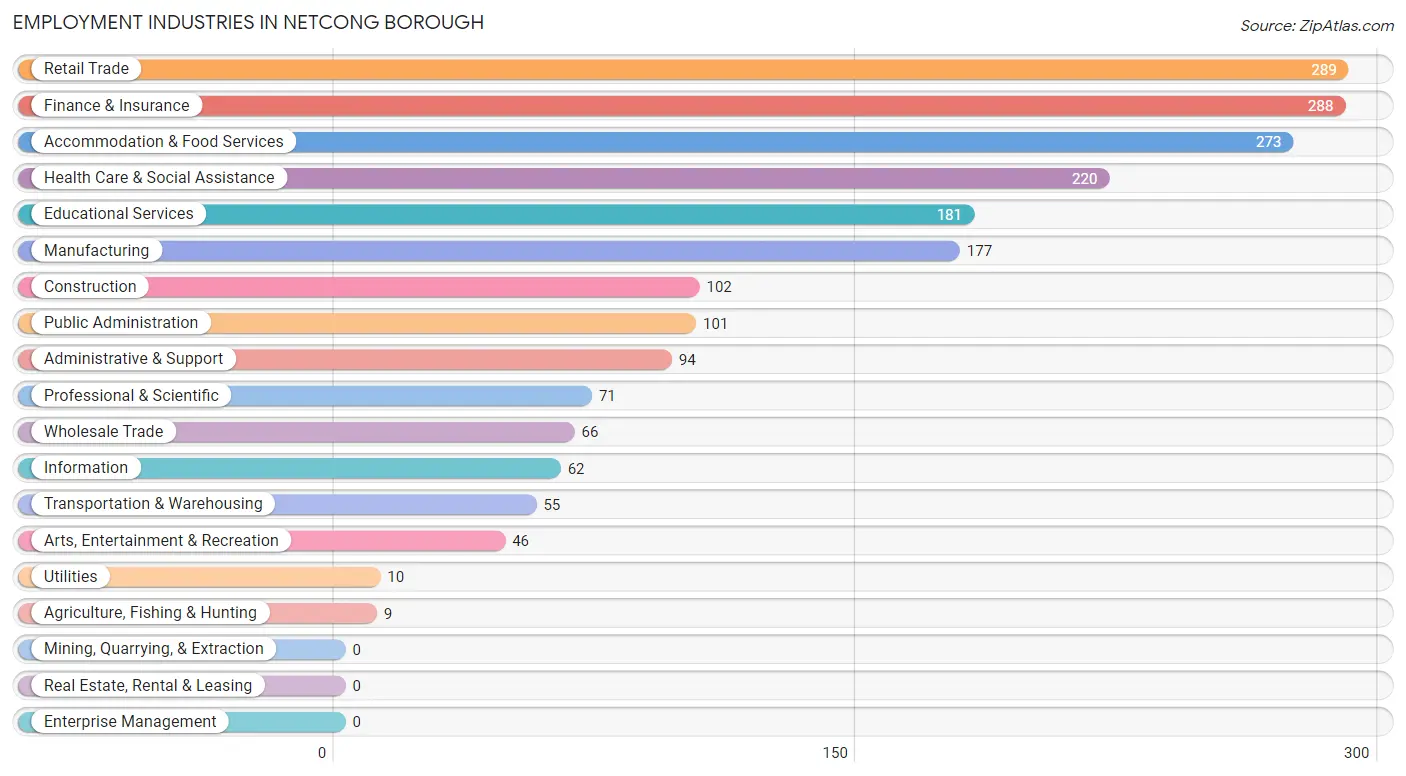
Employment Industries in Netcong borough
The major employment industries in Netcong borough include Retail Trade (289 | 13.8%), Finance & Insurance (288 | 13.8%), Accommodation & Food Services (273 | 13.1%), Health Care & Social Assistance (220 | 10.5%), and Educational Services (181 | 8.7%).
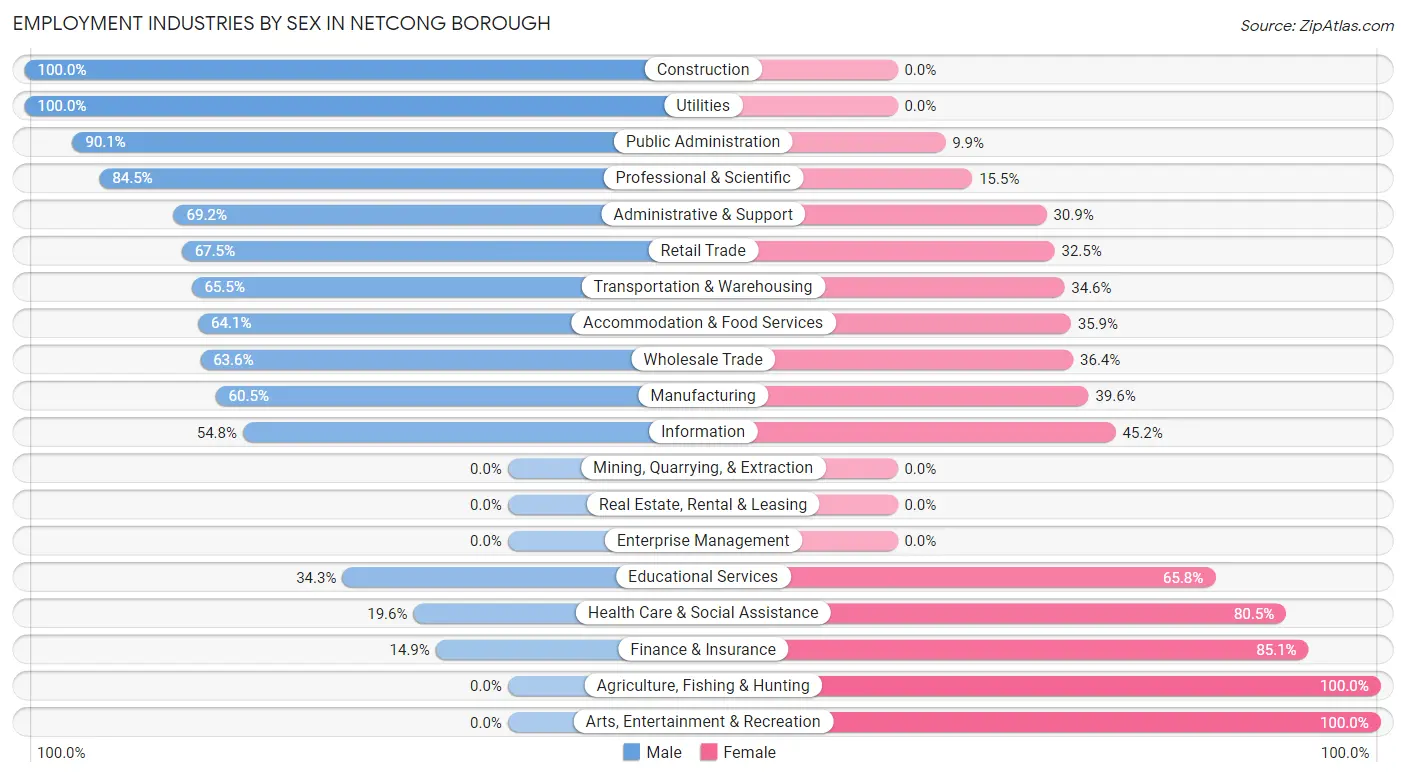
Employment Industries by Sex in Netcong borough
The Netcong borough industries that see more men than women are Construction (100.0%), Utilities (100.0%), and Public Administration (90.1%), whereas the industries that tend to have a higher number of women are Agriculture, Fishing & Hunting (100.0%), Arts, Entertainment & Recreation (100.0%), and Finance & Insurance (85.1%).
| Industry | Male | Female |
| Agriculture, Fishing & Hunting | 0 (0.0%) | 9 (100.0%) |
| Mining, Quarrying, & Extraction | 0 (0.0%) | 0 (0.0%) |
| Construction | 102 (100.0%) | 0 (0.0%) |
| Manufacturing | 107 (60.5%) | 70 (39.6%) |
| Wholesale Trade | 42 (63.6%) | 24 (36.4%) |
| Retail Trade | 195 (67.5%) | 94 (32.5%) |
| Transportation & Warehousing | 36 (65.4%) | 19 (34.5%) |
| Utilities | 10 (100.0%) | 0 (0.0%) |
| Information | 34 (54.8%) | 28 (45.2%) |
| Finance & Insurance | 43 (14.9%) | 245 (85.1%) |
| Real Estate, Rental & Leasing | 0 (0.0%) | 0 (0.0%) |
| Professional & Scientific | 60 (84.5%) | 11 (15.5%) |
| Enterprise Management | 0 (0.0%) | 0 (0.0%) |
| Administrative & Support | 65 (69.2%) | 29 (30.8%) |
| Educational Services | 62 (34.3%) | 119 (65.7%) |
| Health Care & Social Assistance | 43 (19.6%) | 177 (80.4%) |
| Arts, Entertainment & Recreation | 0 (0.0%) | 46 (100.0%) |
| Accommodation & Food Services | 175 (64.1%) | 98 (35.9%) |
| Public Administration | 91 (90.1%) | 10 (9.9%) |
| Total | 1,075 (51.4%) | 1,015 (48.6%) |
Education in Netcong borough
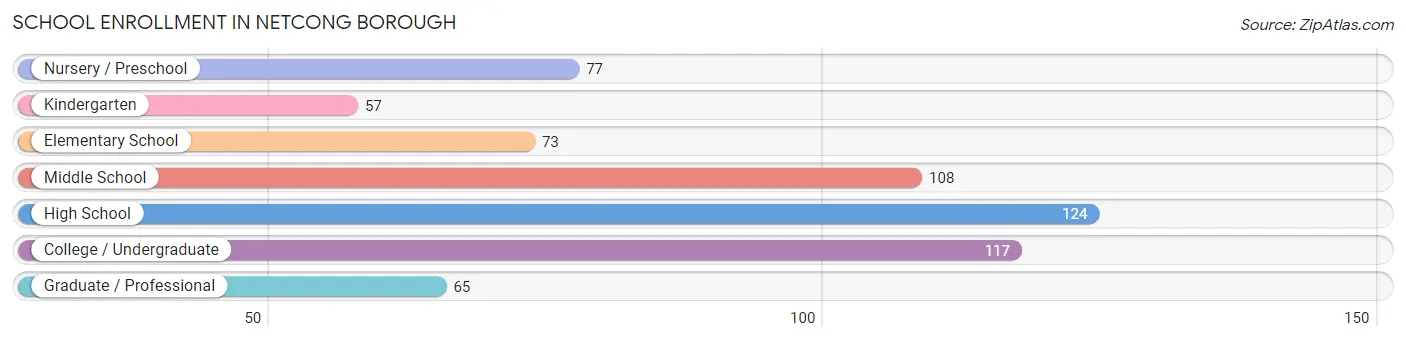
School Enrollment in Netcong borough
The most common levels of schooling among the 621 students in Netcong borough are high school (124 | 20.0%), college / undergraduate (117 | 18.8%), and middle school (108 | 17.4%).
| School Level | # Students | % Students |
| Nursery / Preschool | 77 | 12.4% |
| Kindergarten | 57 | 9.2% |
| Elementary School | 73 | 11.8% |
| Middle School | 108 | 17.4% |
| High School | 124 | 20.0% |
| College / Undergraduate | 117 | 18.8% |
| Graduate / Professional | 65 | 10.5% |
| Total | 621 | 100.0% |
School Enrollment by Age by Funding Source in Netcong borough
Out of a total of 621 students who are enrolled in schools in Netcong borough, 129 (20.8%) attend a private institution, while the remaining 492 (79.2%) are enrolled in public schools. The age group of 3 to 4 year olds has the highest likelihood of being enrolled in private schools, with 34 (44.2% in the age bracket) enrolled. Conversely, the age group of 5 to 9 year old has the lowest likelihood of being enrolled in a private school, with 130 (100.0% in the age bracket) attending a public institution.
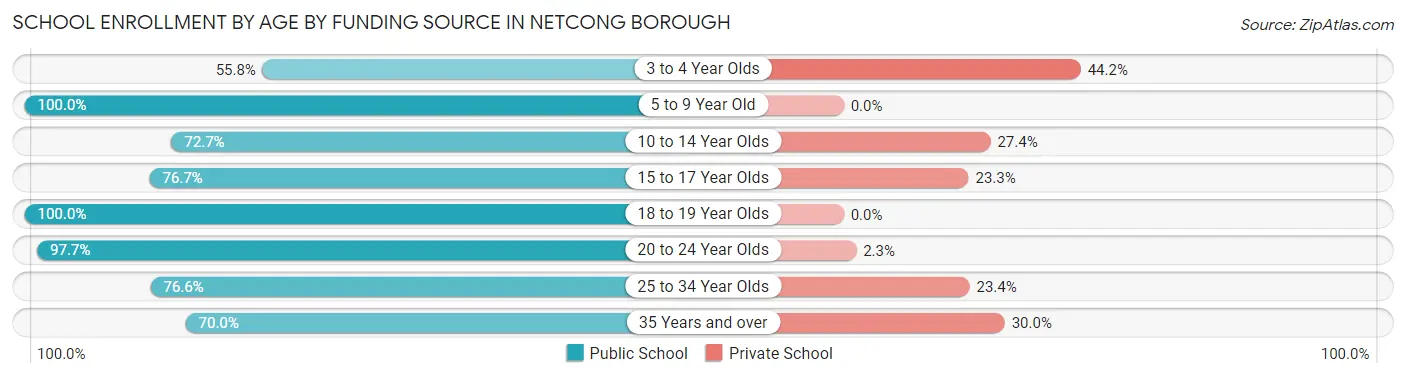
| Age Bracket | Public School | Private School |
| 3 to 4 Year Olds | 43 (55.8%) | 34 (44.2%) |
| 5 to 9 Year Old | 130 (100.0%) | 0 (0.0%) |
| 10 to 14 Year Olds | 85 (72.7%) | 32 (27.4%) |
| 15 to 17 Year Olds | 66 (76.7%) | 20 (23.3%) |
| 18 to 19 Year Olds | 14 (100.0%) | 0 (0.0%) |
| 20 to 24 Year Olds | 42 (97.7%) | 1 (2.3%) |
| 25 to 34 Year Olds | 49 (76.6%) | 15 (23.4%) |
| 35 Years and over | 63 (70.0%) | 27 (30.0%) |
| Total | 492 (79.2%) | 129 (20.8%) |
Educational Attainment by Field of Study in Netcong borough
Business (444 | 42.5%), liberal arts & history (118 | 11.3%), psychology (110 | 10.5%), science & technology (68 | 6.5%), and engineering (61 | 5.8%) are the most common fields of study among 1,044 individuals in Netcong borough who have obtained a bachelor's degree or higher.
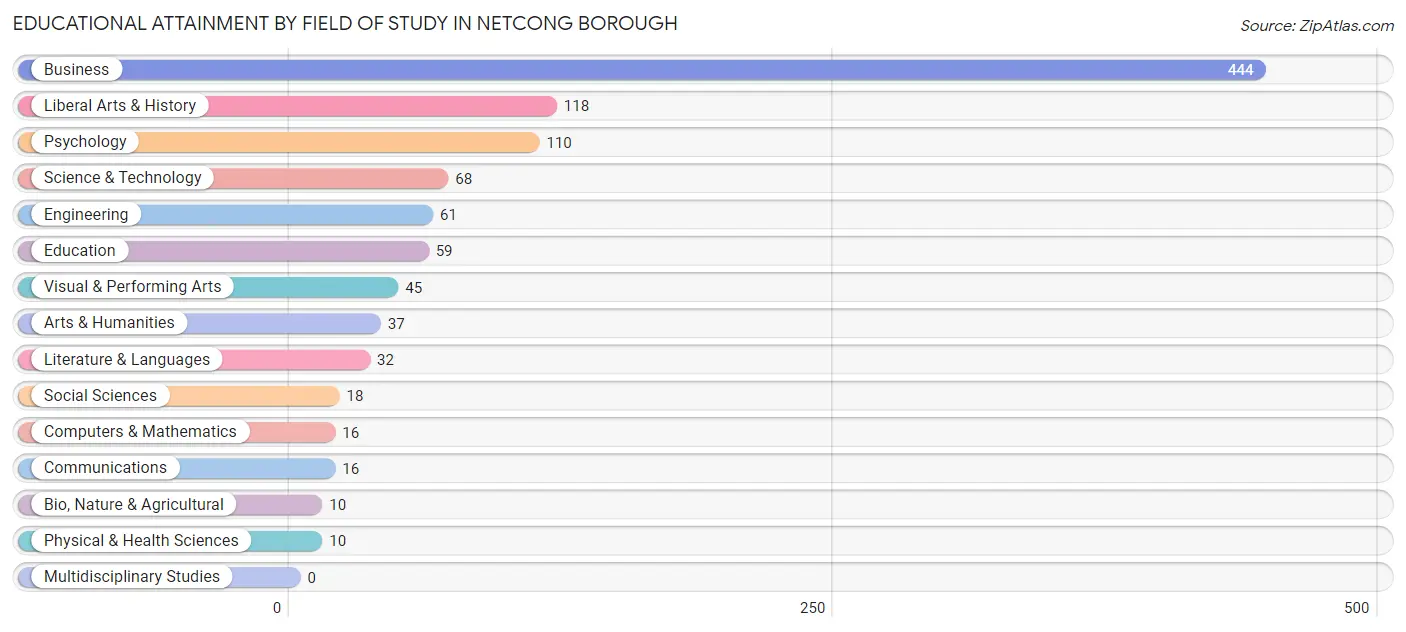
| Field of Study | # Graduates | % Graduates |
| Computers & Mathematics | 16 | 1.5% |
| Bio, Nature & Agricultural | 10 | 1.0% |
| Physical & Health Sciences | 10 | 1.0% |
| Psychology | 110 | 10.5% |
| Social Sciences | 18 | 1.7% |
| Engineering | 61 | 5.8% |
| Multidisciplinary Studies | 0 | 0.0% |
| Science & Technology | 68 | 6.5% |
| Business | 444 | 42.5% |
| Education | 59 | 5.7% |
| Literature & Languages | 32 | 3.1% |
| Liberal Arts & History | 118 | 11.3% |
| Visual & Performing Arts | 45 | 4.3% |
| Communications | 16 | 1.5% |
| Arts & Humanities | 37 | 3.5% |
| Total | 1,044 | 100.0% |
Transportation & Commute in Netcong borough
Vehicle Availability by Sex in Netcong borough
The most prevalent vehicle ownership categories in Netcong borough are males with 2 vehicles (486, accounting for 52.7%) and females with 2 vehicles (475, making up 48.4%).
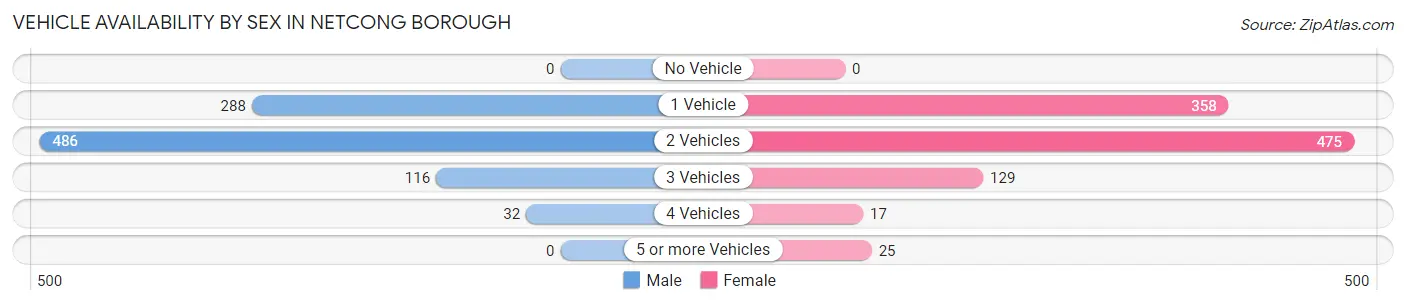
| Vehicles Available | Male | Female |
| No Vehicle | 0 (0.0%) | 0 (0.0%) |
| 1 Vehicle | 288 (31.2%) | 358 (35.7%) |
| 2 Vehicles | 486 (52.7%) | 475 (47.3%) |
| 3 Vehicles | 116 (12.6%) | 129 (12.9%) |
| 4 Vehicles | 32 (3.5%) | 17 (1.7%) |
| 5 or more Vehicles | 0 (0.0%) | 25 (2.5%) |
| Total | 922 (100.0%) | 1,004 (100.0%) |
Commute Time in Netcong borough
The most frequently occuring commute durations in Netcong borough are 15 to 19 minutes (289 commuters, 18.5%), 30 to 34 minutes (219 commuters, 14.0%), and 5 to 9 minutes (175 commuters, 11.2%).
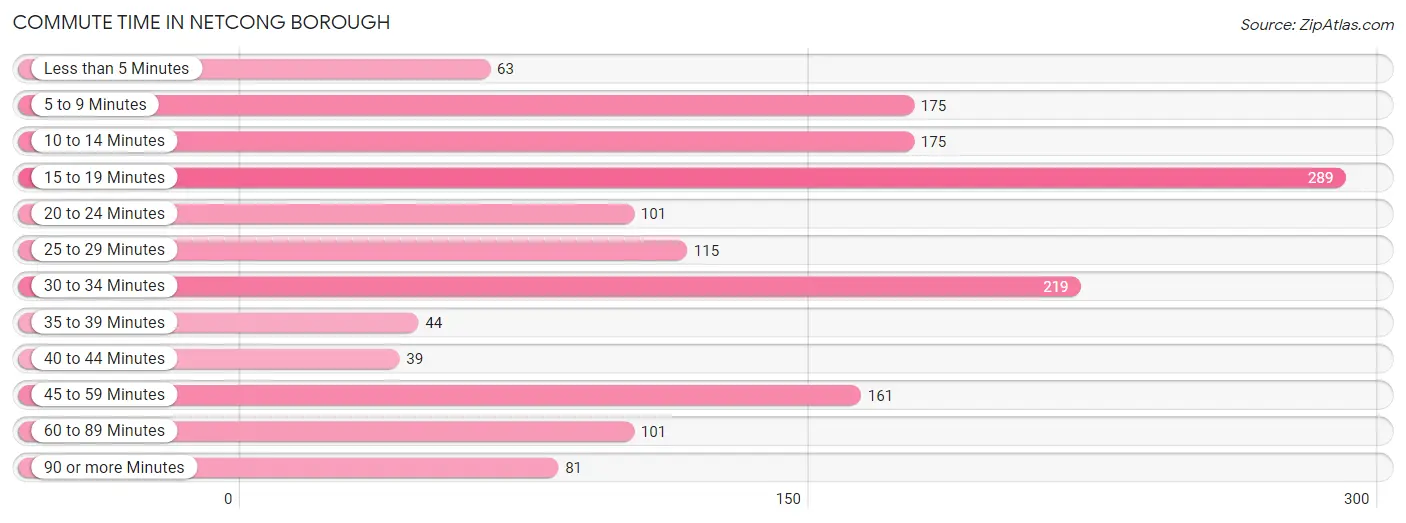
| Commute Time | # Commuters | % Commuters |
| Less than 5 Minutes | 63 | 4.0% |
| 5 to 9 Minutes | 175 | 11.2% |
| 10 to 14 Minutes | 175 | 11.2% |
| 15 to 19 Minutes | 289 | 18.5% |
| 20 to 24 Minutes | 101 | 6.5% |
| 25 to 29 Minutes | 115 | 7.4% |
| 30 to 34 Minutes | 219 | 14.0% |
| 35 to 39 Minutes | 44 | 2.8% |
| 40 to 44 Minutes | 39 | 2.5% |
| 45 to 59 Minutes | 161 | 10.3% |
| 60 to 89 Minutes | 101 | 6.5% |
| 90 or more Minutes | 81 | 5.2% |
Commute Time by Sex in Netcong borough
The most common commute times in Netcong borough are 30 to 34 minutes (168 commuters, 19.3%) for males and 15 to 19 minutes (155 commuters, 22.4%) for females.
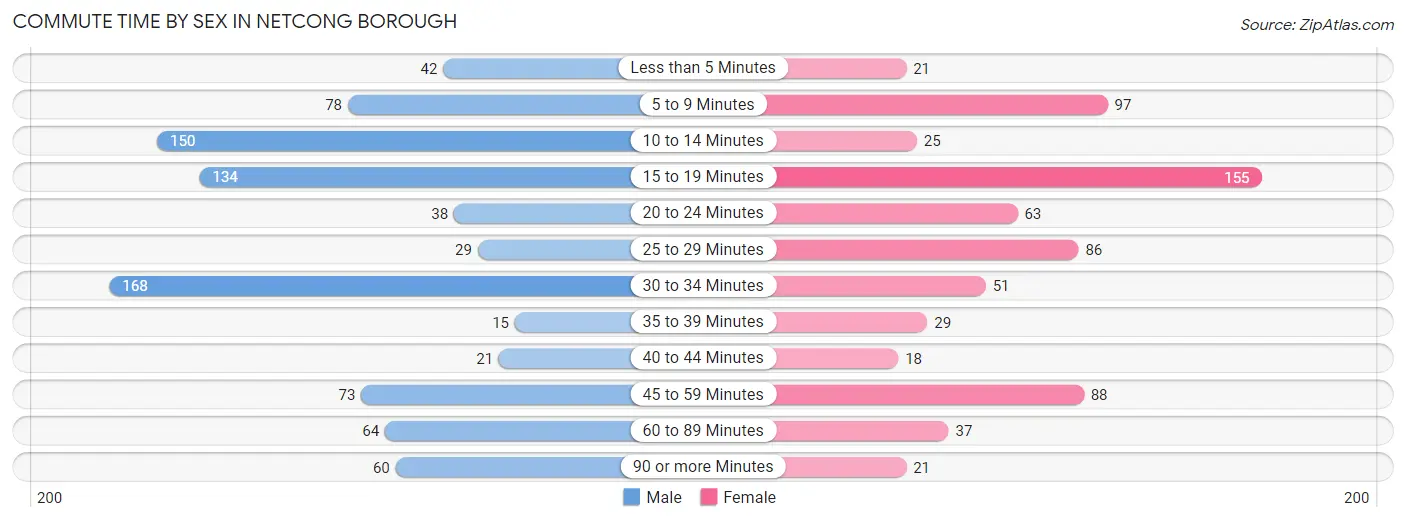
| Commute Time | Male | Female |
| Less than 5 Minutes | 42 (4.8%) | 21 (3.0%) |
| 5 to 9 Minutes | 78 (8.9%) | 97 (14.0%) |
| 10 to 14 Minutes | 150 (17.2%) | 25 (3.6%) |
| 15 to 19 Minutes | 134 (15.4%) | 155 (22.4%) |
| 20 to 24 Minutes | 38 (4.4%) | 63 (9.1%) |
| 25 to 29 Minutes | 29 (3.3%) | 86 (12.4%) |
| 30 to 34 Minutes | 168 (19.3%) | 51 (7.4%) |
| 35 to 39 Minutes | 15 (1.7%) | 29 (4.2%) |
| 40 to 44 Minutes | 21 (2.4%) | 18 (2.6%) |
| 45 to 59 Minutes | 73 (8.4%) | 88 (12.7%) |
| 60 to 89 Minutes | 64 (7.3%) | 37 (5.3%) |
| 90 or more Minutes | 60 (6.9%) | 21 (3.0%) |
Time of Departure to Work by Sex in Netcong borough
The most frequent times of departure to work in Netcong borough are 7:00 AM to 7:29 AM (234, 26.8%) for males and 6:00 AM to 6:29 AM (126, 18.2%) for females.
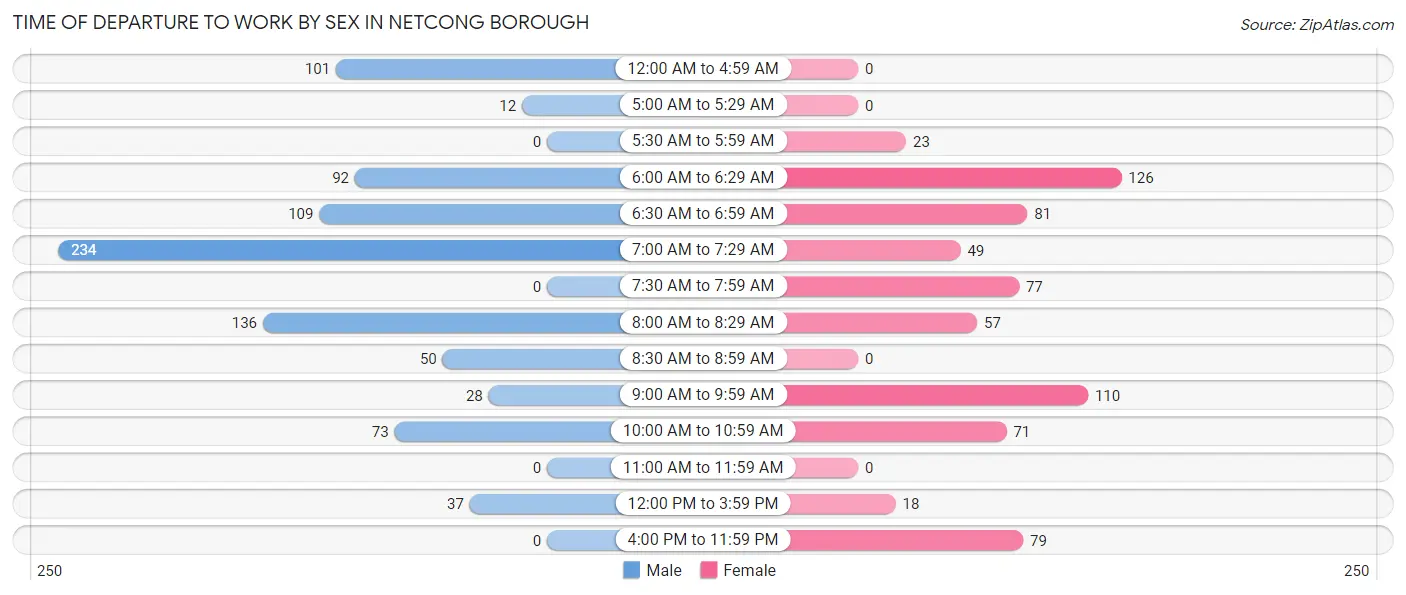
| Time of Departure | Male | Female |
| 12:00 AM to 4:59 AM | 101 (11.6%) | 0 (0.0%) |
| 5:00 AM to 5:29 AM | 12 (1.4%) | 0 (0.0%) |
| 5:30 AM to 5:59 AM | 0 (0.0%) | 23 (3.3%) |
| 6:00 AM to 6:29 AM | 92 (10.5%) | 126 (18.2%) |
| 6:30 AM to 6:59 AM | 109 (12.5%) | 81 (11.7%) |
| 7:00 AM to 7:29 AM | 234 (26.8%) | 49 (7.1%) |
| 7:30 AM to 7:59 AM | 0 (0.0%) | 77 (11.1%) |
| 8:00 AM to 8:29 AM | 136 (15.6%) | 57 (8.3%) |
| 8:30 AM to 8:59 AM | 50 (5.7%) | 0 (0.0%) |
| 9:00 AM to 9:59 AM | 28 (3.2%) | 110 (15.9%) |
| 10:00 AM to 10:59 AM | 73 (8.4%) | 71 (10.3%) |
| 11:00 AM to 11:59 AM | 0 (0.0%) | 0 (0.0%) |
| 12:00 PM to 3:59 PM | 37 (4.2%) | 18 (2.6%) |
| 4:00 PM to 11:59 PM | 0 (0.0%) | 79 (11.4%) |
| Total | 872 (100.0%) | 691 (100.0%) |
Housing Occupancy in Netcong borough
Occupancy by Ownership in Netcong borough
Of the total 1,870 dwellings in Netcong borough, owner-occupied units account for 978 (52.3%), while renter-occupied units make up 892 (47.7%).
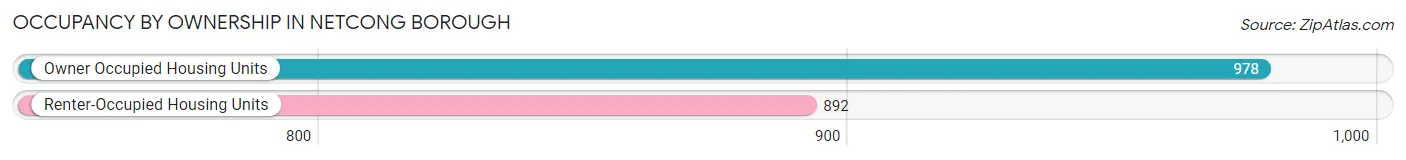
| Occupancy | # Housing Units | % Housing Units |
| Owner Occupied Housing Units | 978 | 52.3% |
| Renter-Occupied Housing Units | 892 | 47.7% |
| Total Occupied Housing Units | 1,870 | 100.0% |
Occupancy by Household Size in Netcong borough
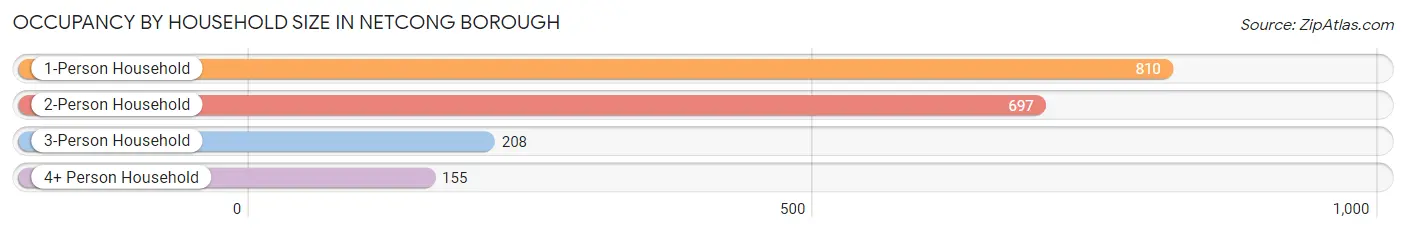
| Household Size | # Housing Units | % Housing Units |
| 1-Person Household | 810 | 43.3% |
| 2-Person Household | 697 | 37.3% |
| 3-Person Household | 208 | 11.1% |
| 4+ Person Household | 155 | 8.3% |
| Total Housing Units | 1,870 | 100.0% |
Occupancy by Ownership by Household Size in Netcong borough
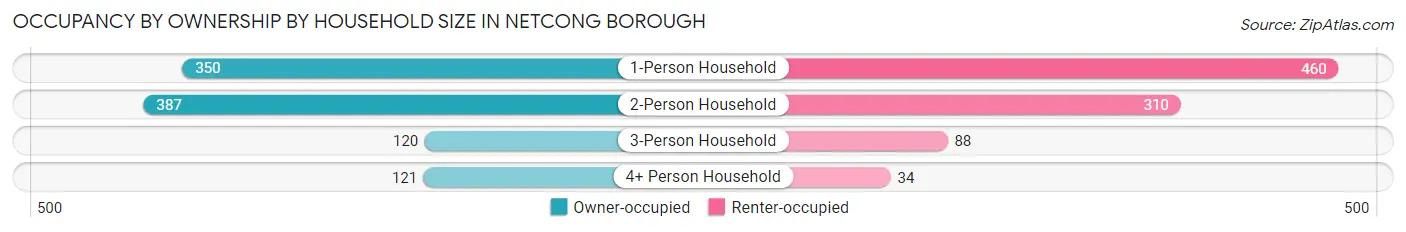
| Household Size | Owner-occupied | Renter-occupied |
| 1-Person Household | 350 (43.2%) | 460 (56.8%) |
| 2-Person Household | 387 (55.5%) | 310 (44.5%) |
| 3-Person Household | 120 (57.7%) | 88 (42.3%) |
| 4+ Person Household | 121 (78.1%) | 34 (21.9%) |
| Total Housing Units | 978 (52.3%) | 892 (47.7%) |
Occupancy by Educational Attainment in Netcong borough
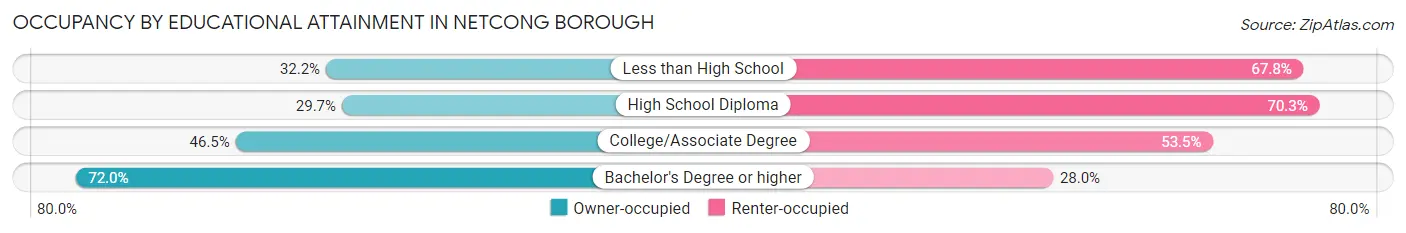
| Household Size | Owner-occupied | Renter-occupied |
| Less than High School | 38 (32.2%) | 80 (67.8%) |
| High School Diploma | 130 (29.7%) | 308 (70.3%) |
| College/Associate Degree | 248 (46.5%) | 285 (53.5%) |
| Bachelor's Degree or higher | 562 (72.0%) | 219 (28.0%) |
Occupancy by Age of Householder in Netcong borough
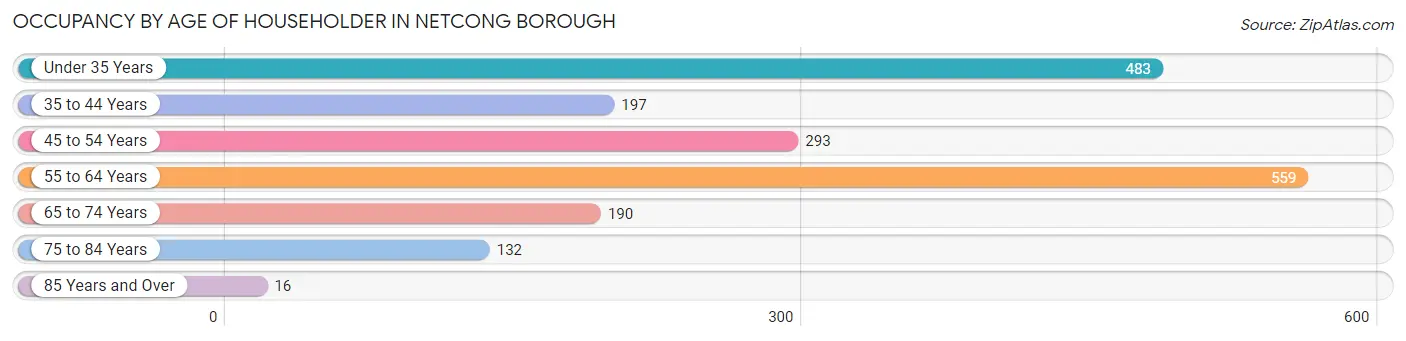
| Age Bracket | # Households | % Households |
| Under 35 Years | 483 | 25.8% |
| 35 to 44 Years | 197 | 10.5% |
| 45 to 54 Years | 293 | 15.7% |
| 55 to 64 Years | 559 | 29.9% |
| 65 to 74 Years | 190 | 10.2% |
| 75 to 84 Years | 132 | 7.1% |
| 85 Years and Over | 16 | 0.9% |
| Total | 1,870 | 100.0% |
Housing Finances in Netcong borough
Median Income by Occupancy in Netcong borough
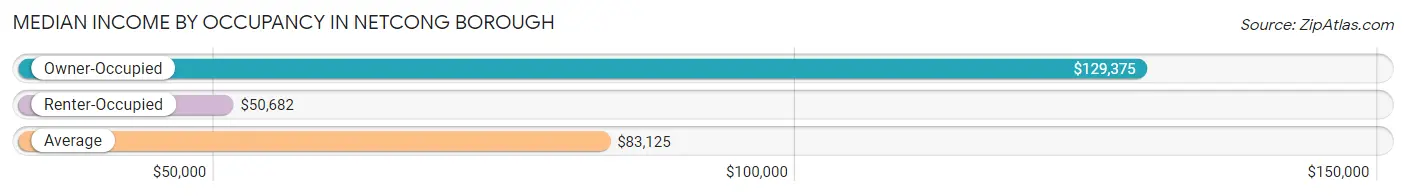
| Occupancy Type | # Households | Median Income |
| Owner-Occupied | 978 (52.3%) | $129,375 |
| Renter-Occupied | 892 (47.7%) | $50,682 |
| Average | 1,870 (100.0%) | $83,125 |
Occupancy by Householder Income Bracket in Netcong borough
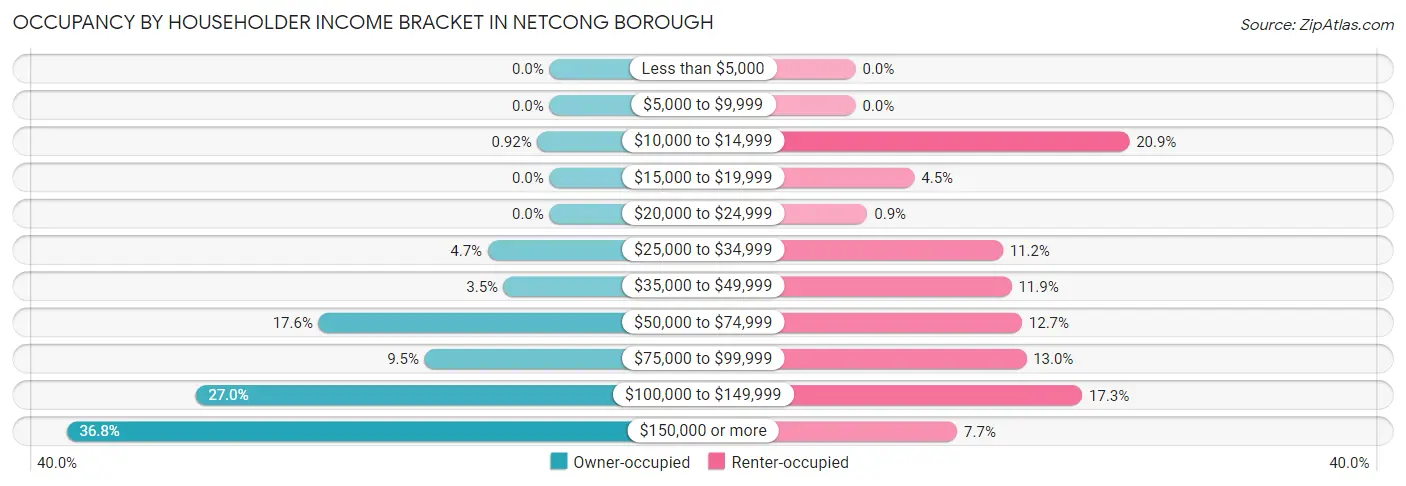
| Income Bracket | Owner-occupied | Renter-occupied |
| Less than $5,000 | 0 (0.0%) | 0 (0.0%) |
| $5,000 to $9,999 | 0 (0.0%) | 0 (0.0%) |
| $10,000 to $14,999 | 9 (0.9%) | 186 (20.8%) |
| $15,000 to $19,999 | 0 (0.0%) | 40 (4.5%) |
| $20,000 to $24,999 | 0 (0.0%) | 8 (0.9%) |
| $25,000 to $34,999 | 46 (4.7%) | 100 (11.2%) |
| $35,000 to $49,999 | 34 (3.5%) | 106 (11.9%) |
| $50,000 to $74,999 | 172 (17.6%) | 113 (12.7%) |
| $75,000 to $99,999 | 93 (9.5%) | 116 (13.0%) |
| $100,000 to $149,999 | 264 (27.0%) | 154 (17.3%) |
| $150,000 or more | 360 (36.8%) | 69 (7.7%) |
| Total | 978 (100.0%) | 892 (100.0%) |
Monthly Housing Cost Tiers in Netcong borough
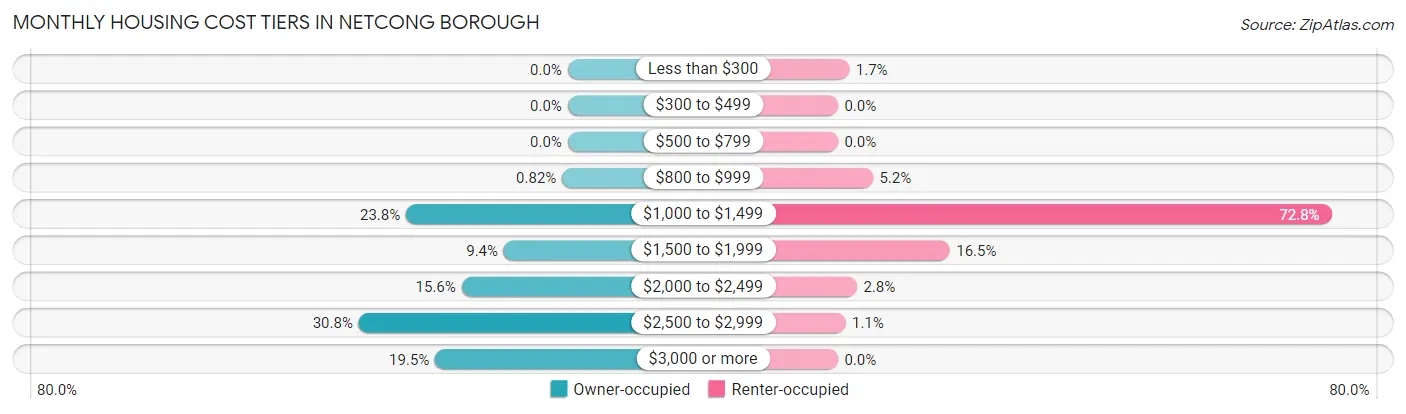
| Monthly Cost | Owner-occupied | Renter-occupied |
| Less than $300 | 0 (0.0%) | 15 (1.7%) |
| $300 to $499 | 0 (0.0%) | 0 (0.0%) |
| $500 to $799 | 0 (0.0%) | 0 (0.0%) |
| $800 to $999 | 8 (0.8%) | 46 (5.2%) |
| $1,000 to $1,499 | 233 (23.8%) | 649 (72.8%) |
| $1,500 to $1,999 | 92 (9.4%) | 147 (16.5%) |
| $2,000 to $2,499 | 153 (15.6%) | 25 (2.8%) |
| $2,500 to $2,999 | 301 (30.8%) | 10 (1.1%) |
| $3,000 or more | 191 (19.5%) | 0 (0.0%) |
| Total | 978 (100.0%) | 892 (100.0%) |
Physical Housing Characteristics in Netcong borough
Housing Structures in Netcong borough
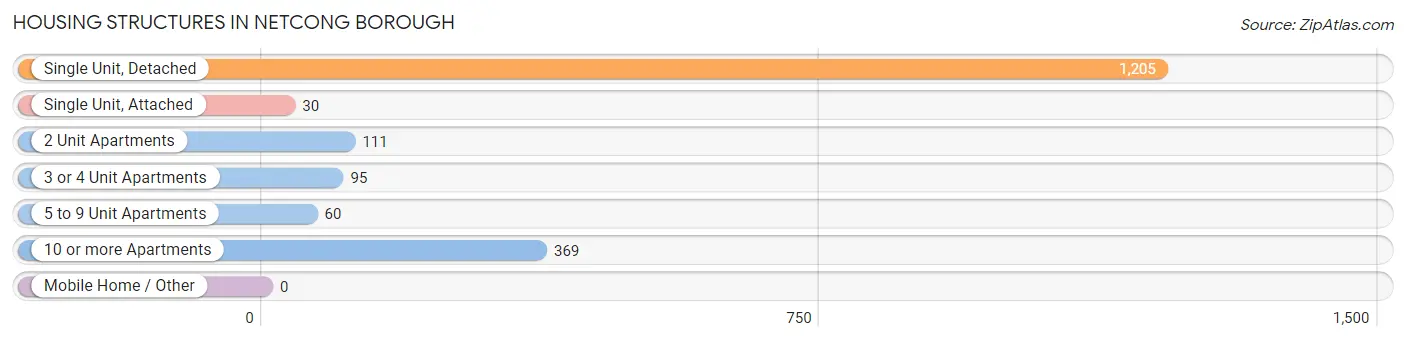
| Structure Type | # Housing Units | % Housing Units |
| Single Unit, Detached | 1,205 | 64.4% |
| Single Unit, Attached | 30 | 1.6% |
| 2 Unit Apartments | 111 | 5.9% |
| 3 or 4 Unit Apartments | 95 | 5.1% |
| 5 to 9 Unit Apartments | 60 | 3.2% |
| 10 or more Apartments | 369 | 19.7% |
| Mobile Home / Other | 0 | 0.0% |
| Total | 1,870 | 100.0% |
Housing Structures by Occupancy in Netcong borough
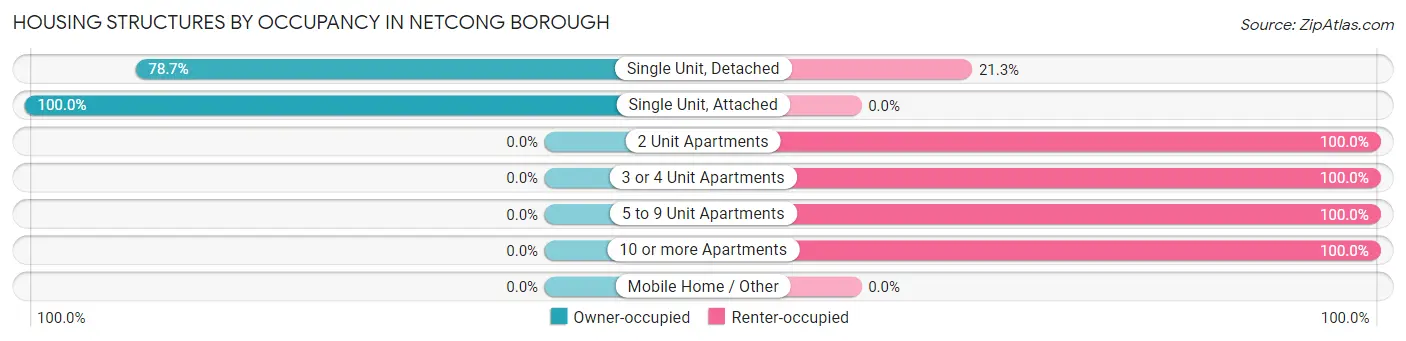
| Structure Type | Owner-occupied | Renter-occupied |
| Single Unit, Detached | 948 (78.7%) | 257 (21.3%) |
| Single Unit, Attached | 30 (100.0%) | 0 (0.0%) |
| 2 Unit Apartments | 0 (0.0%) | 111 (100.0%) |
| 3 or 4 Unit Apartments | 0 (0.0%) | 95 (100.0%) |
| 5 to 9 Unit Apartments | 0 (0.0%) | 60 (100.0%) |
| 10 or more Apartments | 0 (0.0%) | 369 (100.0%) |
| Mobile Home / Other | 0 (0.0%) | 0 (0.0%) |
| Total | 978 (52.3%) | 892 (47.7%) |
Housing Structures by Number of Rooms in Netcong borough
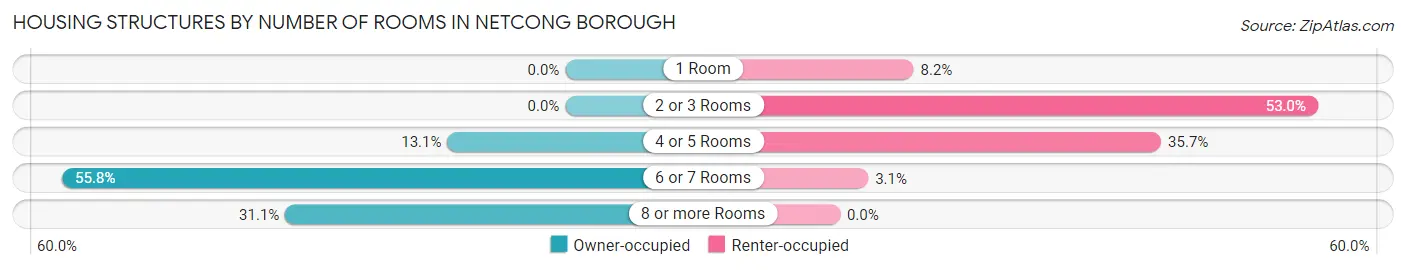
| Number of Rooms | Owner-occupied | Renter-occupied |
| 1 Room | 0 (0.0%) | 73 (8.2%) |
| 2 or 3 Rooms | 0 (0.0%) | 473 (53.0%) |
| 4 or 5 Rooms | 128 (13.1%) | 318 (35.6%) |
| 6 or 7 Rooms | 546 (55.8%) | 28 (3.1%) |
| 8 or more Rooms | 304 (31.1%) | 0 (0.0%) |
| Total | 978 (100.0%) | 892 (100.0%) |
Housing Structure by Heating Type in Netcong borough
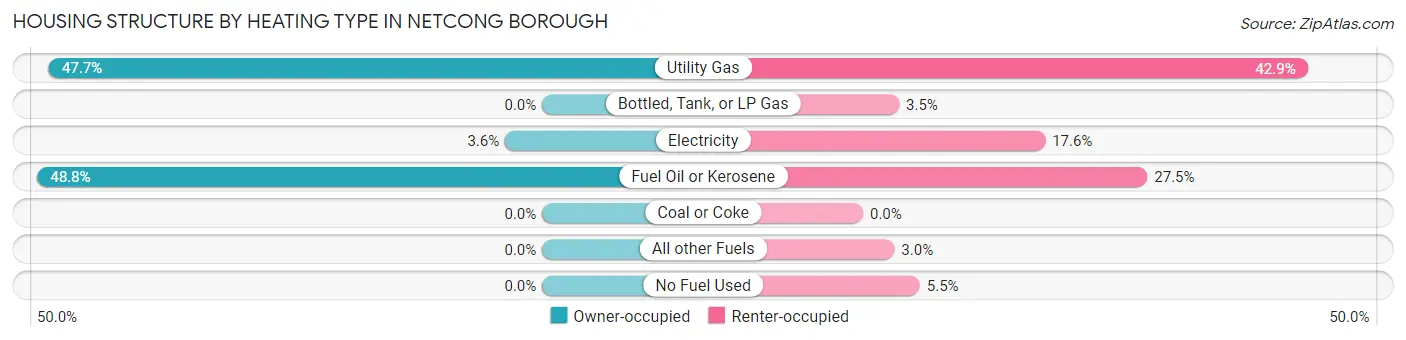
| Heating Type | Owner-occupied | Renter-occupied |
| Utility Gas | 466 (47.6%) | 383 (42.9%) |
| Bottled, Tank, or LP Gas | 0 (0.0%) | 31 (3.5%) |
| Electricity | 35 (3.6%) | 157 (17.6%) |
| Fuel Oil or Kerosene | 477 (48.8%) | 245 (27.5%) |
| Coal or Coke | 0 (0.0%) | 0 (0.0%) |
| All other Fuels | 0 (0.0%) | 27 (3.0%) |
| No Fuel Used | 0 (0.0%) | 49 (5.5%) |
| Total | 978 (100.0%) | 892 (100.0%) |
Household Vehicle Usage in Netcong borough
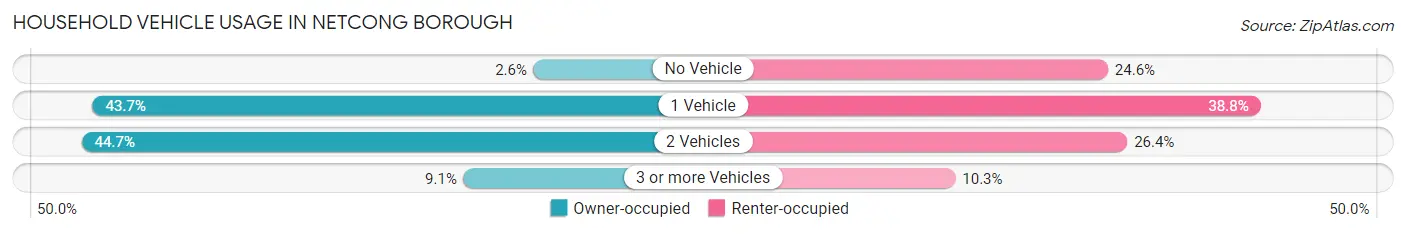
| Vehicles per Household | Owner-occupied | Renter-occupied |
| No Vehicle | 25 (2.6%) | 219 (24.5%) |
| 1 Vehicle | 427 (43.7%) | 346 (38.8%) |
| 2 Vehicles | 437 (44.7%) | 235 (26.4%) |
| 3 or more Vehicles | 89 (9.1%) | 92 (10.3%) |
| Total | 978 (100.0%) | 892 (100.0%) |
Real Estate & Mortgages in Netcong borough
Real Estate and Mortgage Overview in Netcong borough
| Characteristic | Without Mortgage | With Mortgage |
| Housing Units | 184 | 794 |
| Median Property Value | $318,800 | $335,300 |
| Median Household Income | $75,500 | $321 |
| Monthly Housing Costs | $1,290 | $191 |
| Real Estate Taxes | $9,522 | $0 |
Property Value by Mortgage Status in Netcong borough
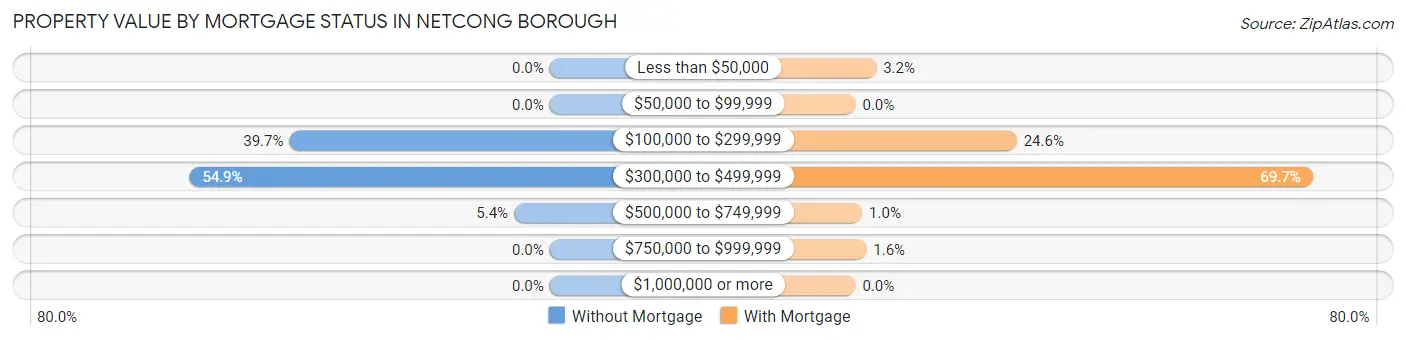
| Property Value | Without Mortgage | With Mortgage |
| Less than $50,000 | 0 (0.0%) | 25 (3.2%) |
| $50,000 to $99,999 | 0 (0.0%) | 0 (0.0%) |
| $100,000 to $299,999 | 73 (39.7%) | 195 (24.6%) |
| $300,000 to $499,999 | 101 (54.9%) | 553 (69.7%) |
| $500,000 to $749,999 | 10 (5.4%) | 8 (1.0%) |
| $750,000 to $999,999 | 0 (0.0%) | 13 (1.6%) |
| $1,000,000 or more | 0 (0.0%) | 0 (0.0%) |
| Total | 184 (100.0%) | 794 (100.0%) |
Household Income by Mortgage Status in Netcong borough
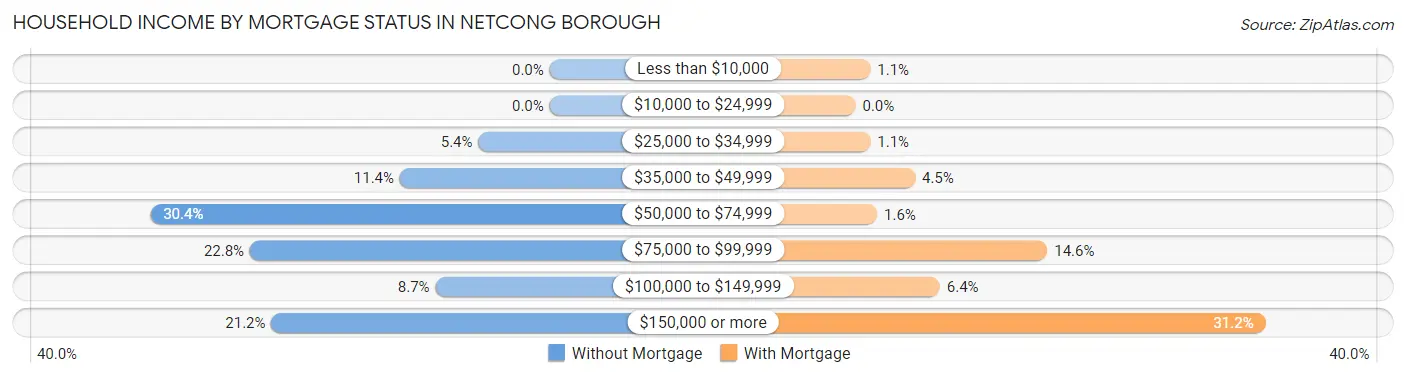
| Household Income | Without Mortgage | With Mortgage |
| Less than $10,000 | 0 (0.0%) | 9 (1.1%) |
| $10,000 to $24,999 | 0 (0.0%) | 0 (0.0%) |
| $25,000 to $34,999 | 10 (5.4%) | 9 (1.1%) |
| $35,000 to $49,999 | 21 (11.4%) | 36 (4.5%) |
| $50,000 to $74,999 | 56 (30.4%) | 13 (1.6%) |
| $75,000 to $99,999 | 42 (22.8%) | 116 (14.6%) |
| $100,000 to $149,999 | 16 (8.7%) | 51 (6.4%) |
| $150,000 or more | 39 (21.2%) | 248 (31.2%) |
| Total | 184 (100.0%) | 794 (100.0%) |
Property Value to Household Income Ratio in Netcong borough
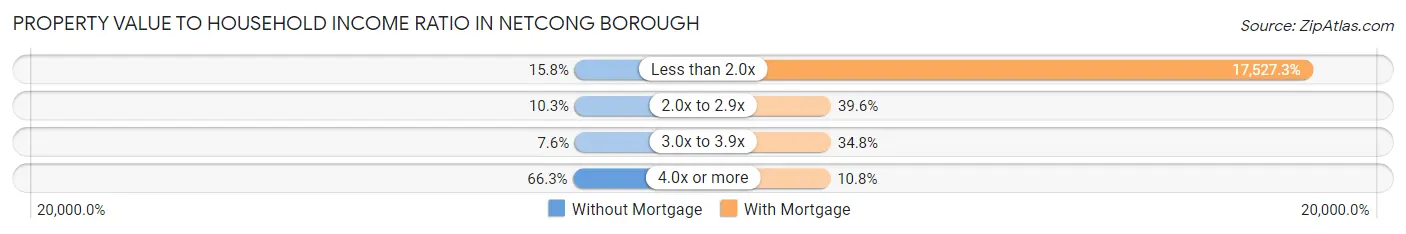
| Value-to-Income Ratio | Without Mortgage | With Mortgage |
| Less than 2.0x | 29 (15.8%) | 139,167 (17,527.3%) |
| 2.0x to 2.9x | 19 (10.3%) | 314 (39.6%) |
| 3.0x to 3.9x | 14 (7.6%) | 276 (34.8%) |
| 4.0x or more | 122 (66.3%) | 86 (10.8%) |
| Total | 184 (100.0%) | 794 (100.0%) |
Real Estate Taxes by Mortgage Status in Netcong borough
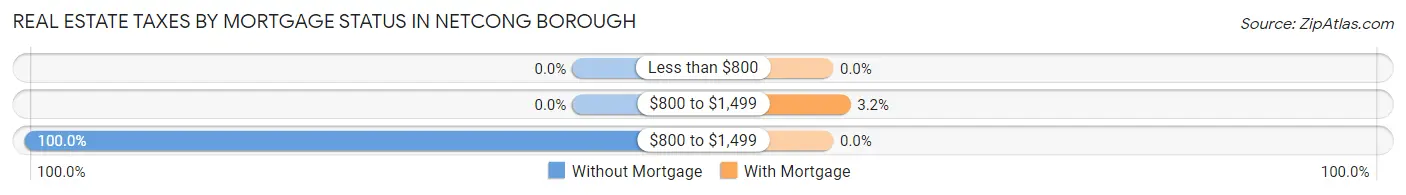
| Property Taxes | Without Mortgage | With Mortgage |
| Less than $800 | 0 (0.0%) | 0 (0.0%) |
| $800 to $1,499 | 0 (0.0%) | 25 (3.2%) |
| $800 to $1,499 | 184 (100.0%) | 0 (0.0%) |
| Total | 184 (100.0%) | 794 (100.0%) |
Health & Disability in Netcong borough
Health Insurance Coverage by Age in Netcong borough
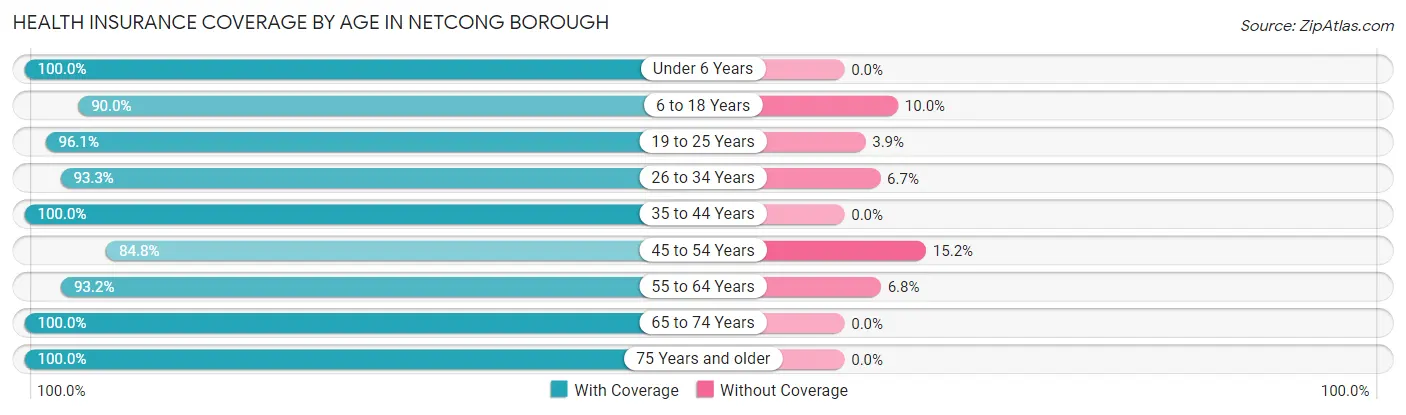
| Age Bracket | With Coverage | Without Coverage |
| Under 6 Years | 252 (100.0%) | 0 (0.0%) |
| 6 to 18 Years | 261 (90.0%) | 29 (10.0%) |
| 19 to 25 Years | 270 (96.1%) | 11 (3.9%) |
| 26 to 34 Years | 488 (93.3%) | 35 (6.7%) |
| 35 to 44 Years | 426 (100.0%) | 0 (0.0%) |
| 45 to 54 Years | 312 (84.8%) | 56 (15.2%) |
| 55 to 64 Years | 783 (93.2%) | 57 (6.8%) |
| 65 to 74 Years | 299 (100.0%) | 0 (0.0%) |
| 75 Years and older | 205 (100.0%) | 0 (0.0%) |
| Total | 3,296 (94.6%) | 188 (5.4%) |
Health Insurance Coverage by Citizenship Status in Netcong borough
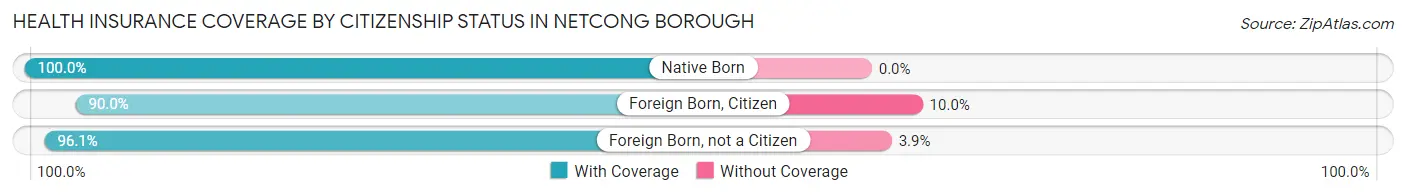
| Citizenship Status | With Coverage | Without Coverage |
| Native Born | 252 (100.0%) | 0 (0.0%) |
| Foreign Born, Citizen | 261 (90.0%) | 29 (10.0%) |
| Foreign Born, not a Citizen | 270 (96.1%) | 11 (3.9%) |
Health Insurance Coverage by Household Income in Netcong borough
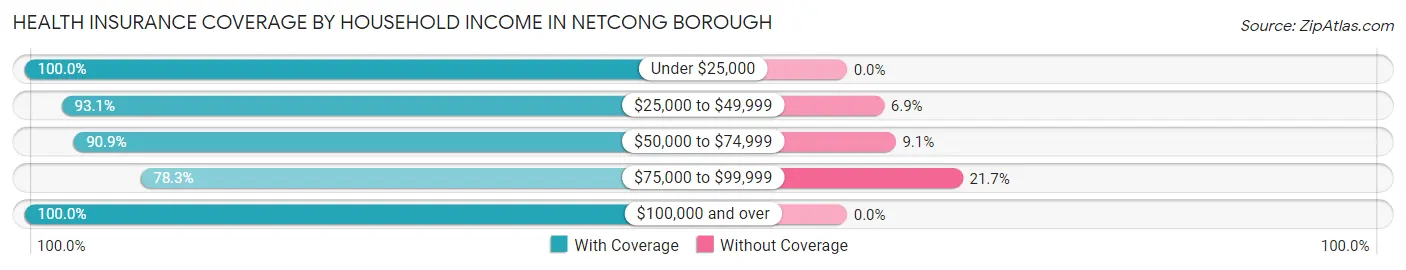
| Household Income | With Coverage | Without Coverage |
| Under $25,000 | 267 (100.0%) | 0 (0.0%) |
| $25,000 to $49,999 | 469 (93.1%) | 35 (6.9%) |
| $50,000 to $74,999 | 498 (90.9%) | 50 (9.1%) |
| $75,000 to $99,999 | 372 (78.3%) | 103 (21.7%) |
| $100,000 and over | 1,685 (100.0%) | 0 (0.0%) |
Public vs Private Health Insurance Coverage by Age in Netcong borough
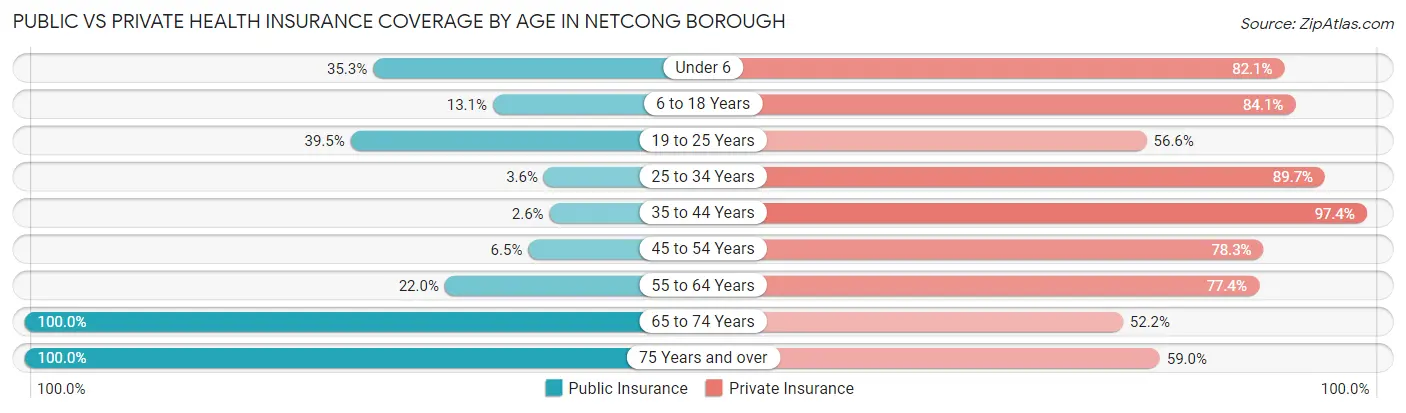
| Age Bracket | Public Insurance | Private Insurance |
| Under 6 | 89 (35.3%) | 207 (82.1%) |
| 6 to 18 Years | 38 (13.1%) | 244 (84.1%) |
| 19 to 25 Years | 111 (39.5%) | 159 (56.6%) |
| 25 to 34 Years | 19 (3.6%) | 469 (89.7%) |
| 35 to 44 Years | 11 (2.6%) | 415 (97.4%) |
| 45 to 54 Years | 24 (6.5%) | 288 (78.3%) |
| 55 to 64 Years | 185 (22.0%) | 650 (77.4%) |
| 65 to 74 Years | 299 (100.0%) | 156 (52.2%) |
| 75 Years and over | 205 (100.0%) | 121 (59.0%) |
| Total | 981 (28.2%) | 2,709 (77.8%) |
Disability Status by Sex by Age in Netcong borough
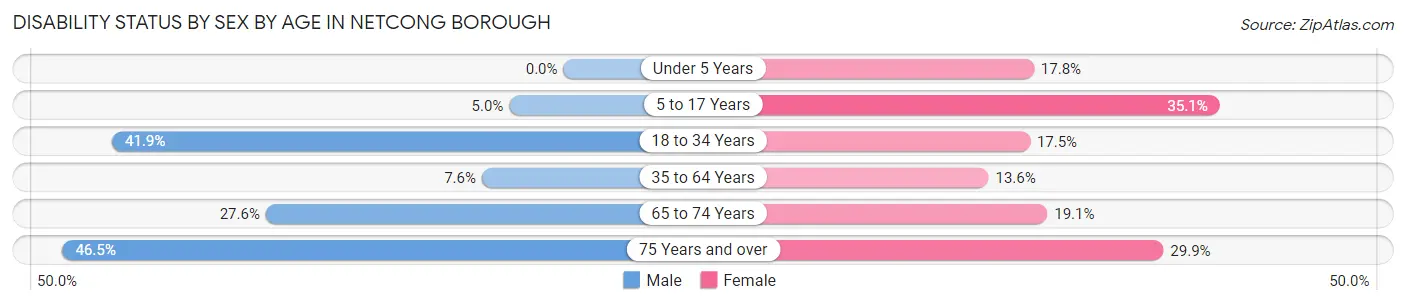
| Age Bracket | Male | Female |
| Under 5 Years | 0 (0.0%) | 23 (17.8%) |
| 5 to 17 Years | 9 (5.0%) | 54 (35.1%) |
| 18 to 34 Years | 201 (41.9%) | 59 (17.5%) |
| 35 to 64 Years | 57 (7.6%) | 120 (13.6%) |
| 65 to 74 Years | 29 (27.6%) | 37 (19.1%) |
| 75 Years and over | 33 (46.5%) | 40 (29.8%) |
Disability Class by Sex by Age in Netcong borough
Disability Class: Hearing Difficulty
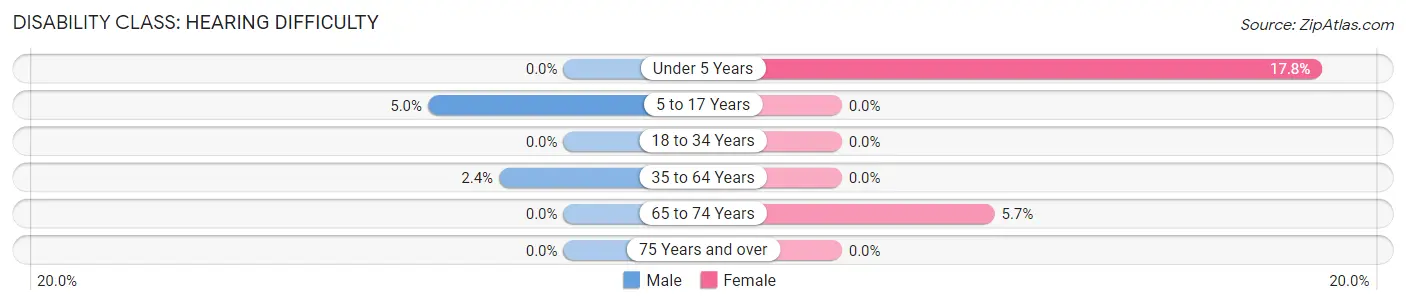
| Age Bracket | Male | Female |
| Under 5 Years | 0 (0.0%) | 23 (17.8%) |
| 5 to 17 Years | 9 (5.0%) | 0 (0.0%) |
| 18 to 34 Years | 0 (0.0%) | 0 (0.0%) |
| 35 to 64 Years | 18 (2.4%) | 0 (0.0%) |
| 65 to 74 Years | 0 (0.0%) | 11 (5.7%) |
| 75 Years and over | 0 (0.0%) | 0 (0.0%) |
Disability Class: Vision Difficulty
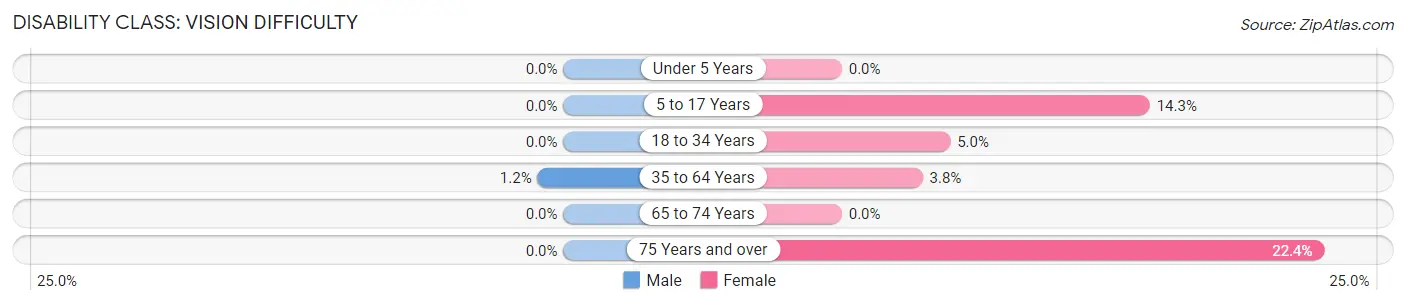
| Age Bracket | Male | Female |
| Under 5 Years | 0 (0.0%) | 0 (0.0%) |
| 5 to 17 Years | 0 (0.0%) | 22 (14.3%) |
| 18 to 34 Years | 0 (0.0%) | 17 (5.0%) |
| 35 to 64 Years | 9 (1.2%) | 33 (3.7%) |
| 65 to 74 Years | 0 (0.0%) | 0 (0.0%) |
| 75 Years and over | 0 (0.0%) | 30 (22.4%) |
Disability Class: Cognitive Difficulty
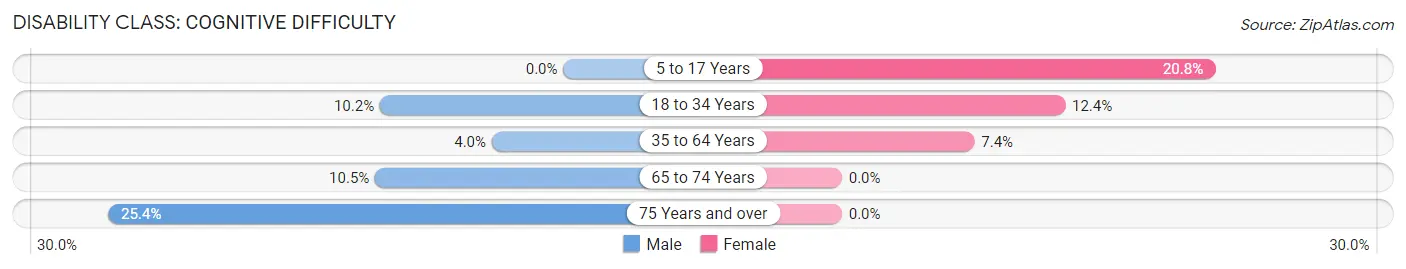
| Age Bracket | Male | Female |
| 5 to 17 Years | 0 (0.0%) | 32 (20.8%) |
| 18 to 34 Years | 49 (10.2%) | 42 (12.4%) |
| 35 to 64 Years | 30 (4.0%) | 65 (7.4%) |
| 65 to 74 Years | 11 (10.5%) | 0 (0.0%) |
| 75 Years and over | 18 (25.4%) | 0 (0.0%) |
Disability Class: Ambulatory Difficulty
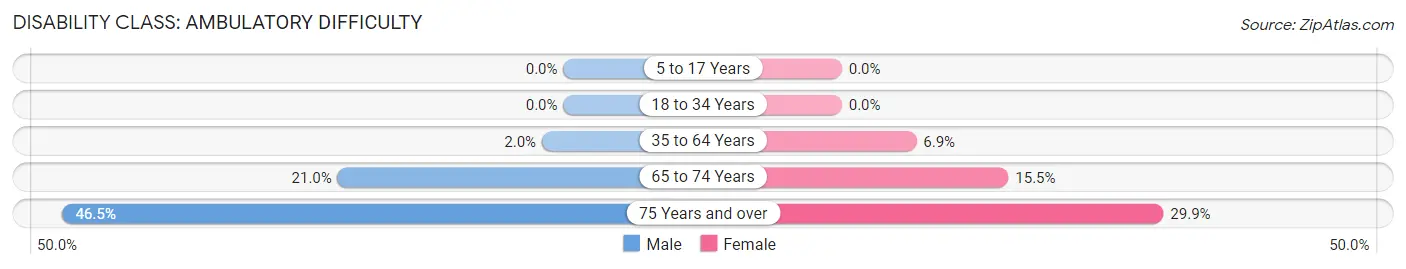
| Age Bracket | Male | Female |
| 5 to 17 Years | 0 (0.0%) | 0 (0.0%) |
| 18 to 34 Years | 0 (0.0%) | 0 (0.0%) |
| 35 to 64 Years | 15 (2.0%) | 61 (6.9%) |
| 65 to 74 Years | 22 (20.9%) | 30 (15.5%) |
| 75 Years and over | 33 (46.5%) | 40 (29.8%) |
Disability Class: Self-Care Difficulty
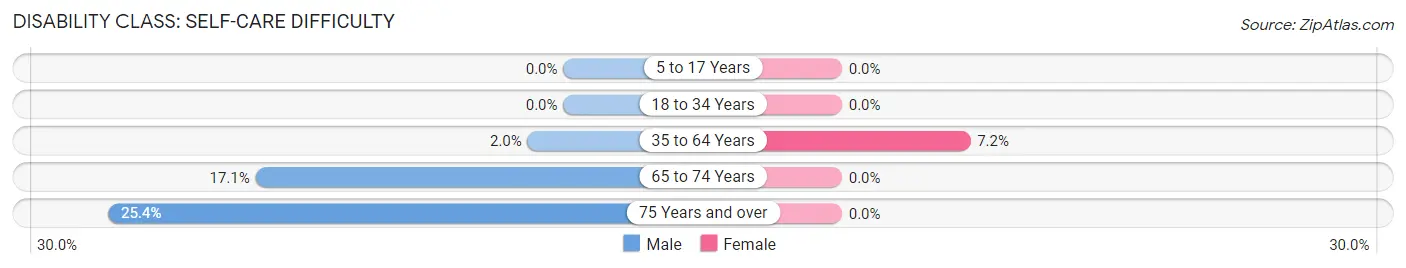
| Age Bracket | Male | Female |
| 5 to 17 Years | 0 (0.0%) | 0 (0.0%) |
| 18 to 34 Years | 0 (0.0%) | 0 (0.0%) |
| 35 to 64 Years | 15 (2.0%) | 63 (7.1%) |
| 65 to 74 Years | 18 (17.1%) | 0 (0.0%) |
| 75 Years and over | 18 (25.4%) | 0 (0.0%) |
Technology Access in Netcong borough
Computing Device Access in Netcong borough
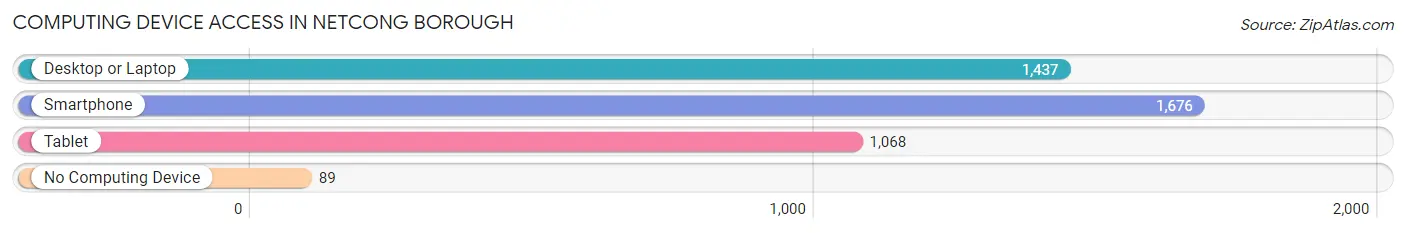
| Device Type | # Households | % Households |
| Desktop or Laptop | 1,437 | 76.8% |
| Smartphone | 1,676 | 89.6% |
| Tablet | 1,068 | 57.1% |
| No Computing Device | 89 | 4.8% |
| Total | 1,870 | 100.0% |
Internet Access in Netcong borough
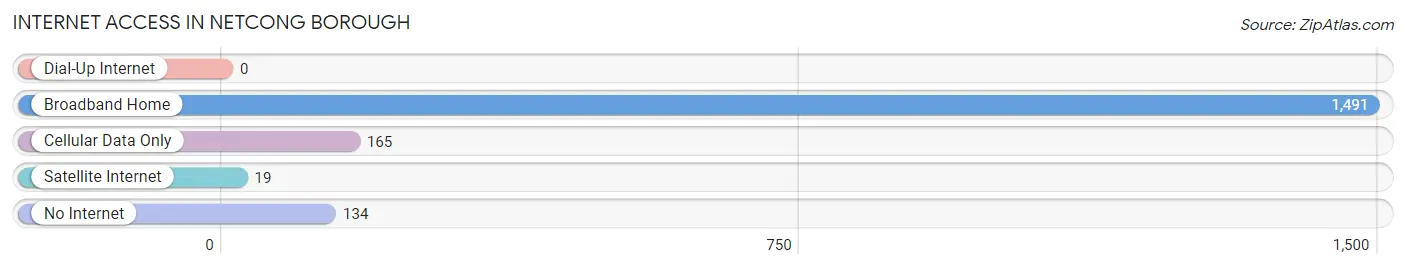
| Internet Type | # Households | % Households |
| Dial-Up Internet | 0 | 0.0% |
| Broadband Home | 1,491 | 79.7% |
| Cellular Data Only | 165 | 8.8% |
| Satellite Internet | 19 | 1.0% |
| No Internet | 134 | 7.2% |
| Total | 1,870 | 100.0% |
Netcong borough Summary
Congrats on your assignment! This is a great opportunity to learn more about the history, geography, economy, and demographics of Netcong Borough, NJ.
Netcong Borough is a small borough located in Morris County, New Jersey. It is situated in the northern part of the state, just south of the New York border. The borough is bordered by the towns of Mount Olive, Roxbury, and Byram. Netcong is a small, rural community with a population of just over 2,000 people.
The history of Netcong Borough dates back to the late 1700s, when it was first settled by Dutch and English settlers. The area was originally known as “Netcong”, which is derived from the Lenape word “Nechtauk”, meaning “place of many hills”. The area was first incorporated as a borough in 1872.
The geography of Netcong Borough is characterized by rolling hills and valleys. The borough is located in the Kittatinny Valley, which is part of the Great Appalachian Valley. The borough is also home to the Musconetcong River, which runs through the center of the borough.
The economy of Netcong Borough is largely based on agriculture and tourism. The borough is home to several farms, which produce a variety of fruits and vegetables. The borough is also home to several small businesses, including restaurants, retail stores, and professional services.
The demographics of Netcong Borough are largely white, with a small percentage of African Americans and Hispanics. The median household income is approximately $60,000, and the median home value is around $250,000. The borough is also home to a large number of retirees, as well as a growing number of young professionals.
Netcong Borough is a small, rural community with a rich history and a vibrant economy. The borough is home to a diverse population, and offers a variety of recreational activities and attractions. The borough is a great place to live, work, and play, and is a great example of a small town in New Jersey.
Common Questions
What is Per Capita Income in Netcong borough?
Per Capita income in Netcong borough is $54,439.
What is the Median Family Income in Netcong borough?
Median Family Income in Netcong borough is $93,371.
What is the Median Household income in Netcong borough?
Median Household Income in Netcong borough is $83,125.
What is Income or Wage Gap in Netcong borough?
Income or Wage Gap in Netcong borough is 9.3%.
Women in Netcong borough earn 90.7 cents for every dollar earned by a man.
What is Inequality or Gini Index in Netcong borough?
Inequality or Gini Index in Netcong borough is 0.39.
What is the Total Population of Netcong borough?
Total Population of Netcong borough is 3,484.
What is the Total Male Population of Netcong borough?
Total Male Population of Netcong borough is 1,654.
What is the Total Female Population of Netcong borough?
Total Female Population of Netcong borough is 1,830.
What is the Ratio of Males per 100 Females in Netcong borough?
There are 90.38 Males per 100 Females in Netcong borough.
What is the Ratio of Females per 100 Males in Netcong borough?
There are 110.64 Females per 100 Males in Netcong borough.
What is the Median Population Age in Netcong borough?
Median Population Age in Netcong borough is 43.8 Years.
What is the Average Family Size in Netcong borough
Average Family Size in Netcong borough is 2.5 People.
What is the Average Household Size in Netcong borough
Average Household Size in Netcong borough is 1.9 People.
How Large is the Labor Force in Netcong borough?
There are 2,134 People in the Labor Forcein in Netcong borough.
What is the Percentage of People in the Labor Force in Netcong borough?
70.6% of People are in the Labor Force in Netcong borough.
What is the Unemployment Rate in Netcong borough?
Unemployment Rate in Netcong borough is 2.1%.