Ogdensburg borough, NJ Map & Demographics
Ogdensburg borough Overview
$46,674
PER CAPITA INCOME
$116,161
AVG FAMILY INCOME
$107,569
AVG HOUSEHOLD INCOME
32.7%
WAGE / INCOME GAP [ % ]
67.3¢/ $1
WAGE / INCOME GAP [ $ ]
0.37
INEQUALITY / GINI INDEX
2,215
TOTAL POPULATION
1,106
MALE POPULATION
1,109
FEMALE POPULATION
99.73
MALES / 100 FEMALES
100.27
FEMALES / 100 MALES
42.0
MEDIAN AGE
3.0
AVG FAMILY SIZE
2.7
AVG HOUSEHOLD SIZE
1,392
LABOR FORCE [ PEOPLE ]
74.3%
PERCENT IN LABOR FORCE
12.6%
UNEMPLOYMENT RATE
Income in Ogdensburg borough
Income Overview in Ogdensburg borough
Per Capita Income in Ogdensburg borough is $46,674, while median incomes of families and households are $116,161 and $107,569 respectively.
| Characteristic | Number | Measure |
| Per Capita Income | 2,215 | $46,674 |
| Median Family Income | 599 | $116,161 |
| Mean Family Income | 599 | $122,110 |
| Median Household Income | 827 | $107,569 |
| Mean Household Income | 827 | $122,226 |
| Income Deficit | 599 | $0 |
| Wage / Income Gap (%) | 2,215 | 32.73% |
| Wage / Income Gap ($) | 2,215 | 67.27¢ per $1 |
| Gini / Inequality Index | 2,215 | 0.37 |
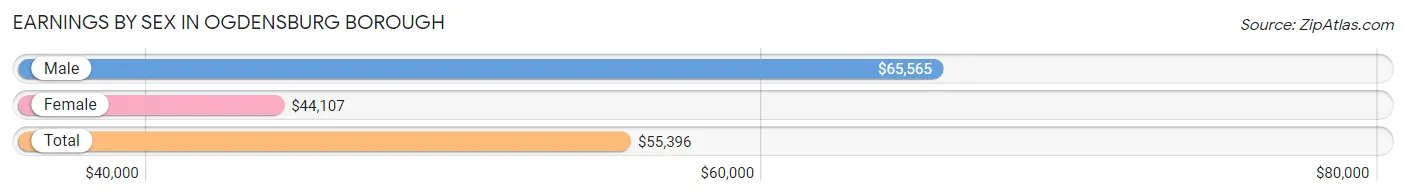
Earnings by Sex in Ogdensburg borough
Average Earnings in Ogdensburg borough are $55,396, $65,565 for men and $44,107 for women, a difference of 32.7%.
| Sex | Number | Average Earnings |
| Male | 710 (54.3%) | $65,565 |
| Female | 597 (45.7%) | $44,107 |
| Total | 1,307 (100.0%) | $55,396 |
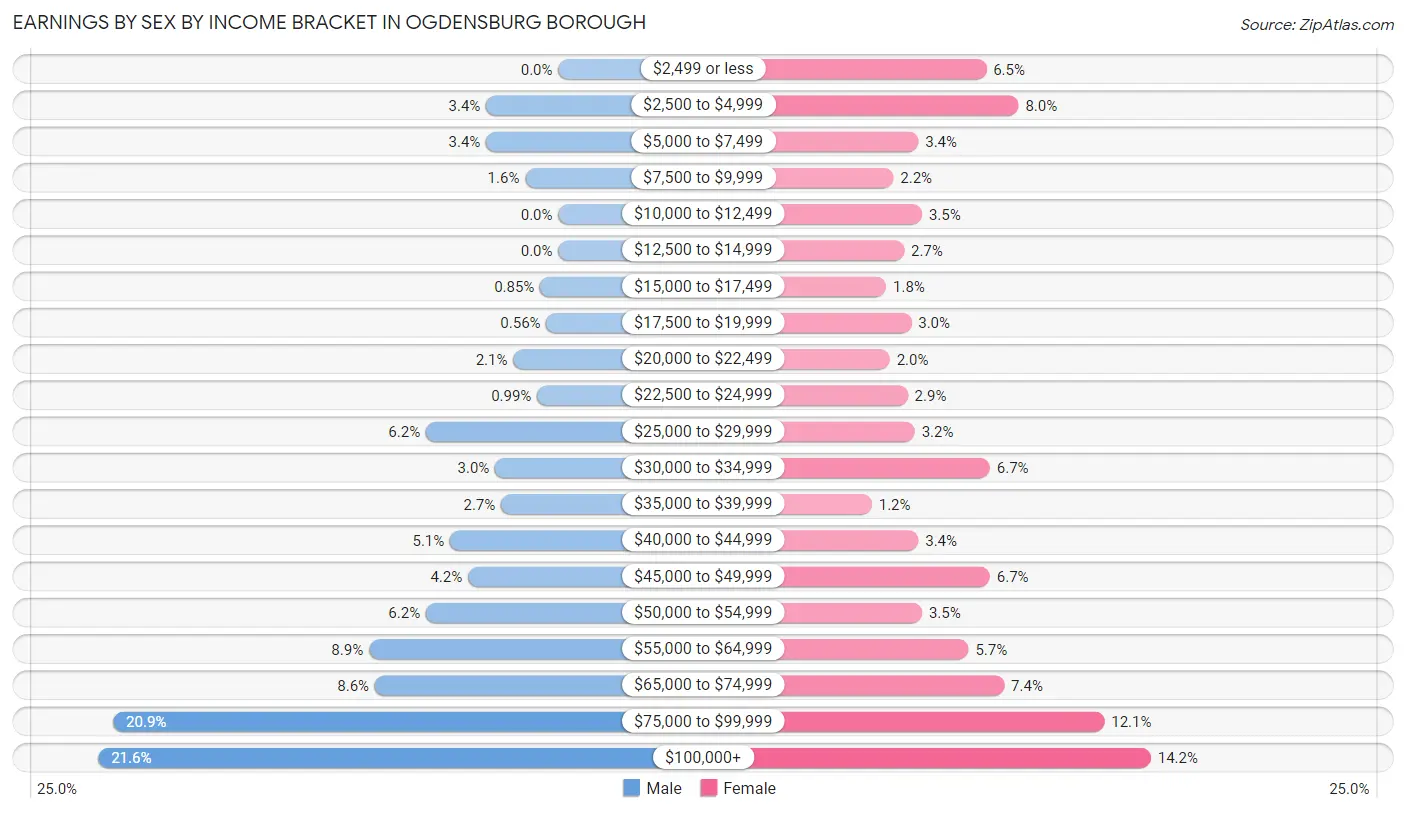
Earnings by Sex by Income Bracket in Ogdensburg borough
The most common earnings brackets in Ogdensburg borough are $100,000+ for men (153 | 21.5%) and $100,000+ for women (85 | 14.2%).
| Income | Male | Female |
| $2,499 or less | 0 (0.0%) | 39 (6.5%) |
| $2,500 to $4,999 | 24 (3.4%) | 48 (8.0%) |
| $5,000 to $7,499 | 24 (3.4%) | 20 (3.4%) |
| $7,500 to $9,999 | 11 (1.5%) | 13 (2.2%) |
| $10,000 to $12,499 | 0 (0.0%) | 21 (3.5%) |
| $12,500 to $14,999 | 0 (0.0%) | 16 (2.7%) |
| $15,000 to $17,499 | 6 (0.9%) | 11 (1.8%) |
| $17,500 to $19,999 | 4 (0.6%) | 18 (3.0%) |
| $20,000 to $22,499 | 15 (2.1%) | 12 (2.0%) |
| $22,500 to $24,999 | 7 (1.0%) | 17 (2.9%) |
| $25,000 to $29,999 | 44 (6.2%) | 19 (3.2%) |
| $30,000 to $34,999 | 21 (3.0%) | 40 (6.7%) |
| $35,000 to $39,999 | 19 (2.7%) | 7 (1.2%) |
| $40,000 to $44,999 | 36 (5.1%) | 20 (3.4%) |
| $45,000 to $49,999 | 30 (4.2%) | 40 (6.7%) |
| $50,000 to $54,999 | 44 (6.2%) | 21 (3.5%) |
| $55,000 to $64,999 | 63 (8.9%) | 34 (5.7%) |
| $65,000 to $74,999 | 61 (8.6%) | 44 (7.4%) |
| $75,000 to $99,999 | 148 (20.8%) | 72 (12.1%) |
| $100,000+ | 153 (21.5%) | 85 (14.2%) |
| Total | 710 (100.0%) | 597 (100.0%) |
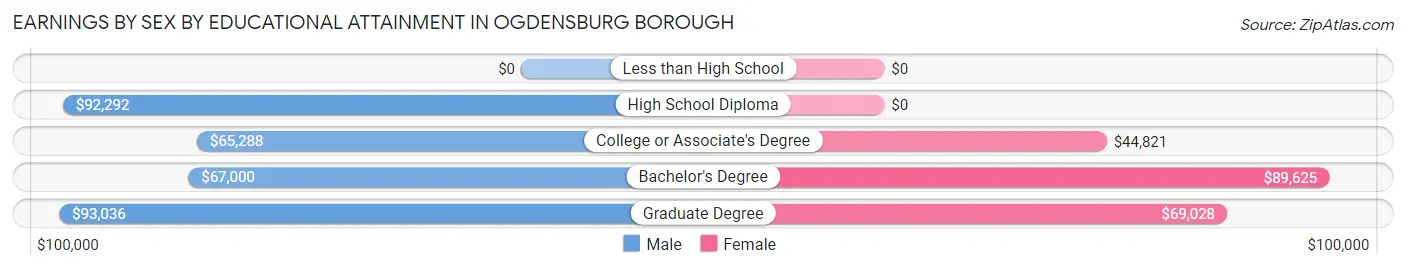
Earnings by Sex by Educational Attainment in Ogdensburg borough
Average earnings in Ogdensburg borough are $69,167 for men and $50,938 for women, a difference of 26.4%. Men with an educational attainment of graduate degree enjoy the highest average annual earnings of $93,036, while those with college or associate's degree education earn the least with $65,288. Women with an educational attainment of bachelor's degree earn the most with the average annual earnings of $89,625, while those with college or associate's degree education have the smallest earnings of $44,821.
| Educational Attainment | Male Income | Female Income |
| Less than High School | - | - |
| High School Diploma | $92,292 | $0 |
| College or Associate's Degree | $65,288 | $44,821 |
| Bachelor's Degree | $67,000 | $89,625 |
| Graduate Degree | $93,036 | $69,028 |
| Total | $69,167 | $50,938 |
Family Income in Ogdensburg borough
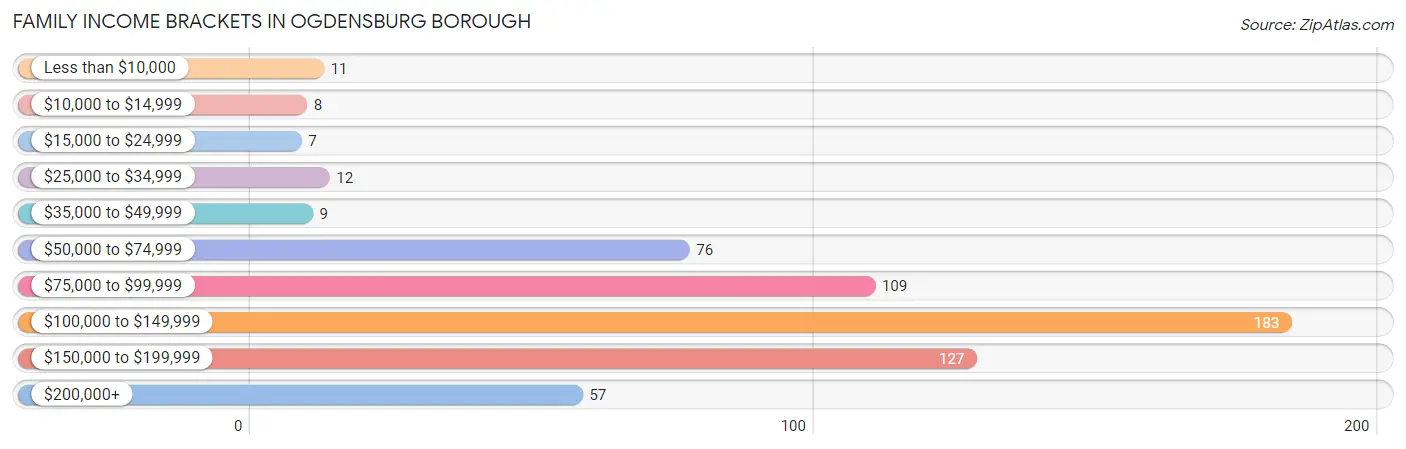
Family Income Brackets in Ogdensburg borough
According to the Ogdensburg borough family income data, there are 183 families falling into the $100,000 to $149,999 income range, which is the most common income bracket and makes up 30.5% of all families. Conversely, the $15,000 to $24,999 income bracket is the least frequent group with only 7 families (1.2%) belonging to this category.
| Income Bracket | # Families | % Families |
| Less than $10,000 | 11 | 1.8% |
| $10,000 to $14,999 | 8 | 1.3% |
| $15,000 to $24,999 | 7 | 1.2% |
| $25,000 to $34,999 | 12 | 2.0% |
| $35,000 to $49,999 | 9 | 1.5% |
| $50,000 to $74,999 | 76 | 12.7% |
| $75,000 to $99,999 | 109 | 18.2% |
| $100,000 to $149,999 | 183 | 30.6% |
| $150,000 to $199,999 | 127 | 21.2% |
| $200,000+ | 57 | 9.5% |
Family Income by Famaliy Size in Ogdensburg borough
5-person families (70 | 11.7%) account for the highest median family income in Ogdensburg borough with $131,458 per family, while 2-person families (252 | 42.1%) have the highest median income of $53,572 per family member.
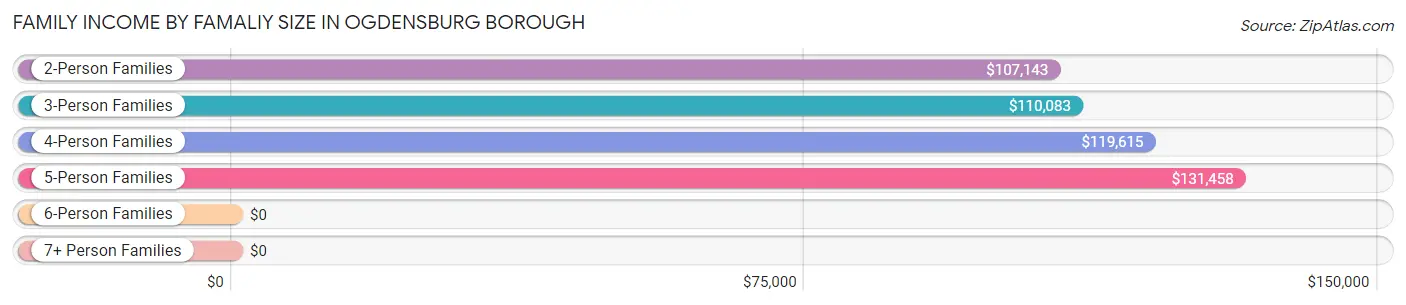
| Income Bracket | # Families | Median Income |
| 2-Person Families | 252 (42.1%) | $107,143 |
| 3-Person Families | 137 (22.9%) | $110,083 |
| 4-Person Families | 140 (23.4%) | $119,615 |
| 5-Person Families | 70 (11.7%) | $131,458 |
| 6-Person Families | 0 (0.0%) | $0 |
| 7+ Person Families | 0 (0.0%) | $0 |
| Total | 599 (100.0%) | $116,161 |
Family Income by Number of Earners in Ogdensburg borough
The median family income in Ogdensburg borough is $116,161, with families comprising 3+ earners (84) having the highest median family income of $132,292, while families with no earners (55) have the lowest median family income of $77,656, accounting for 14.0% and 9.2% of families, respectively.
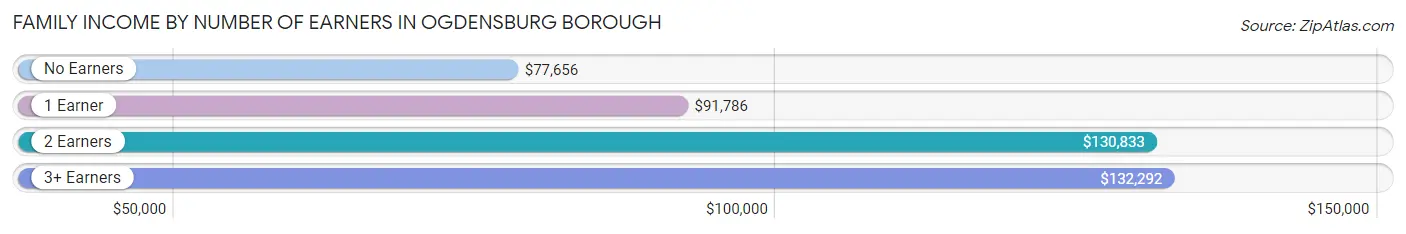
| Number of Earners | # Families | Median Income |
| No Earners | 55 (9.2%) | $77,656 |
| 1 Earner | 132 (22.0%) | $91,786 |
| 2 Earners | 328 (54.8%) | $130,833 |
| 3+ Earners | 84 (14.0%) | $132,292 |
| Total | 599 (100.0%) | $116,161 |
Household Income in Ogdensburg borough
Household Income Brackets in Ogdensburg borough
With 195 households falling in the category, the $100,000 to $149,999 income range is the most frequent in Ogdensburg borough, accounting for 23.6% of all households. In contrast, only 8 households (1.0%) fall into the $10,000 to $14,999 income bracket, making it the least populous group.
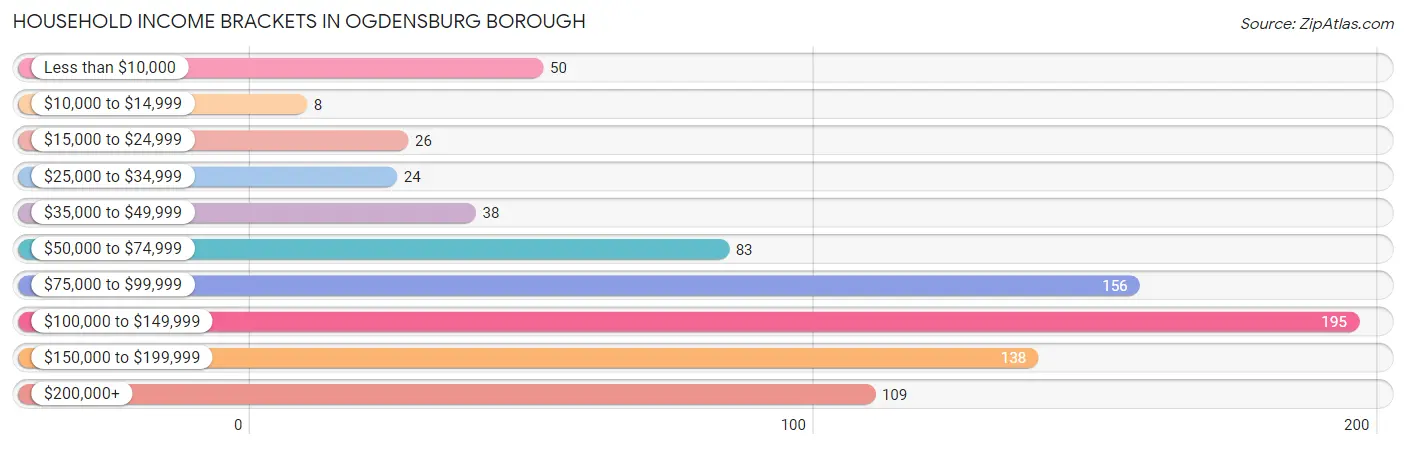
| Income Bracket | # Households | % Households |
| Less than $10,000 | 50 | 6.0% |
| $10,000 to $14,999 | 8 | 1.0% |
| $15,000 to $24,999 | 26 | 3.1% |
| $25,000 to $34,999 | 24 | 2.9% |
| $35,000 to $49,999 | 38 | 4.6% |
| $50,000 to $74,999 | 83 | 10.0% |
| $75,000 to $99,999 | 156 | 18.9% |
| $100,000 to $149,999 | 195 | 23.6% |
| $150,000 to $199,999 | 138 | 16.7% |
| $200,000+ | 109 | 13.2% |
Household Income by Householder Age in Ogdensburg borough
The median household income in Ogdensburg borough is $107,569, with the highest median household income of $131,083 found in the 45 to 64 years age bracket for the primary householder. A total of 321 households (38.8%) fall into this category.
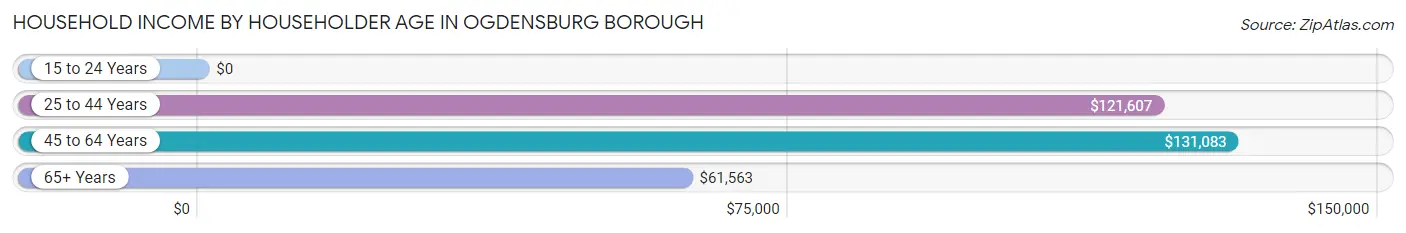
| Income Bracket | # Households | Median Income |
| 15 to 24 Years | 0 (0.0%) | $0 |
| 25 to 44 Years | 251 (30.3%) | $121,607 |
| 45 to 64 Years | 321 (38.8%) | $131,083 |
| 65+ Years | 255 (30.8%) | $61,563 |
| Total | 827 (100.0%) | $107,569 |
Poverty in Ogdensburg borough
Income Below Poverty by Sex and Age in Ogdensburg borough
With 3.4% poverty level for males and 8.3% for females among the residents of Ogdensburg borough, 35 to 44 year old males and 75 year old and over females are the most vulnerable to poverty, with 21 males (12.1%) and 50 females (40.0%) in their respective age groups living below the poverty level.
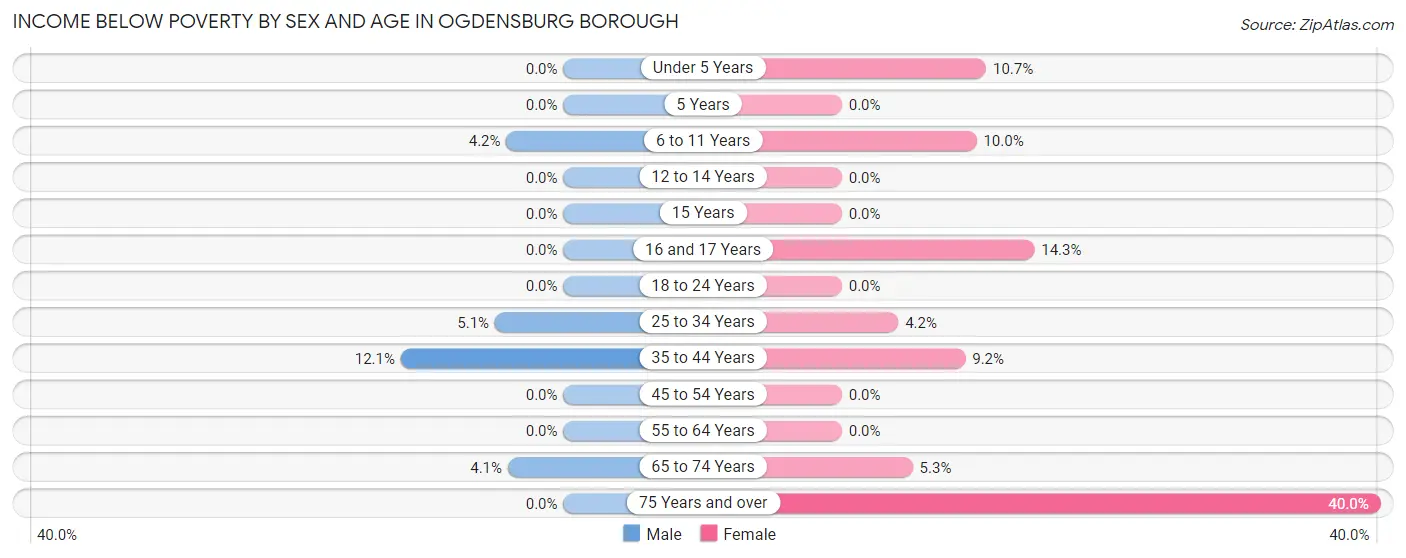
| Age Bracket | Male | Female |
| Under 5 Years | 0 (0.0%) | 6 (10.7%) |
| 5 Years | 0 (0.0%) | 0 (0.0%) |
| 6 to 11 Years | 3 (4.2%) | 8 (10.0%) |
| 12 to 14 Years | 0 (0.0%) | 0 (0.0%) |
| 15 Years | 0 (0.0%) | 0 (0.0%) |
| 16 and 17 Years | 0 (0.0%) | 5 (14.3%) |
| 18 to 24 Years | 0 (0.0%) | 0 (0.0%) |
| 25 to 34 Years | 9 (5.1%) | 8 (4.2%) |
| 35 to 44 Years | 21 (12.1%) | 10 (9.2%) |
| 45 to 54 Years | 0 (0.0%) | 0 (0.0%) |
| 55 to 64 Years | 0 (0.0%) | 0 (0.0%) |
| 65 to 74 Years | 4 (4.1%) | 5 (5.3%) |
| 75 Years and over | 0 (0.0%) | 50 (40.0%) |
| Total | 37 (3.4%) | 92 (8.3%) |
Income Above Poverty by Sex and Age in Ogdensburg borough
According to the poverty statistics in Ogdensburg borough, males aged under 5 years and females aged 5 years are the age groups that are most secure financially, with 100.0% of males and 100.0% of females in these age groups living above the poverty line.
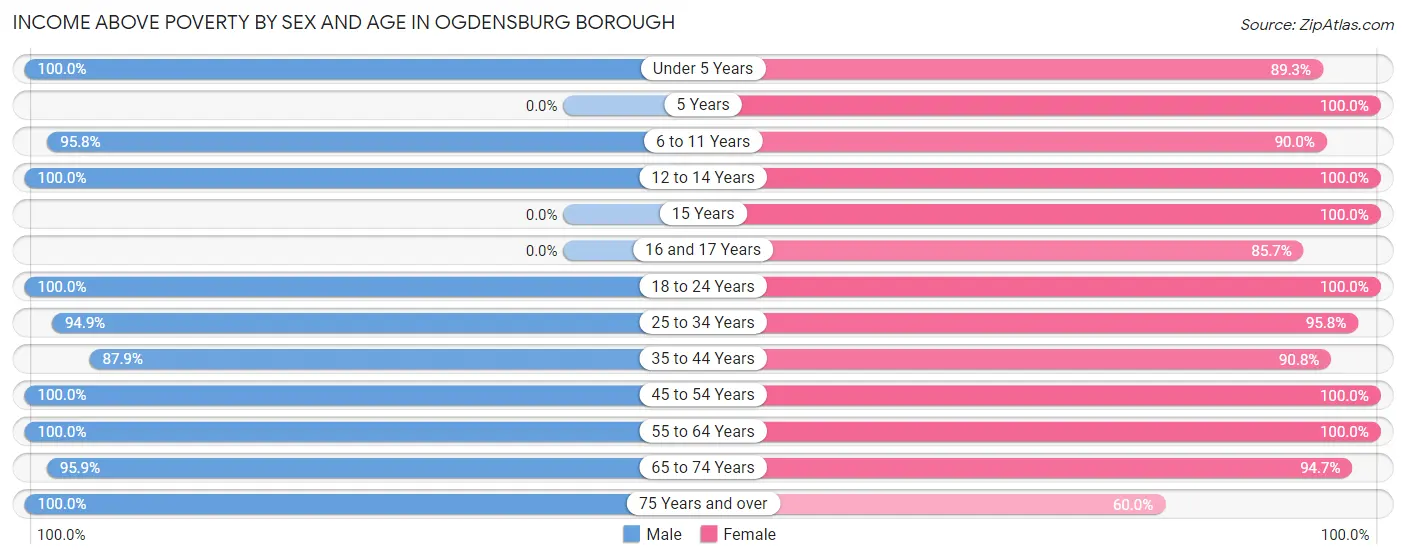
| Age Bracket | Male | Female |
| Under 5 Years | 36 (100.0%) | 50 (89.3%) |
| 5 Years | 0 (0.0%) | 7 (100.0%) |
| 6 to 11 Years | 68 (95.8%) | 72 (90.0%) |
| 12 to 14 Years | 39 (100.0%) | 45 (100.0%) |
| 15 Years | 0 (0.0%) | 7 (100.0%) |
| 16 and 17 Years | 0 (0.0%) | 30 (85.7%) |
| 18 to 24 Years | 103 (100.0%) | 75 (100.0%) |
| 25 to 34 Years | 168 (94.9%) | 183 (95.8%) |
| 35 to 44 Years | 153 (87.9%) | 99 (90.8%) |
| 45 to 54 Years | 147 (100.0%) | 114 (100.0%) |
| 55 to 64 Years | 195 (100.0%) | 170 (100.0%) |
| 65 to 74 Years | 93 (95.9%) | 90 (94.7%) |
| 75 Years and over | 67 (100.0%) | 75 (60.0%) |
| Total | 1,069 (96.7%) | 1,017 (91.7%) |
Income Below Poverty Among Married-Couple Families in Ogdensburg borough
The poverty statistics for married-couple families in Ogdensburg borough show that 2.4% or 12 of the total 508 families live below the poverty line. Families with 1 or 2 children have the highest poverty rate of 6.2%, comprising of 12 families. On the other hand, families with no children have the lowest poverty rate of 0.0%, which includes 0 families.
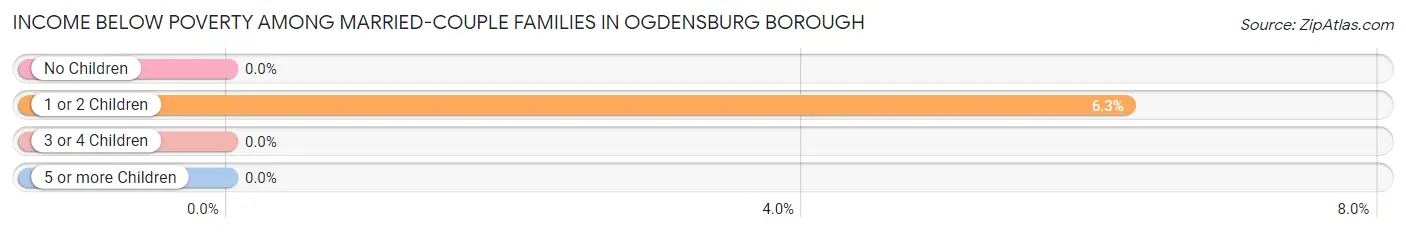
| Children | Above Poverty | Below Poverty |
| No Children | 304 (100.0%) | 0 (0.0%) |
| 1 or 2 Children | 180 (93.8%) | 12 (6.2%) |
| 3 or 4 Children | 12 (100.0%) | 0 (0.0%) |
| 5 or more Children | 0 (0.0%) | 0 (0.0%) |
| Total | 496 (97.6%) | 12 (2.4%) |
Income Below Poverty Among Single-Parent Households in Ogdensburg borough
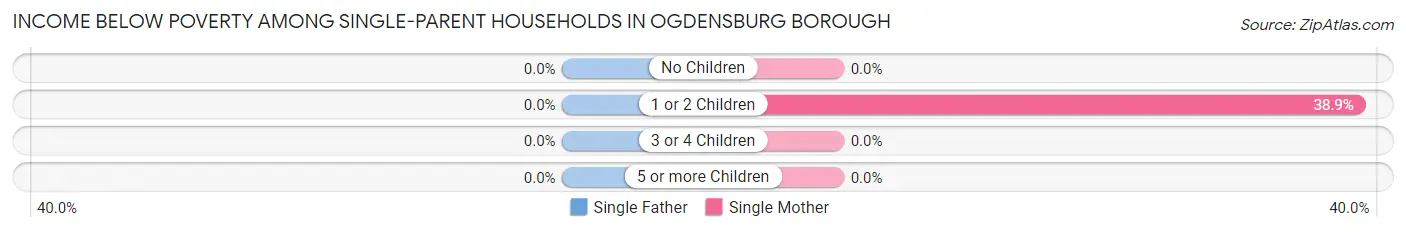
| Children | Single Father | Single Mother |
| No Children | 0 (0.0%) | 0 (0.0%) |
| 1 or 2 Children | 0 (0.0%) | 7 (38.9%) |
| 3 or 4 Children | 0 (0.0%) | 0 (0.0%) |
| 5 or more Children | 0 (0.0%) | 0 (0.0%) |
| Total | 0 (0.0%) | 7 (11.1%) |
Income Below Poverty Among Married-Couple vs Single-Parent Households in Ogdensburg borough
The poverty data for Ogdensburg borough shows that 12 of the married-couple family households (2.4%) and 7 of the single-parent households (7.7%) are living below the poverty level. Within the married-couple family households, those with 1 or 2 children have the highest poverty rate, with 12 households (6.2%) falling below the poverty line. Among the single-parent households, those with 1 or 2 children have the highest poverty rate, with 7 household (38.9%) living below poverty.
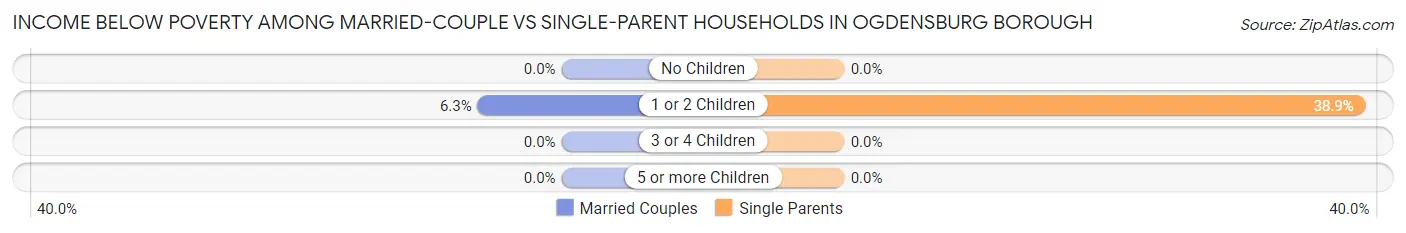
| Children | Married-Couple Families | Single-Parent Households |
| No Children | 0 (0.0%) | 0 (0.0%) |
| 1 or 2 Children | 12 (6.2%) | 7 (38.9%) |
| 3 or 4 Children | 0 (0.0%) | 0 (0.0%) |
| 5 or more Children | 0 (0.0%) | 0 (0.0%) |
| Total | 12 (2.4%) | 7 (7.7%) |
Race in Ogdensburg borough
The most populous races in Ogdensburg borough are White / Caucasian (1,926 | 87.0%), Hispanic or Latino (311 | 14.0%), and Two or more Races (161 | 7.3%).
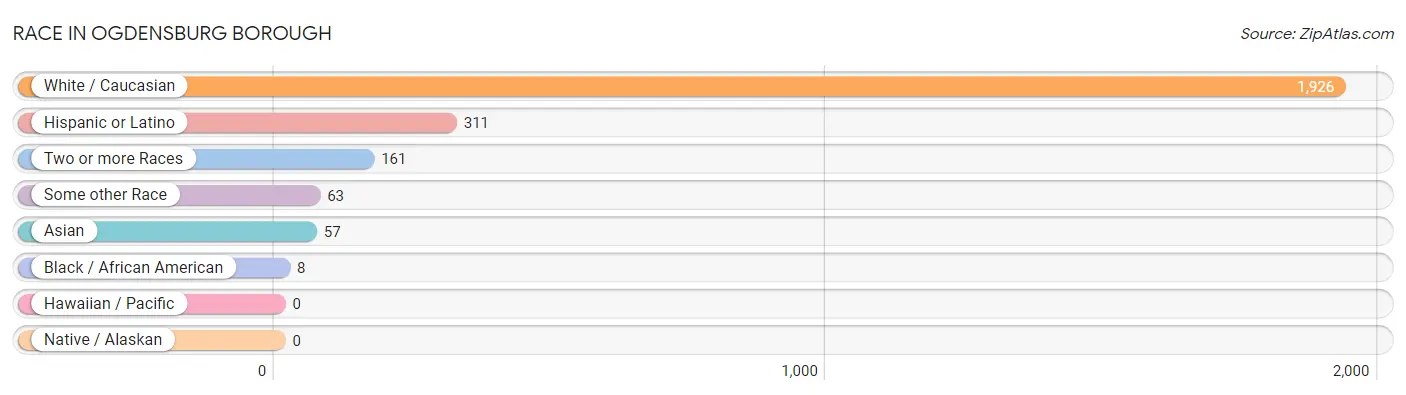
| Race | # Population | % Population |
| Asian | 57 | 2.6% |
| Black / African American | 8 | 0.4% |
| Hawaiian / Pacific | 0 | 0.0% |
| Hispanic or Latino | 311 | 14.0% |
| Native / Alaskan | 0 | 0.0% |
| White / Caucasian | 1,926 | 87.0% |
| Two or more Races | 161 | 7.3% |
| Some other Race | 63 | 2.8% |
| Total | 2,215 | 100.0% |
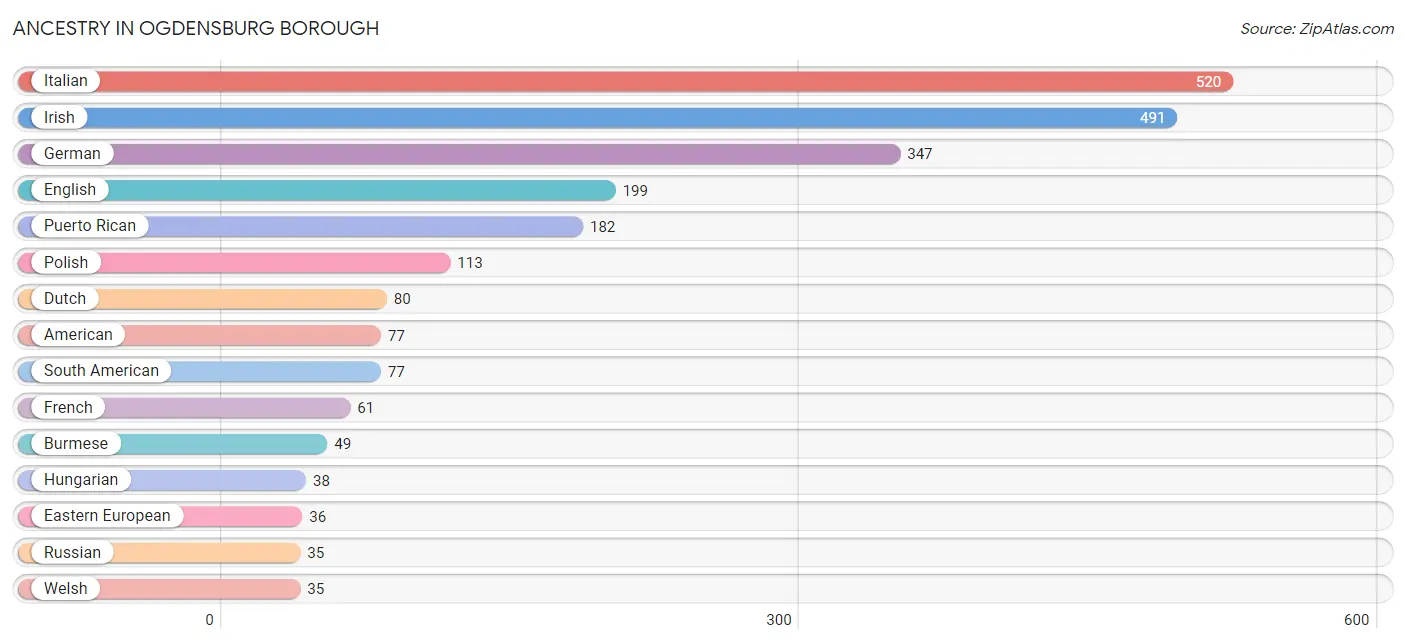
Ancestry in Ogdensburg borough
The most populous ancestries reported in Ogdensburg borough are Italian (520 | 23.5%), Irish (491 | 22.2%), German (347 | 15.7%), English (199 | 9.0%), and Puerto Rican (182 | 8.2%), together accounting for 78.5% of all Ogdensburg borough residents.
| Ancestry | # Population | % Population |
| American | 77 | 3.5% |
| Austrian | 6 | 0.3% |
| Belgian | 6 | 0.3% |
| Blackfeet | 1 | 0.1% |
| Burmese | 49 | 2.2% |
| Canadian | 10 | 0.4% |
| Central American | 28 | 1.3% |
| Chilean | 16 | 0.7% |
| Colombian | 19 | 0.9% |
| Croatian | 7 | 0.3% |
| Czech | 13 | 0.6% |
| Danish | 5 | 0.2% |
| Dutch | 80 | 3.6% |
| Eastern European | 36 | 1.6% |
| Ecuadorian | 22 | 1.0% |
| English | 199 | 9.0% |
| European | 13 | 0.6% |
| Finnish | 9 | 0.4% |
| French | 61 | 2.8% |
| German | 347 | 15.7% |
| Guatemalan | 21 | 0.9% |
| Honduran | 3 | 0.1% |
| Hungarian | 38 | 1.7% |
| Indian (Asian) | 8 | 0.4% |
| Irish | 491 | 22.2% |
| Iroquois | 13 | 0.6% |
| Italian | 520 | 23.5% |
| Lithuanian | 13 | 0.6% |
| Mexican | 11 | 0.5% |
| Norwegian | 11 | 0.5% |
| Peruvian | 20 | 0.9% |
| Polish | 113 | 5.1% |
| Portuguese | 24 | 1.1% |
| Puerto Rican | 182 | 8.2% |
| Russian | 35 | 1.6% |
| Salvadoran | 4 | 0.2% |
| Scandinavian | 4 | 0.2% |
| Scottish | 28 | 1.3% |
| Sioux | 3 | 0.1% |
| Slovak | 20 | 0.9% |
| South American | 77 | 3.5% |
| Swedish | 20 | 0.9% |
| Ukrainian | 33 | 1.5% |
| Welsh | 35 | 1.6% | View All 44 Rows |
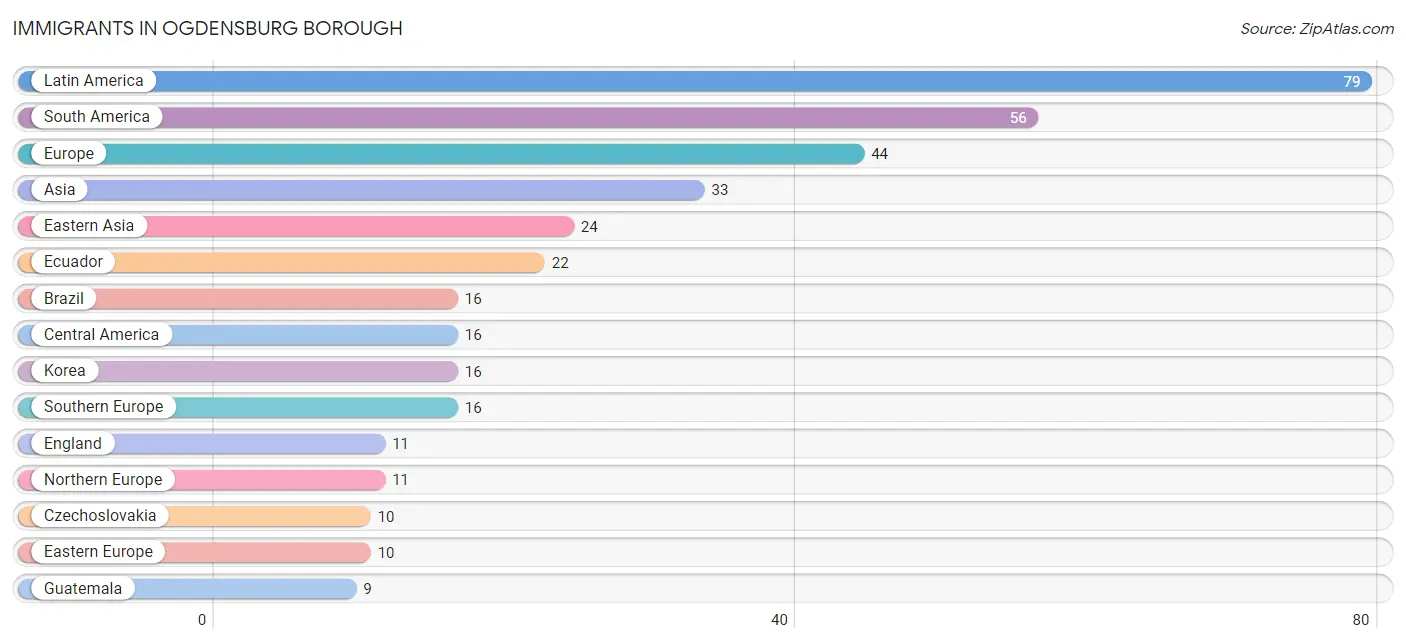
Immigrants in Ogdensburg borough
The most numerous immigrant groups reported in Ogdensburg borough came from Latin America (79 | 3.6%), South America (56 | 2.5%), Europe (44 | 2.0%), Asia (33 | 1.5%), and Eastern Asia (24 | 1.1%), together accounting for 10.7% of all Ogdensburg borough residents.
| Immigration Origin | # Population | % Population |
| Asia | 33 | 1.5% |
| Brazil | 16 | 0.7% |
| Caribbean | 7 | 0.3% |
| Central America | 16 | 0.7% |
| Chile | 3 | 0.1% |
| China | 8 | 0.4% |
| Colombia | 8 | 0.4% |
| Czechoslovakia | 10 | 0.4% |
| Dominican Republic | 7 | 0.3% |
| Eastern Asia | 24 | 1.1% |
| Eastern Europe | 10 | 0.4% |
| Ecuador | 22 | 1.0% |
| El Salvador | 4 | 0.2% |
| England | 11 | 0.5% |
| Europe | 44 | 2.0% |
| Guatemala | 9 | 0.4% |
| Honduras | 3 | 0.1% |
| Italy | 8 | 0.4% |
| Jordan | 4 | 0.2% |
| Korea | 16 | 0.7% |
| Latin America | 79 | 3.6% |
| Netherlands | 7 | 0.3% |
| Northern Europe | 11 | 0.5% |
| Peru | 7 | 0.3% |
| Portugal | 8 | 0.4% |
| South America | 56 | 2.5% |
| Southern Europe | 16 | 0.7% |
| Turkey | 5 | 0.2% |
| Western Asia | 9 | 0.4% |
| Western Europe | 7 | 0.3% | View All 30 Rows |
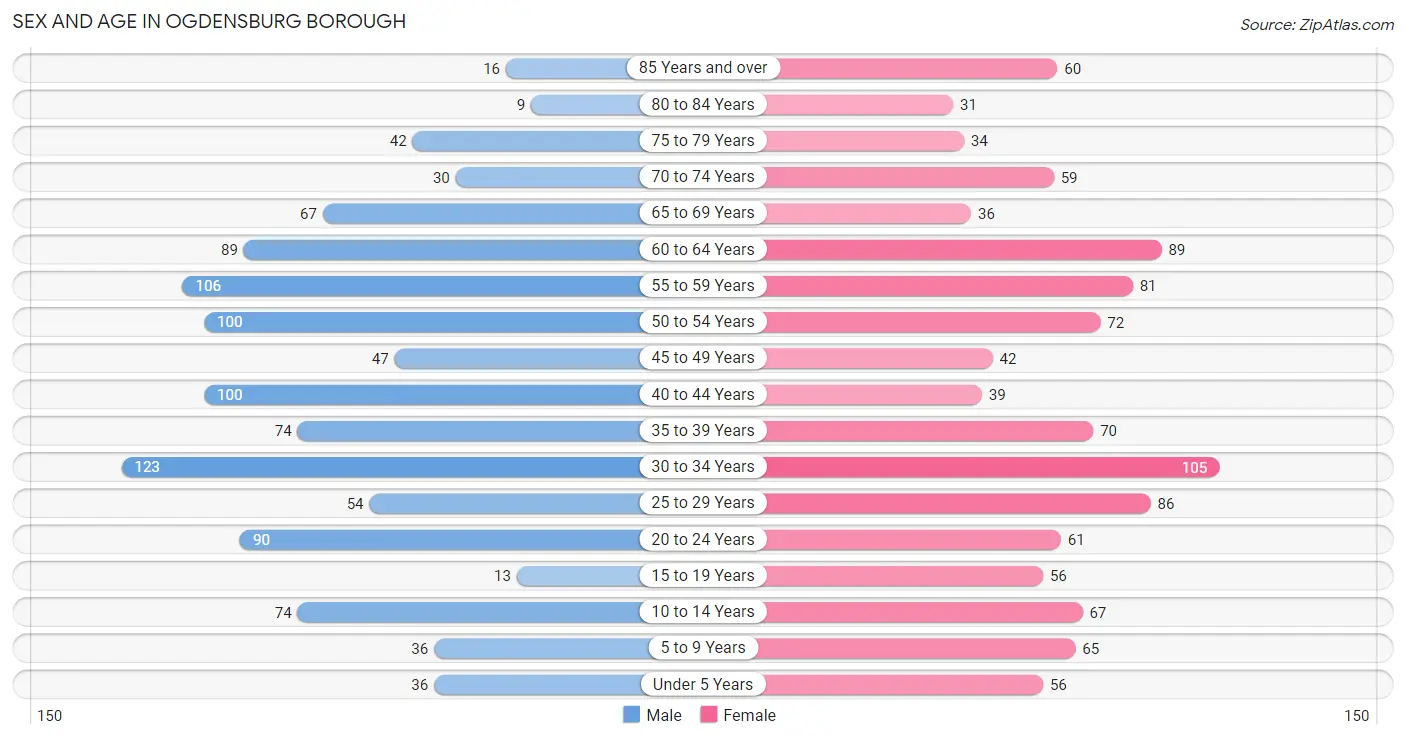
Sex and Age in Ogdensburg borough
Sex and Age in Ogdensburg borough
The most populous age groups in Ogdensburg borough are 30 to 34 Years (123 | 11.1%) for men and 30 to 34 Years (105 | 9.5%) for women.
| Age Bracket | Male | Female |
| Under 5 Years | 36 (3.3%) | 56 (5.1%) |
| 5 to 9 Years | 36 (3.3%) | 65 (5.9%) |
| 10 to 14 Years | 74 (6.7%) | 67 (6.0%) |
| 15 to 19 Years | 13 (1.2%) | 56 (5.1%) |
| 20 to 24 Years | 90 (8.1%) | 61 (5.5%) |
| 25 to 29 Years | 54 (4.9%) | 86 (7.7%) |
| 30 to 34 Years | 123 (11.1%) | 105 (9.5%) |
| 35 to 39 Years | 74 (6.7%) | 70 (6.3%) |
| 40 to 44 Years | 100 (9.0%) | 39 (3.5%) |
| 45 to 49 Years | 47 (4.3%) | 42 (3.8%) |
| 50 to 54 Years | 100 (9.0%) | 72 (6.5%) |
| 55 to 59 Years | 106 (9.6%) | 81 (7.3%) |
| 60 to 64 Years | 89 (8.1%) | 89 (8.0%) |
| 65 to 69 Years | 67 (6.1%) | 36 (3.3%) |
| 70 to 74 Years | 30 (2.7%) | 59 (5.3%) |
| 75 to 79 Years | 42 (3.8%) | 34 (3.1%) |
| 80 to 84 Years | 9 (0.8%) | 31 (2.8%) |
| 85 Years and over | 16 (1.5%) | 60 (5.4%) |
| Total | 1,106 (100.0%) | 1,109 (100.0%) |
Families and Households in Ogdensburg borough
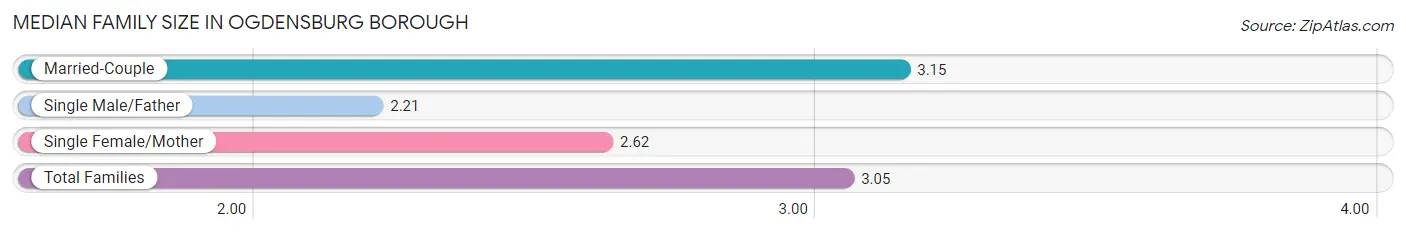
Median Family Size in Ogdensburg borough
The median family size in Ogdensburg borough is 3.05 persons per family, with married-couple families (508 | 84.8%) accounting for the largest median family size of 3.15 persons per family. On the other hand, single male/father families (28 | 4.7%) represent the smallest median family size with 2.21 persons per family.
| Family Type | # Families | Family Size |
| Married-Couple | 508 (84.8%) | 3.15 |
| Single Male/Father | 28 (4.7%) | 2.21 |
| Single Female/Mother | 63 (10.5%) | 2.62 |
| Total Families | 599 (100.0%) | 3.05 |
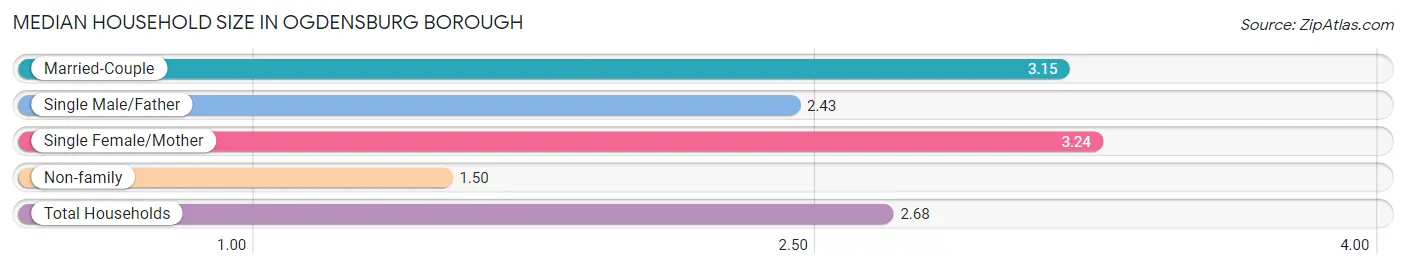
Median Household Size in Ogdensburg borough
The median household size in Ogdensburg borough is 2.68 persons per household, with single female/mother households (63 | 7.6%) accounting for the largest median household size of 3.24 persons per household. non-family households (228 | 27.6%) represent the smallest median household size with 1.50 persons per household.
| Household Type | # Households | Household Size |
| Married-Couple | 508 (61.4%) | 3.15 |
| Single Male/Father | 28 (3.4%) | 2.43 |
| Single Female/Mother | 63 (7.6%) | 3.24 |
| Non-family | 228 (27.6%) | 1.50 |
| Total Households | 827 (100.0%) | 2.68 |
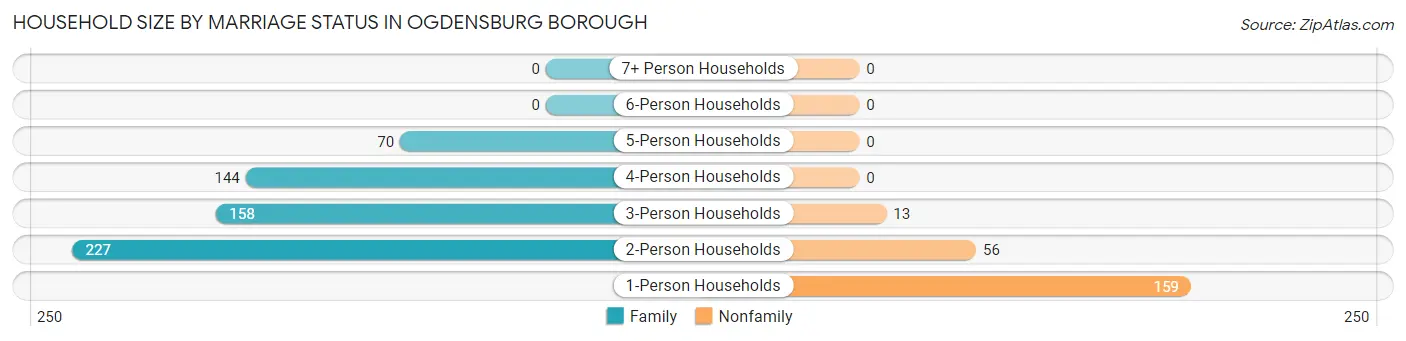
Household Size by Marriage Status in Ogdensburg borough
Out of a total of 827 households in Ogdensburg borough, 599 (72.4%) are family households, while 228 (27.6%) are nonfamily households. The most numerous type of family households are 2-person households, comprising 227, and the most common type of nonfamily households are 1-person households, comprising 159.
| Household Size | Family Households | Nonfamily Households |
| 1-Person Households | - | 159 (19.2%) |
| 2-Person Households | 227 (27.5%) | 56 (6.8%) |
| 3-Person Households | 158 (19.1%) | 13 (1.6%) |
| 4-Person Households | 144 (17.4%) | 0 (0.0%) |
| 5-Person Households | 70 (8.5%) | 0 (0.0%) |
| 6-Person Households | 0 (0.0%) | 0 (0.0%) |
| 7+ Person Households | 0 (0.0%) | 0 (0.0%) |
| Total | 599 (72.4%) | 228 (27.6%) |
Female Fertility in Ogdensburg borough
Fertility by Age in Ogdensburg borough
Average fertility rate in Ogdensburg borough is 77.0 births per 1,000 women. Women in the age bracket of 20 to 34 years have the highest fertility rate with 147.0 births per 1,000 women. Women in the age bracket of 20 to 34 years acount for 100.0% of all women with births.
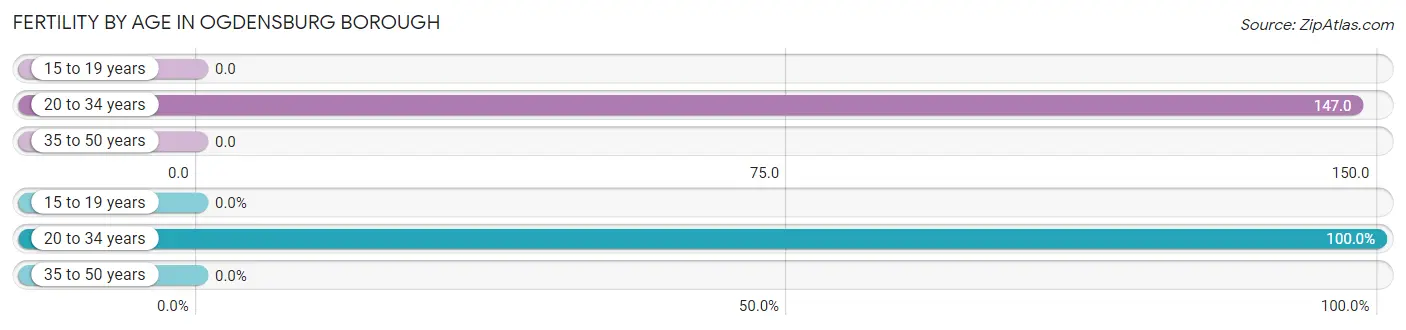
| Age Bracket | Women with Births | Births / 1,000 Women |
| 15 to 19 years | 0 (0.0%) | 0.0 |
| 20 to 34 years | 37 (100.0%) | 147.0 |
| 35 to 50 years | 0 (0.0%) | 0.0 |
| Total | 37 (100.0%) | 77.0 |
Fertility by Age by Marriage Status in Ogdensburg borough
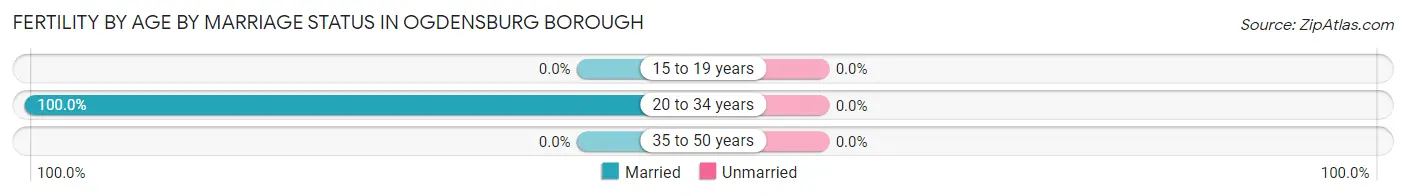
| Age Bracket | Married | Unmarried |
| 15 to 19 years | 0 (0.0%) | 0 (0.0%) |
| 20 to 34 years | 37 (100.0%) | 0 (0.0%) |
| 35 to 50 years | 0 (0.0%) | 0 (0.0%) |
| Total | 37 (100.0%) | 0 (0.0%) |
Fertility by Education in Ogdensburg borough
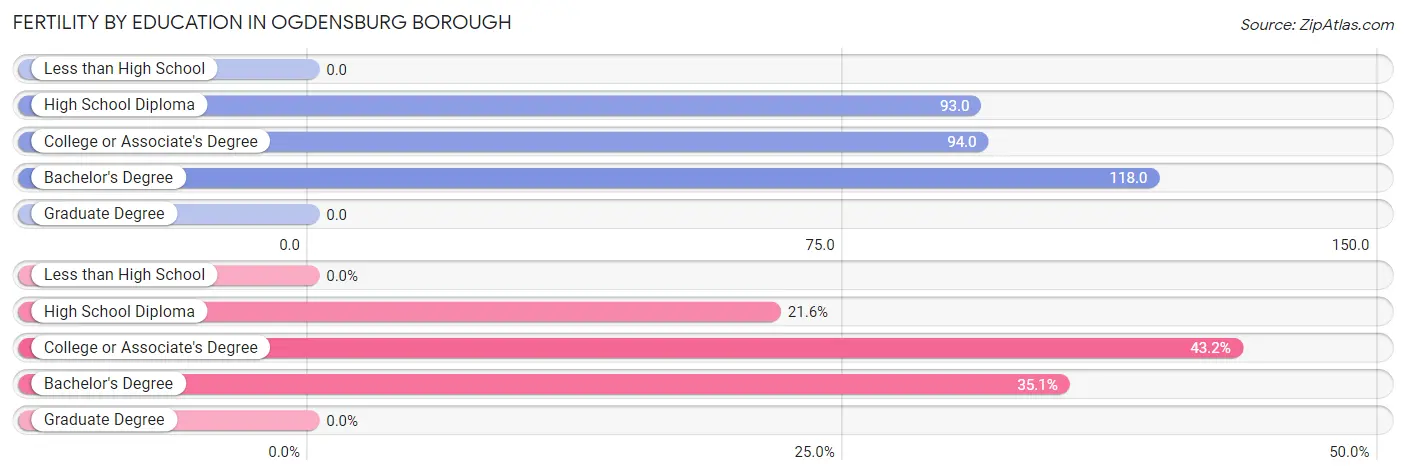
| Educational Attainment | Women with Births | Births / 1,000 Women |
| Less than High School | 0 (0.0%) | 0.0 |
| High School Diploma | 8 (21.6%) | 93.0 |
| College or Associate's Degree | 16 (43.2%) | 94.0 |
| Bachelor's Degree | 13 (35.1%) | 118.0 |
| Graduate Degree | 0 (0.0%) | 0.0 |
| Total | 37 (100.0%) | 77.0 |
Fertility by Education by Marriage Status in Ogdensburg borough
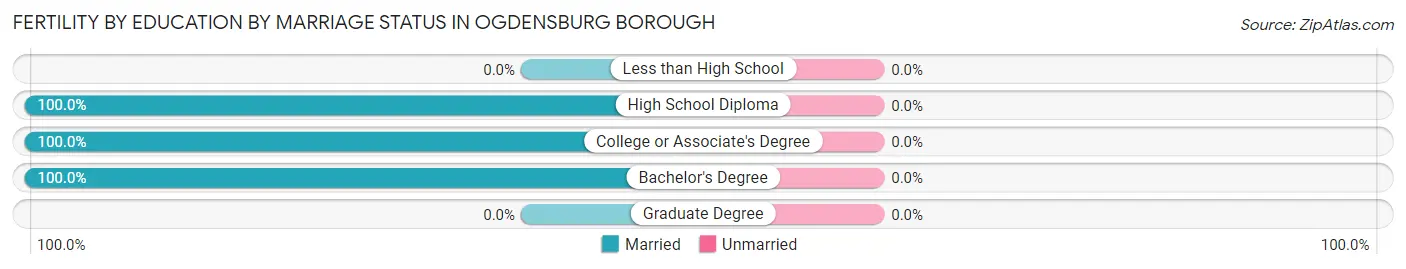
| Educational Attainment | Married | Unmarried |
| Less than High School | 0 (0.0%) | 0 (0.0%) |
| High School Diploma | 8 (100.0%) | 0 (0.0%) |
| College or Associate's Degree | 16 (100.0%) | 0 (0.0%) |
| Bachelor's Degree | 13 (100.0%) | 0 (0.0%) |
| Graduate Degree | 0 (0.0%) | 0 (0.0%) |
| Total | 37 (100.0%) | 0 (0.0%) |
Employment Characteristics in Ogdensburg borough
Employment by Class of Employer in Ogdensburg borough
Among the 1,182 employed individuals in Ogdensburg borough, private company employees (800 | 67.7%), local government employees (169 | 14.3%), and not-for-profit organizations (106 | 9.0%) make up the most common classes of employment.
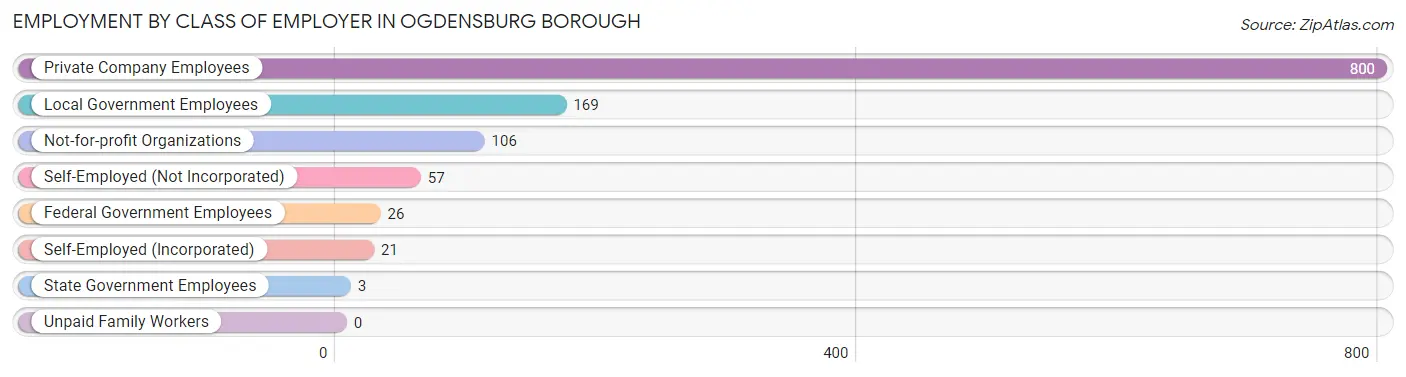
| Employer Class | # Employees | % Employees |
| Private Company Employees | 800 | 67.7% |
| Self-Employed (Incorporated) | 21 | 1.8% |
| Self-Employed (Not Incorporated) | 57 | 4.8% |
| Not-for-profit Organizations | 106 | 9.0% |
| Local Government Employees | 169 | 14.3% |
| State Government Employees | 3 | 0.3% |
| Federal Government Employees | 26 | 2.2% |
| Unpaid Family Workers | 0 | 0.0% |
| Total | 1,182 | 100.0% |
Employment Status by Age in Ogdensburg borough
According to the labor force statistics for Ogdensburg borough, out of the total population over 16 years of age (1,874), 74.3% or 1,392 individuals are in the labor force, with 12.6% or 175 of them unemployed. The age group with the highest labor force participation rate is 35 to 44 years, with 94.3% or 267 individuals in the labor force. Within the labor force, the 16 to 19 years age range has the highest percentage of unemployed individuals, with 36.1% or 13 of them being unemployed.
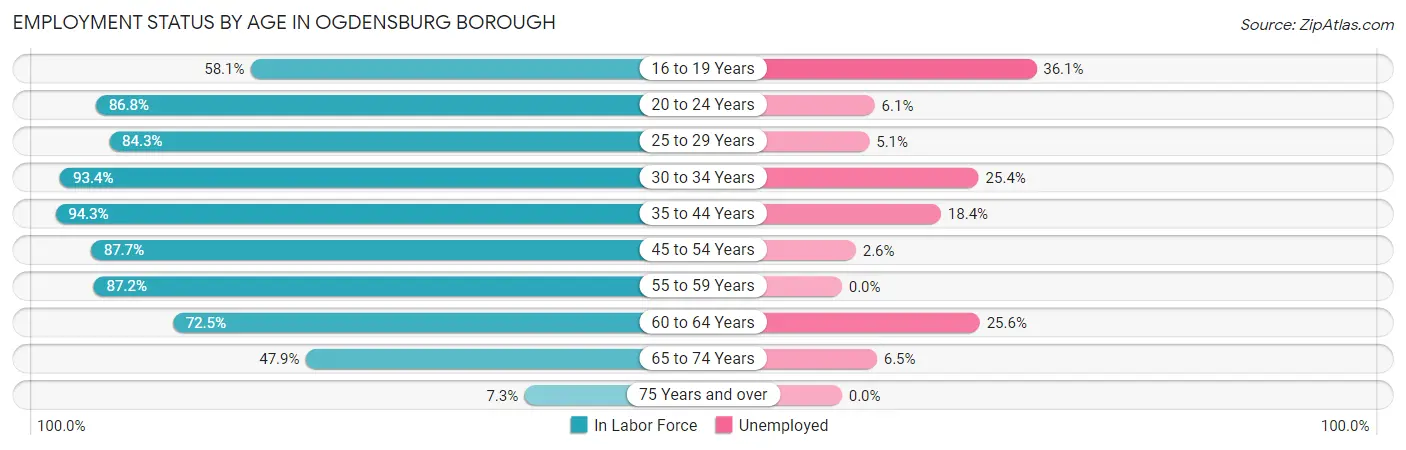
| Age Bracket | In Labor Force | Unemployed |
| 16 to 19 Years | 36 (58.1%) | 13 (36.1%) |
| 20 to 24 Years | 131 (86.8%) | 8 (6.1%) |
| 25 to 29 Years | 118 (84.3%) | 6 (5.1%) |
| 30 to 34 Years | 213 (93.4%) | 54 (25.4%) |
| 35 to 44 Years | 267 (94.3%) | 49 (18.4%) |
| 45 to 54 Years | 229 (87.7%) | 6 (2.6%) |
| 55 to 59 Years | 163 (87.2%) | 0 (0.0%) |
| 60 to 64 Years | 129 (72.5%) | 33 (25.6%) |
| 65 to 74 Years | 92 (47.9%) | 6 (6.5%) |
| 75 Years and over | 14 (7.3%) | 0 (0.0%) |
| Total | 1,392 (74.3%) | 175 (12.6%) |
Employment Status by Educational Attainment in Ogdensburg borough
According to labor force statistics for Ogdensburg borough, 87.6% of individuals (1,119) out of the total population between 25 and 64 years of age (1,277) are in the labor force, with 13.2% or 148 of them being unemployed. The group with the highest labor force participation rate are those with the educational attainment of bachelor's degree or higher, with 97.2% or 347 individuals in the labor force. Within the labor force, individuals with less than high school education have the highest percentage of unemployment, with 44.4% or 8 of them being unemployed.
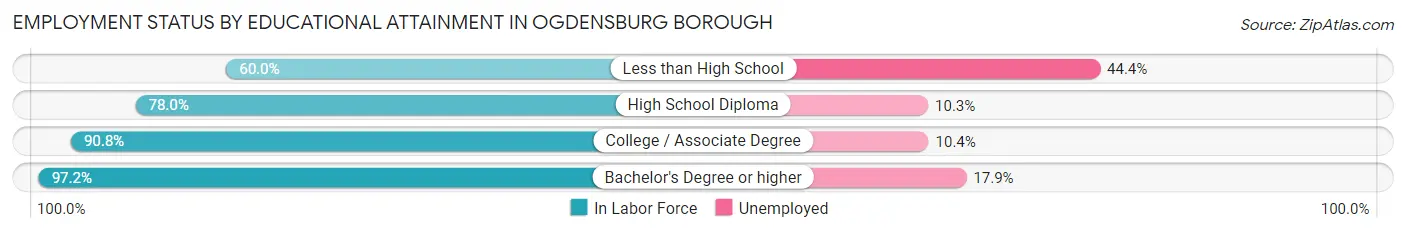
| Educational Attainment | In Labor Force | Unemployed |
| Less than High School | 18 (60.0%) | 13 (44.4%) |
| High School Diploma | 329 (78.0%) | 43 (10.3%) |
| College / Associate Degree | 425 (90.8%) | 49 (10.4%) |
| Bachelor's Degree or higher | 347 (97.2%) | 64 (17.9%) |
| Total | 1,119 (87.6%) | 169 (13.2%) |
Employment Occupations by Sex in Ogdensburg borough
Management, Business, Science and Arts Occupations
The most common Management, Business, Science and Arts occupations in Ogdensburg borough are Management (124 | 10.2%), Community & Social Service (107 | 8.8%), Computers, Engineering & Science (86 | 7.1%), Education Instruction & Library (64 | 5.3%), and Health Diagnosing & Treating (49 | 4.0%).
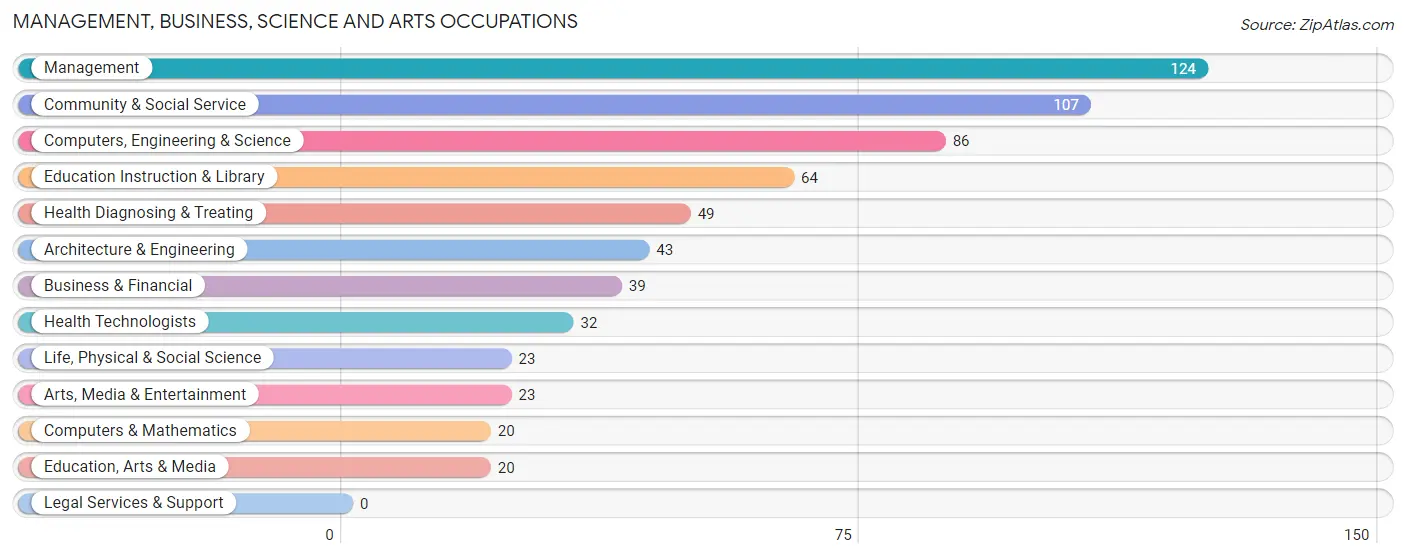
Management, Business, Science and Arts Occupations by Sex
Within the Management, Business, Science and Arts occupations in Ogdensburg borough, the most male-oriented occupations are Architecture & Engineering (100.0%), Computers & Mathematics (80.0%), and Computers, Engineering & Science (77.9%), while the most female-oriented occupations are Health Diagnosing & Treating (100.0%), Health Technologists (100.0%), and Arts, Media & Entertainment (82.6%).
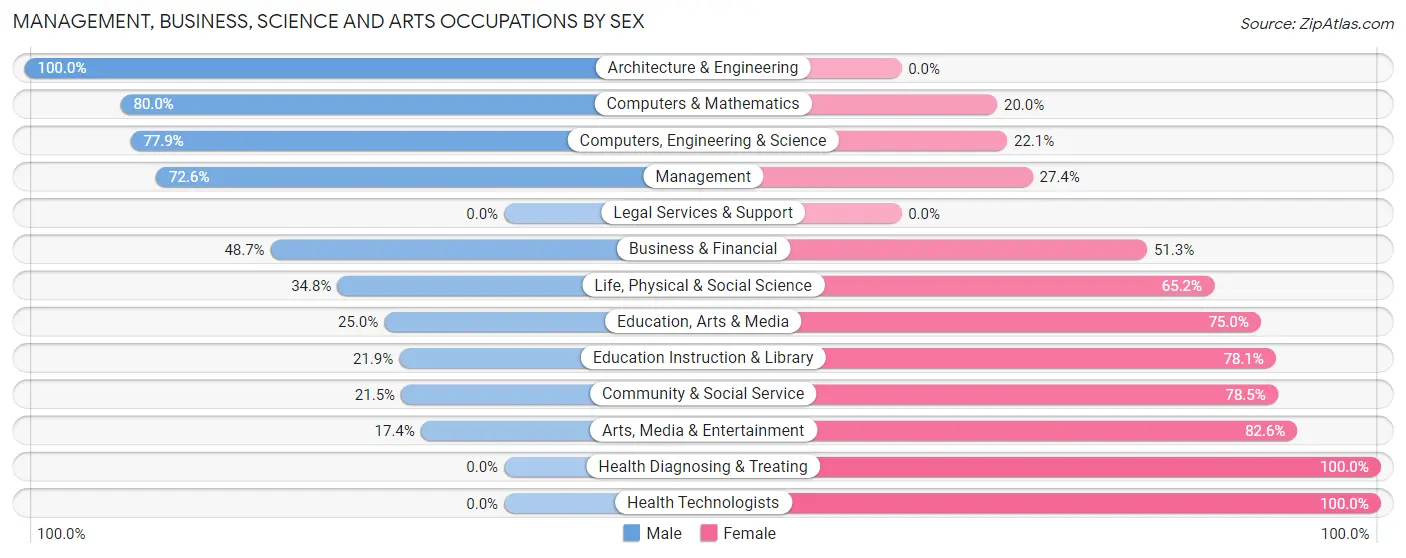
| Occupation | Male | Female |
| Management | 90 (72.6%) | 34 (27.4%) |
| Business & Financial | 19 (48.7%) | 20 (51.3%) |
| Computers, Engineering & Science | 67 (77.9%) | 19 (22.1%) |
| Computers & Mathematics | 16 (80.0%) | 4 (20.0%) |
| Architecture & Engineering | 43 (100.0%) | 0 (0.0%) |
| Life, Physical & Social Science | 8 (34.8%) | 15 (65.2%) |
| Community & Social Service | 23 (21.5%) | 84 (78.5%) |
| Education, Arts & Media | 5 (25.0%) | 15 (75.0%) |
| Legal Services & Support | 0 (0.0%) | 0 (0.0%) |
| Education Instruction & Library | 14 (21.9%) | 50 (78.1%) |
| Arts, Media & Entertainment | 4 (17.4%) | 19 (82.6%) |
| Health Diagnosing & Treating | 0 (0.0%) | 49 (100.0%) |
| Health Technologists | 0 (0.0%) | 32 (100.0%) |
| Total (Category) | 199 (49.1%) | 206 (50.9%) |
| Total (Overall) | 693 (56.9%) | 524 (43.1%) |
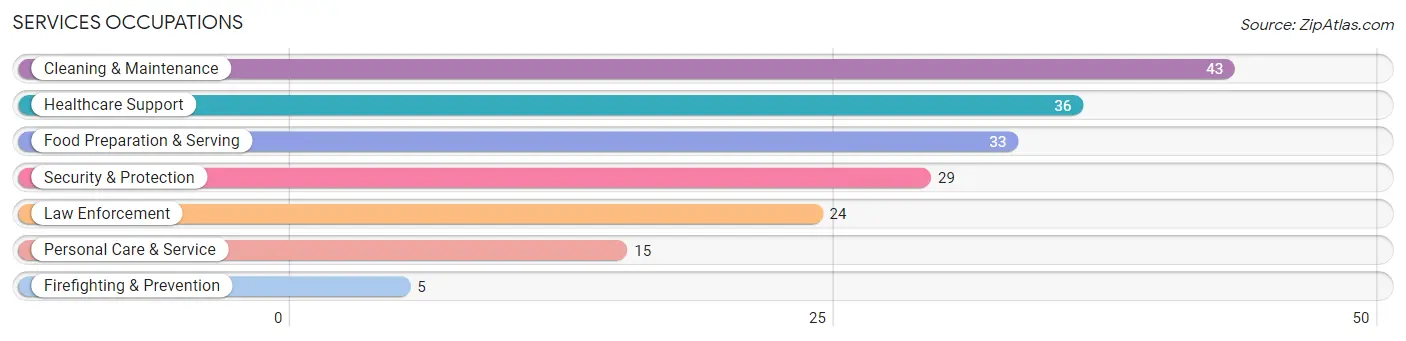
Services Occupations
The most common Services occupations in Ogdensburg borough are Cleaning & Maintenance (43 | 3.5%), Healthcare Support (36 | 3.0%), Food Preparation & Serving (33 | 2.7%), Security & Protection (29 | 2.4%), and Law Enforcement (24 | 2.0%).
Services Occupations by Sex
Within the Services occupations in Ogdensburg borough, the most male-oriented occupations are Security & Protection (100.0%), Firefighting & Prevention (100.0%), and Law Enforcement (100.0%), while the most female-oriented occupations are Healthcare Support (100.0%), Personal Care & Service (100.0%), and Food Preparation & Serving (81.8%).
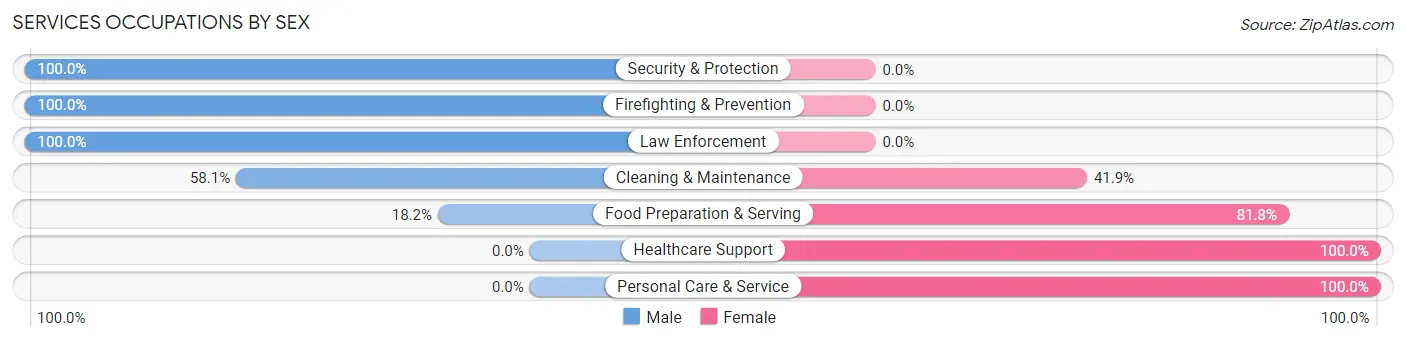
| Occupation | Male | Female |
| Healthcare Support | 0 (0.0%) | 36 (100.0%) |
| Security & Protection | 29 (100.0%) | 0 (0.0%) |
| Firefighting & Prevention | 5 (100.0%) | 0 (0.0%) |
| Law Enforcement | 24 (100.0%) | 0 (0.0%) |
| Food Preparation & Serving | 6 (18.2%) | 27 (81.8%) |
| Cleaning & Maintenance | 25 (58.1%) | 18 (41.9%) |
| Personal Care & Service | 0 (0.0%) | 15 (100.0%) |
| Total (Category) | 60 (38.5%) | 96 (61.5%) |
| Total (Overall) | 693 (56.9%) | 524 (43.1%) |
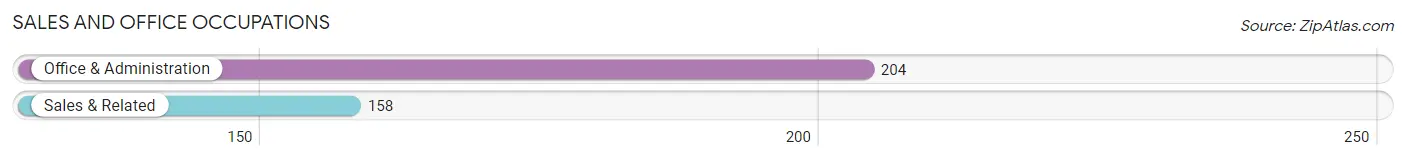
Sales and Office Occupations
The most common Sales and Office occupations in Ogdensburg borough are Office & Administration (204 | 16.8%), and Sales & Related (158 | 13.0%).
Sales and Office Occupations by Sex
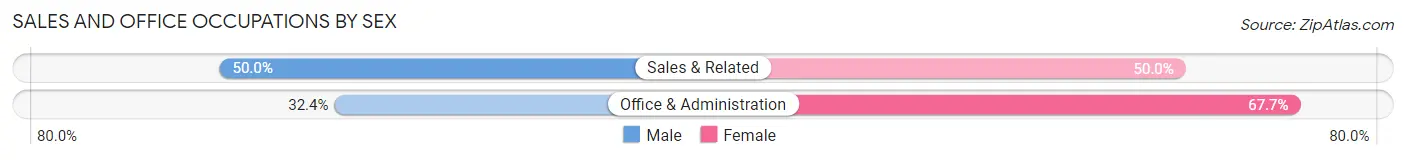
| Occupation | Male | Female |
| Sales & Related | 79 (50.0%) | 79 (50.0%) |
| Office & Administration | 66 (32.4%) | 138 (67.6%) |
| Total (Category) | 145 (40.1%) | 217 (59.9%) |
| Total (Overall) | 693 (56.9%) | 524 (43.1%) |
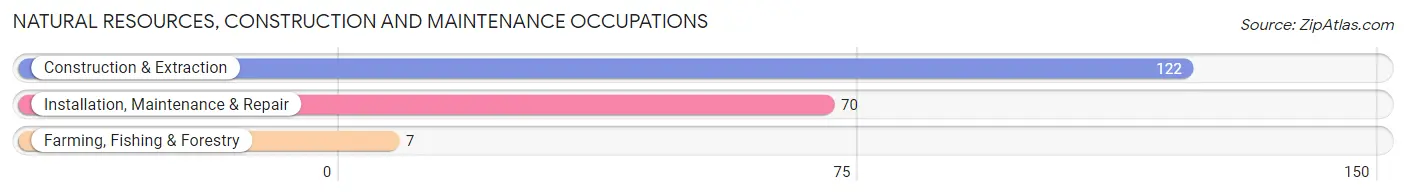
Natural Resources, Construction and Maintenance Occupations
The most common Natural Resources, Construction and Maintenance occupations in Ogdensburg borough are Construction & Extraction (122 | 10.0%), Installation, Maintenance & Repair (70 | 5.8%), and Farming, Fishing & Forestry (7 | 0.6%).
Natural Resources, Construction and Maintenance Occupations by Sex
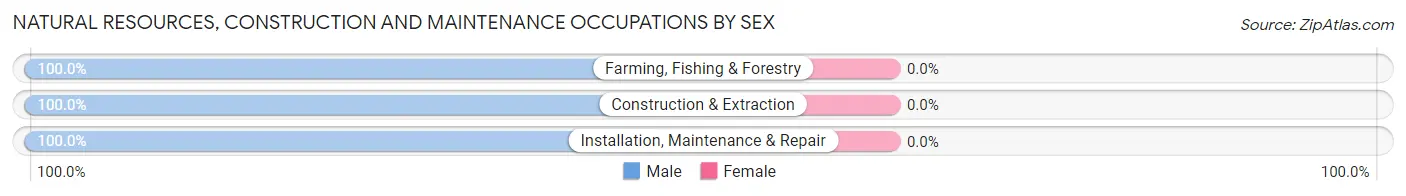
| Occupation | Male | Female |
| Farming, Fishing & Forestry | 7 (100.0%) | 0 (0.0%) |
| Construction & Extraction | 122 (100.0%) | 0 (0.0%) |
| Installation, Maintenance & Repair | 70 (100.0%) | 0 (0.0%) |
| Total (Category) | 199 (100.0%) | 0 (0.0%) |
| Total (Overall) | 693 (56.9%) | 524 (43.1%) |
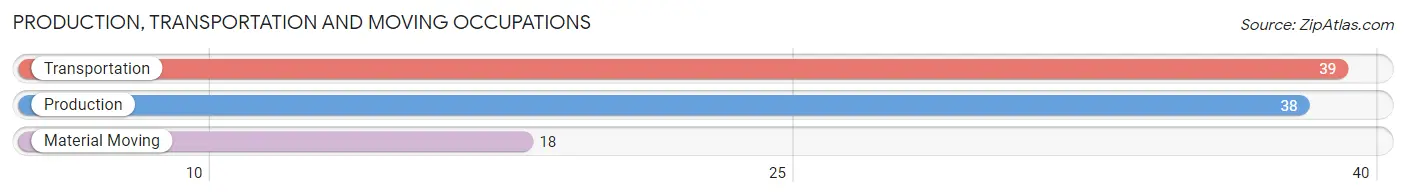
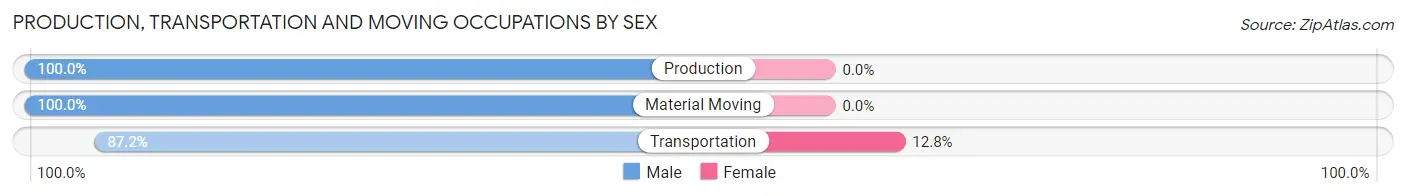
Production, Transportation and Moving Occupations
The most common Production, Transportation and Moving occupations in Ogdensburg borough are Transportation (39 | 3.2%), Production (38 | 3.1%), and Material Moving (18 | 1.5%).
Production, Transportation and Moving Occupations by Sex
| Occupation | Male | Female |
| Production | 38 (100.0%) | 0 (0.0%) |
| Transportation | 34 (87.2%) | 5 (12.8%) |
| Material Moving | 18 (100.0%) | 0 (0.0%) |
| Total (Category) | 90 (94.7%) | 5 (5.3%) |
| Total (Overall) | 693 (56.9%) | 524 (43.1%) |
Employment Industries by Sex in Ogdensburg borough
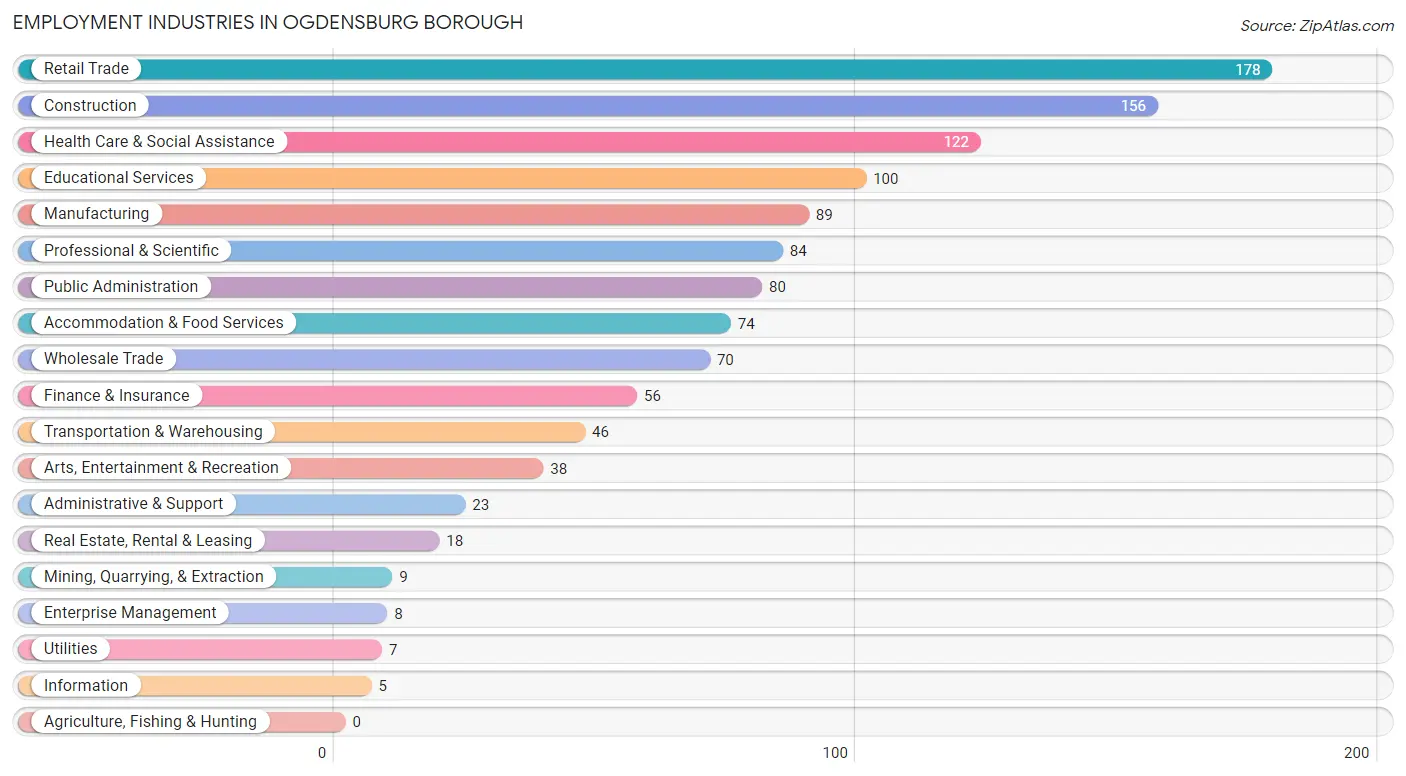
Employment Industries in Ogdensburg borough
The major employment industries in Ogdensburg borough include Retail Trade (178 | 14.6%), Construction (156 | 12.8%), Health Care & Social Assistance (122 | 10.0%), Educational Services (100 | 8.2%), and Manufacturing (89 | 7.3%).
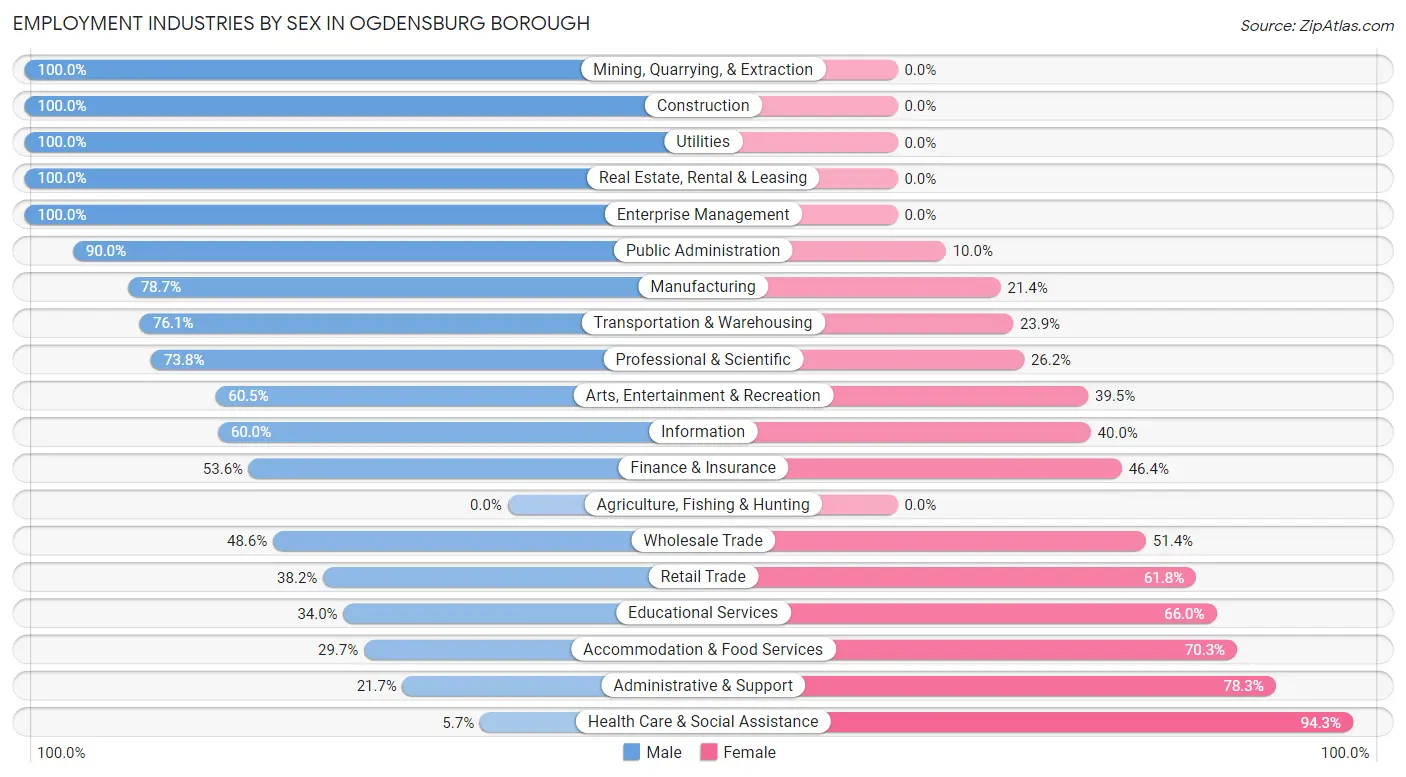
Employment Industries by Sex in Ogdensburg borough
The Ogdensburg borough industries that see more men than women are Mining, Quarrying, & Extraction (100.0%), Construction (100.0%), and Utilities (100.0%), whereas the industries that tend to have a higher number of women are Health Care & Social Assistance (94.3%), Administrative & Support (78.3%), and Accommodation & Food Services (70.3%).
| Industry | Male | Female |
| Agriculture, Fishing & Hunting | 0 (0.0%) | 0 (0.0%) |
| Mining, Quarrying, & Extraction | 9 (100.0%) | 0 (0.0%) |
| Construction | 156 (100.0%) | 0 (0.0%) |
| Manufacturing | 70 (78.6%) | 19 (21.3%) |
| Wholesale Trade | 34 (48.6%) | 36 (51.4%) |
| Retail Trade | 68 (38.2%) | 110 (61.8%) |
| Transportation & Warehousing | 35 (76.1%) | 11 (23.9%) |
| Utilities | 7 (100.0%) | 0 (0.0%) |
| Information | 3 (60.0%) | 2 (40.0%) |
| Finance & Insurance | 30 (53.6%) | 26 (46.4%) |
| Real Estate, Rental & Leasing | 18 (100.0%) | 0 (0.0%) |
| Professional & Scientific | 62 (73.8%) | 22 (26.2%) |
| Enterprise Management | 8 (100.0%) | 0 (0.0%) |
| Administrative & Support | 5 (21.7%) | 18 (78.3%) |
| Educational Services | 34 (34.0%) | 66 (66.0%) |
| Health Care & Social Assistance | 7 (5.7%) | 115 (94.3%) |
| Arts, Entertainment & Recreation | 23 (60.5%) | 15 (39.5%) |
| Accommodation & Food Services | 22 (29.7%) | 52 (70.3%) |
| Public Administration | 72 (90.0%) | 8 (10.0%) |
| Total | 693 (56.9%) | 524 (43.1%) |
Education in Ogdensburg borough
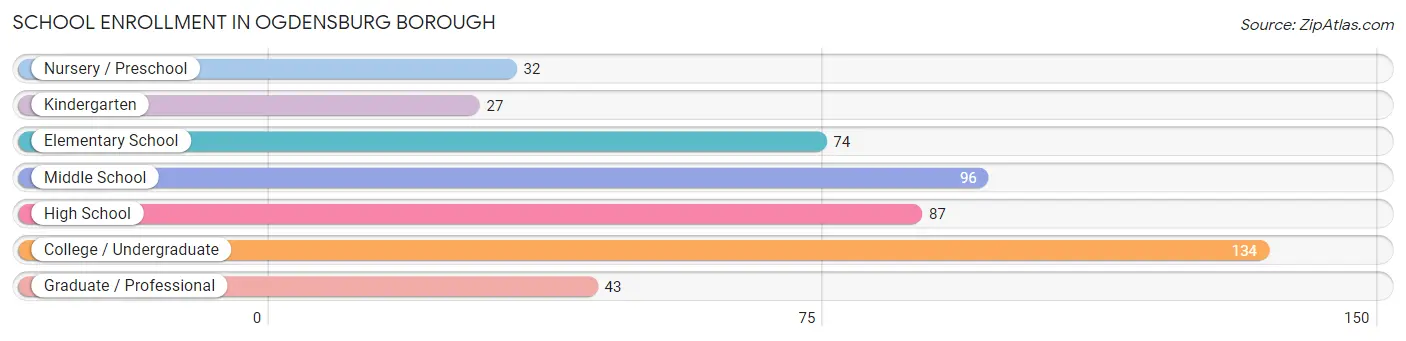
School Enrollment in Ogdensburg borough
The most common levels of schooling among the 493 students in Ogdensburg borough are college / undergraduate (134 | 27.2%), middle school (96 | 19.5%), and high school (87 | 17.6%).
| School Level | # Students | % Students |
| Nursery / Preschool | 32 | 6.5% |
| Kindergarten | 27 | 5.5% |
| Elementary School | 74 | 15.0% |
| Middle School | 96 | 19.5% |
| High School | 87 | 17.6% |
| College / Undergraduate | 134 | 27.2% |
| Graduate / Professional | 43 | 8.7% |
| Total | 493 | 100.0% |
School Enrollment by Age by Funding Source in Ogdensburg borough
Out of a total of 493 students who are enrolled in schools in Ogdensburg borough, 80 (16.2%) attend a private institution, while the remaining 413 (83.8%) are enrolled in public schools. The age group of 35 years and over has the highest likelihood of being enrolled in private schools, with 25 (89.3% in the age bracket) enrolled. Conversely, the age group of 5 to 9 year old has the lowest likelihood of being enrolled in a private school, with 94 (100.0% in the age bracket) attending a public institution.
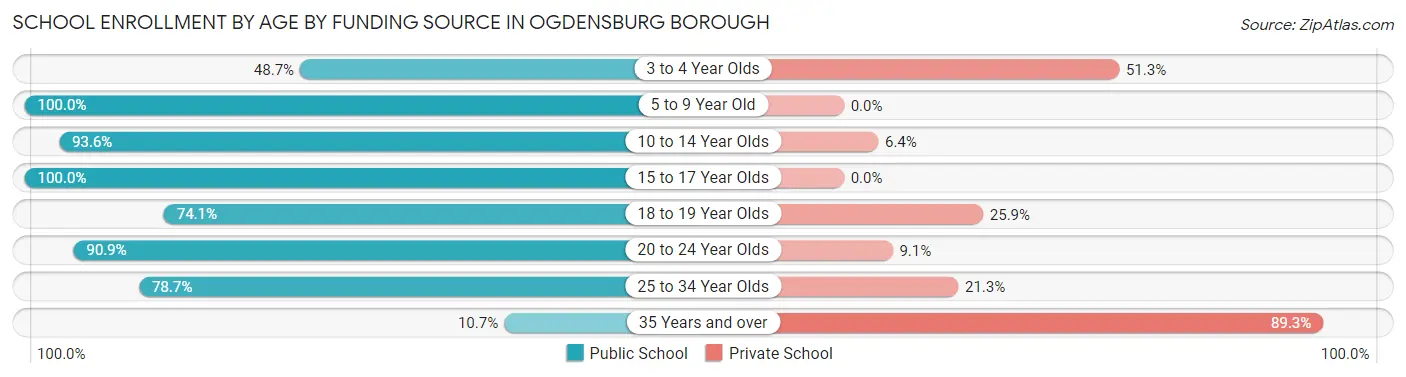
| Age Bracket | Public School | Private School |
| 3 to 4 Year Olds | 19 (48.7%) | 20 (51.3%) |
| 5 to 9 Year Old | 94 (100.0%) | 0 (0.0%) |
| 10 to 14 Year Olds | 117 (93.6%) | 8 (6.4%) |
| 15 to 17 Year Olds | 42 (100.0%) | 0 (0.0%) |
| 18 to 19 Year Olds | 20 (74.1%) | 7 (25.9%) |
| 20 to 24 Year Olds | 70 (90.9%) | 7 (9.1%) |
| 25 to 34 Year Olds | 48 (78.7%) | 13 (21.3%) |
| 35 Years and over | 3 (10.7%) | 25 (89.3%) |
| Total | 413 (83.8%) | 80 (16.2%) |
Educational Attainment by Field of Study in Ogdensburg borough
Business (97 | 20.2%), bio, nature & agricultural (81 | 16.8%), education (77 | 16.0%), science & technology (39 | 8.1%), and multidisciplinary studies (35 | 7.3%) are the most common fields of study among 481 individuals in Ogdensburg borough who have obtained a bachelor's degree or higher.
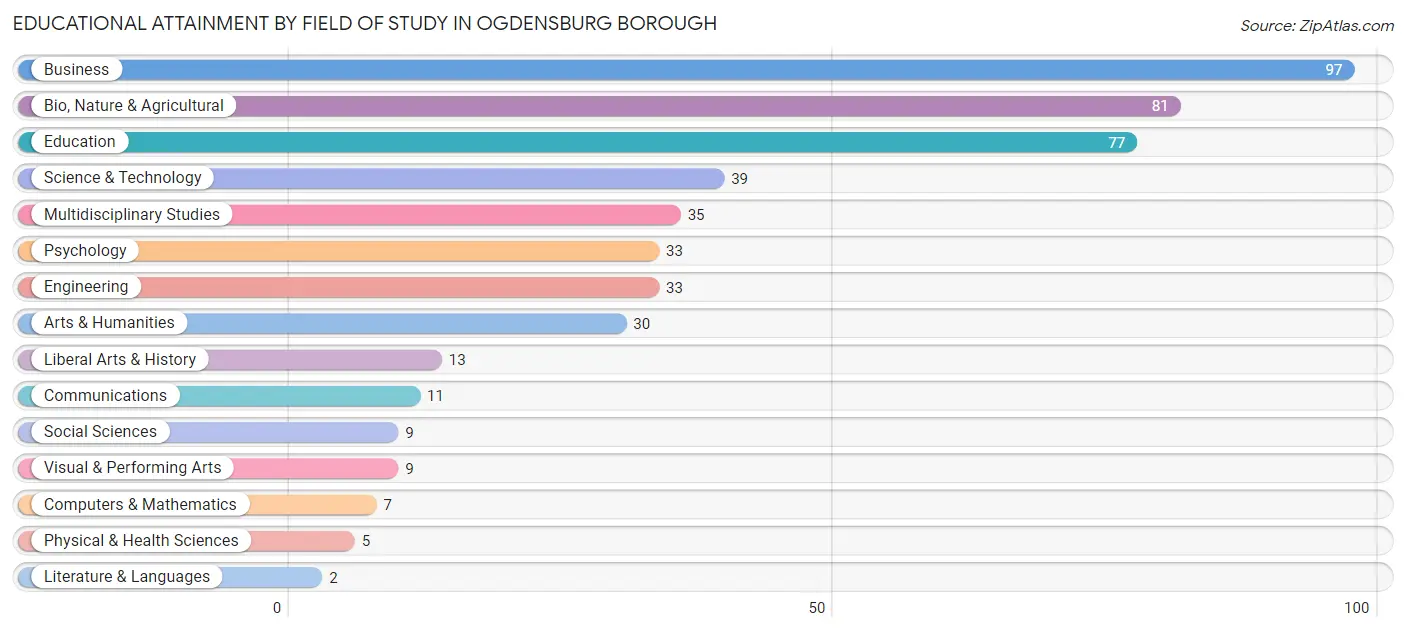
| Field of Study | # Graduates | % Graduates |
| Computers & Mathematics | 7 | 1.5% |
| Bio, Nature & Agricultural | 81 | 16.8% |
| Physical & Health Sciences | 5 | 1.0% |
| Psychology | 33 | 6.9% |
| Social Sciences | 9 | 1.9% |
| Engineering | 33 | 6.9% |
| Multidisciplinary Studies | 35 | 7.3% |
| Science & Technology | 39 | 8.1% |
| Business | 97 | 20.2% |
| Education | 77 | 16.0% |
| Literature & Languages | 2 | 0.4% |
| Liberal Arts & History | 13 | 2.7% |
| Visual & Performing Arts | 9 | 1.9% |
| Communications | 11 | 2.3% |
| Arts & Humanities | 30 | 6.2% |
| Total | 481 | 100.0% |
Transportation & Commute in Ogdensburg borough
Vehicle Availability by Sex in Ogdensburg borough
The most prevalent vehicle ownership categories in Ogdensburg borough are males with 2 vehicles (254, accounting for 36.9%) and females with 2 vehicles (198, making up 51.4%).
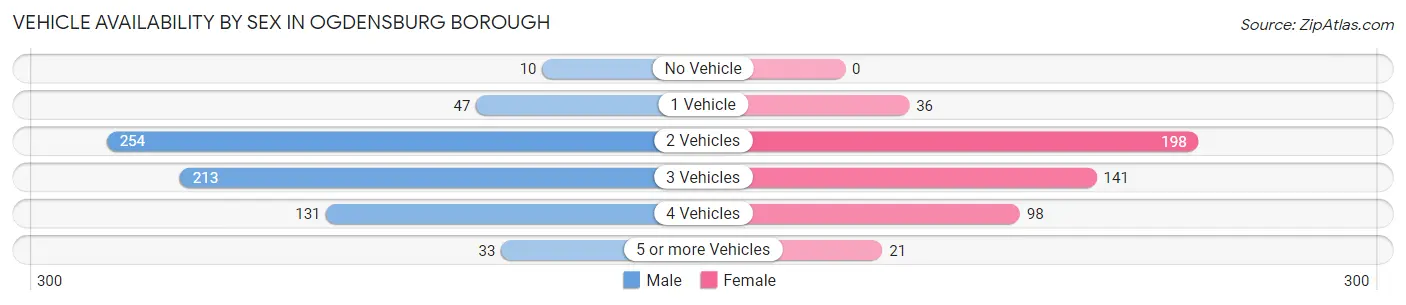
| Vehicles Available | Male | Female |
| No Vehicle | 10 (1.5%) | 0 (0.0%) |
| 1 Vehicle | 47 (6.8%) | 36 (7.3%) |
| 2 Vehicles | 254 (36.9%) | 198 (40.1%) |
| 3 Vehicles | 213 (31.0%) | 141 (28.5%) |
| 4 Vehicles | 131 (19.0%) | 98 (19.8%) |
| 5 or more Vehicles | 33 (4.8%) | 21 (4.3%) |
| Total | 688 (100.0%) | 494 (100.0%) |
Commute Time in Ogdensburg borough
The most frequently occuring commute durations in Ogdensburg borough are 30 to 34 minutes (207 commuters, 18.8%), 45 to 59 minutes (176 commuters, 16.0%), and 60 to 89 minutes (170 commuters, 15.4%).
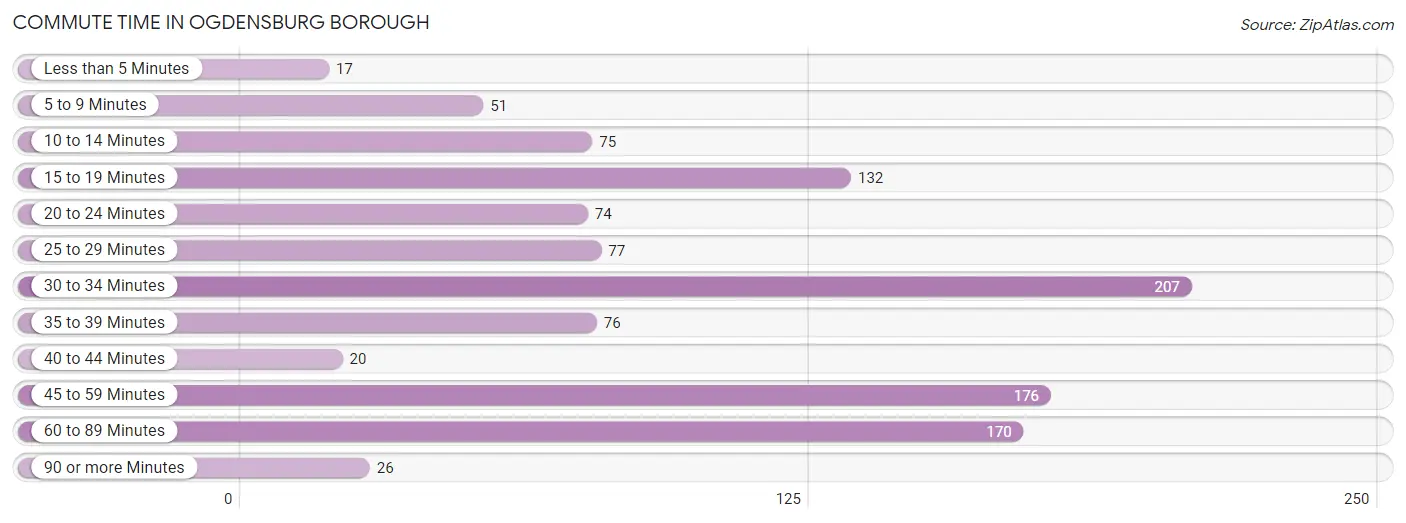
| Commute Time | # Commuters | % Commuters |
| Less than 5 Minutes | 17 | 1.5% |
| 5 to 9 Minutes | 51 | 4.6% |
| 10 to 14 Minutes | 75 | 6.8% |
| 15 to 19 Minutes | 132 | 12.0% |
| 20 to 24 Minutes | 74 | 6.7% |
| 25 to 29 Minutes | 77 | 7.0% |
| 30 to 34 Minutes | 207 | 18.8% |
| 35 to 39 Minutes | 76 | 6.9% |
| 40 to 44 Minutes | 20 | 1.8% |
| 45 to 59 Minutes | 176 | 16.0% |
| 60 to 89 Minutes | 170 | 15.4% |
| 90 or more Minutes | 26 | 2.4% |
Commute Time by Sex in Ogdensburg borough
The most common commute times in Ogdensburg borough are 30 to 34 minutes (135 commuters, 21.7%) for males and 30 to 34 minutes (72 commuters, 15.0%) for females.
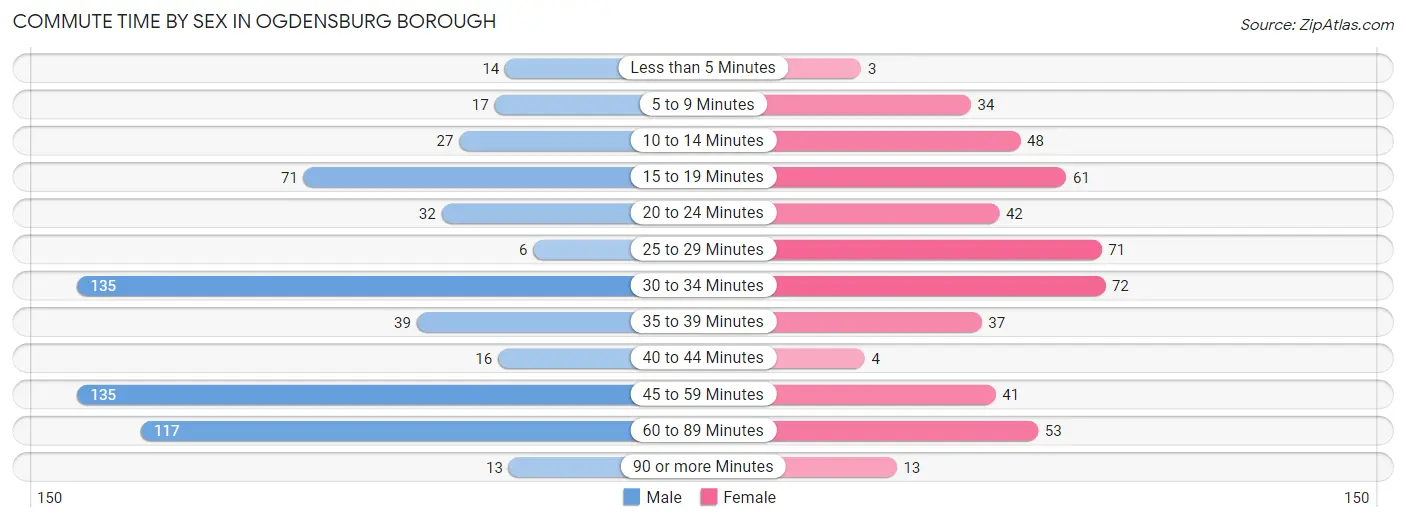
| Commute Time | Male | Female |
| Less than 5 Minutes | 14 (2.2%) | 3 (0.6%) |
| 5 to 9 Minutes | 17 (2.7%) | 34 (7.1%) |
| 10 to 14 Minutes | 27 (4.3%) | 48 (10.0%) |
| 15 to 19 Minutes | 71 (11.4%) | 61 (12.7%) |
| 20 to 24 Minutes | 32 (5.1%) | 42 (8.8%) |
| 25 to 29 Minutes | 6 (1.0%) | 71 (14.8%) |
| 30 to 34 Minutes | 135 (21.7%) | 72 (15.0%) |
| 35 to 39 Minutes | 39 (6.3%) | 37 (7.7%) |
| 40 to 44 Minutes | 16 (2.6%) | 4 (0.8%) |
| 45 to 59 Minutes | 135 (21.7%) | 41 (8.6%) |
| 60 to 89 Minutes | 117 (18.8%) | 53 (11.1%) |
| 90 or more Minutes | 13 (2.1%) | 13 (2.7%) |
Time of Departure to Work by Sex in Ogdensburg borough
The most frequent times of departure to work in Ogdensburg borough are 6:30 AM to 6:59 AM (94, 15.1%) for males and 8:00 AM to 8:29 AM (104, 21.7%) for females.
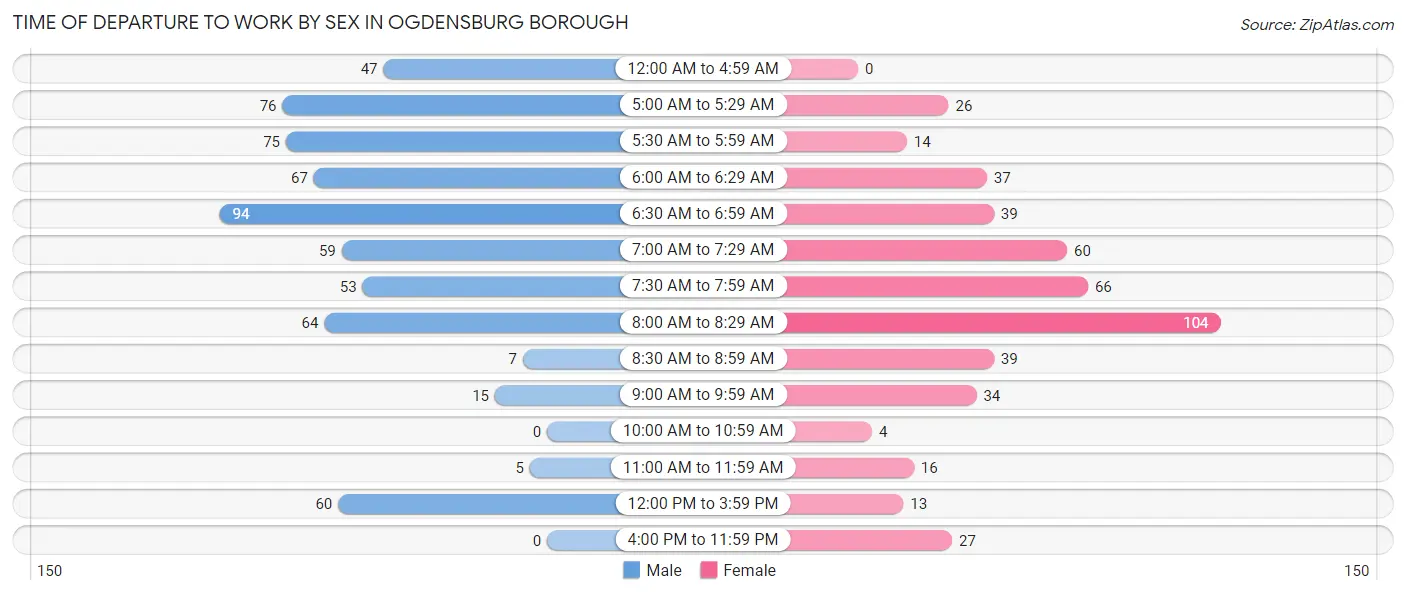
| Time of Departure | Male | Female |
| 12:00 AM to 4:59 AM | 47 (7.6%) | 0 (0.0%) |
| 5:00 AM to 5:29 AM | 76 (12.2%) | 26 (5.4%) |
| 5:30 AM to 5:59 AM | 75 (12.1%) | 14 (2.9%) |
| 6:00 AM to 6:29 AM | 67 (10.8%) | 37 (7.7%) |
| 6:30 AM to 6:59 AM | 94 (15.1%) | 39 (8.1%) |
| 7:00 AM to 7:29 AM | 59 (9.5%) | 60 (12.5%) |
| 7:30 AM to 7:59 AM | 53 (8.5%) | 66 (13.8%) |
| 8:00 AM to 8:29 AM | 64 (10.3%) | 104 (21.7%) |
| 8:30 AM to 8:59 AM | 7 (1.1%) | 39 (8.1%) |
| 9:00 AM to 9:59 AM | 15 (2.4%) | 34 (7.1%) |
| 10:00 AM to 10:59 AM | 0 (0.0%) | 4 (0.8%) |
| 11:00 AM to 11:59 AM | 5 (0.8%) | 16 (3.3%) |
| 12:00 PM to 3:59 PM | 60 (9.7%) | 13 (2.7%) |
| 4:00 PM to 11:59 PM | 0 (0.0%) | 27 (5.6%) |
| Total | 622 (100.0%) | 479 (100.0%) |
Housing Occupancy in Ogdensburg borough
Occupancy by Ownership in Ogdensburg borough
Of the total 827 dwellings in Ogdensburg borough, owner-occupied units account for 767 (92.7%), while renter-occupied units make up 60 (7.3%).
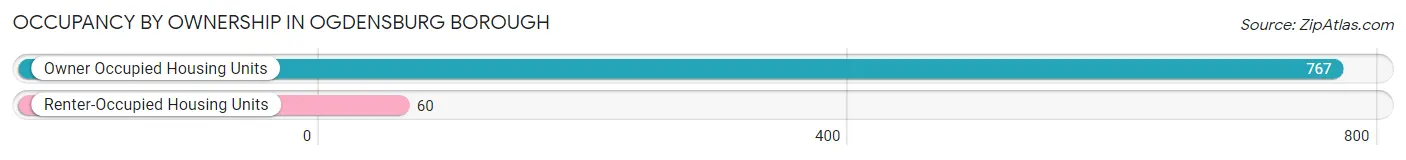
| Occupancy | # Housing Units | % Housing Units |
| Owner Occupied Housing Units | 767 | 92.7% |
| Renter-Occupied Housing Units | 60 | 7.3% |
| Total Occupied Housing Units | 827 | 100.0% |
Occupancy by Household Size in Ogdensburg borough
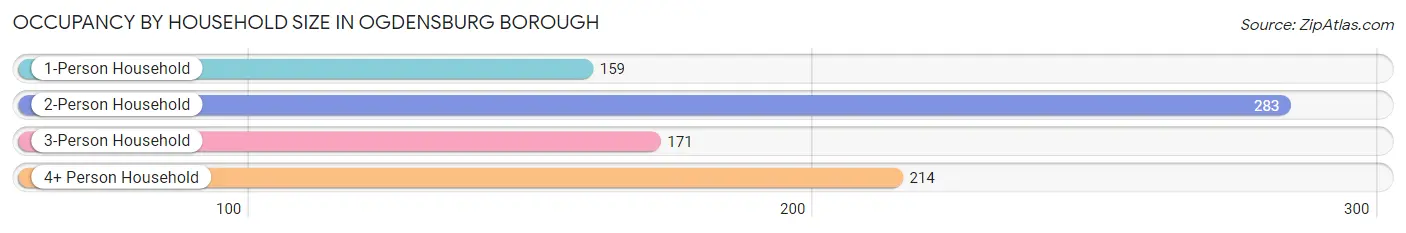
| Household Size | # Housing Units | % Housing Units |
| 1-Person Household | 159 | 19.2% |
| 2-Person Household | 283 | 34.2% |
| 3-Person Household | 171 | 20.7% |
| 4+ Person Household | 214 | 25.9% |
| Total Housing Units | 827 | 100.0% |
Occupancy by Ownership by Household Size in Ogdensburg borough
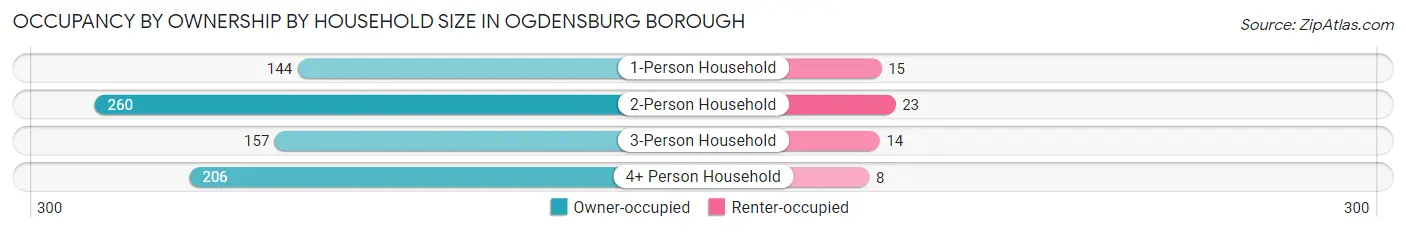
| Household Size | Owner-occupied | Renter-occupied |
| 1-Person Household | 144 (90.6%) | 15 (9.4%) |
| 2-Person Household | 260 (91.9%) | 23 (8.1%) |
| 3-Person Household | 157 (91.8%) | 14 (8.2%) |
| 4+ Person Household | 206 (96.3%) | 8 (3.7%) |
| Total Housing Units | 767 (92.7%) | 60 (7.3%) |
Occupancy by Educational Attainment in Ogdensburg borough
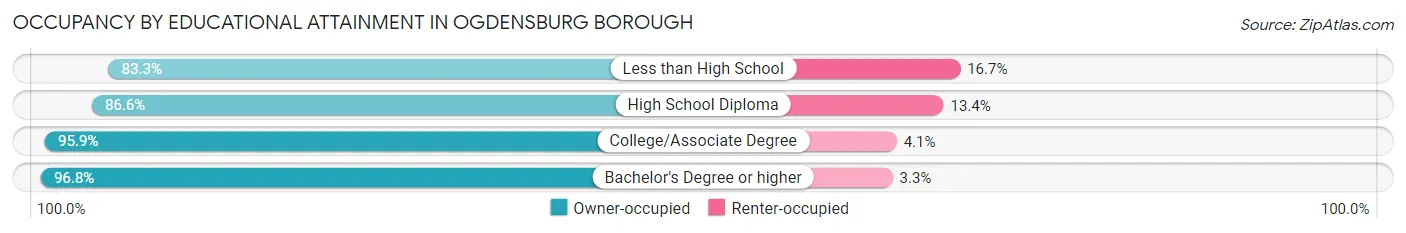
| Household Size | Owner-occupied | Renter-occupied |
| Less than High School | 45 (83.3%) | 9 (16.7%) |
| High School Diploma | 201 (86.6%) | 31 (13.4%) |
| College/Associate Degree | 283 (95.9%) | 12 (4.1%) |
| Bachelor's Degree or higher | 238 (96.8%) | 8 (3.3%) |
Occupancy by Age of Householder in Ogdensburg borough
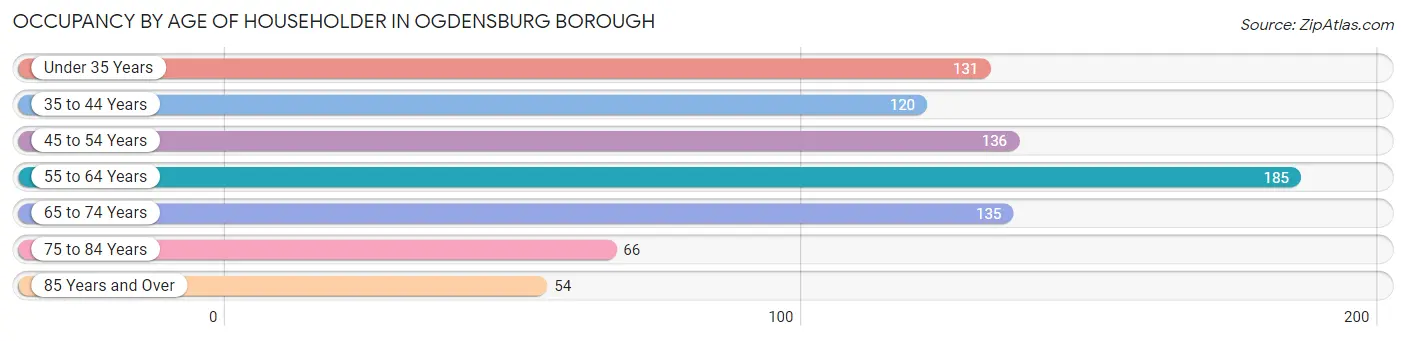
| Age Bracket | # Households | % Households |
| Under 35 Years | 131 | 15.8% |
| 35 to 44 Years | 120 | 14.5% |
| 45 to 54 Years | 136 | 16.4% |
| 55 to 64 Years | 185 | 22.4% |
| 65 to 74 Years | 135 | 16.3% |
| 75 to 84 Years | 66 | 8.0% |
| 85 Years and Over | 54 | 6.5% |
| Total | 827 | 100.0% |
Housing Finances in Ogdensburg borough
Median Income by Occupancy in Ogdensburg borough
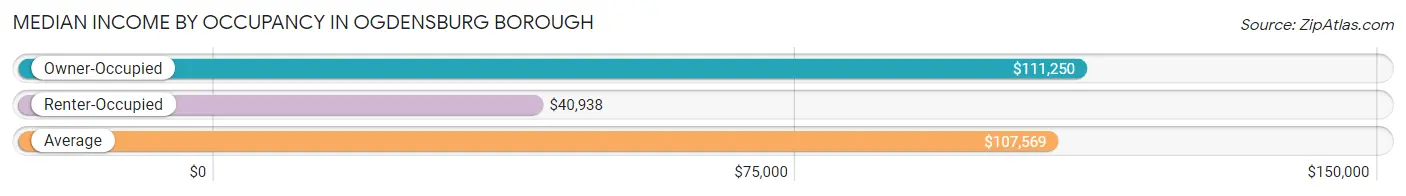
| Occupancy Type | # Households | Median Income |
| Owner-Occupied | 767 (92.7%) | $111,250 |
| Renter-Occupied | 60 (7.3%) | $40,938 |
| Average | 827 (100.0%) | $107,569 |
Occupancy by Householder Income Bracket in Ogdensburg borough
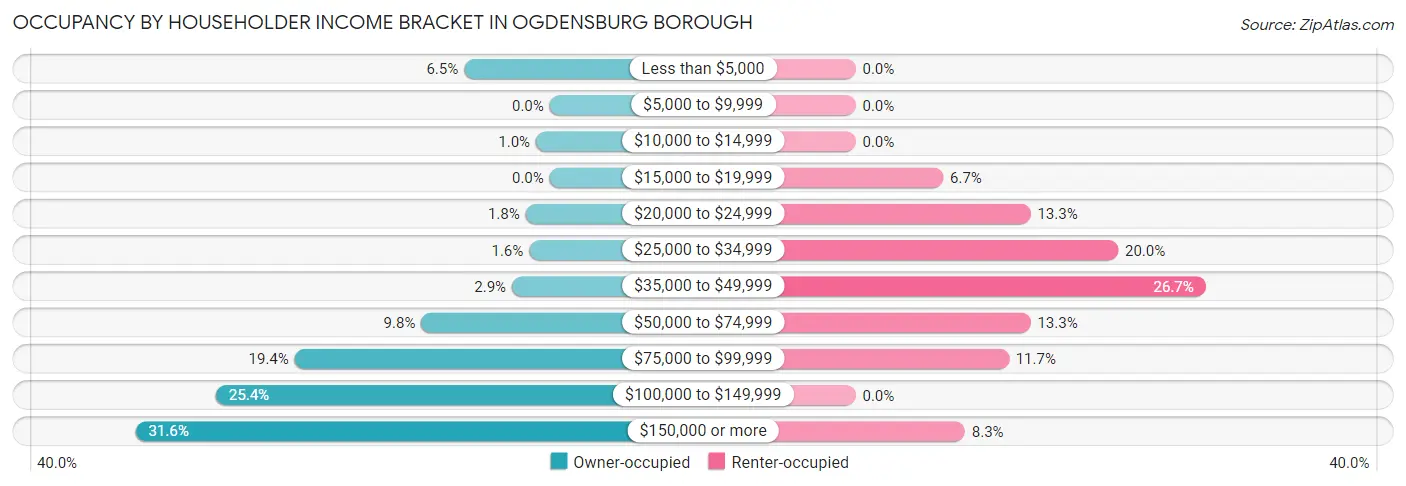
| Income Bracket | Owner-occupied | Renter-occupied |
| Less than $5,000 | 50 (6.5%) | 0 (0.0%) |
| $5,000 to $9,999 | 0 (0.0%) | 0 (0.0%) |
| $10,000 to $14,999 | 8 (1.0%) | 0 (0.0%) |
| $15,000 to $19,999 | 0 (0.0%) | 4 (6.7%) |
| $20,000 to $24,999 | 14 (1.8%) | 8 (13.3%) |
| $25,000 to $34,999 | 12 (1.6%) | 12 (20.0%) |
| $35,000 to $49,999 | 22 (2.9%) | 16 (26.7%) |
| $50,000 to $74,999 | 75 (9.8%) | 8 (13.3%) |
| $75,000 to $99,999 | 149 (19.4%) | 7 (11.7%) |
| $100,000 to $149,999 | 195 (25.4%) | 0 (0.0%) |
| $150,000 or more | 242 (31.6%) | 5 (8.3%) |
| Total | 767 (100.0%) | 60 (100.0%) |
Monthly Housing Cost Tiers in Ogdensburg borough
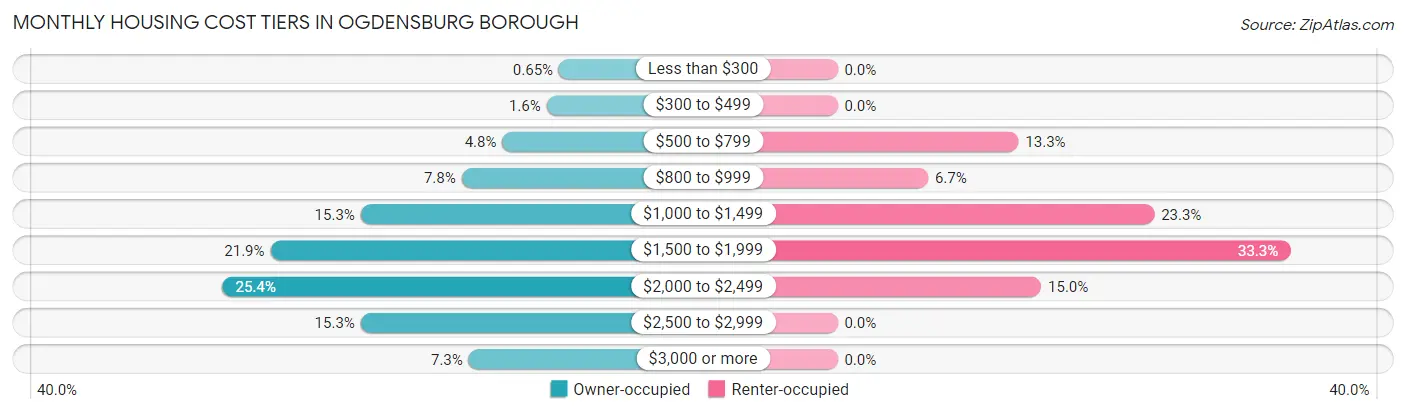
| Monthly Cost | Owner-occupied | Renter-occupied |
| Less than $300 | 5 (0.6%) | 0 (0.0%) |
| $300 to $499 | 12 (1.6%) | 0 (0.0%) |
| $500 to $799 | 37 (4.8%) | 8 (13.3%) |
| $800 to $999 | 60 (7.8%) | 4 (6.7%) |
| $1,000 to $1,499 | 117 (15.2%) | 14 (23.3%) |
| $1,500 to $1,999 | 168 (21.9%) | 20 (33.3%) |
| $2,000 to $2,499 | 195 (25.4%) | 9 (15.0%) |
| $2,500 to $2,999 | 117 (15.2%) | 0 (0.0%) |
| $3,000 or more | 56 (7.3%) | 0 (0.0%) |
| Total | 767 (100.0%) | 60 (100.0%) |
Physical Housing Characteristics in Ogdensburg borough
Housing Structures in Ogdensburg borough
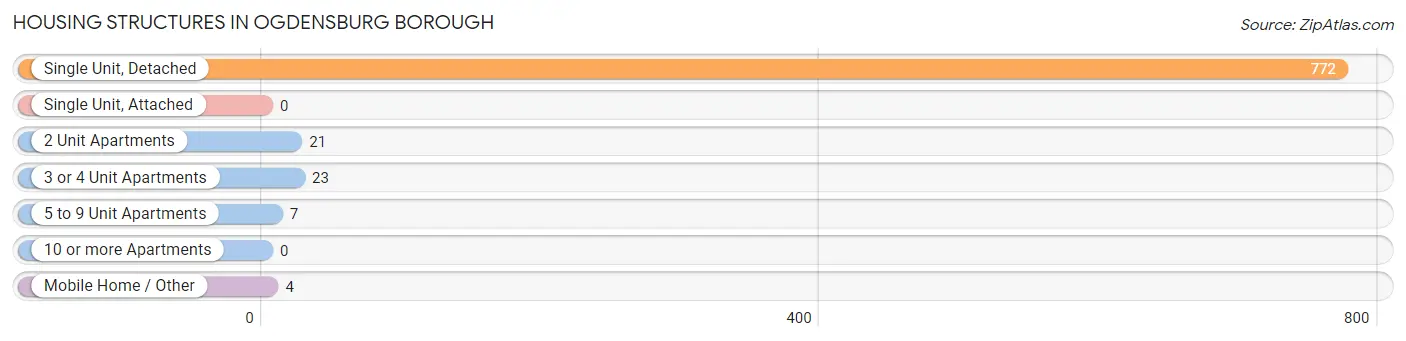
| Structure Type | # Housing Units | % Housing Units |
| Single Unit, Detached | 772 | 93.3% |
| Single Unit, Attached | 0 | 0.0% |
| 2 Unit Apartments | 21 | 2.5% |
| 3 or 4 Unit Apartments | 23 | 2.8% |
| 5 to 9 Unit Apartments | 7 | 0.9% |
| 10 or more Apartments | 0 | 0.0% |
| Mobile Home / Other | 4 | 0.5% |
| Total | 827 | 100.0% |
Housing Structures by Occupancy in Ogdensburg borough
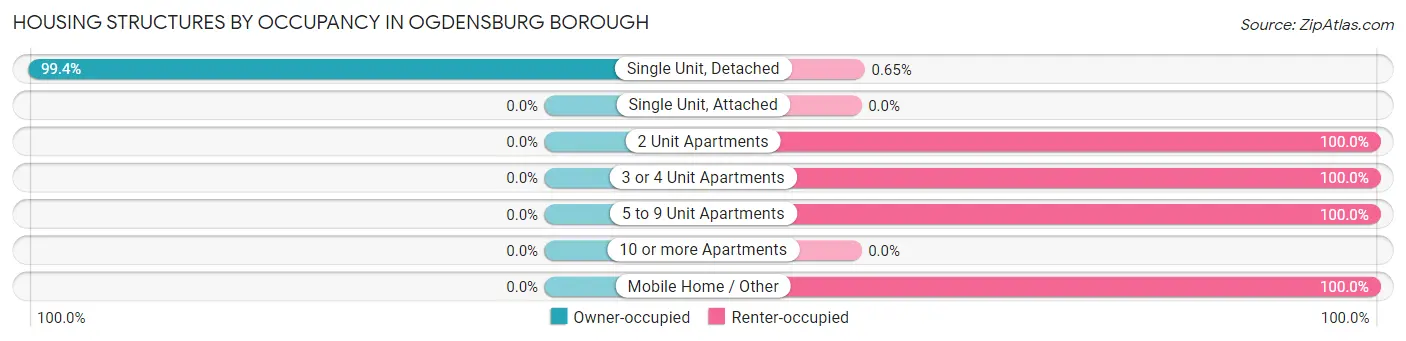
| Structure Type | Owner-occupied | Renter-occupied |
| Single Unit, Detached | 767 (99.4%) | 5 (0.6%) |
| Single Unit, Attached | 0 (0.0%) | 0 (0.0%) |
| 2 Unit Apartments | 0 (0.0%) | 21 (100.0%) |
| 3 or 4 Unit Apartments | 0 (0.0%) | 23 (100.0%) |
| 5 to 9 Unit Apartments | 0 (0.0%) | 7 (100.0%) |
| 10 or more Apartments | 0 (0.0%) | 0 (0.0%) |
| Mobile Home / Other | 0 (0.0%) | 4 (100.0%) |
| Total | 767 (92.7%) | 60 (7.3%) |
Housing Structures by Number of Rooms in Ogdensburg borough
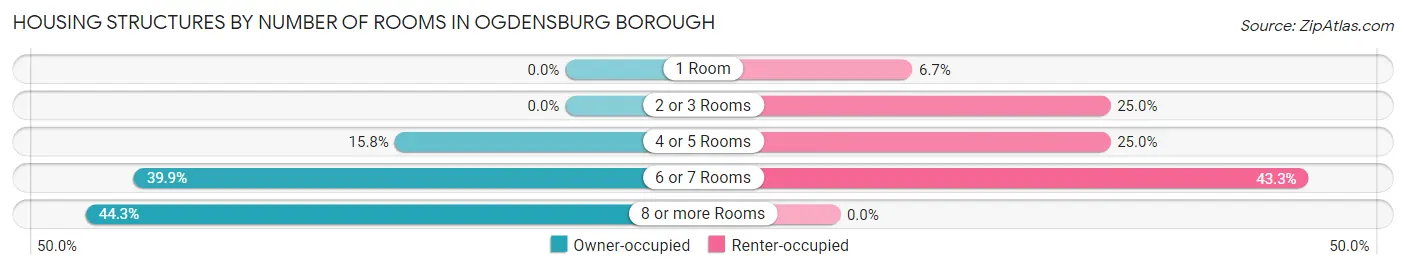
| Number of Rooms | Owner-occupied | Renter-occupied |
| 1 Room | 0 (0.0%) | 4 (6.7%) |
| 2 or 3 Rooms | 0 (0.0%) | 15 (25.0%) |
| 4 or 5 Rooms | 121 (15.8%) | 15 (25.0%) |
| 6 or 7 Rooms | 306 (39.9%) | 26 (43.3%) |
| 8 or more Rooms | 340 (44.3%) | 0 (0.0%) |
| Total | 767 (100.0%) | 60 (100.0%) |
Housing Structure by Heating Type in Ogdensburg borough
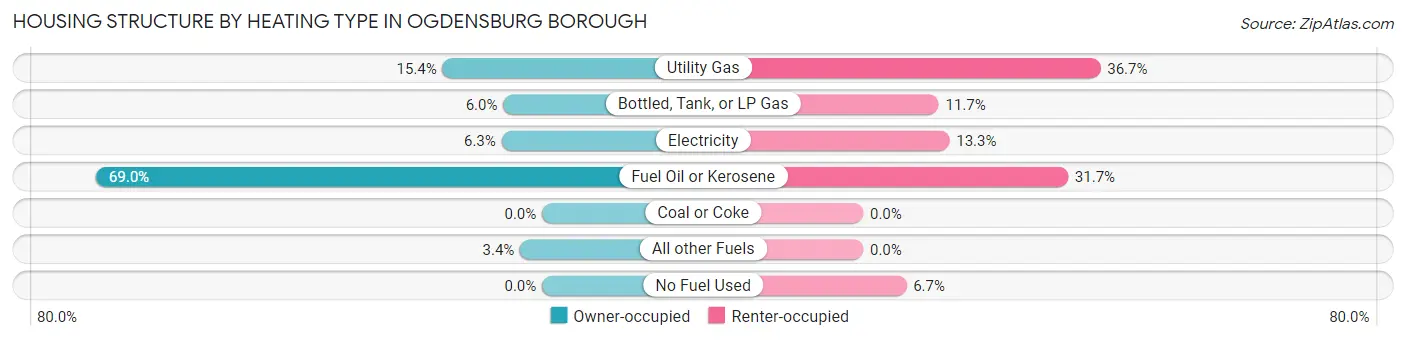
| Heating Type | Owner-occupied | Renter-occupied |
| Utility Gas | 118 (15.4%) | 22 (36.7%) |
| Bottled, Tank, or LP Gas | 46 (6.0%) | 7 (11.7%) |
| Electricity | 48 (6.3%) | 8 (13.3%) |
| Fuel Oil or Kerosene | 529 (69.0%) | 19 (31.7%) |
| Coal or Coke | 0 (0.0%) | 0 (0.0%) |
| All other Fuels | 26 (3.4%) | 0 (0.0%) |
| No Fuel Used | 0 (0.0%) | 4 (6.7%) |
| Total | 767 (100.0%) | 60 (100.0%) |
Household Vehicle Usage in Ogdensburg borough
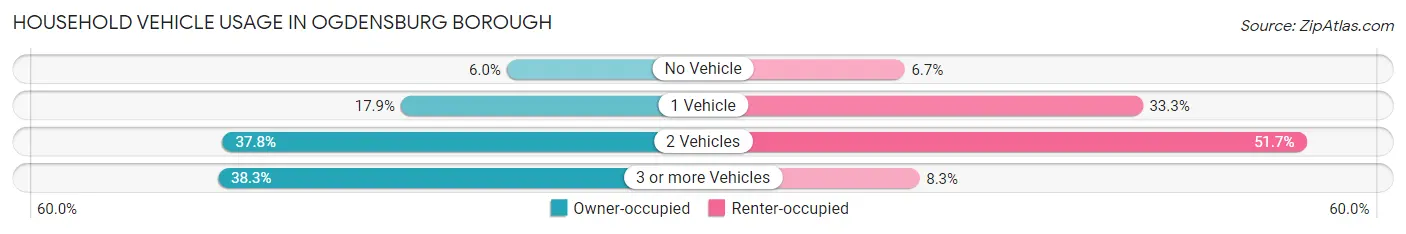
| Vehicles per Household | Owner-occupied | Renter-occupied |
| No Vehicle | 46 (6.0%) | 4 (6.7%) |
| 1 Vehicle | 137 (17.9%) | 20 (33.3%) |
| 2 Vehicles | 290 (37.8%) | 31 (51.7%) |
| 3 or more Vehicles | 294 (38.3%) | 5 (8.3%) |
| Total | 767 (100.0%) | 60 (100.0%) |
Real Estate & Mortgages in Ogdensburg borough
Real Estate and Mortgage Overview in Ogdensburg borough
| Characteristic | Without Mortgage | With Mortgage |
| Housing Units | 217 | 550 |
| Median Property Value | $259,500 | $283,200 |
| Median Household Income | $77,917 | $209 |
| Monthly Housing Costs | $991 | $56 |
| Real Estate Taxes | $8,545 | $0 |
Property Value by Mortgage Status in Ogdensburg borough
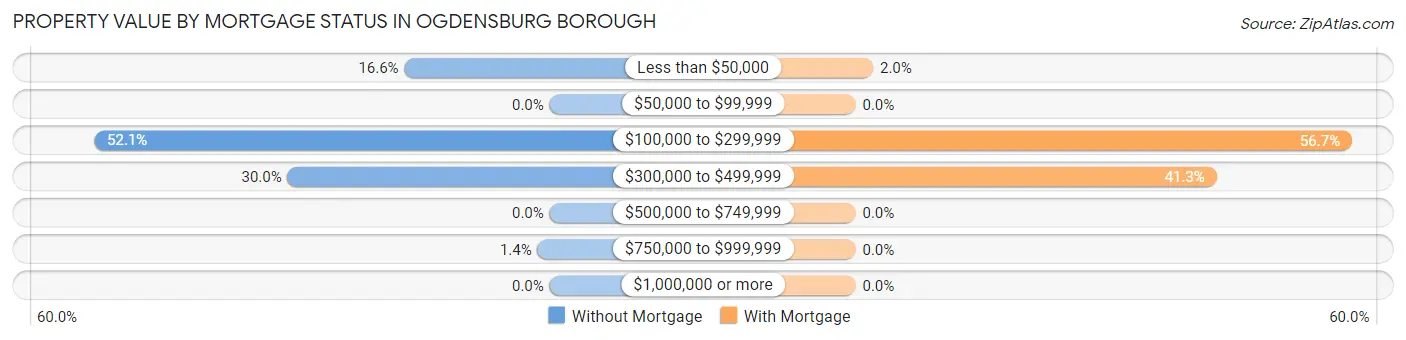
| Property Value | Without Mortgage | With Mortgage |
| Less than $50,000 | 36 (16.6%) | 11 (2.0%) |
| $50,000 to $99,999 | 0 (0.0%) | 0 (0.0%) |
| $100,000 to $299,999 | 113 (52.1%) | 312 (56.7%) |
| $300,000 to $499,999 | 65 (29.9%) | 227 (41.3%) |
| $500,000 to $749,999 | 0 (0.0%) | 0 (0.0%) |
| $750,000 to $999,999 | 3 (1.4%) | 0 (0.0%) |
| $1,000,000 or more | 0 (0.0%) | 0 (0.0%) |
| Total | 217 (100.0%) | 550 (100.0%) |
Household Income by Mortgage Status in Ogdensburg borough
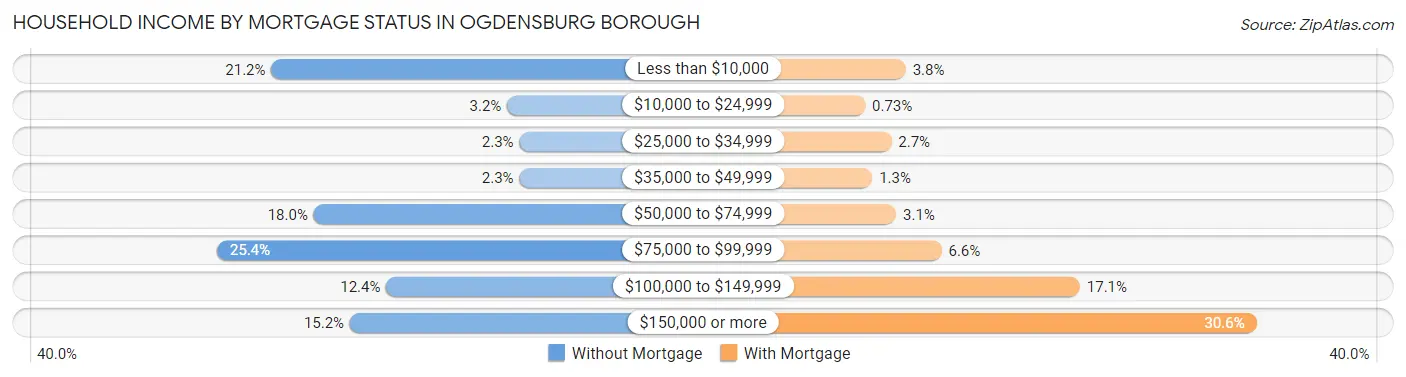
| Household Income | Without Mortgage | With Mortgage |
| Less than $10,000 | 46 (21.2%) | 21 (3.8%) |
| $10,000 to $24,999 | 7 (3.2%) | 4 (0.7%) |
| $25,000 to $34,999 | 5 (2.3%) | 15 (2.7%) |
| $35,000 to $49,999 | 5 (2.3%) | 7 (1.3%) |
| $50,000 to $74,999 | 39 (18.0%) | 17 (3.1%) |
| $75,000 to $99,999 | 55 (25.4%) | 36 (6.6%) |
| $100,000 to $149,999 | 27 (12.4%) | 94 (17.1%) |
| $150,000 or more | 33 (15.2%) | 168 (30.5%) |
| Total | 217 (100.0%) | 550 (100.0%) |
Property Value to Household Income Ratio in Ogdensburg borough
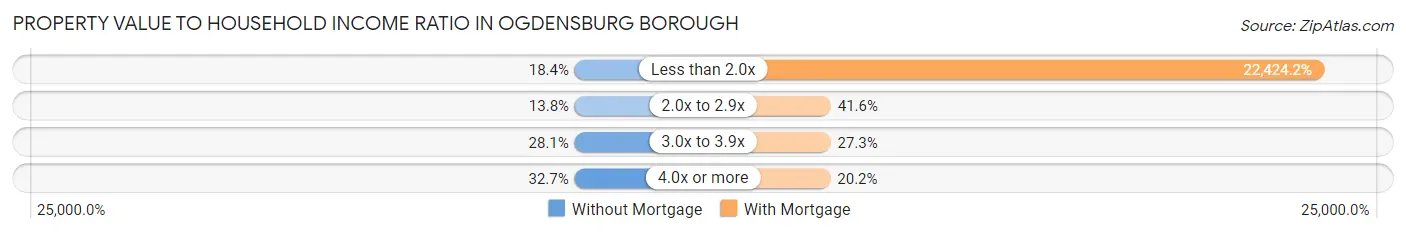
| Value-to-Income Ratio | Without Mortgage | With Mortgage |
| Less than 2.0x | 40 (18.4%) | 123,333 (22,424.2%) |
| 2.0x to 2.9x | 30 (13.8%) | 229 (41.6%) |
| 3.0x to 3.9x | 61 (28.1%) | 150 (27.3%) |
| 4.0x or more | 71 (32.7%) | 111 (20.2%) |
| Total | 217 (100.0%) | 550 (100.0%) |
Real Estate Taxes by Mortgage Status in Ogdensburg borough
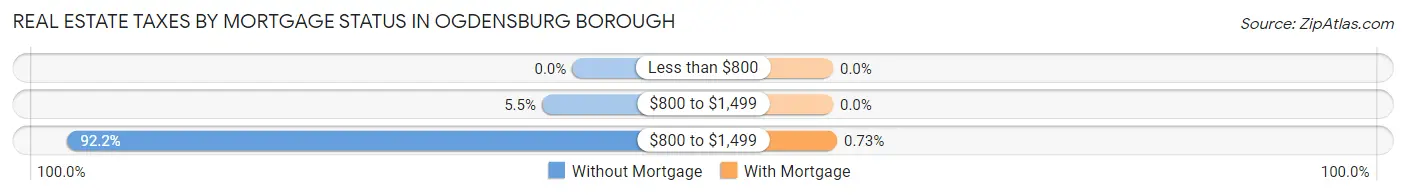
| Property Taxes | Without Mortgage | With Mortgage |
| Less than $800 | 0 (0.0%) | 0 (0.0%) |
| $800 to $1,499 | 12 (5.5%) | 0 (0.0%) |
| $800 to $1,499 | 200 (92.2%) | 4 (0.7%) |
| Total | 217 (100.0%) | 550 (100.0%) |
Health & Disability in Ogdensburg borough
Health Insurance Coverage by Age in Ogdensburg borough
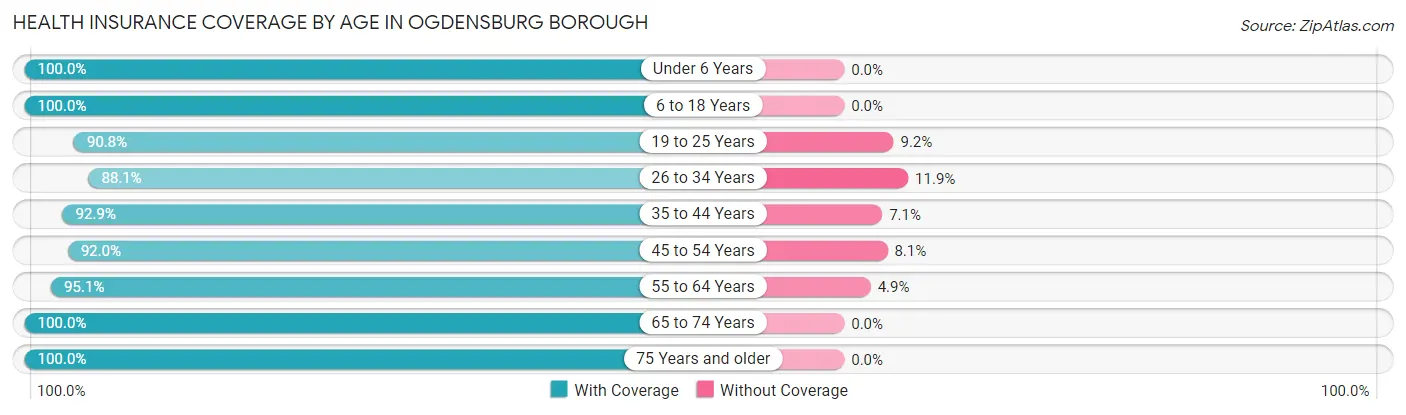
| Age Bracket | With Coverage | Without Coverage |
| Under 6 Years | 99 (100.0%) | 0 (0.0%) |
| 6 to 18 Years | 297 (100.0%) | 0 (0.0%) |
| 19 to 25 Years | 188 (90.8%) | 19 (9.2%) |
| 26 to 34 Years | 281 (88.1%) | 38 (11.9%) |
| 35 to 44 Years | 263 (92.9%) | 20 (7.1%) |
| 45 to 54 Years | 240 (91.9%) | 21 (8.1%) |
| 55 to 64 Years | 347 (95.1%) | 18 (4.9%) |
| 65 to 74 Years | 192 (100.0%) | 0 (0.0%) |
| 75 Years and older | 192 (100.0%) | 0 (0.0%) |
| Total | 2,099 (94.8%) | 116 (5.2%) |
Health Insurance Coverage by Citizenship Status in Ogdensburg borough
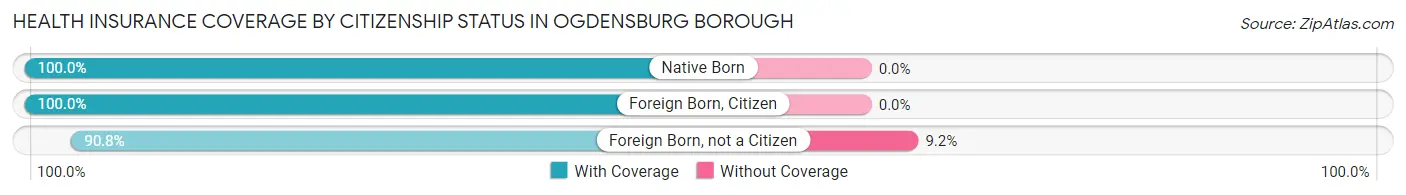
| Citizenship Status | With Coverage | Without Coverage |
| Native Born | 99 (100.0%) | 0 (0.0%) |
| Foreign Born, Citizen | 297 (100.0%) | 0 (0.0%) |
| Foreign Born, not a Citizen | 188 (90.8%) | 19 (9.2%) |
Health Insurance Coverage by Household Income in Ogdensburg borough
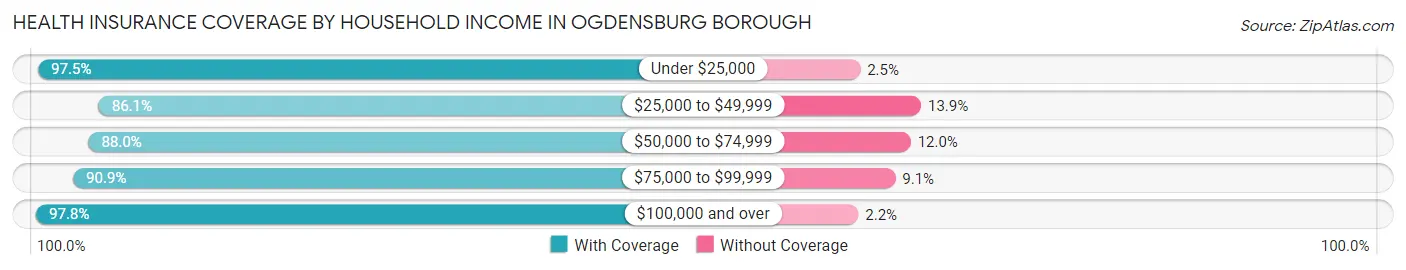
| Household Income | With Coverage | Without Coverage |
| Under $25,000 | 116 (97.5%) | 3 (2.5%) |
| $25,000 to $49,999 | 99 (86.1%) | 16 (13.9%) |
| $50,000 to $74,999 | 206 (88.0%) | 28 (12.0%) |
| $75,000 to $99,999 | 410 (90.9%) | 41 (9.1%) |
| $100,000 and over | 1,268 (97.8%) | 28 (2.2%) |
Public vs Private Health Insurance Coverage by Age in Ogdensburg borough
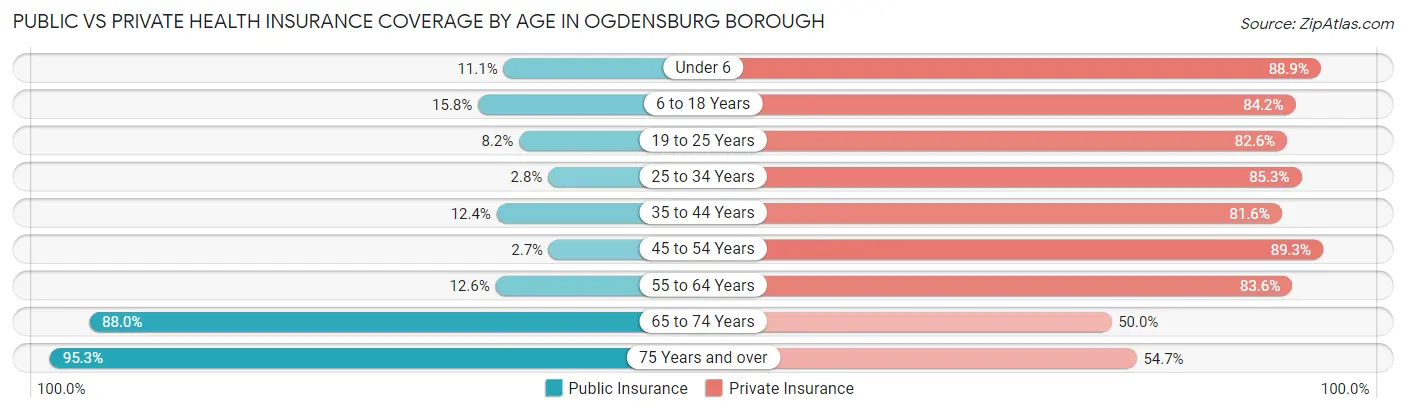
| Age Bracket | Public Insurance | Private Insurance |
| Under 6 | 11 (11.1%) | 88 (88.9%) |
| 6 to 18 Years | 47 (15.8%) | 250 (84.2%) |
| 19 to 25 Years | 17 (8.2%) | 171 (82.6%) |
| 25 to 34 Years | 9 (2.8%) | 272 (85.3%) |
| 35 to 44 Years | 35 (12.4%) | 231 (81.6%) |
| 45 to 54 Years | 7 (2.7%) | 233 (89.3%) |
| 55 to 64 Years | 46 (12.6%) | 305 (83.6%) |
| 65 to 74 Years | 169 (88.0%) | 96 (50.0%) |
| 75 Years and over | 183 (95.3%) | 105 (54.7%) |
| Total | 524 (23.7%) | 1,751 (79.0%) |
Disability Status by Sex by Age in Ogdensburg borough
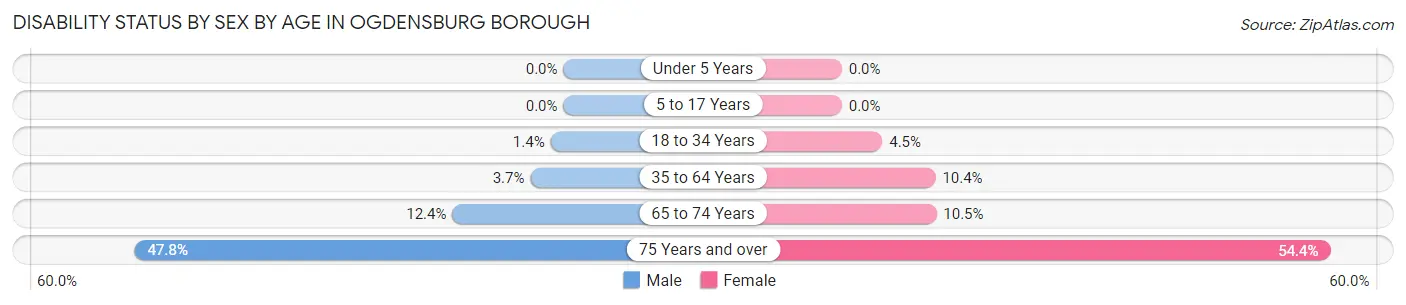
| Age Bracket | Male | Female |
| Under 5 Years | 0 (0.0%) | 0 (0.0%) |
| 5 to 17 Years | 0 (0.0%) | 0 (0.0%) |
| 18 to 34 Years | 4 (1.4%) | 12 (4.5%) |
| 35 to 64 Years | 19 (3.7%) | 41 (10.4%) |
| 65 to 74 Years | 12 (12.4%) | 10 (10.5%) |
| 75 Years and over | 32 (47.8%) | 68 (54.4%) |
Disability Class by Sex by Age in Ogdensburg borough
Disability Class: Hearing Difficulty
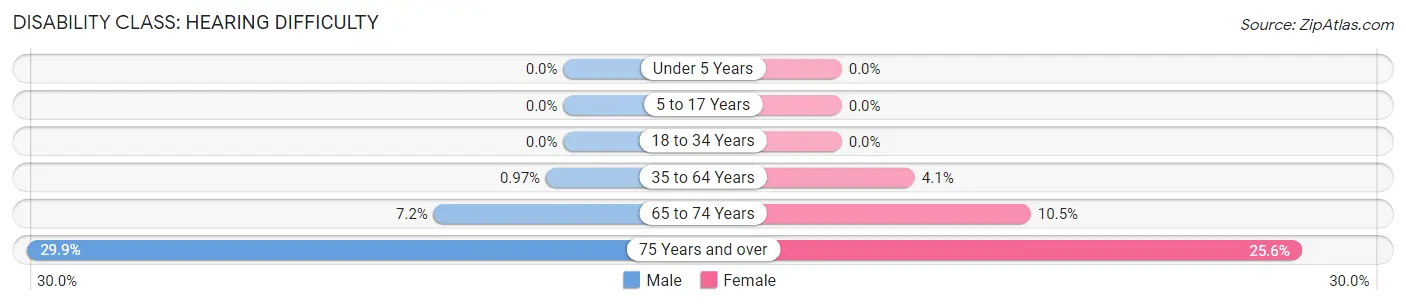
| Age Bracket | Male | Female |
| Under 5 Years | 0 (0.0%) | 0 (0.0%) |
| 5 to 17 Years | 0 (0.0%) | 0 (0.0%) |
| 18 to 34 Years | 0 (0.0%) | 0 (0.0%) |
| 35 to 64 Years | 5 (1.0%) | 16 (4.1%) |
| 65 to 74 Years | 7 (7.2%) | 10 (10.5%) |
| 75 Years and over | 20 (29.8%) | 32 (25.6%) |
Disability Class: Vision Difficulty
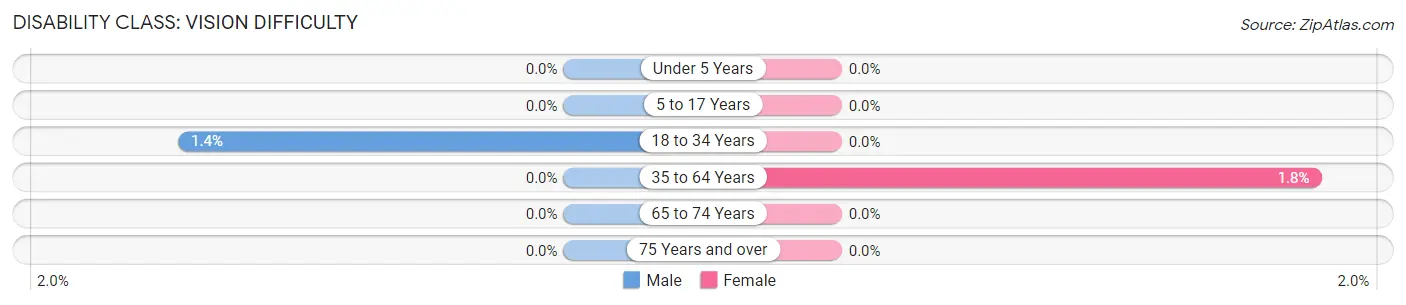
| Age Bracket | Male | Female |
| Under 5 Years | 0 (0.0%) | 0 (0.0%) |
| 5 to 17 Years | 0 (0.0%) | 0 (0.0%) |
| 18 to 34 Years | 4 (1.4%) | 0 (0.0%) |
| 35 to 64 Years | 0 (0.0%) | 7 (1.8%) |
| 65 to 74 Years | 0 (0.0%) | 0 (0.0%) |
| 75 Years and over | 0 (0.0%) | 0 (0.0%) |
Disability Class: Cognitive Difficulty
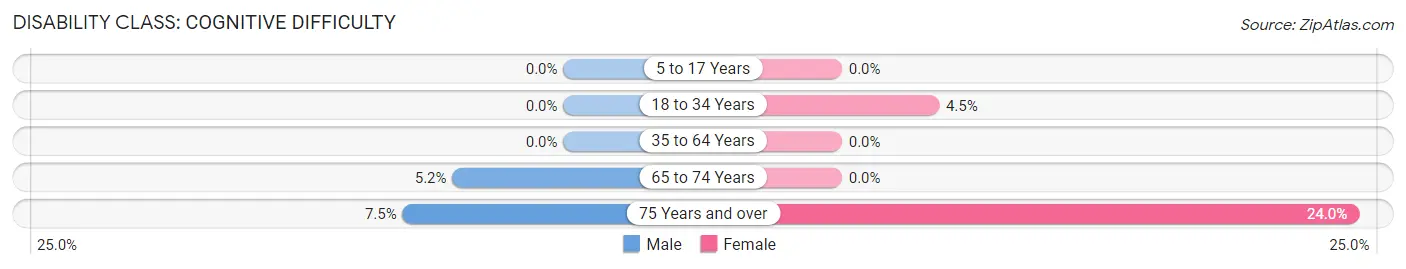
| Age Bracket | Male | Female |
| 5 to 17 Years | 0 (0.0%) | 0 (0.0%) |
| 18 to 34 Years | 0 (0.0%) | 12 (4.5%) |
| 35 to 64 Years | 0 (0.0%) | 0 (0.0%) |
| 65 to 74 Years | 5 (5.1%) | 0 (0.0%) |
| 75 Years and over | 5 (7.5%) | 30 (24.0%) |
Disability Class: Ambulatory Difficulty
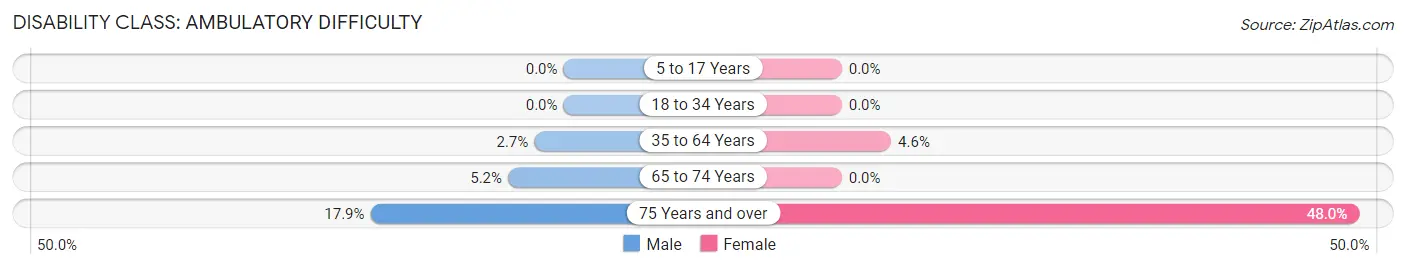
| Age Bracket | Male | Female |
| 5 to 17 Years | 0 (0.0%) | 0 (0.0%) |
| 18 to 34 Years | 0 (0.0%) | 0 (0.0%) |
| 35 to 64 Years | 14 (2.7%) | 18 (4.6%) |
| 65 to 74 Years | 5 (5.1%) | 0 (0.0%) |
| 75 Years and over | 12 (17.9%) | 60 (48.0%) |
Disability Class: Self-Care Difficulty
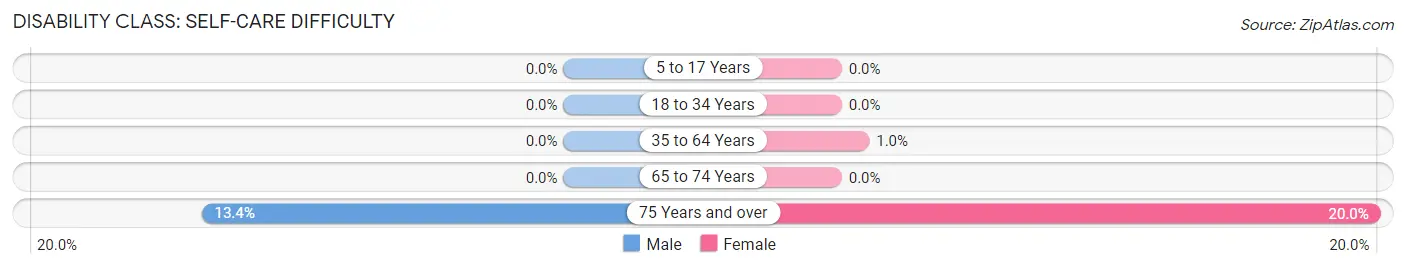
| Age Bracket | Male | Female |
| 5 to 17 Years | 0 (0.0%) | 0 (0.0%) |
| 18 to 34 Years | 0 (0.0%) | 0 (0.0%) |
| 35 to 64 Years | 0 (0.0%) | 4 (1.0%) |
| 65 to 74 Years | 0 (0.0%) | 0 (0.0%) |
| 75 Years and over | 9 (13.4%) | 25 (20.0%) |
Technology Access in Ogdensburg borough
Computing Device Access in Ogdensburg borough
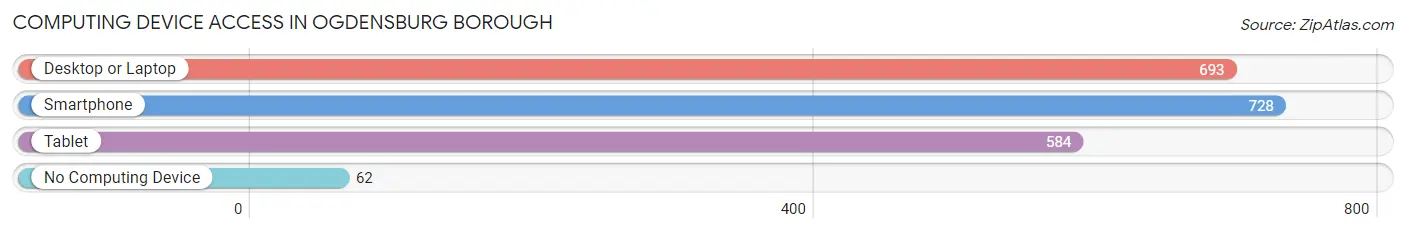
| Device Type | # Households | % Households |
| Desktop or Laptop | 693 | 83.8% |
| Smartphone | 728 | 88.0% |
| Tablet | 584 | 70.6% |
| No Computing Device | 62 | 7.5% |
| Total | 827 | 100.0% |
Internet Access in Ogdensburg borough
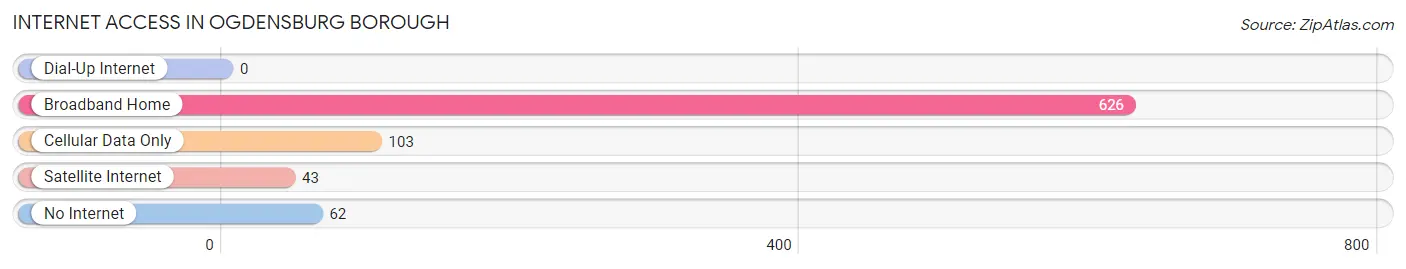
| Internet Type | # Households | % Households |
| Dial-Up Internet | 0 | 0.0% |
| Broadband Home | 626 | 75.7% |
| Cellular Data Only | 103 | 12.4% |
| Satellite Internet | 43 | 5.2% |
| No Internet | 62 | 7.5% |
| Total | 827 | 100.0% |
Ogdensburg borough Summary
Ogdensburg Borough is a small borough located in Sussex County, New Jersey. It is situated in the Kittatinny Valley, which is part of the Great Appalachian Valley. The borough is bordered by the townships of Sparta, Byram, and Frankford. Ogdensburg is home to a population of approximately 2,000 people, and is known for its rural charm and small-town atmosphere.
Geography
Ogdensburg Borough is located in the Kittatinny Valley, which is part of the Great Appalachian Valley. The borough is bordered by the townships of Sparta, Byram, and Frankford. The borough is situated on the banks of the Pequest River, which is a tributary of the Delaware River. The borough is located in the Kittatinny Mountains, which are part of the Appalachian Mountains. The highest point in the borough is the summit of Mount Tammany, which is 1,717 feet above sea level. The borough is located in a temperate climate zone, with an average annual temperature of 52 degrees Fahrenheit.
History
Ogdensburg Borough was founded in 1790 by John Ogden, who was a Revolutionary War veteran. The borough was originally part of the township of Byram, but was incorporated as its own borough in 1891. The borough was named after John Ogden, and was originally a farming community. The borough was home to several mills, including a grist mill, a saw mill, and a paper mill. The paper mill was the largest employer in the borough, and was in operation until the early 1900s.
Economy
Ogdensburg Borough is a small, rural community with a population of approximately 2,000 people. The borough is home to several small businesses, including a few restaurants, a grocery store, and a few retail stores. The borough is also home to a few manufacturing companies, including a plastics manufacturer and a metal fabrication company. The borough is also home to a few farms, which produce a variety of crops, including corn, soybeans, and hay.
Demographics
As of the 2010 census, the population of Ogdensburg Borough was 2,039. The racial makeup of the borough was 94.3% White, 2.2% African American, 0.3% Native American, 0.7% Asian, 0.1% Pacific Islander, and 2.4% from other races. The median household income in the borough was $60,938, and the median family income was $68,750. The per capita income in the borough was $25,945.
Conclusion
Ogdensburg Borough is a small borough located in Sussex County, New Jersey. It is situated in the Kittatinny Valley, which is part of the Great Appalachian Valley. The borough is bordered by the townships of Sparta, Byram, and Frankford. Ogdensburg is home to a population of approximately 2,000 people, and is known for its rural charm and small-town atmosphere. The borough is home to several small businesses, including a few restaurants, a grocery store, and a few retail stores. The borough is also home to a few manufacturing companies, including a plastics manufacturer and a metal fabrication company. The borough is also home to a few farms, which produce a variety of crops, including corn, soybeans, and hay. As of the 2010 census, the population of Ogdensburg Borough was 2,039. The racial makeup of the borough was 94.3% White, 2.2% African American, 0.3% Native American, 0.7% Asian, 0.1% Pacific Islander, and 2.4% from other races. The median household income in the borough was $60,938, and the median family income was $68,750. The per capita income in the borough was $25,945.
Common Questions
What is Per Capita Income in Ogdensburg borough?
Per Capita income in Ogdensburg borough is $46,674.
What is the Median Family Income in Ogdensburg borough?
Median Family Income in Ogdensburg borough is $116,161.
What is the Median Household income in Ogdensburg borough?
Median Household Income in Ogdensburg borough is $107,569.
What is Income or Wage Gap in Ogdensburg borough?
Income or Wage Gap in Ogdensburg borough is 32.7%.
Women in Ogdensburg borough earn 67.3 cents for every dollar earned by a man.
What is Inequality or Gini Index in Ogdensburg borough?
Inequality or Gini Index in Ogdensburg borough is 0.37.
What is the Total Population of Ogdensburg borough?
Total Population of Ogdensburg borough is 2,215.
What is the Total Male Population of Ogdensburg borough?
Total Male Population of Ogdensburg borough is 1,106.
What is the Total Female Population of Ogdensburg borough?
Total Female Population of Ogdensburg borough is 1,109.
What is the Ratio of Males per 100 Females in Ogdensburg borough?
There are 99.73 Males per 100 Females in Ogdensburg borough.
What is the Ratio of Females per 100 Males in Ogdensburg borough?
There are 100.27 Females per 100 Males in Ogdensburg borough.
What is the Median Population Age in Ogdensburg borough?
Median Population Age in Ogdensburg borough is 42.0 Years.
What is the Average Family Size in Ogdensburg borough
Average Family Size in Ogdensburg borough is 3.0 People.
What is the Average Household Size in Ogdensburg borough
Average Household Size in Ogdensburg borough is 2.7 People.
How Large is the Labor Force in Ogdensburg borough?
There are 1,392 People in the Labor Forcein in Ogdensburg borough.
What is the Percentage of People in the Labor Force in Ogdensburg borough?
74.3% of People are in the Labor Force in Ogdensburg borough.
What is the Unemployment Rate in Ogdensburg borough?
Unemployment Rate in Ogdensburg borough is 12.6%.