Zip Codes with the Highest Percentage of Population Employed in Architecture & Engineering in Montclair, NJ
RELATED REPORTS & OPTIONS
Architecture & Engineering
Montclair
Compare Zip Codes
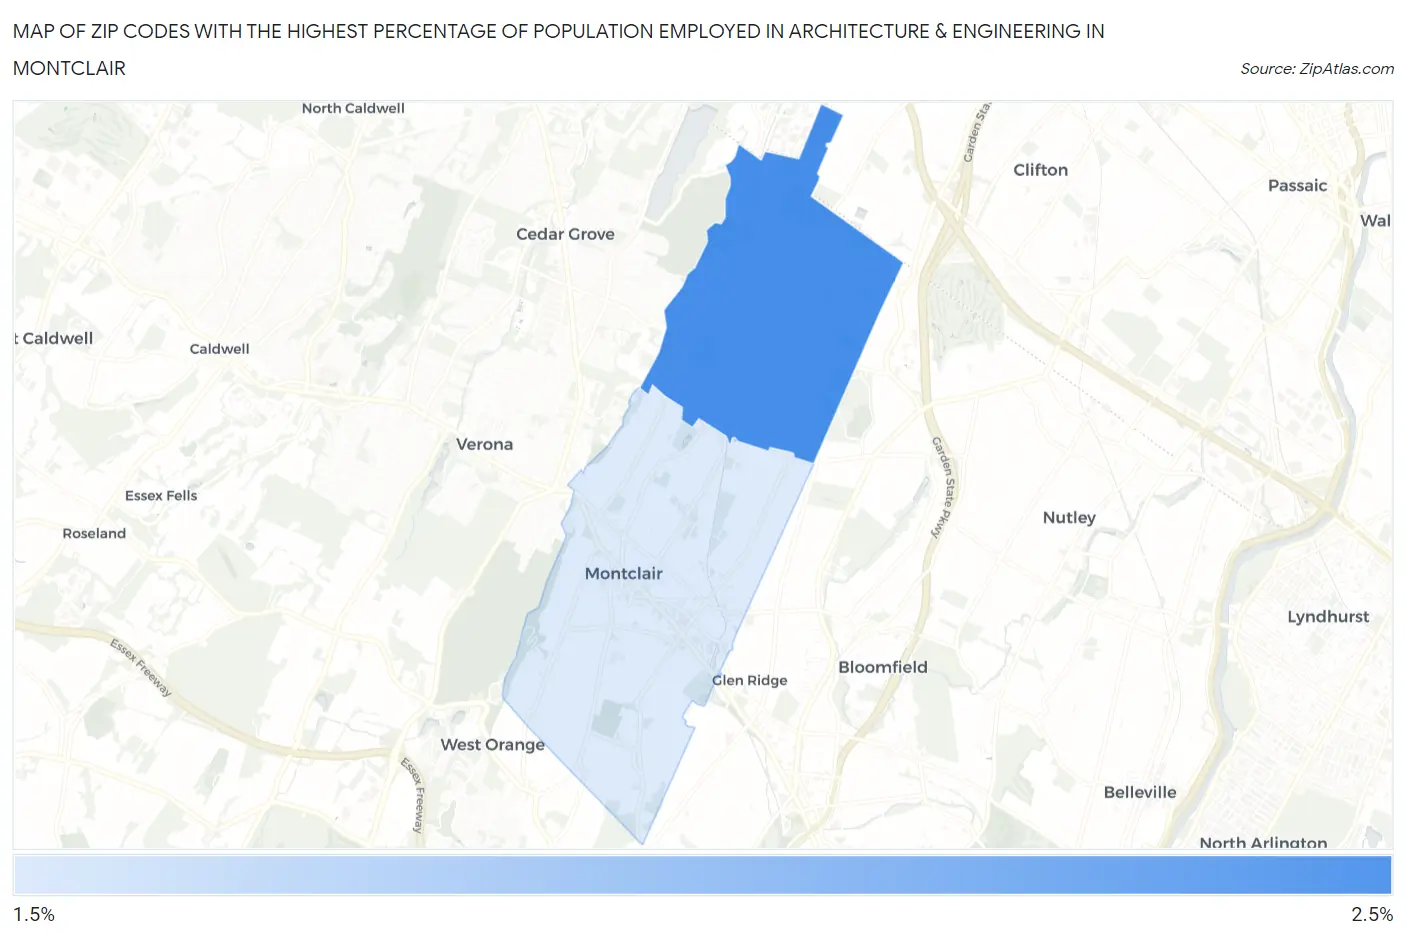
Map of Zip Codes with the Highest Percentage of Population Employed in Architecture & Engineering in Montclair
1.9%
2.4%
Zip Codes with the Highest Percentage of Population Employed in Architecture & Engineering in Montclair, NJ
| Zip Code | % Employed | vs State | vs National | |
| 1. | 07043 | 2.4% | 1.9%(+0.523)#155 | 2.1%(+0.266)#7,405 |
| 2. | 07042 | 1.9% | 1.9%(+0.015)#248 | 2.1%(-0.241)#10,179 |
1
Common Questions
What are the Top Zip Codes with the Highest Percentage of Population Employed in Architecture & Engineering in Montclair, NJ?
Top Zip Codes with the Highest Percentage of Population Employed in Architecture & Engineering in Montclair, NJ are:
What zip code has the Highest Percentage of Population Employed in Architecture & Engineering in Montclair, NJ?
07043 has the Highest Percentage of Population Employed in Architecture & Engineering in Montclair, NJ with 2.4%.
What is the Percentage of Population Employed in Architecture & Engineering in New Jersey?
Percentage of Population Employed in Architecture & Engineering in New Jersey is 1.9%.
What is the Percentage of Population Employed in Architecture & Engineering in the United States?
Percentage of Population Employed in Architecture & Engineering in the United States is 2.1%.