Vernon Center, NJ Map & Demographics
Vernon Center Map
Vernon Center Overview
$50,045
PER CAPITA INCOME
$84,625
AVG FAMILY INCOME
$69,519
AVG HOUSEHOLD INCOME
37.0%
WAGE / INCOME GAP [ % ]
63.0¢/ $1
WAGE / INCOME GAP [ $ ]
0.38
INEQUALITY / GINI INDEX
1,493
TOTAL POPULATION
870
MALE POPULATION
623
FEMALE POPULATION
139.65
MALES / 100 FEMALES
71.61
FEMALES / 100 MALES
41.4
MEDIAN AGE
2.2
AVG FAMILY SIZE
1.5
AVG HOUSEHOLD SIZE
1,186
LABOR FORCE [ PEOPLE ]
82.0%
PERCENT IN LABOR FORCE
1.8%
UNEMPLOYMENT RATE
Income in Vernon Center
Income Overview in Vernon Center
Per Capita Income in Vernon Center is $50,045, while median incomes of families and households are $84,625 and $69,519 respectively.
| Characteristic | Number | Measure |
| Per Capita Income | 1,493 | $50,045 |
| Median Family Income | 292 | $84,625 |
| Mean Family Income | 292 | $93,018 |
| Median Household Income | 971 | $69,519 |
| Mean Household Income | 971 | $77,142 |
| Income Deficit | 292 | $0 |
| Wage / Income Gap (%) | 1,493 | 37.05% |
| Wage / Income Gap ($) | 1,493 | 62.95¢ per $1 |
| Gini / Inequality Index | 1,493 | 0.38 |
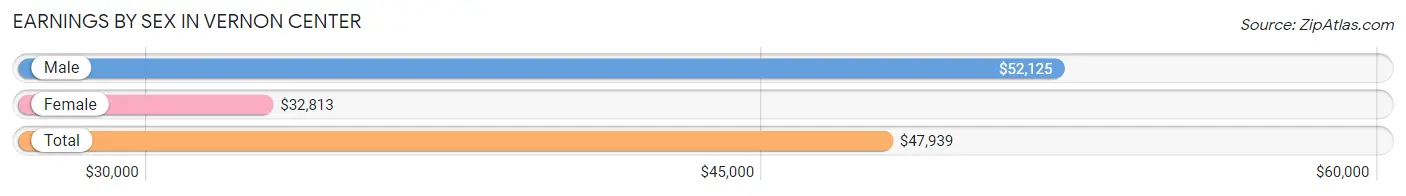
Earnings by Sex in Vernon Center
Average Earnings in Vernon Center are $47,939, $52,125 for men and $32,813 for women, a difference of 37.0%.
| Sex | Number | Average Earnings |
| Male | 686 (58.2%) | $52,125 |
| Female | 492 (41.8%) | $32,813 |
| Total | 1,178 (100.0%) | $47,939 |
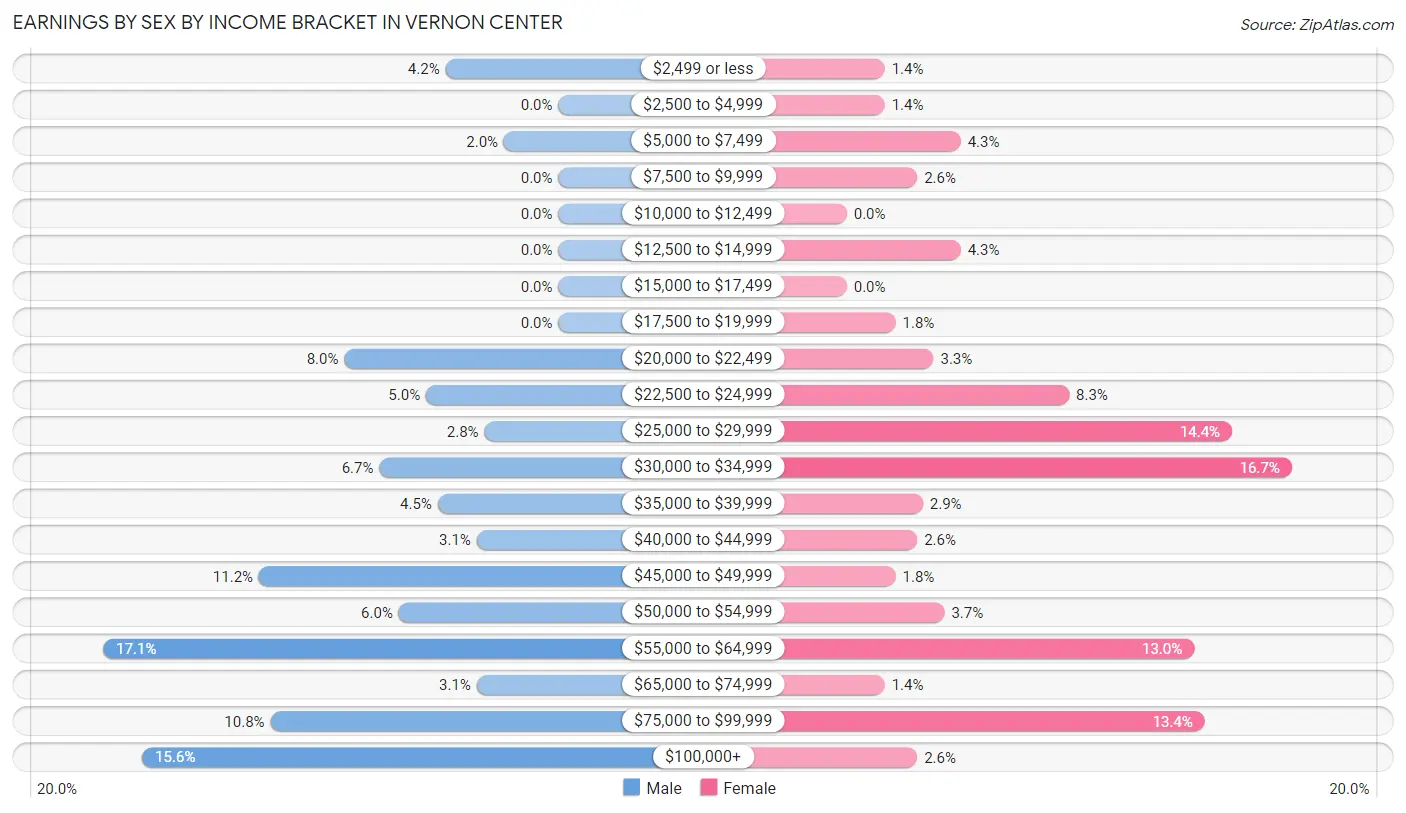
Earnings by Sex by Income Bracket in Vernon Center
The most common earnings brackets in Vernon Center are $55,000 to $64,999 for men (117 | 17.1%) and $30,000 to $34,999 for women (82 | 16.7%).
| Income | Male | Female |
| $2,499 or less | 29 (4.2%) | 7 (1.4%) |
| $2,500 to $4,999 | 0 (0.0%) | 7 (1.4%) |
| $5,000 to $7,499 | 14 (2.0%) | 21 (4.3%) |
| $7,500 to $9,999 | 0 (0.0%) | 13 (2.6%) |
| $10,000 to $12,499 | 0 (0.0%) | 0 (0.0%) |
| $12,500 to $14,999 | 0 (0.0%) | 21 (4.3%) |
| $15,000 to $17,499 | 0 (0.0%) | 0 (0.0%) |
| $17,500 to $19,999 | 0 (0.0%) | 9 (1.8%) |
| $20,000 to $22,499 | 55 (8.0%) | 16 (3.3%) |
| $22,500 to $24,999 | 34 (5.0%) | 41 (8.3%) |
| $25,000 to $29,999 | 19 (2.8%) | 71 (14.4%) |
| $30,000 to $34,999 | 46 (6.7%) | 82 (16.7%) |
| $35,000 to $39,999 | 31 (4.5%) | 14 (2.9%) |
| $40,000 to $44,999 | 21 (3.1%) | 13 (2.6%) |
| $45,000 to $49,999 | 77 (11.2%) | 9 (1.8%) |
| $50,000 to $54,999 | 41 (6.0%) | 18 (3.7%) |
| $55,000 to $64,999 | 117 (17.1%) | 64 (13.0%) |
| $65,000 to $74,999 | 21 (3.1%) | 7 (1.4%) |
| $75,000 to $99,999 | 74 (10.8%) | 66 (13.4%) |
| $100,000+ | 107 (15.6%) | 13 (2.6%) |
| Total | 686 (100.0%) | 492 (100.0%) |
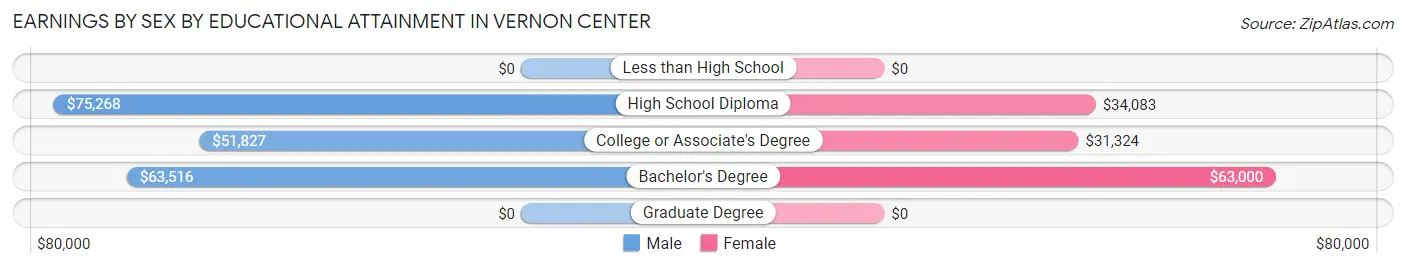
Earnings by Sex by Educational Attainment in Vernon Center
Average earnings in Vernon Center are $58,438 for men and $33,750 for women, a difference of 42.2%. Men with an educational attainment of high school diploma enjoy the highest average annual earnings of $75,268, while those with college or associate's degree education earn the least with $51,827. Women with an educational attainment of bachelor's degree earn the most with the average annual earnings of $63,000, while those with college or associate's degree education have the smallest earnings of $31,324.
| Educational Attainment | Male Income | Female Income |
| Less than High School | - | - |
| High School Diploma | $75,268 | $34,083 |
| College or Associate's Degree | $51,827 | $31,324 |
| Bachelor's Degree | $63,516 | $63,000 |
| Graduate Degree | - | - |
| Total | $58,438 | $33,750 |
Family Income in Vernon Center
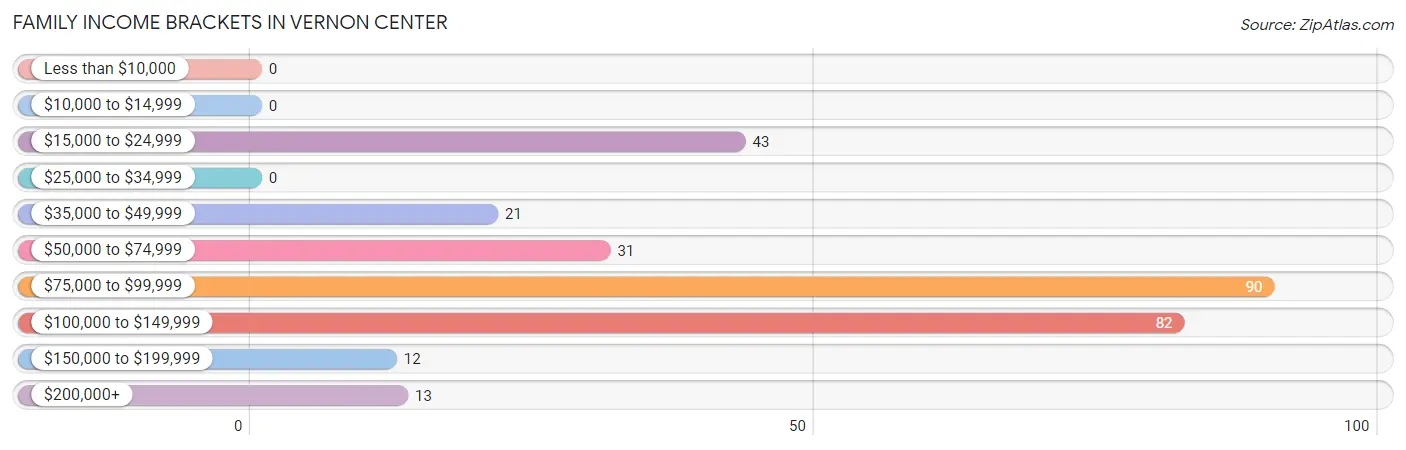
Family Income Brackets in Vernon Center
According to the Vernon Center family income data, there are 90 families falling into the $75,000 to $99,999 income range, which is the most common income bracket and makes up 30.8% of all families.
| Income Bracket | # Families | % Families |
| Less than $10,000 | 0 | 0.0% |
| $10,000 to $14,999 | 0 | 0.0% |
| $15,000 to $24,999 | 43 | 14.7% |
| $25,000 to $34,999 | 0 | 0.0% |
| $35,000 to $49,999 | 21 | 7.2% |
| $50,000 to $74,999 | 31 | 10.6% |
| $75,000 to $99,999 | 90 | 30.8% |
| $100,000 to $149,999 | 82 | 28.1% |
| $150,000 to $199,999 | 12 | 4.1% |
| $200,000+ | 13 | 4.5% |
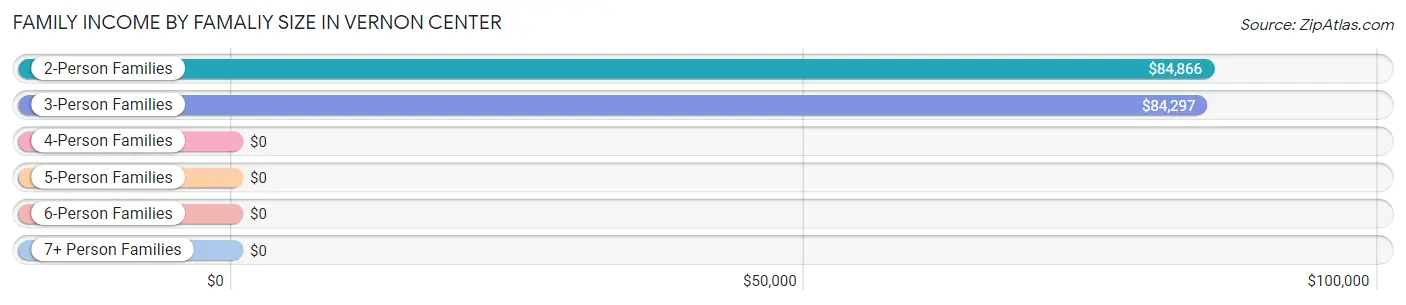
Family Income by Famaliy Size in Vernon Center
2-person families (201 | 68.8%) account for the highest median family income in Vernon Center with $84,866 per family, while 2-person families (201 | 68.8%) have the highest median income of $42,433 per family member.
| Income Bracket | # Families | Median Income |
| 2-Person Families | 201 (68.8%) | $84,866 |
| 3-Person Families | 88 (30.1%) | $84,297 |
| 4-Person Families | 3 (1.0%) | $0 |
| 5-Person Families | 0 (0.0%) | $0 |
| 6-Person Families | 0 (0.0%) | $0 |
| 7+ Person Families | 0 (0.0%) | $0 |
| Total | 292 (100.0%) | $84,625 |
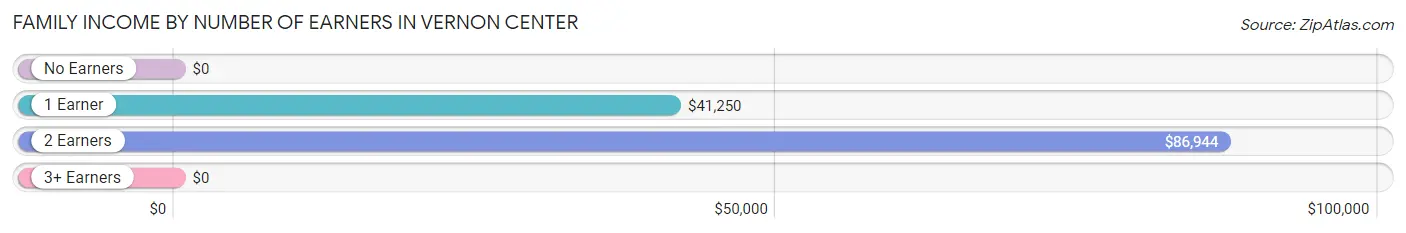
Family Income by Number of Earners in Vernon Center
| Number of Earners | # Families | Median Income |
| No Earners | 12 (4.1%) | $0 |
| 1 Earner | 65 (22.3%) | $41,250 |
| 2 Earners | 200 (68.5%) | $86,944 |
| 3+ Earners | 15 (5.1%) | $0 |
| Total | 292 (100.0%) | $84,625 |
Household Income in Vernon Center
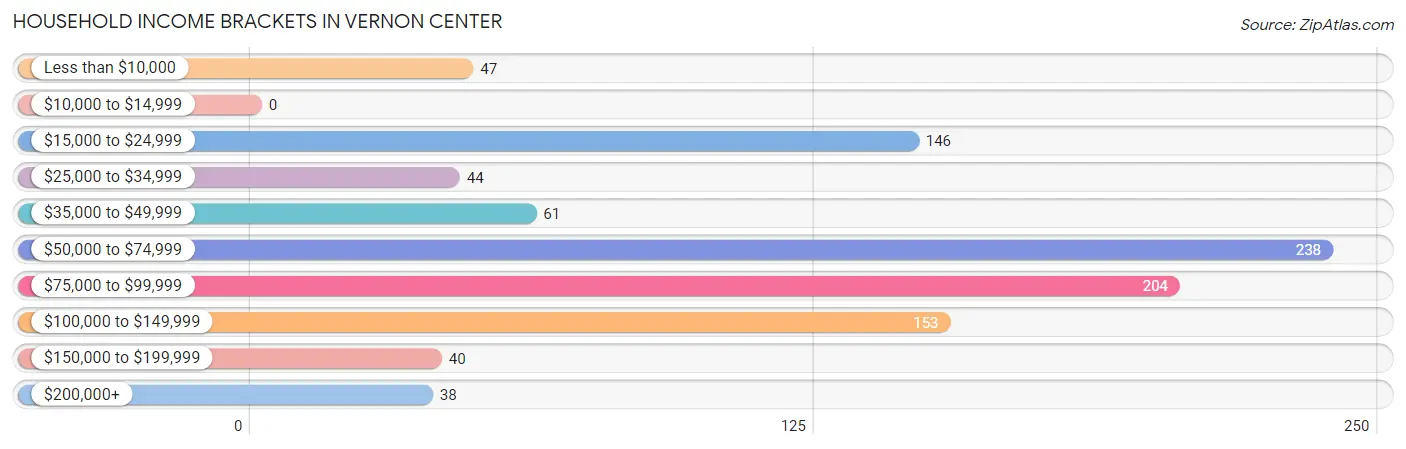
Household Income Brackets in Vernon Center
With 238 households falling in the category, the $50,000 to $74,999 income range is the most frequent in Vernon Center, accounting for 24.5% of all households.
| Income Bracket | # Households | % Households |
| Less than $10,000 | 47 | 4.8% |
| $10,000 to $14,999 | 0 | 0.0% |
| $15,000 to $24,999 | 146 | 15.0% |
| $25,000 to $34,999 | 44 | 4.5% |
| $35,000 to $49,999 | 61 | 6.3% |
| $50,000 to $74,999 | 238 | 24.5% |
| $75,000 to $99,999 | 204 | 21.0% |
| $100,000 to $149,999 | 153 | 15.8% |
| $150,000 to $199,999 | 40 | 4.1% |
| $200,000+ | 38 | 3.9% |
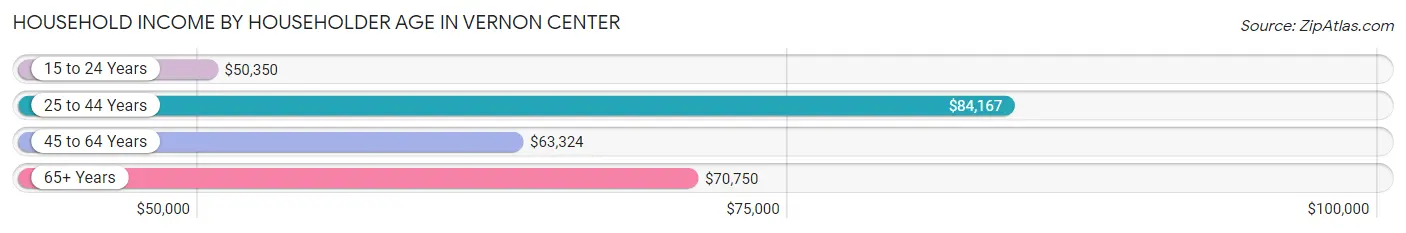
Household Income by Householder Age in Vernon Center
The median household income in Vernon Center is $69,519, with the highest median household income of $84,167 found in the 25 to 44 years age bracket for the primary householder. A total of 328 households (33.8%) fall into this category. Meanwhile, the 15 to 24 years age bracket for the primary householder has the lowest median household income of $50,350, with 159 households (16.4%) in this group.
| Income Bracket | # Households | Median Income |
| 15 to 24 Years | 159 (16.4%) | $50,350 |
| 25 to 44 Years | 328 (33.8%) | $84,167 |
| 45 to 64 Years | 303 (31.2%) | $63,324 |
| 65+ Years | 181 (18.6%) | $70,750 |
| Total | 971 (100.0%) | $69,519 |
Poverty in Vernon Center
Income Below Poverty by Sex and Age in Vernon Center
With 10.1% poverty level for males and 6.3% for females among the residents of Vernon Center, 16 and 17 year old males and 55 to 64 year old females are the most vulnerable to poverty, with 29 males (100.0%) and 28 females (28.6%) in their respective age groups living below the poverty level.
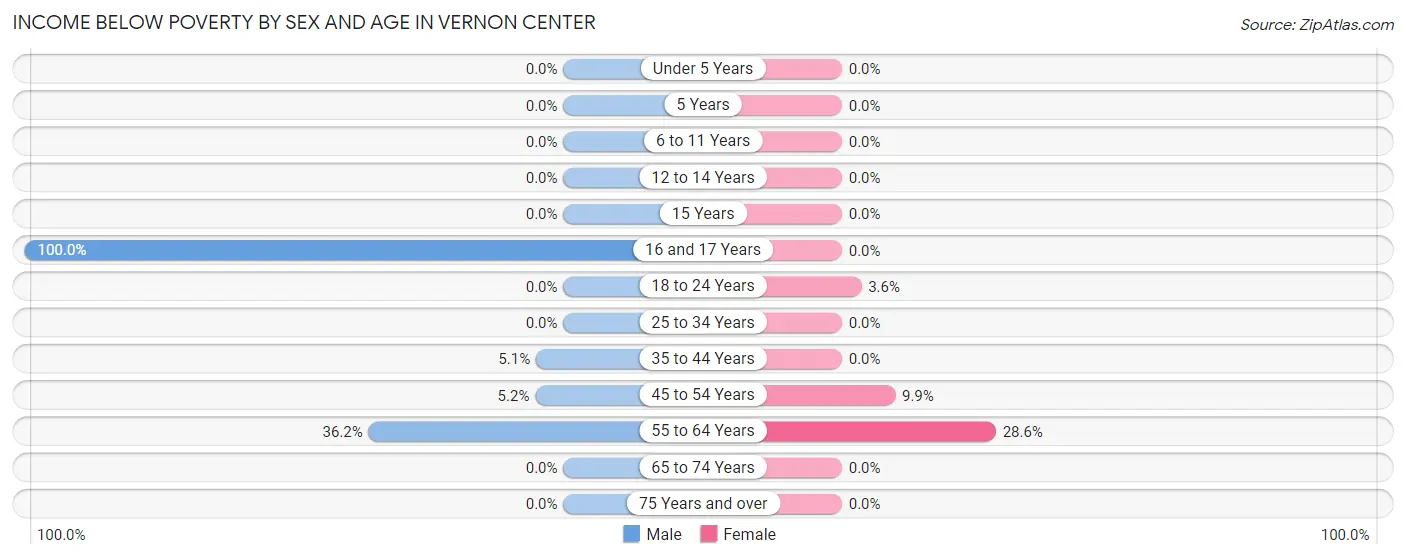
| Age Bracket | Male | Female |
| Under 5 Years | 0 (0.0%) | 0 (0.0%) |
| 5 Years | 0 (0.0%) | 0 (0.0%) |
| 6 to 11 Years | 0 (0.0%) | 0 (0.0%) |
| 12 to 14 Years | 0 (0.0%) | 0 (0.0%) |
| 15 Years | 0 (0.0%) | 0 (0.0%) |
| 16 and 17 Years | 29 (100.0%) | 0 (0.0%) |
| 18 to 24 Years | 0 (0.0%) | 3 (3.6%) |
| 25 to 34 Years | 0 (0.0%) | 0 (0.0%) |
| 35 to 44 Years | 6 (5.1%) | 0 (0.0%) |
| 45 to 54 Years | 6 (5.2%) | 8 (9.9%) |
| 55 to 64 Years | 47 (36.1%) | 28 (28.6%) |
| 65 to 74 Years | 0 (0.0%) | 0 (0.0%) |
| 75 Years and over | 0 (0.0%) | 0 (0.0%) |
| Total | 88 (10.1%) | 39 (6.3%) |
Income Above Poverty by Sex and Age in Vernon Center
According to the poverty statistics in Vernon Center, males aged under 5 years and females aged under 5 years are the age groups that are most secure financially, with 100.0% of males and 100.0% of females in these age groups living above the poverty line.
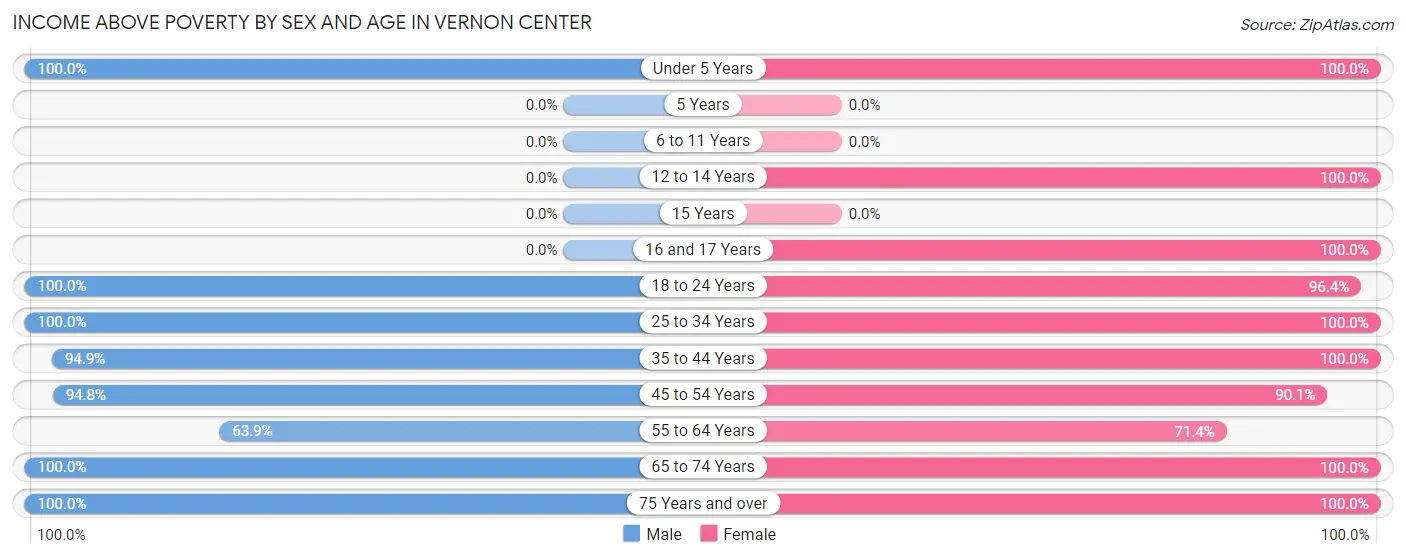
| Age Bracket | Male | Female |
| Under 5 Years | 20 (100.0%) | 22 (100.0%) |
| 5 Years | 0 (0.0%) | 0 (0.0%) |
| 6 to 11 Years | 0 (0.0%) | 0 (0.0%) |
| 12 to 14 Years | 0 (0.0%) | 2 (100.0%) |
| 15 Years | 0 (0.0%) | 0 (0.0%) |
| 16 and 17 Years | 0 (0.0%) | 26 (100.0%) |
| 18 to 24 Years | 146 (100.0%) | 80 (96.4%) |
| 25 to 34 Years | 187 (100.0%) | 146 (100.0%) |
| 35 to 44 Years | 112 (94.9%) | 86 (100.0%) |
| 45 to 54 Years | 109 (94.8%) | 73 (90.1%) |
| 55 to 64 Years | 83 (63.8%) | 70 (71.4%) |
| 65 to 74 Years | 74 (100.0%) | 49 (100.0%) |
| 75 Years and over | 51 (100.0%) | 27 (100.0%) |
| Total | 782 (89.9%) | 581 (93.7%) |
Income Below Poverty Among Married-Couple Families in Vernon Center
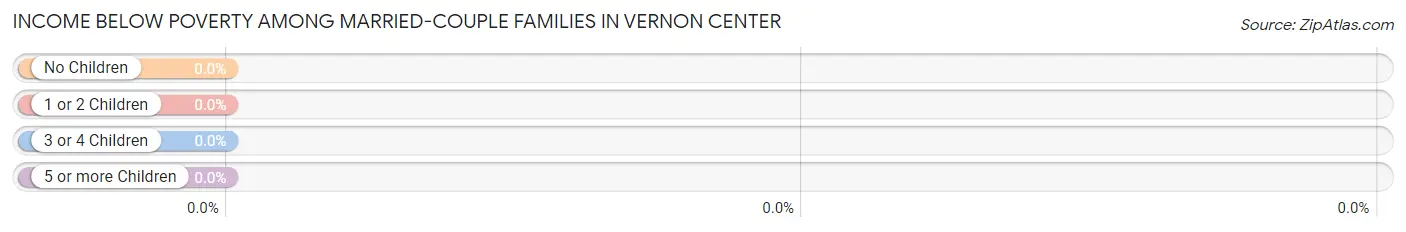
| Children | Above Poverty | Below Poverty |
| No Children | 118 (100.0%) | 0 (0.0%) |
| 1 or 2 Children | 64 (100.0%) | 0 (0.0%) |
| 3 or 4 Children | 0 (0.0%) | 0 (0.0%) |
| 5 or more Children | 0 (0.0%) | 0 (0.0%) |
| Total | 182 (100.0%) | 0 (0.0%) |
Income Below Poverty Among Single-Parent Households in Vernon Center
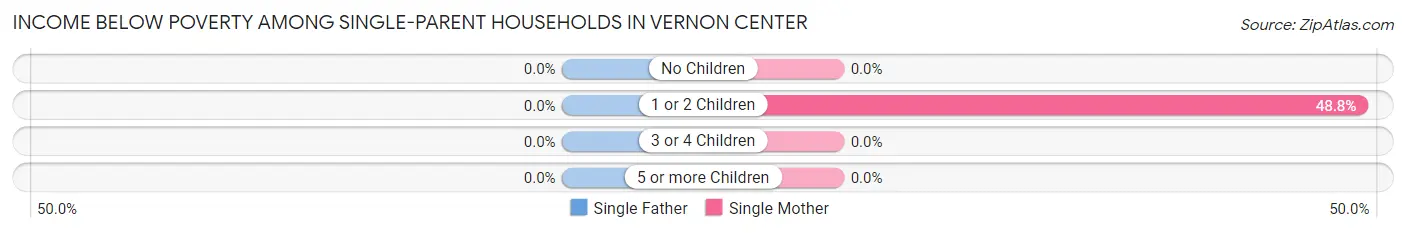
| Children | Single Father | Single Mother |
| No Children | 0 (0.0%) | 0 (0.0%) |
| 1 or 2 Children | 0 (0.0%) | 21 (48.8%) |
| 3 or 4 Children | 0 (0.0%) | 0 (0.0%) |
| 5 or more Children | 0 (0.0%) | 0 (0.0%) |
| Total | 0 (0.0%) | 21 (22.1%) |
Income Below Poverty Among Married-Couple vs Single-Parent Households in Vernon Center
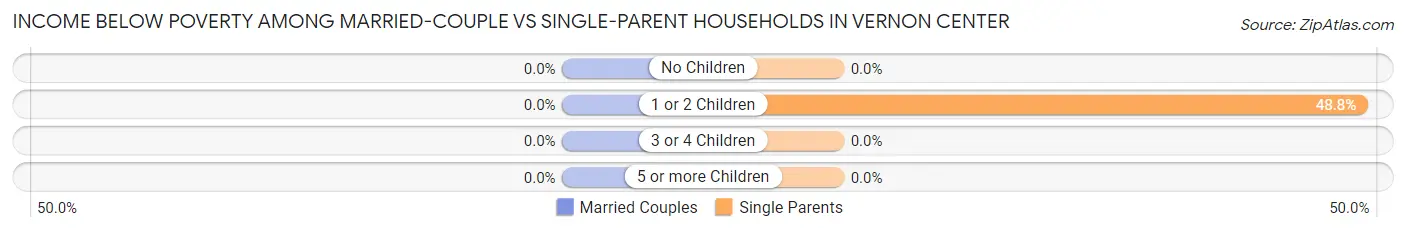
| Children | Married-Couple Families | Single-Parent Households |
| No Children | 0 (0.0%) | 0 (0.0%) |
| 1 or 2 Children | 0 (0.0%) | 21 (48.8%) |
| 3 or 4 Children | 0 (0.0%) | 0 (0.0%) |
| 5 or more Children | 0 (0.0%) | 0 (0.0%) |
| Total | 0 (0.0%) | 21 (19.1%) |
Race in Vernon Center
The most populous races in Vernon Center are White / Caucasian (1,286 | 86.1%), Hispanic or Latino (152 | 10.2%), and Two or more Races (76 | 5.1%).
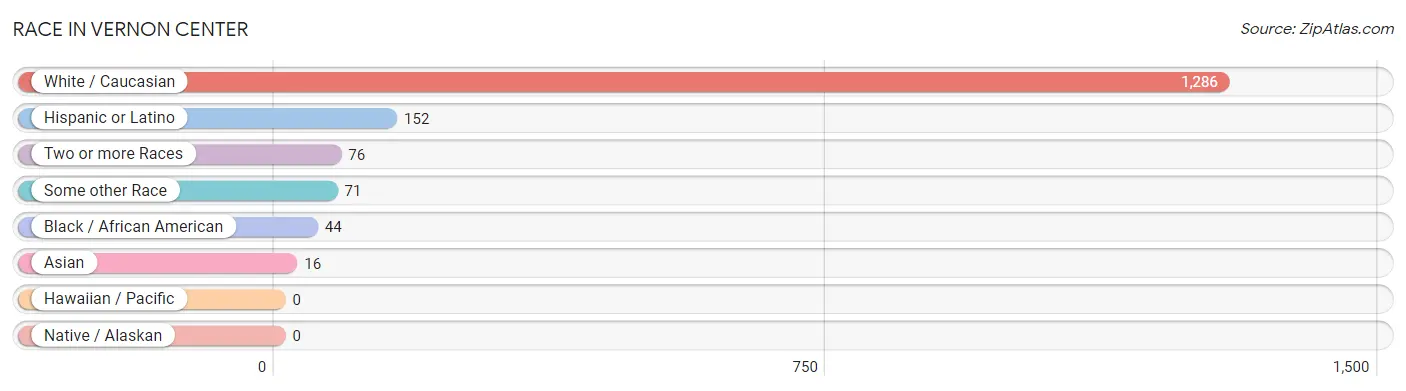
| Race | # Population | % Population |
| Asian | 16 | 1.1% |
| Black / African American | 44 | 2.9% |
| Hawaiian / Pacific | 0 | 0.0% |
| Hispanic or Latino | 152 | 10.2% |
| Native / Alaskan | 0 | 0.0% |
| White / Caucasian | 1,286 | 86.1% |
| Two or more Races | 76 | 5.1% |
| Some other Race | 71 | 4.8% |
| Total | 1,493 | 100.0% |
Ancestry in Vernon Center
The most populous ancestries reported in Vernon Center are Italian (402 | 26.9%), Irish (369 | 24.7%), German (358 | 24.0%), French (99 | 6.6%), and English (96 | 6.4%), together accounting for 88.7% of all Vernon Center residents.
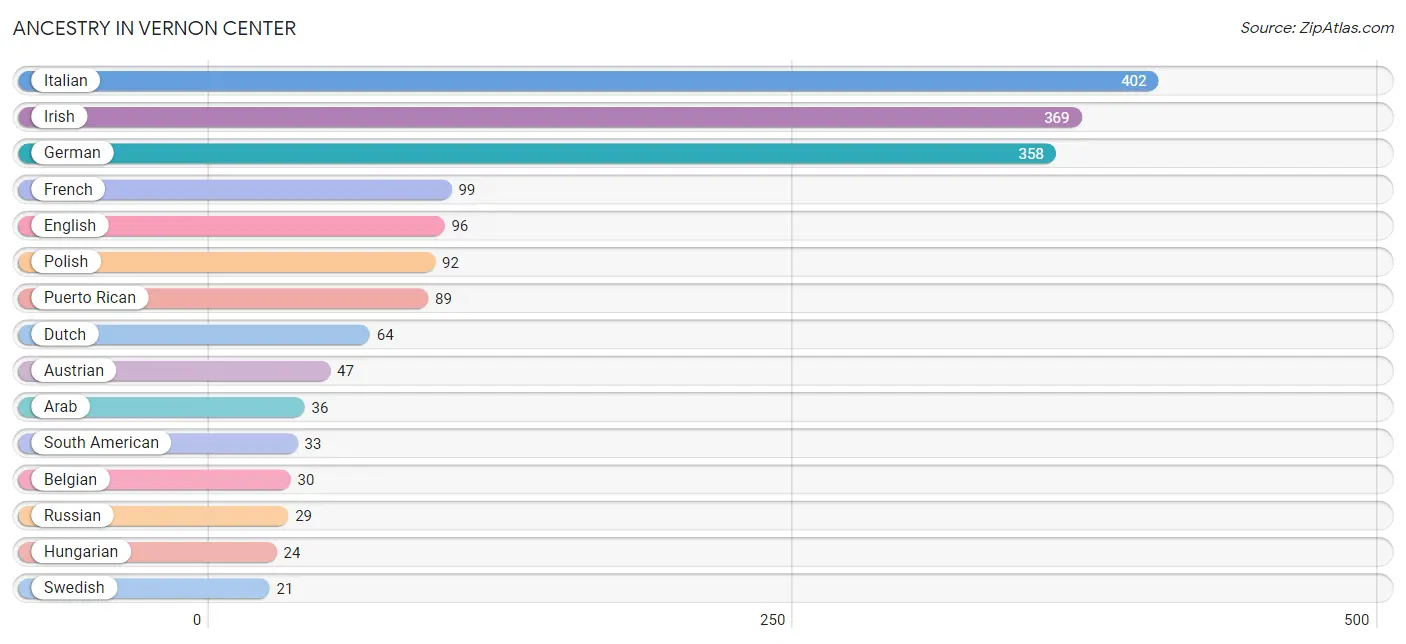
| Ancestry | # Population | % Population |
| American | 10 | 0.7% |
| Arab | 36 | 2.4% |
| Argentinean | 2 | 0.1% |
| Austrian | 47 | 3.2% |
| Belgian | 30 | 2.0% |
| Central American | 11 | 0.7% |
| Chilean | 19 | 1.3% |
| Danish | 9 | 0.6% |
| Dutch | 64 | 4.3% |
| Ecuadorian | 12 | 0.8% |
| Egyptian | 14 | 0.9% |
| English | 96 | 6.4% |
| French | 99 | 6.6% |
| German | 358 | 24.0% |
| Honduran | 11 | 0.7% |
| Hungarian | 24 | 1.6% |
| Irish | 369 | 24.7% |
| Italian | 402 | 26.9% |
| Jordanian | 8 | 0.5% |
| Polish | 92 | 6.2% |
| Portuguese | 11 | 0.7% |
| Puerto Rican | 89 | 6.0% |
| Romanian | 12 | 0.8% |
| Russian | 29 | 1.9% |
| Scotch-Irish | 18 | 1.2% |
| Scottish | 14 | 0.9% |
| Slovak | 9 | 0.6% |
| South American | 33 | 2.2% |
| Swedish | 21 | 1.4% |
| Swiss | 6 | 0.4% |
| Syrian | 14 | 0.9% |
| Thai | 16 | 1.1% | View All 32 Rows |
Immigrants in Vernon Center
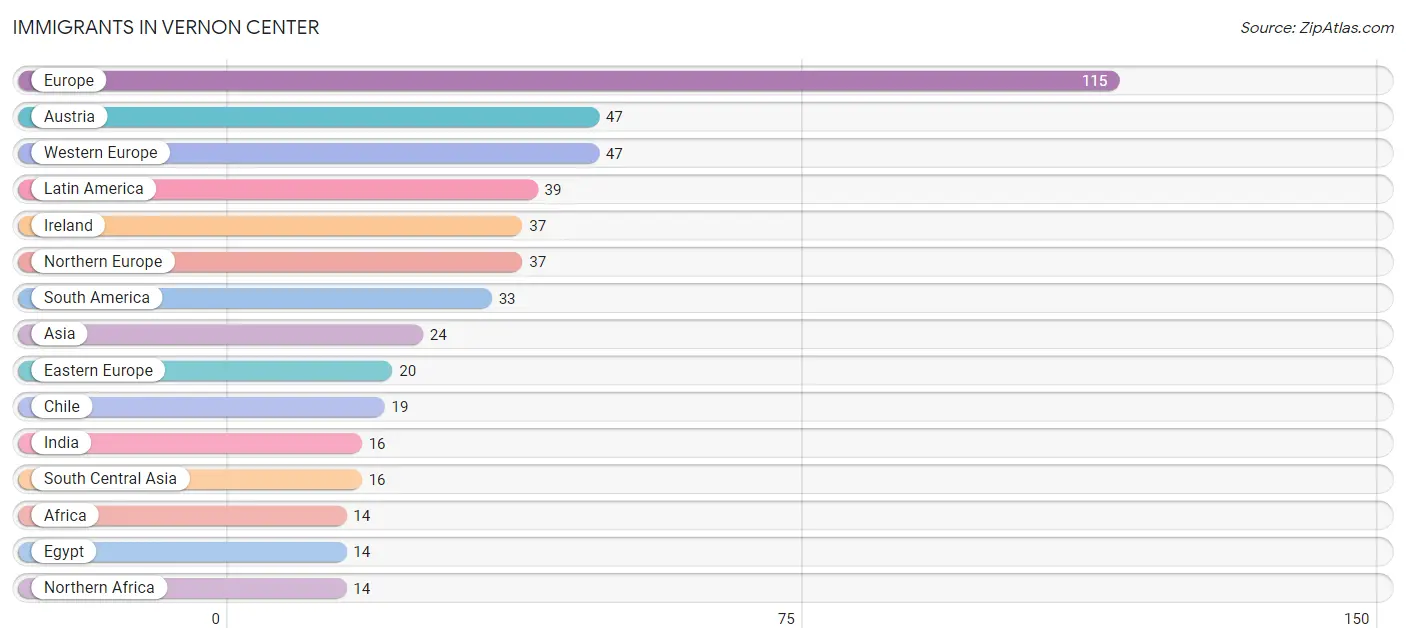
The most numerous immigrant groups reported in Vernon Center came from Europe (115 | 7.7%), Austria (47 | 3.2%), Western Europe (47 | 3.2%), Latin America (39 | 2.6%), and Ireland (37 | 2.5%), together accounting for 19.1% of all Vernon Center residents.
| Immigration Origin | # Population | % Population |
| Africa | 14 | 0.9% |
| Argentina | 2 | 0.1% |
| Asia | 24 | 1.6% |
| Austria | 47 | 3.2% |
| Central America | 6 | 0.4% |
| Chile | 19 | 1.3% |
| Eastern Europe | 20 | 1.3% |
| Ecuador | 12 | 0.8% |
| Egypt | 14 | 0.9% |
| Europe | 115 | 7.7% |
| Honduras | 6 | 0.4% |
| India | 16 | 1.1% |
| Ireland | 37 | 2.5% |
| Jordan | 8 | 0.5% |
| Latin America | 39 | 2.6% |
| Northern Africa | 14 | 0.9% |
| Northern Europe | 37 | 2.5% |
| Portugal | 11 | 0.7% |
| Romania | 12 | 0.8% |
| South America | 33 | 2.2% |
| South Central Asia | 16 | 1.1% |
| Southern Europe | 11 | 0.7% |
| Ukraine | 8 | 0.5% |
| Western Asia | 8 | 0.5% |
| Western Europe | 47 | 3.2% | View All 25 Rows |
Sex and Age in Vernon Center
Sex and Age in Vernon Center
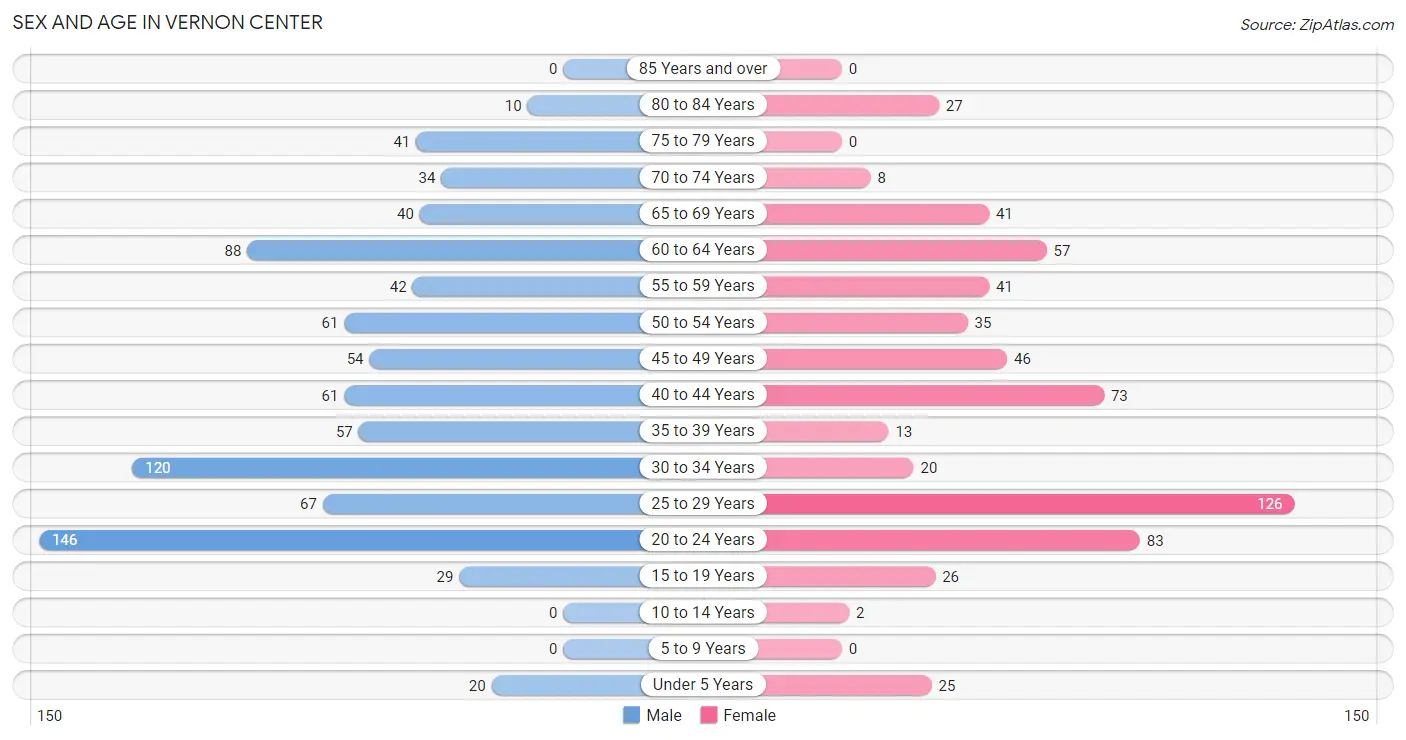
The most populous age groups in Vernon Center are 20 to 24 Years (146 | 16.8%) for men and 25 to 29 Years (126 | 20.2%) for women.
| Age Bracket | Male | Female |
| Under 5 Years | 20 (2.3%) | 25 (4.0%) |
| 5 to 9 Years | 0 (0.0%) | 0 (0.0%) |
| 10 to 14 Years | 0 (0.0%) | 2 (0.3%) |
| 15 to 19 Years | 29 (3.3%) | 26 (4.2%) |
| 20 to 24 Years | 146 (16.8%) | 83 (13.3%) |
| 25 to 29 Years | 67 (7.7%) | 126 (20.2%) |
| 30 to 34 Years | 120 (13.8%) | 20 (3.2%) |
| 35 to 39 Years | 57 (6.6%) | 13 (2.1%) |
| 40 to 44 Years | 61 (7.0%) | 73 (11.7%) |
| 45 to 49 Years | 54 (6.2%) | 46 (7.4%) |
| 50 to 54 Years | 61 (7.0%) | 35 (5.6%) |
| 55 to 59 Years | 42 (4.8%) | 41 (6.6%) |
| 60 to 64 Years | 88 (10.1%) | 57 (9.1%) |
| 65 to 69 Years | 40 (4.6%) | 41 (6.6%) |
| 70 to 74 Years | 34 (3.9%) | 8 (1.3%) |
| 75 to 79 Years | 41 (4.7%) | 0 (0.0%) |
| 80 to 84 Years | 10 (1.1%) | 27 (4.3%) |
| 85 Years and over | 0 (0.0%) | 0 (0.0%) |
| Total | 870 (100.0%) | 623 (100.0%) |
Families and Households in Vernon Center
Median Family Size in Vernon Center
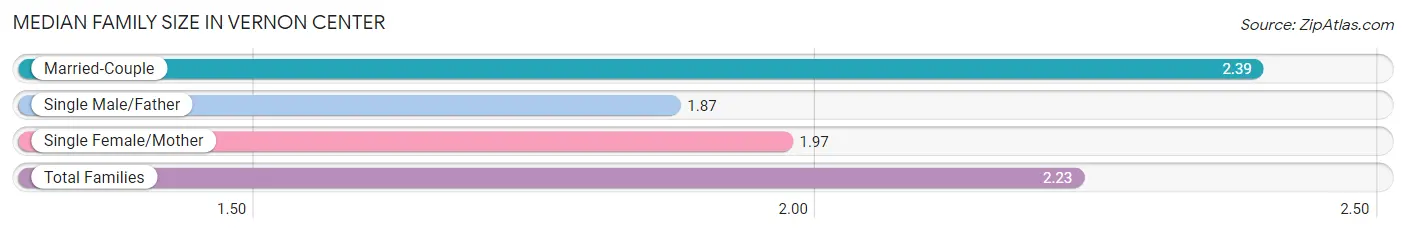
The median family size in Vernon Center is 2.23 persons per family, with married-couple families (182 | 62.3%) accounting for the largest median family size of 2.39 persons per family. On the other hand, single male/father families (15 | 5.1%) represent the smallest median family size with 1.87 persons per family.
| Family Type | # Families | Family Size |
| Married-Couple | 182 (62.3%) | 2.39 |
| Single Male/Father | 15 (5.1%) | 1.87 |
| Single Female/Mother | 95 (32.5%) | 1.97 |
| Total Families | 292 (100.0%) | 2.23 |
Median Household Size in Vernon Center
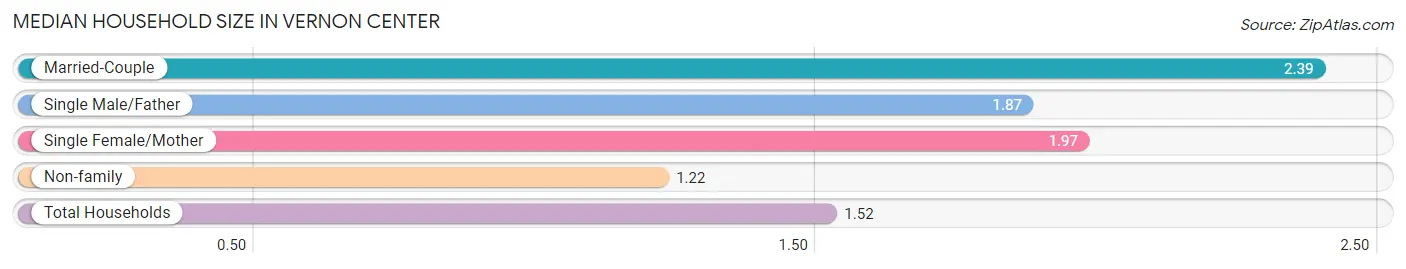
The median household size in Vernon Center is 1.52 persons per household, with married-couple households (182 | 18.7%) accounting for the largest median household size of 2.39 persons per household. non-family households (679 | 69.9%) represent the smallest median household size with 1.22 persons per household.
| Household Type | # Households | Household Size |
| Married-Couple | 182 (18.7%) | 2.39 |
| Single Male/Father | 15 (1.5%) | 1.87 |
| Single Female/Mother | 95 (9.8%) | 1.97 |
| Non-family | 679 (69.9%) | 1.22 |
| Total Households | 971 (100.0%) | 1.52 |
Household Size by Marriage Status in Vernon Center
Out of a total of 971 households in Vernon Center, 292 (30.1%) are family households, while 679 (69.9%) are nonfamily households. The most numerous type of family households are 2-person households, comprising 201, and the most common type of nonfamily households are 1-person households, comprising 526.
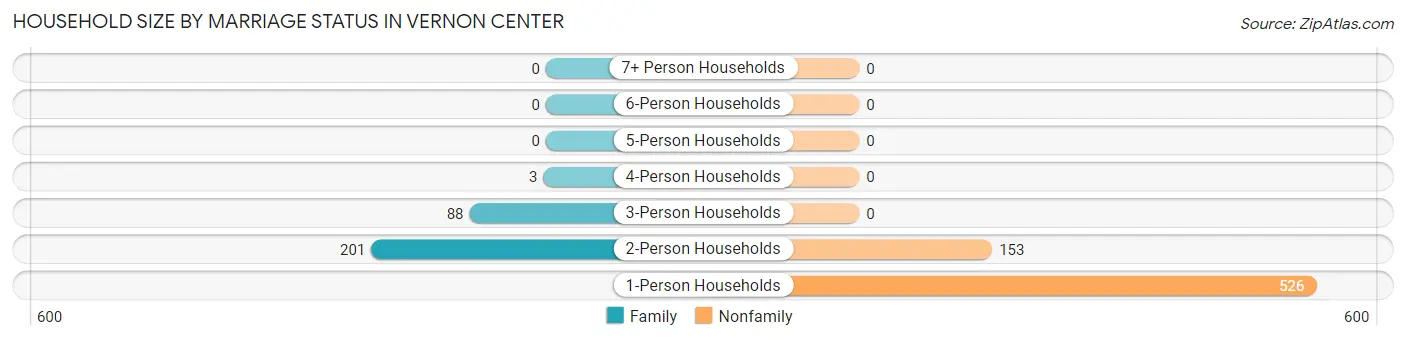
| Household Size | Family Households | Nonfamily Households |
| 1-Person Households | - | 526 (54.2%) |
| 2-Person Households | 201 (20.7%) | 153 (15.8%) |
| 3-Person Households | 88 (9.1%) | 0 (0.0%) |
| 4-Person Households | 3 (0.3%) | 0 (0.0%) |
| 5-Person Households | 0 (0.0%) | 0 (0.0%) |
| 6-Person Households | 0 (0.0%) | 0 (0.0%) |
| 7+ Person Households | 0 (0.0%) | 0 (0.0%) |
| Total | 292 (30.1%) | 679 (69.9%) |
Female Fertility in Vernon Center
Fertility by Age in Vernon Center
Average fertility rate in Vernon Center is 47.0 births per 1,000 women. Women in the age bracket of 20 to 34 years have the highest fertility rate with 79.0 births per 1,000 women. Women in the age bracket of 20 to 34 years acount for 100.0% of all women with births.
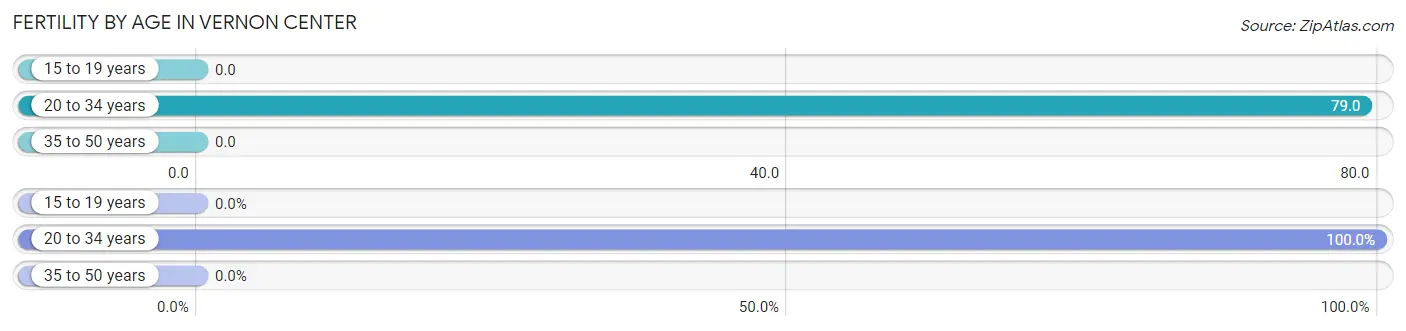
| Age Bracket | Women with Births | Births / 1,000 Women |
| 15 to 19 years | 0 (0.0%) | 0.0 |
| 20 to 34 years | 18 (100.0%) | 79.0 |
| 35 to 50 years | 0 (0.0%) | 0.0 |
| Total | 18 (100.0%) | 47.0 |
Fertility by Age by Marriage Status in Vernon Center
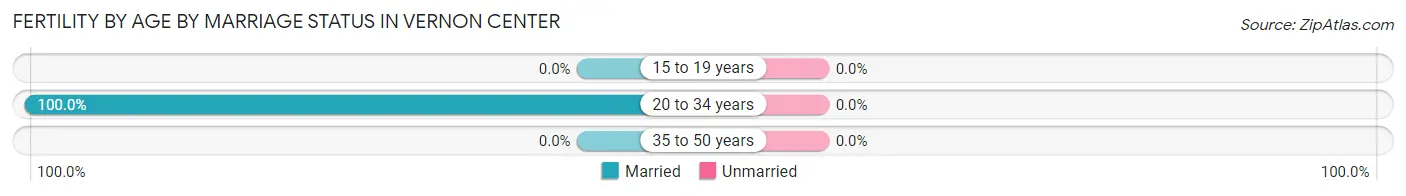
| Age Bracket | Married | Unmarried |
| 15 to 19 years | 0 (0.0%) | 0 (0.0%) |
| 20 to 34 years | 18 (100.0%) | 0 (0.0%) |
| 35 to 50 years | 0 (0.0%) | 0 (0.0%) |
| Total | 18 (100.0%) | 0 (0.0%) |
Fertility by Education in Vernon Center
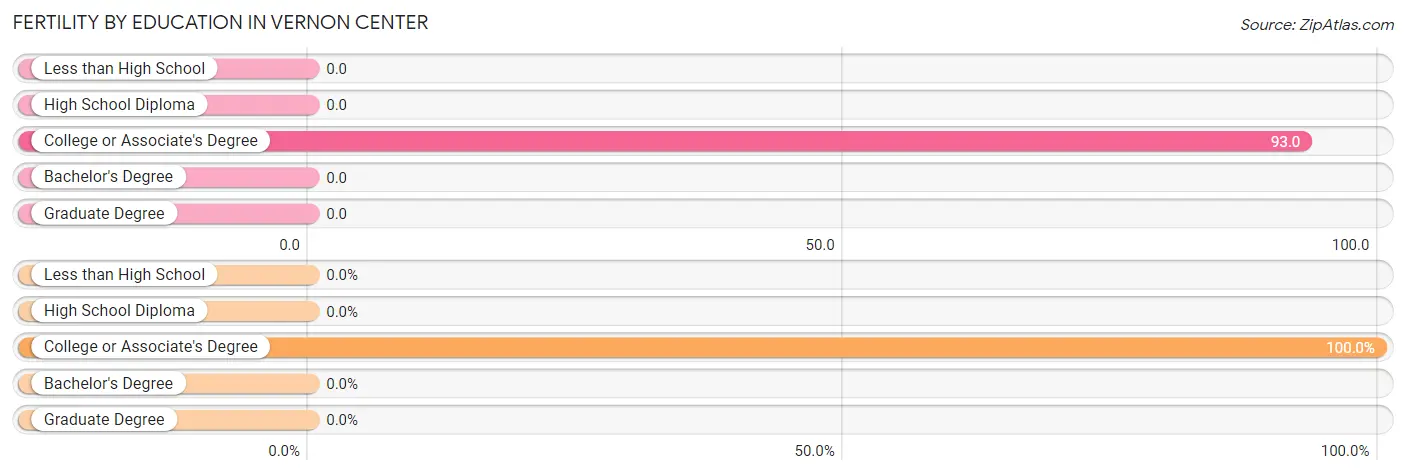
| Educational Attainment | Women with Births | Births / 1,000 Women |
| Less than High School | 0 (0.0%) | 0.0 |
| High School Diploma | 0 (0.0%) | 0.0 |
| College or Associate's Degree | 18 (100.0%) | 93.0 |
| Bachelor's Degree | 0 (0.0%) | 0.0 |
| Graduate Degree | 0 (0.0%) | 0.0 |
| Total | 18 (100.0%) | 47.0 |
Fertility by Education by Marriage Status in Vernon Center
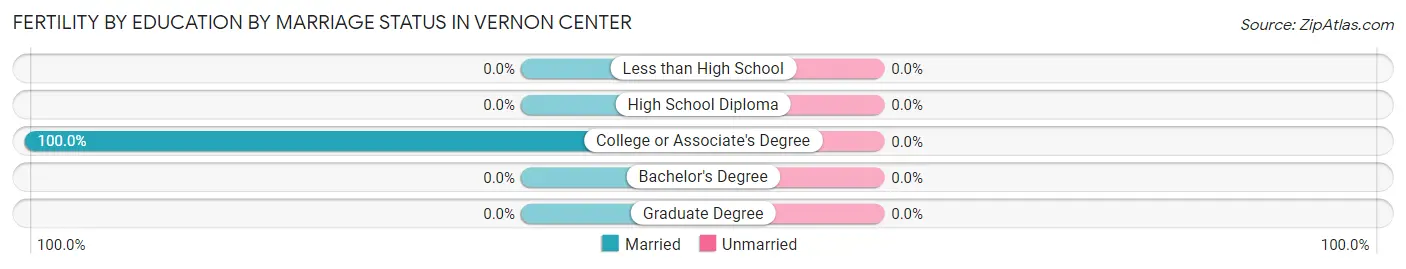
| Educational Attainment | Married | Unmarried |
| Less than High School | 0 (0.0%) | 0 (0.0%) |
| High School Diploma | 0 (0.0%) | 0 (0.0%) |
| College or Associate's Degree | 18 (100.0%) | 0 (0.0%) |
| Bachelor's Degree | 0 (0.0%) | 0 (0.0%) |
| Graduate Degree | 0 (0.0%) | 0 (0.0%) |
| Total | 18 (100.0%) | 0 (0.0%) |
Employment Characteristics in Vernon Center
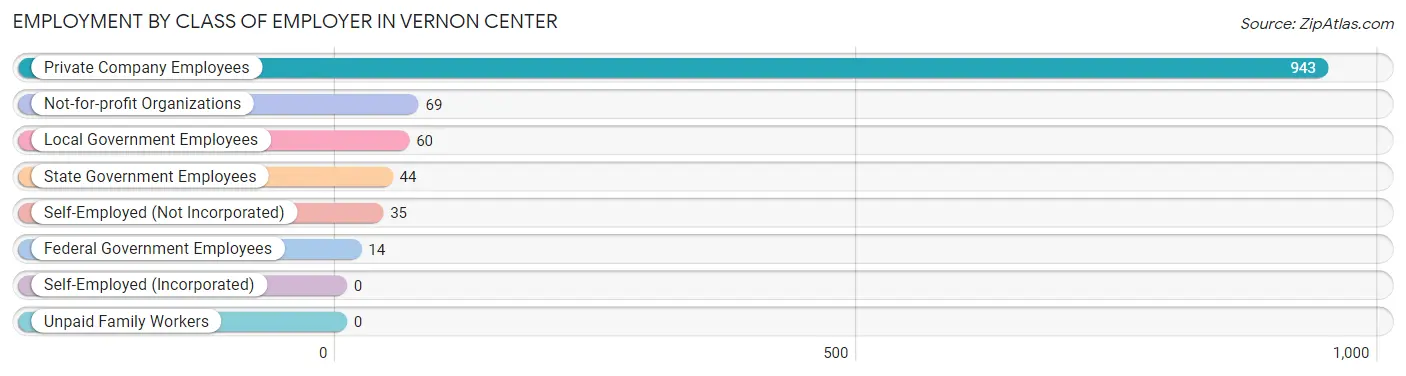
Employment by Class of Employer in Vernon Center
Among the 1,165 employed individuals in Vernon Center, private company employees (943 | 80.9%), not-for-profit organizations (69 | 5.9%), and local government employees (60 | 5.1%) make up the most common classes of employment.
| Employer Class | # Employees | % Employees |
| Private Company Employees | 943 | 80.9% |
| Self-Employed (Incorporated) | 0 | 0.0% |
| Self-Employed (Not Incorporated) | 35 | 3.0% |
| Not-for-profit Organizations | 69 | 5.9% |
| Local Government Employees | 60 | 5.1% |
| State Government Employees | 44 | 3.8% |
| Federal Government Employees | 14 | 1.2% |
| Unpaid Family Workers | 0 | 0.0% |
| Total | 1,165 | 100.0% |
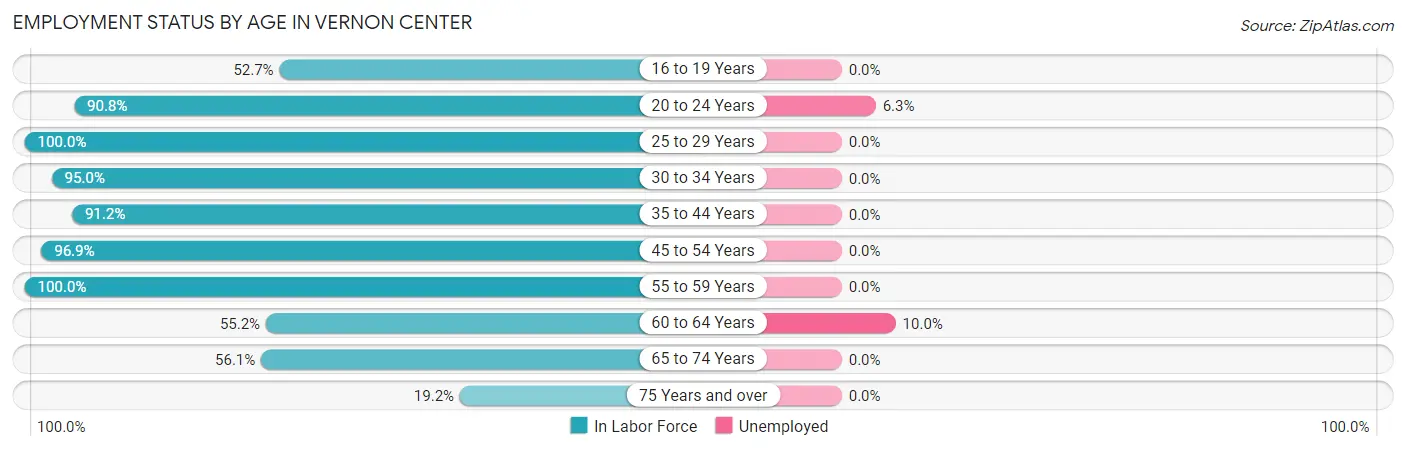
Employment Status by Age in Vernon Center
According to the labor force statistics for Vernon Center, out of the total population over 16 years of age (1,446), 82.0% or 1,186 individuals are in the labor force, with 1.8% or 21 of them unemployed. The age group with the highest labor force participation rate is 25 to 29 years, with 100.0% or 193 individuals in the labor force. Within the labor force, the 60 to 64 years age range has the highest percentage of unemployed individuals, with 10.0% or 8 of them being unemployed.
| Age Bracket | In Labor Force | Unemployed |
| 16 to 19 Years | 29 (52.7%) | 0 (0.0%) |
| 20 to 24 Years | 208 (90.8%) | 13 (6.3%) |
| 25 to 29 Years | 193 (100.0%) | 0 (0.0%) |
| 30 to 34 Years | 133 (95.0%) | 0 (0.0%) |
| 35 to 44 Years | 186 (91.2%) | 0 (0.0%) |
| 45 to 54 Years | 190 (96.9%) | 0 (0.0%) |
| 55 to 59 Years | 83 (100.0%) | 0 (0.0%) |
| 60 to 64 Years | 80 (55.2%) | 8 (10.0%) |
| 65 to 74 Years | 69 (56.1%) | 0 (0.0%) |
| 75 Years and over | 15 (19.2%) | 0 (0.0%) |
| Total | 1,186 (82.0%) | 21 (1.8%) |
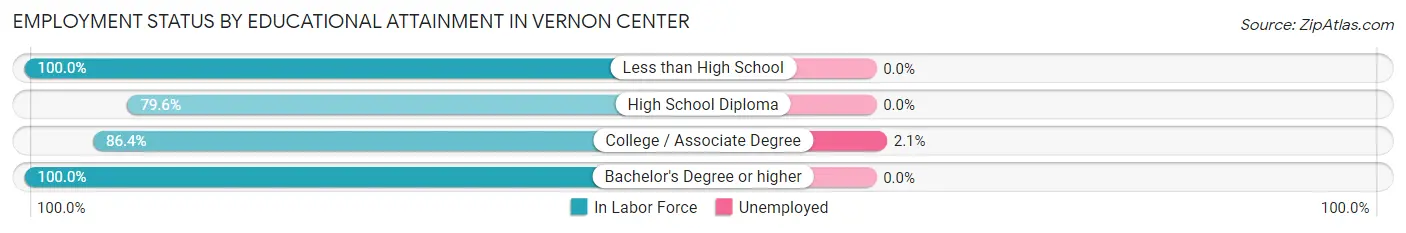
Employment Status by Educational Attainment in Vernon Center
According to labor force statistics for Vernon Center, 90.0% of individuals (865) out of the total population between 25 and 64 years of age (961) are in the labor force, with 0.9% or 8 of them being unemployed. The group with the highest labor force participation rate are those with the educational attainment of less than high school, with 100.0% or 37 individuals in the labor force. Within the labor force, individuals with college / associate degree education have the highest percentage of unemployment, with 2.1% or 8 of them being unemployed.
| Educational Attainment | In Labor Force | Unemployed |
| Less than High School | 37 (100.0%) | 0 (0.0%) |
| High School Diploma | 144 (79.6%) | 0 (0.0%) |
| College / Associate Degree | 375 (86.4%) | 9 (2.1%) |
| Bachelor's Degree or higher | 309 (100.0%) | 0 (0.0%) |
| Total | 865 (90.0%) | 9 (0.9%) |
Employment Occupations by Sex in Vernon Center
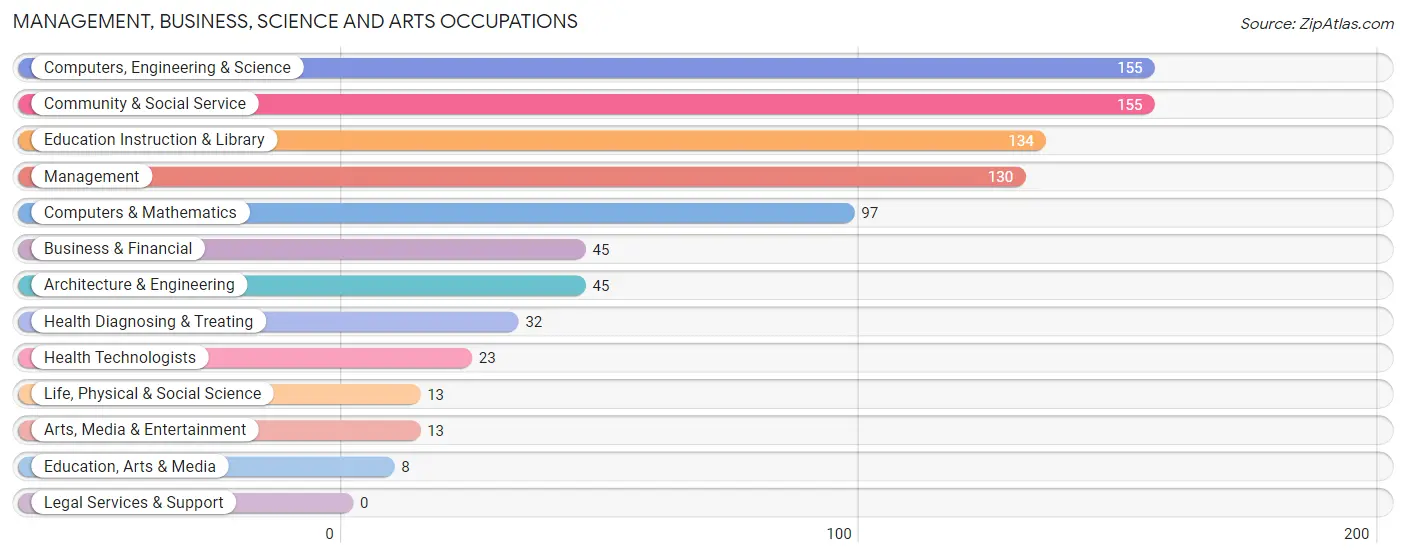
Management, Business, Science and Arts Occupations
The most common Management, Business, Science and Arts occupations in Vernon Center are Computers, Engineering & Science (155 | 13.3%), Community & Social Service (155 | 13.3%), Education Instruction & Library (134 | 11.5%), Management (130 | 11.2%), and Computers & Mathematics (97 | 8.3%).
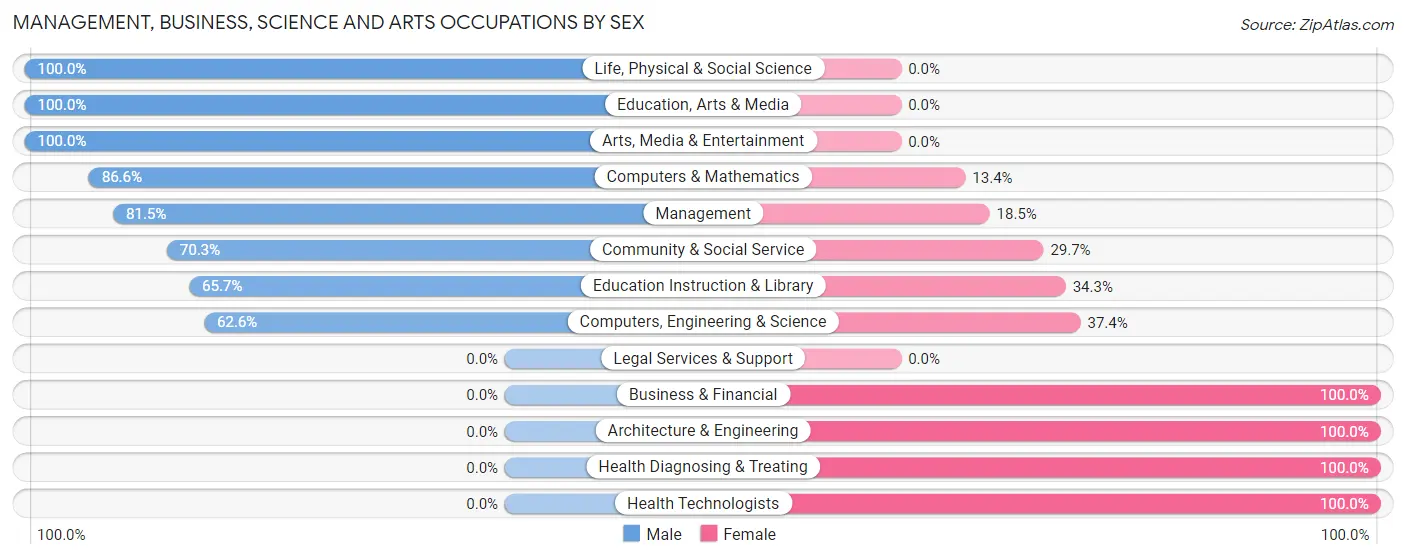
Management, Business, Science and Arts Occupations by Sex
Within the Management, Business, Science and Arts occupations in Vernon Center, the most male-oriented occupations are Life, Physical & Social Science (100.0%), Education, Arts & Media (100.0%), and Arts, Media & Entertainment (100.0%), while the most female-oriented occupations are Business & Financial (100.0%), Architecture & Engineering (100.0%), and Health Diagnosing & Treating (100.0%).
| Occupation | Male | Female |
| Management | 106 (81.5%) | 24 (18.5%) |
| Business & Financial | 0 (0.0%) | 45 (100.0%) |
| Computers, Engineering & Science | 97 (62.6%) | 58 (37.4%) |
| Computers & Mathematics | 84 (86.6%) | 13 (13.4%) |
| Architecture & Engineering | 0 (0.0%) | 45 (100.0%) |
| Life, Physical & Social Science | 13 (100.0%) | 0 (0.0%) |
| Community & Social Service | 109 (70.3%) | 46 (29.7%) |
| Education, Arts & Media | 8 (100.0%) | 0 (0.0%) |
| Legal Services & Support | 0 (0.0%) | 0 (0.0%) |
| Education Instruction & Library | 88 (65.7%) | 46 (34.3%) |
| Arts, Media & Entertainment | 13 (100.0%) | 0 (0.0%) |
| Health Diagnosing & Treating | 0 (0.0%) | 32 (100.0%) |
| Health Technologists | 0 (0.0%) | 23 (100.0%) |
| Total (Category) | 312 (60.4%) | 205 (39.7%) |
| Total (Overall) | 686 (58.9%) | 479 (41.1%) |
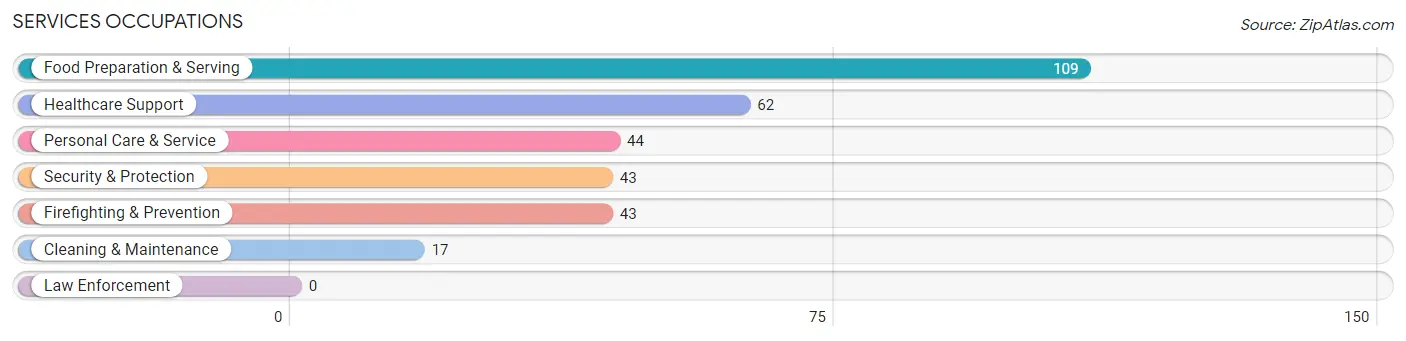
Services Occupations
The most common Services occupations in Vernon Center are Food Preparation & Serving (109 | 9.4%), Healthcare Support (62 | 5.3%), Personal Care & Service (44 | 3.8%), Security & Protection (43 | 3.7%), and Firefighting & Prevention (43 | 3.7%).
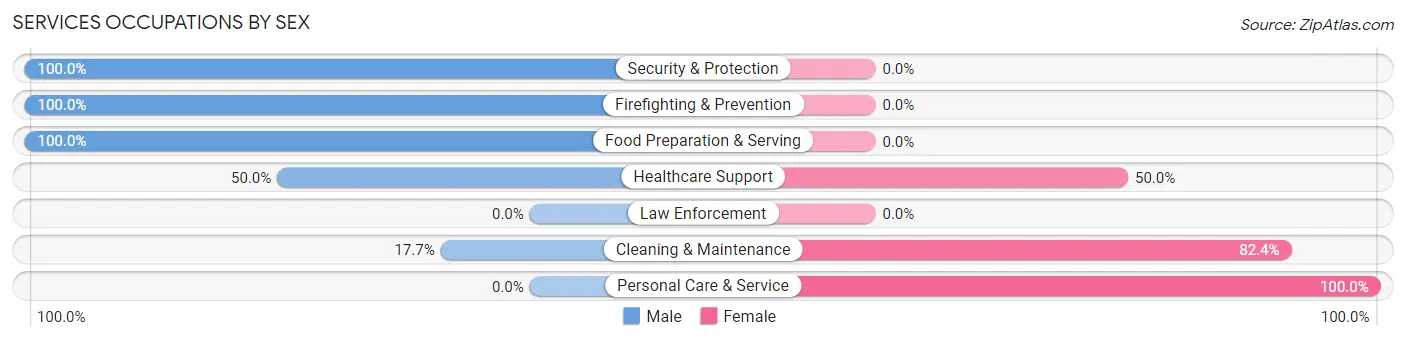
Services Occupations by Sex
Within the Services occupations in Vernon Center, the most male-oriented occupations are Security & Protection (100.0%), Firefighting & Prevention (100.0%), and Food Preparation & Serving (100.0%), while the most female-oriented occupations are Personal Care & Service (100.0%), Cleaning & Maintenance (82.4%), and Healthcare Support (50.0%).
| Occupation | Male | Female |
| Healthcare Support | 31 (50.0%) | 31 (50.0%) |
| Security & Protection | 43 (100.0%) | 0 (0.0%) |
| Firefighting & Prevention | 43 (100.0%) | 0 (0.0%) |
| Law Enforcement | 0 (0.0%) | 0 (0.0%) |
| Food Preparation & Serving | 109 (100.0%) | 0 (0.0%) |
| Cleaning & Maintenance | 3 (17.6%) | 14 (82.4%) |
| Personal Care & Service | 0 (0.0%) | 44 (100.0%) |
| Total (Category) | 186 (67.6%) | 89 (32.4%) |
| Total (Overall) | 686 (58.9%) | 479 (41.1%) |
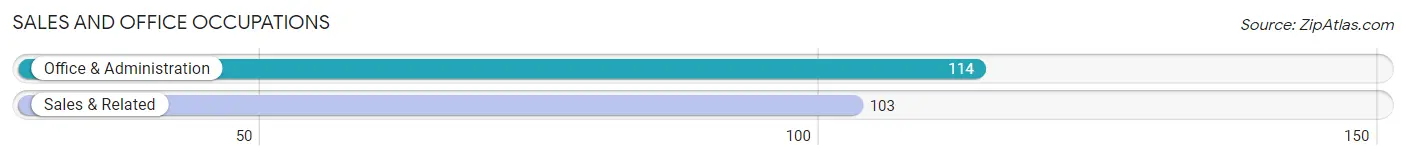
Sales and Office Occupations
The most common Sales and Office occupations in Vernon Center are Office & Administration (114 | 9.8%), and Sales & Related (103 | 8.8%).
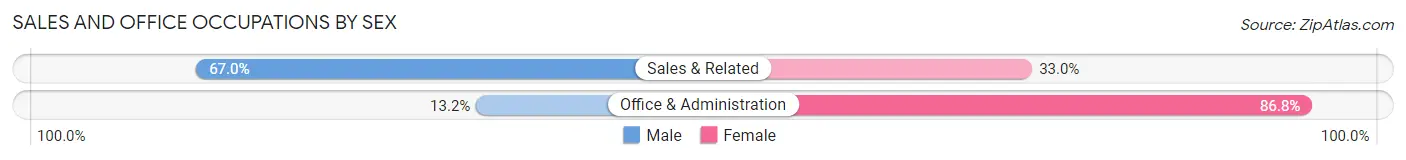
Sales and Office Occupations by Sex
| Occupation | Male | Female |
| Sales & Related | 69 (67.0%) | 34 (33.0%) |
| Office & Administration | 15 (13.2%) | 99 (86.8%) |
| Total (Category) | 84 (38.7%) | 133 (61.3%) |
| Total (Overall) | 686 (58.9%) | 479 (41.1%) |
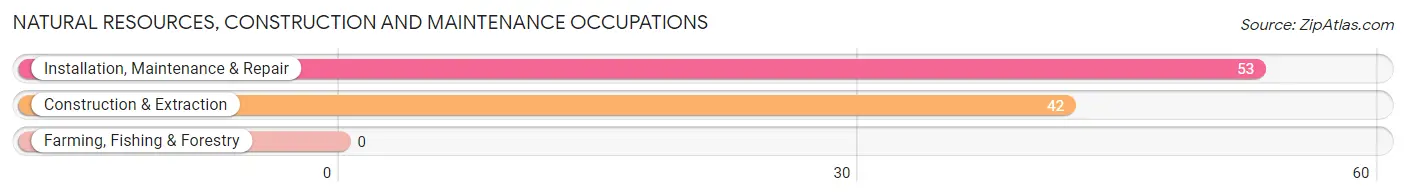
Natural Resources, Construction and Maintenance Occupations
The most common Natural Resources, Construction and Maintenance occupations in Vernon Center are Installation, Maintenance & Repair (53 | 4.5%), and Construction & Extraction (42 | 3.6%).
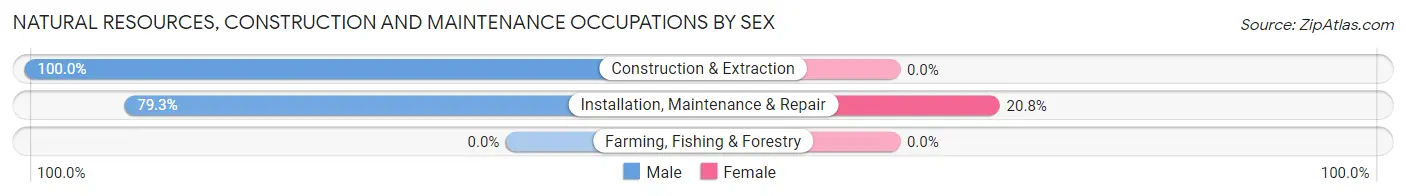
Natural Resources, Construction and Maintenance Occupations by Sex
| Occupation | Male | Female |
| Farming, Fishing & Forestry | 0 (0.0%) | 0 (0.0%) |
| Construction & Extraction | 42 (100.0%) | 0 (0.0%) |
| Installation, Maintenance & Repair | 42 (79.2%) | 11 (20.7%) |
| Total (Category) | 84 (88.4%) | 11 (11.6%) |
| Total (Overall) | 686 (58.9%) | 479 (41.1%) |
Production, Transportation and Moving Occupations
The most common Production, Transportation and Moving occupations in Vernon Center are Production (31 | 2.7%), and Material Moving (30 | 2.6%).
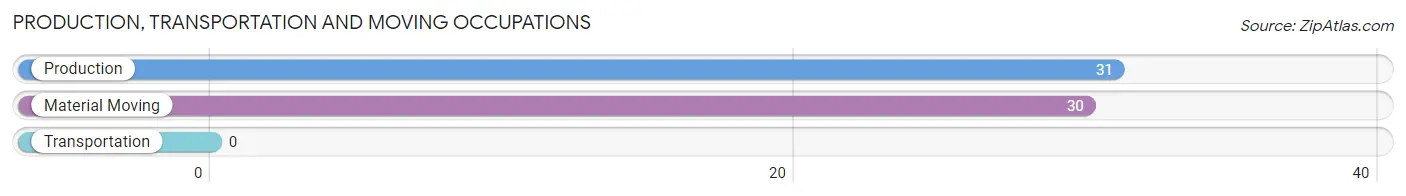
Production, Transportation and Moving Occupations by Sex
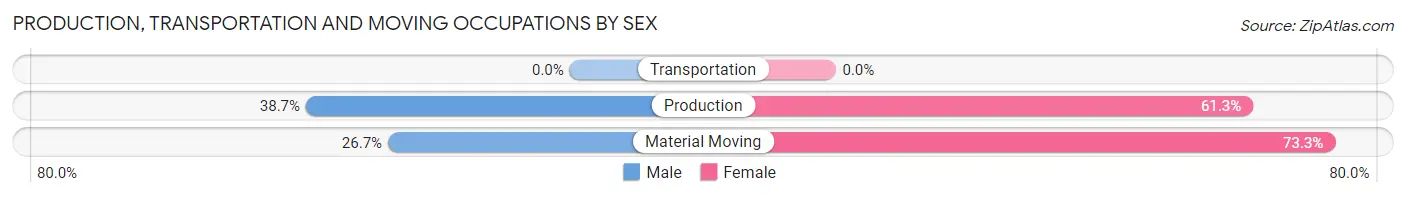
| Occupation | Male | Female |
| Production | 12 (38.7%) | 19 (61.3%) |
| Transportation | 0 (0.0%) | 0 (0.0%) |
| Material Moving | 8 (26.7%) | 22 (73.3%) |
| Total (Category) | 20 (32.8%) | 41 (67.2%) |
| Total (Overall) | 686 (58.9%) | 479 (41.1%) |
Employment Industries by Sex in Vernon Center
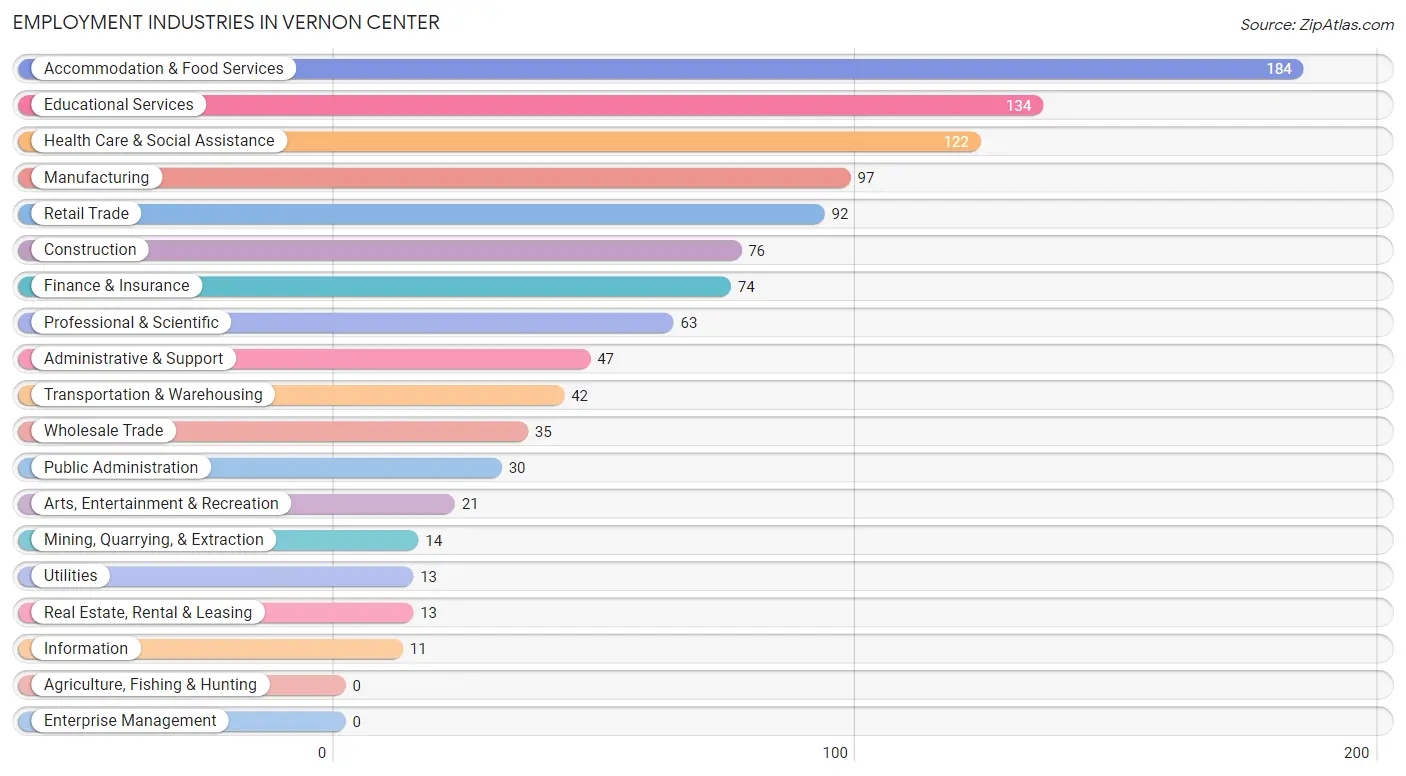
Employment Industries in Vernon Center
The major employment industries in Vernon Center include Accommodation & Food Services (184 | 15.8%), Educational Services (134 | 11.5%), Health Care & Social Assistance (122 | 10.5%), Manufacturing (97 | 8.3%), and Retail Trade (92 | 7.9%).
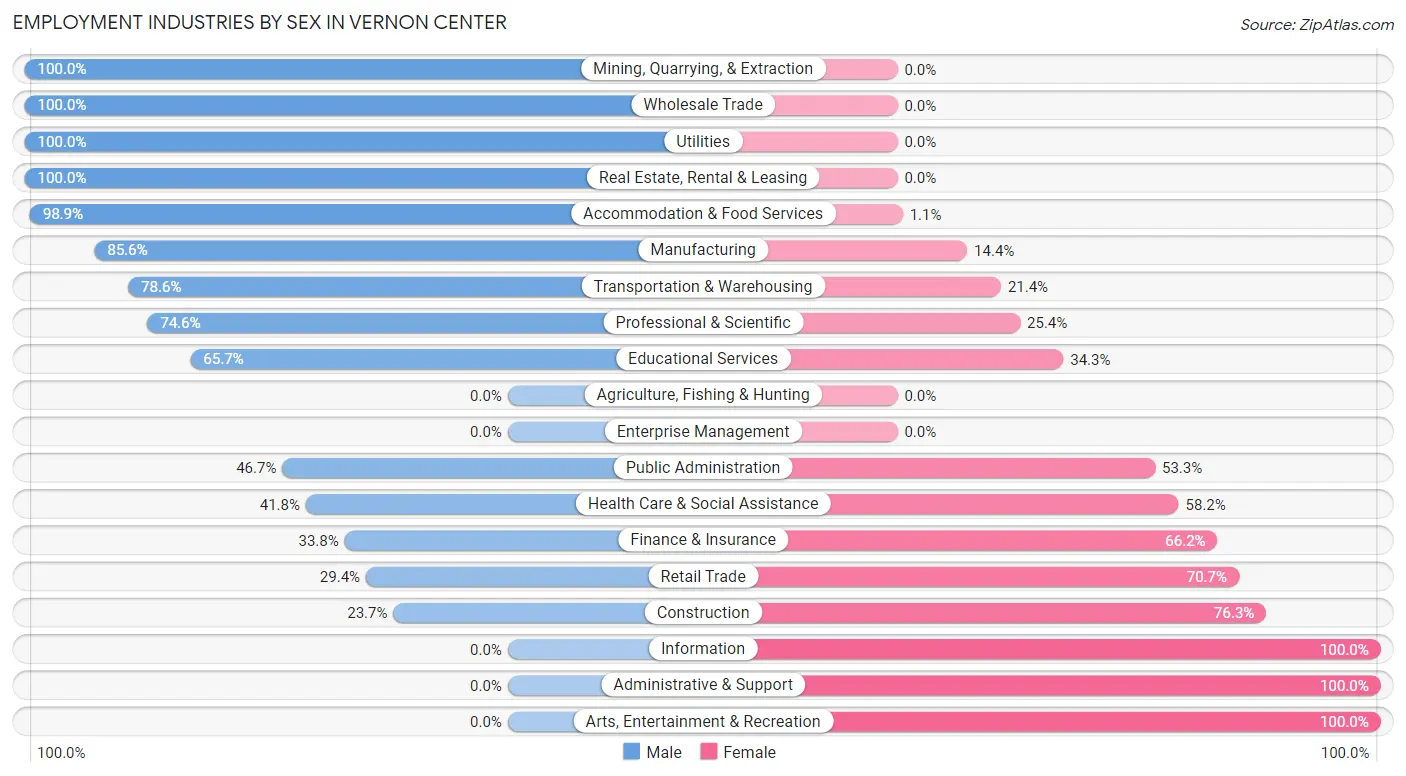
Employment Industries by Sex in Vernon Center
The Vernon Center industries that see more men than women are Mining, Quarrying, & Extraction (100.0%), Wholesale Trade (100.0%), and Utilities (100.0%), whereas the industries that tend to have a higher number of women are Information (100.0%), Administrative & Support (100.0%), and Arts, Entertainment & Recreation (100.0%).
| Industry | Male | Female |
| Agriculture, Fishing & Hunting | 0 (0.0%) | 0 (0.0%) |
| Mining, Quarrying, & Extraction | 14 (100.0%) | 0 (0.0%) |
| Construction | 18 (23.7%) | 58 (76.3%) |
| Manufacturing | 83 (85.6%) | 14 (14.4%) |
| Wholesale Trade | 35 (100.0%) | 0 (0.0%) |
| Retail Trade | 27 (29.3%) | 65 (70.7%) |
| Transportation & Warehousing | 33 (78.6%) | 9 (21.4%) |
| Utilities | 13 (100.0%) | 0 (0.0%) |
| Information | 0 (0.0%) | 11 (100.0%) |
| Finance & Insurance | 25 (33.8%) | 49 (66.2%) |
| Real Estate, Rental & Leasing | 13 (100.0%) | 0 (0.0%) |
| Professional & Scientific | 47 (74.6%) | 16 (25.4%) |
| Enterprise Management | 0 (0.0%) | 0 (0.0%) |
| Administrative & Support | 0 (0.0%) | 47 (100.0%) |
| Educational Services | 88 (65.7%) | 46 (34.3%) |
| Health Care & Social Assistance | 51 (41.8%) | 71 (58.2%) |
| Arts, Entertainment & Recreation | 0 (0.0%) | 21 (100.0%) |
| Accommodation & Food Services | 182 (98.9%) | 2 (1.1%) |
| Public Administration | 14 (46.7%) | 16 (53.3%) |
| Total | 686 (58.9%) | 479 (41.1%) |
Education in Vernon Center
School Enrollment in Vernon Center
The most common levels of schooling among the 148 students in Vernon Center are college / undergraduate (78 | 52.7%), high school (55 | 37.2%), and graduate / professional (13 | 8.8%).
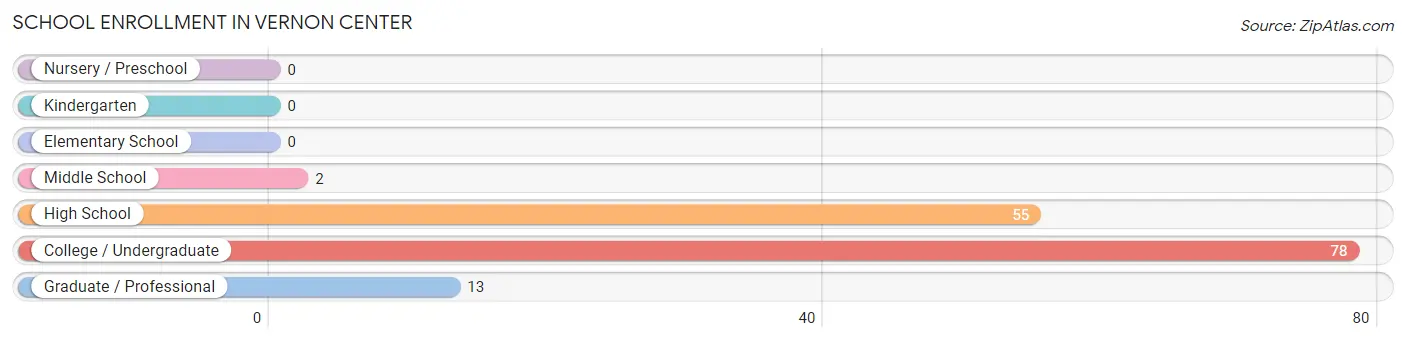
| School Level | # Students | % Students |
| Nursery / Preschool | 0 | 0.0% |
| Kindergarten | 0 | 0.0% |
| Elementary School | 0 | 0.0% |
| Middle School | 2 | 1.3% |
| High School | 55 | 37.2% |
| College / Undergraduate | 78 | 52.7% |
| Graduate / Professional | 13 | 8.8% |
| Total | 148 | 100.0% |
School Enrollment by Age by Funding Source in Vernon Center
Out of a total of 148 students who are enrolled in schools in Vernon Center, 45 (30.4%) attend a private institution, while the remaining 103 (69.6%) are enrolled in public schools. The age group of 25 to 34 year olds has the highest likelihood of being enrolled in private schools, with 32 (100.0% in the age bracket) enrolled. Conversely, the age group of 10 to 14 year olds has the lowest likelihood of being enrolled in a private school, with 2 (100.0% in the age bracket) attending a public institution.
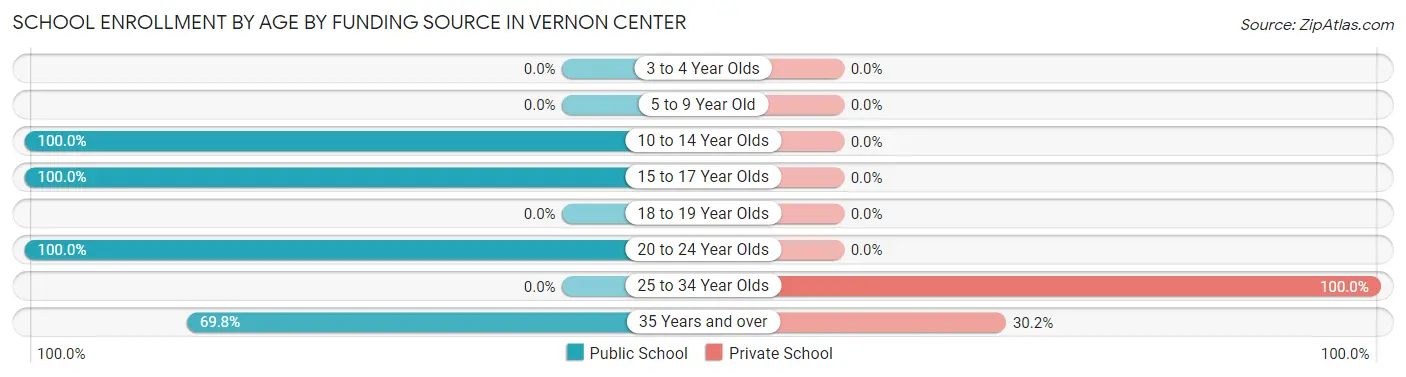
| Age Bracket | Public School | Private School |
| 3 to 4 Year Olds | 0 (0.0%) | 0 (0.0%) |
| 5 to 9 Year Old | 0 (0.0%) | 0 (0.0%) |
| 10 to 14 Year Olds | 2 (100.0%) | 0 (0.0%) |
| 15 to 17 Year Olds | 55 (100.0%) | 0 (0.0%) |
| 18 to 19 Year Olds | 0 (0.0%) | 0 (0.0%) |
| 20 to 24 Year Olds | 16 (100.0%) | 0 (0.0%) |
| 25 to 34 Year Olds | 0 (0.0%) | 32 (100.0%) |
| 35 Years and over | 30 (69.8%) | 13 (30.2%) |
| Total | 103 (69.6%) | 45 (30.4%) |
Educational Attainment by Field of Study in Vernon Center
Education (54 | 14.3%), liberal arts & history (53 | 14.1%), arts & humanities (48 | 12.7%), physical & health sciences (45 | 11.9%), and bio, nature & agricultural (34 | 9.0%) are the most common fields of study among 377 individuals in Vernon Center who have obtained a bachelor's degree or higher.
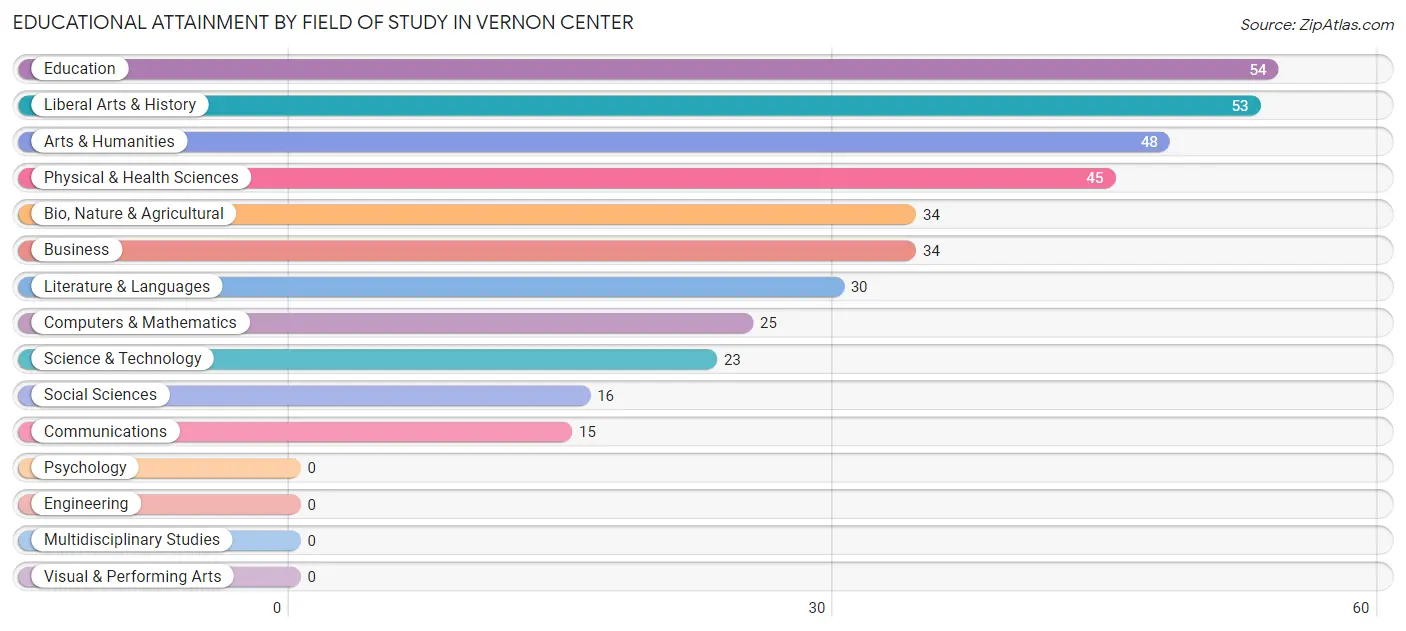
| Field of Study | # Graduates | % Graduates |
| Computers & Mathematics | 25 | 6.6% |
| Bio, Nature & Agricultural | 34 | 9.0% |
| Physical & Health Sciences | 45 | 11.9% |
| Psychology | 0 | 0.0% |
| Social Sciences | 16 | 4.2% |
| Engineering | 0 | 0.0% |
| Multidisciplinary Studies | 0 | 0.0% |
| Science & Technology | 23 | 6.1% |
| Business | 34 | 9.0% |
| Education | 54 | 14.3% |
| Literature & Languages | 30 | 8.0% |
| Liberal Arts & History | 53 | 14.1% |
| Visual & Performing Arts | 0 | 0.0% |
| Communications | 15 | 4.0% |
| Arts & Humanities | 48 | 12.7% |
| Total | 377 | 100.0% |
Transportation & Commute in Vernon Center
Vehicle Availability by Sex in Vernon Center
The most prevalent vehicle ownership categories in Vernon Center are males with 2 vehicles (337, accounting for 49.1%) and females with 2 vehicles (306, making up 70.4%).
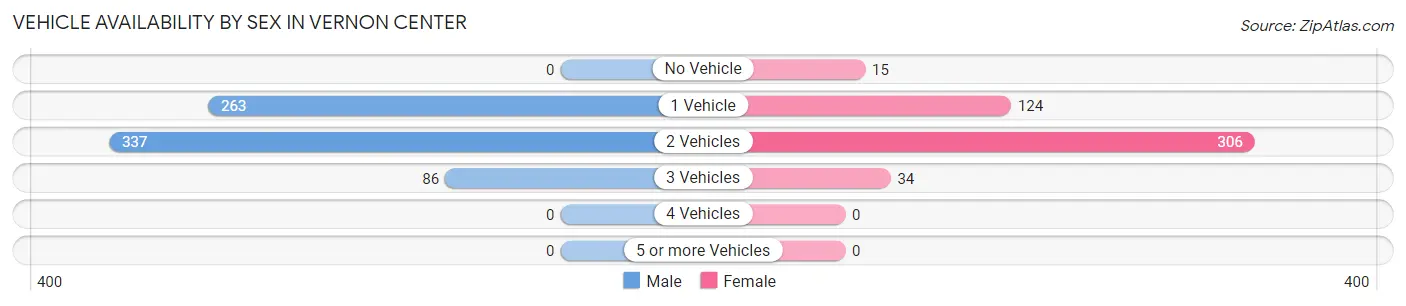
| Vehicles Available | Male | Female |
| No Vehicle | 0 (0.0%) | 15 (3.1%) |
| 1 Vehicle | 263 (38.3%) | 124 (25.9%) |
| 2 Vehicles | 337 (49.1%) | 306 (63.9%) |
| 3 Vehicles | 86 (12.5%) | 34 (7.1%) |
| 4 Vehicles | 0 (0.0%) | 0 (0.0%) |
| 5 or more Vehicles | 0 (0.0%) | 0 (0.0%) |
| Total | 686 (100.0%) | 479 (100.0%) |
Commute Time in Vernon Center
The most frequently occuring commute durations in Vernon Center are 45 to 59 minutes (263 commuters, 26.9%), 60 to 89 minutes (243 commuters, 24.8%), and 20 to 24 minutes (67 commuters, 6.9%).
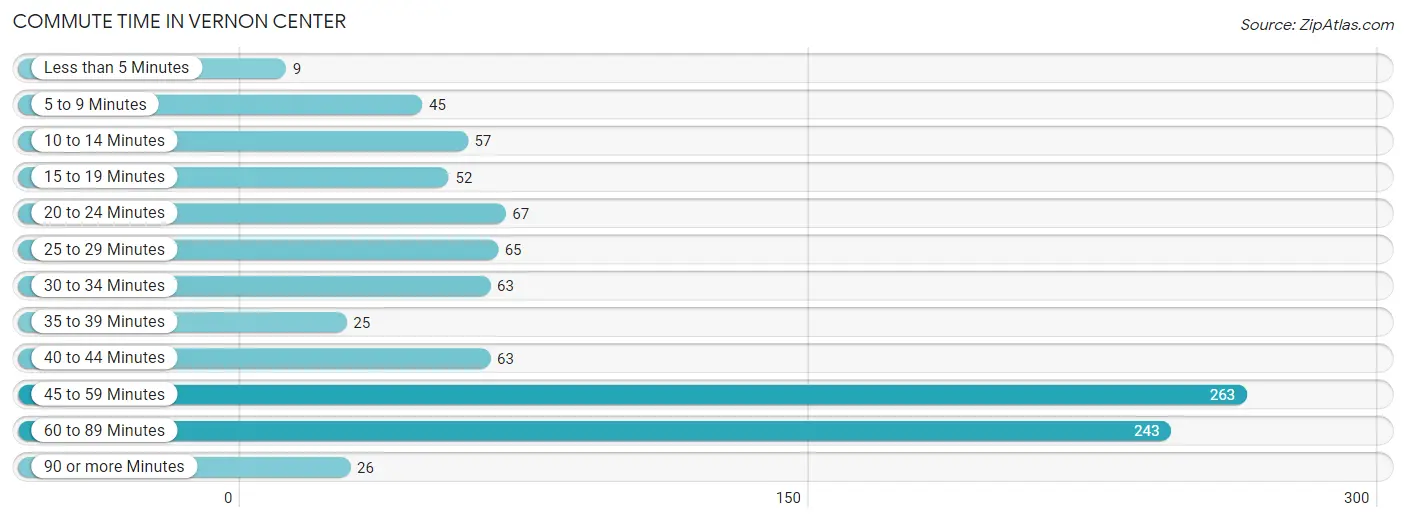
| Commute Time | # Commuters | % Commuters |
| Less than 5 Minutes | 9 | 0.9% |
| 5 to 9 Minutes | 45 | 4.6% |
| 10 to 14 Minutes | 57 | 5.8% |
| 15 to 19 Minutes | 52 | 5.3% |
| 20 to 24 Minutes | 67 | 6.9% |
| 25 to 29 Minutes | 65 | 6.7% |
| 30 to 34 Minutes | 63 | 6.4% |
| 35 to 39 Minutes | 25 | 2.6% |
| 40 to 44 Minutes | 63 | 6.4% |
| 45 to 59 Minutes | 263 | 26.9% |
| 60 to 89 Minutes | 243 | 24.8% |
| 90 or more Minutes | 26 | 2.7% |
Commute Time by Sex in Vernon Center
The most common commute times in Vernon Center are 45 to 59 minutes (216 commuters, 33.2%) for males and 60 to 89 minutes (117 commuters, 35.8%) for females.
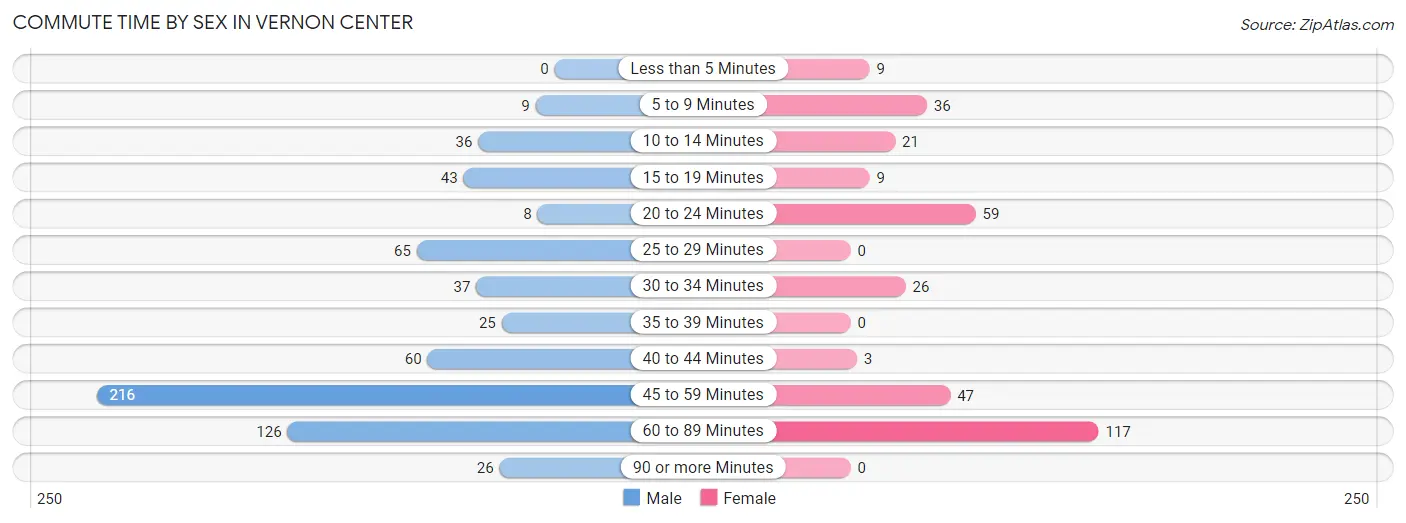
| Commute Time | Male | Female |
| Less than 5 Minutes | 0 (0.0%) | 9 (2.8%) |
| 5 to 9 Minutes | 9 (1.4%) | 36 (11.0%) |
| 10 to 14 Minutes | 36 (5.5%) | 21 (6.4%) |
| 15 to 19 Minutes | 43 (6.6%) | 9 (2.8%) |
| 20 to 24 Minutes | 8 (1.2%) | 59 (18.0%) |
| 25 to 29 Minutes | 65 (10.0%) | 0 (0.0%) |
| 30 to 34 Minutes | 37 (5.7%) | 26 (8.0%) |
| 35 to 39 Minutes | 25 (3.8%) | 0 (0.0%) |
| 40 to 44 Minutes | 60 (9.2%) | 3 (0.9%) |
| 45 to 59 Minutes | 216 (33.2%) | 47 (14.4%) |
| 60 to 89 Minutes | 126 (19.4%) | 117 (35.8%) |
| 90 or more Minutes | 26 (4.0%) | 0 (0.0%) |
Time of Departure to Work by Sex in Vernon Center
The most frequent times of departure to work in Vernon Center are 12:00 PM to 3:59 PM (119, 18.3%) for males and 6:30 AM to 6:59 AM (63, 19.3%) for females.
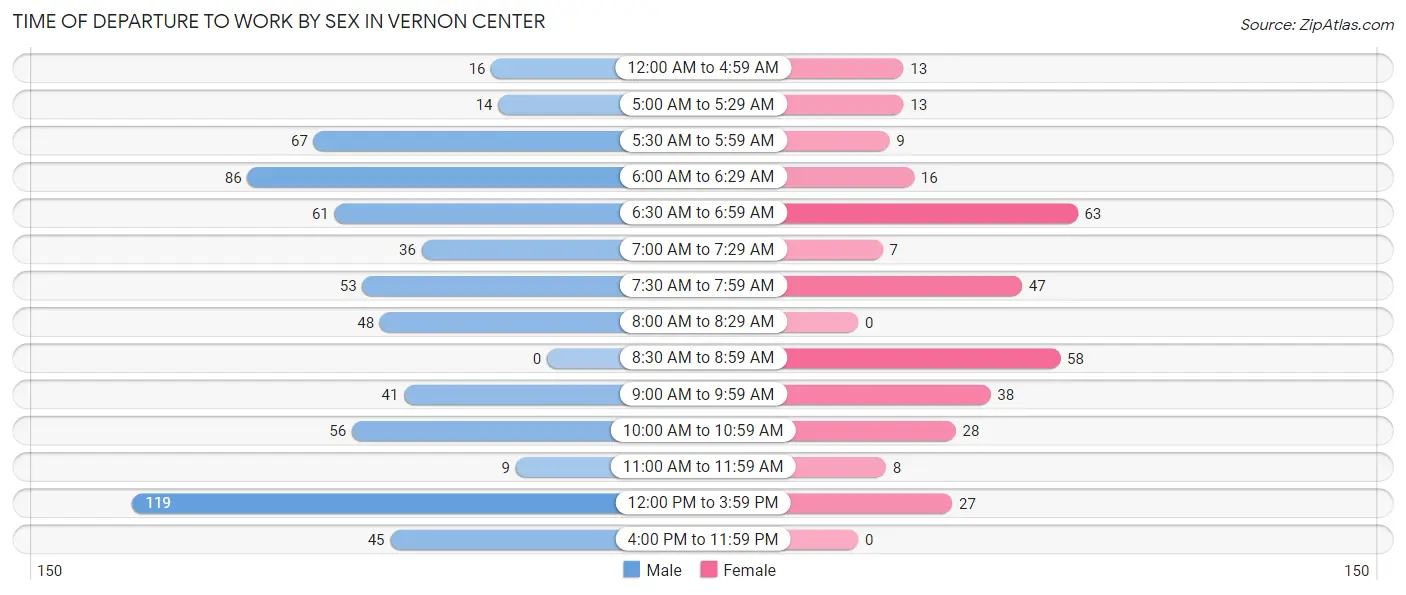
| Time of Departure | Male | Female |
| 12:00 AM to 4:59 AM | 16 (2.5%) | 13 (4.0%) |
| 5:00 AM to 5:29 AM | 14 (2.1%) | 13 (4.0%) |
| 5:30 AM to 5:59 AM | 67 (10.3%) | 9 (2.8%) |
| 6:00 AM to 6:29 AM | 86 (13.2%) | 16 (4.9%) |
| 6:30 AM to 6:59 AM | 61 (9.4%) | 63 (19.3%) |
| 7:00 AM to 7:29 AM | 36 (5.5%) | 7 (2.1%) |
| 7:30 AM to 7:59 AM | 53 (8.1%) | 47 (14.4%) |
| 8:00 AM to 8:29 AM | 48 (7.4%) | 0 (0.0%) |
| 8:30 AM to 8:59 AM | 0 (0.0%) | 58 (17.7%) |
| 9:00 AM to 9:59 AM | 41 (6.3%) | 38 (11.6%) |
| 10:00 AM to 10:59 AM | 56 (8.6%) | 28 (8.6%) |
| 11:00 AM to 11:59 AM | 9 (1.4%) | 8 (2.5%) |
| 12:00 PM to 3:59 PM | 119 (18.3%) | 27 (8.3%) |
| 4:00 PM to 11:59 PM | 45 (6.9%) | 0 (0.0%) |
| Total | 651 (100.0%) | 327 (100.0%) |
Housing Occupancy in Vernon Center
Occupancy by Ownership in Vernon Center
Of the total 971 dwellings in Vernon Center, owner-occupied units account for 685 (70.6%), while renter-occupied units make up 286 (29.4%).
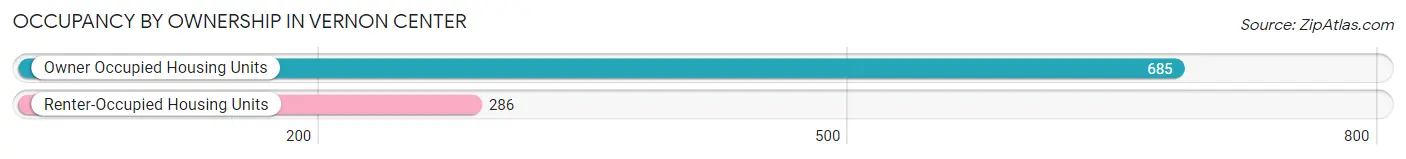
| Occupancy | # Housing Units | % Housing Units |
| Owner Occupied Housing Units | 685 | 70.6% |
| Renter-Occupied Housing Units | 286 | 29.4% |
| Total Occupied Housing Units | 971 | 100.0% |
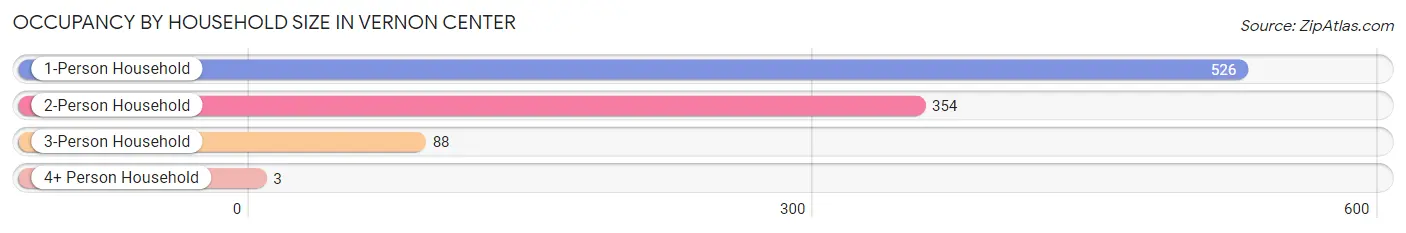
Occupancy by Household Size in Vernon Center
| Household Size | # Housing Units | % Housing Units |
| 1-Person Household | 526 | 54.2% |
| 2-Person Household | 354 | 36.5% |
| 3-Person Household | 88 | 9.1% |
| 4+ Person Household | 3 | 0.3% |
| Total Housing Units | 971 | 100.0% |
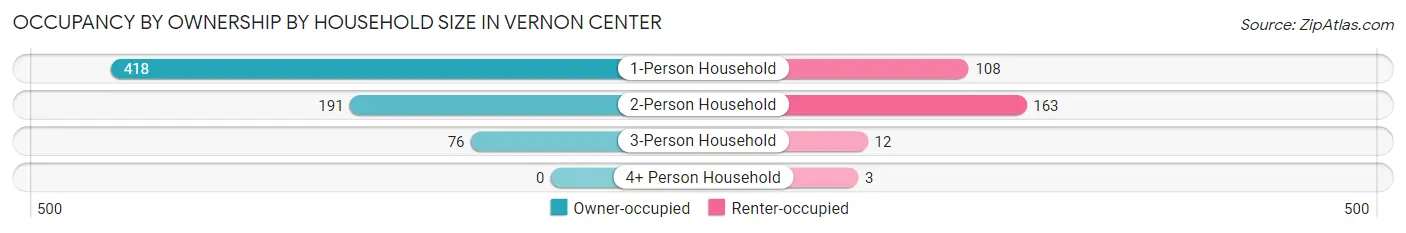
Occupancy by Ownership by Household Size in Vernon Center
| Household Size | Owner-occupied | Renter-occupied |
| 1-Person Household | 418 (79.5%) | 108 (20.5%) |
| 2-Person Household | 191 (53.9%) | 163 (46.1%) |
| 3-Person Household | 76 (86.4%) | 12 (13.6%) |
| 4+ Person Household | 0 (0.0%) | 3 (100.0%) |
| Total Housing Units | 685 (70.6%) | 286 (29.4%) |
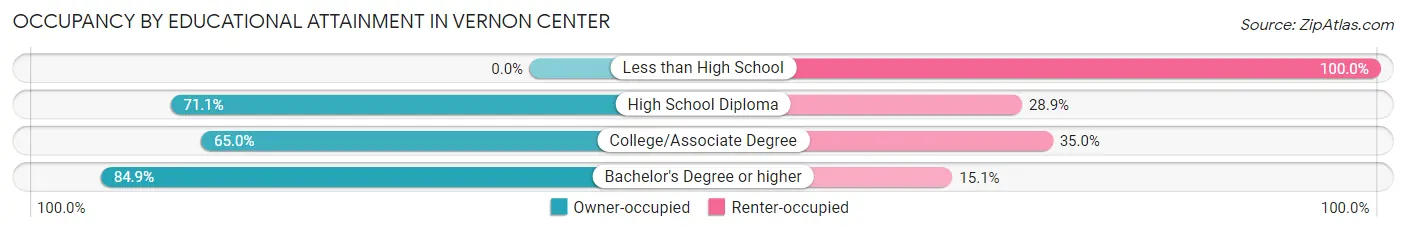
Occupancy by Educational Attainment in Vernon Center
| Household Size | Owner-occupied | Renter-occupied |
| Less than High School | 0 (0.0%) | 37 (100.0%) |
| High School Diploma | 187 (71.1%) | 76 (28.9%) |
| College/Associate Degree | 234 (65.0%) | 126 (35.0%) |
| Bachelor's Degree or higher | 264 (84.9%) | 47 (15.1%) |
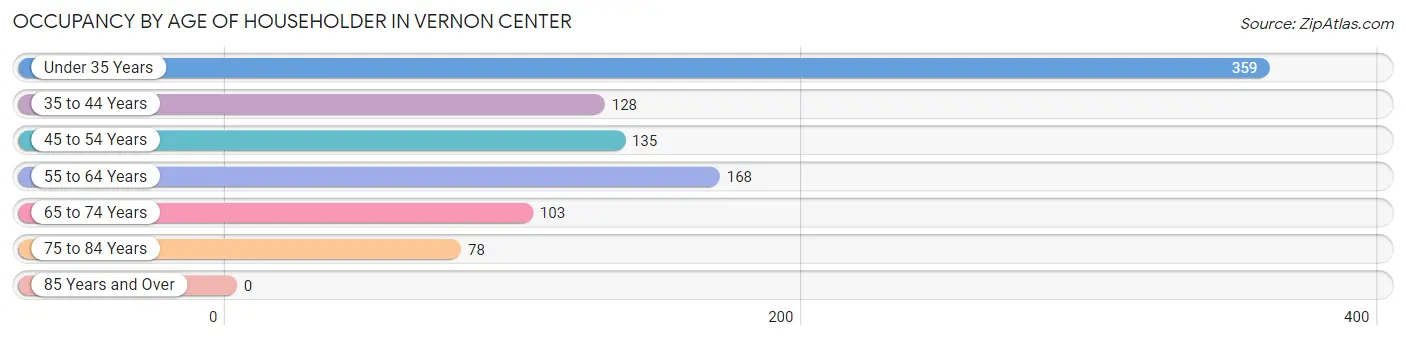
Occupancy by Age of Householder in Vernon Center
| Age Bracket | # Households | % Households |
| Under 35 Years | 359 | 37.0% |
| 35 to 44 Years | 128 | 13.2% |
| 45 to 54 Years | 135 | 13.9% |
| 55 to 64 Years | 168 | 17.3% |
| 65 to 74 Years | 103 | 10.6% |
| 75 to 84 Years | 78 | 8.0% |
| 85 Years and Over | 0 | 0.0% |
| Total | 971 | 100.0% |
Housing Finances in Vernon Center
Median Income by Occupancy in Vernon Center
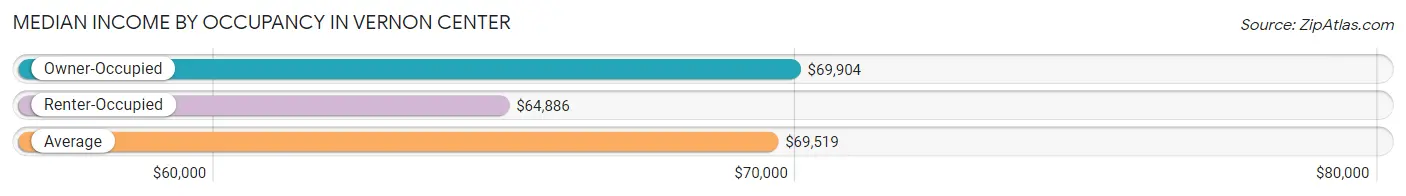
| Occupancy Type | # Households | Median Income |
| Owner-Occupied | 685 (70.6%) | $69,904 |
| Renter-Occupied | 286 (29.4%) | $64,886 |
| Average | 971 (100.0%) | $69,519 |
Occupancy by Householder Income Bracket in Vernon Center
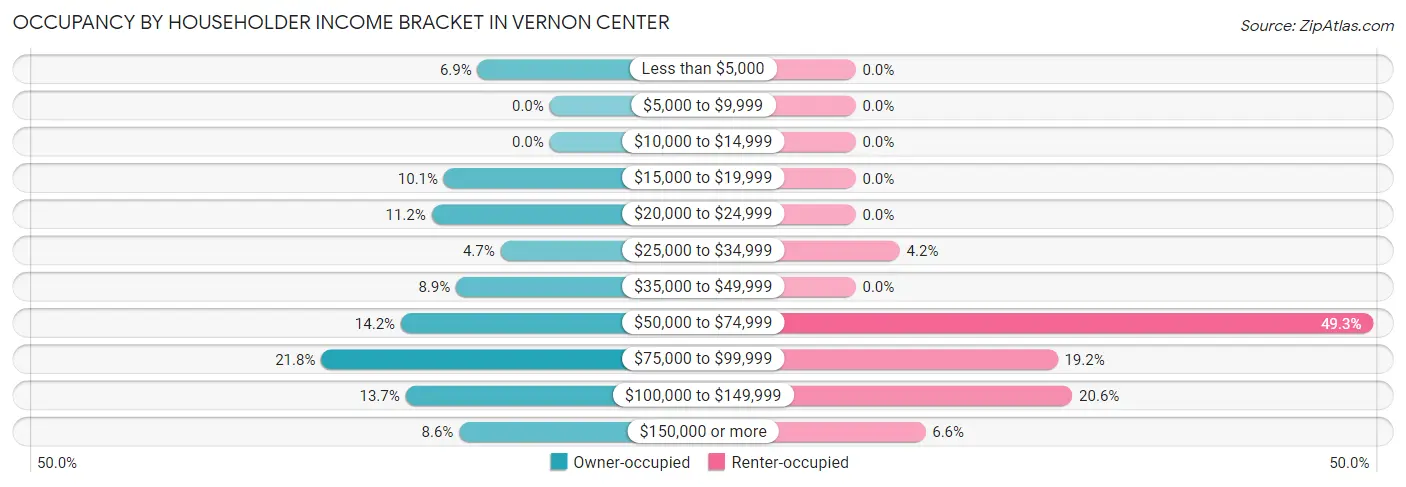
| Income Bracket | Owner-occupied | Renter-occupied |
| Less than $5,000 | 47 (6.9%) | 0 (0.0%) |
| $5,000 to $9,999 | 0 (0.0%) | 0 (0.0%) |
| $10,000 to $14,999 | 0 (0.0%) | 0 (0.0%) |
| $15,000 to $19,999 | 69 (10.1%) | 0 (0.0%) |
| $20,000 to $24,999 | 77 (11.2%) | 0 (0.0%) |
| $25,000 to $34,999 | 32 (4.7%) | 12 (4.2%) |
| $35,000 to $49,999 | 61 (8.9%) | 0 (0.0%) |
| $50,000 to $74,999 | 97 (14.2%) | 141 (49.3%) |
| $75,000 to $99,999 | 149 (21.7%) | 55 (19.2%) |
| $100,000 to $149,999 | 94 (13.7%) | 59 (20.6%) |
| $150,000 or more | 59 (8.6%) | 19 (6.6%) |
| Total | 685 (100.0%) | 286 (100.0%) |
Monthly Housing Cost Tiers in Vernon Center
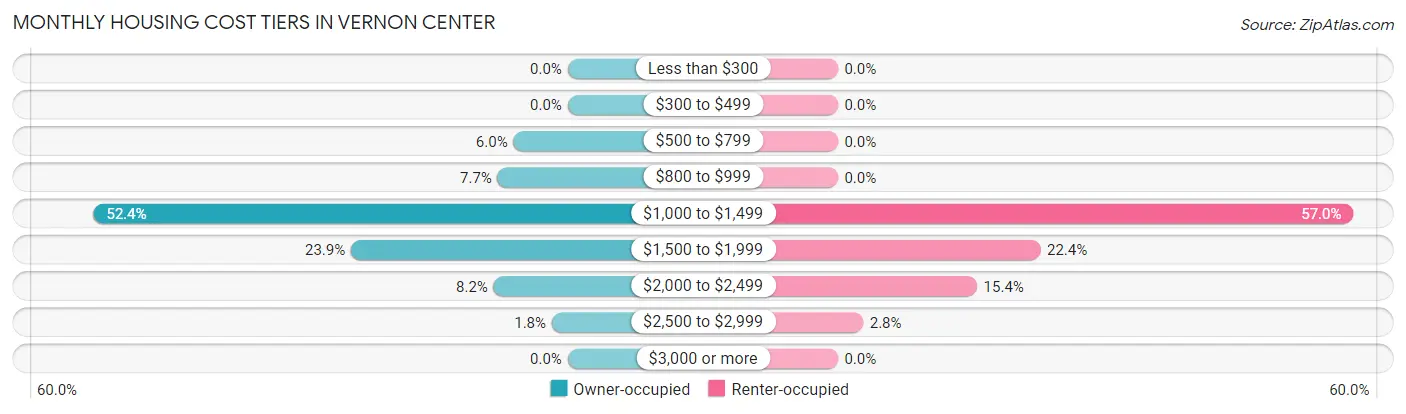
| Monthly Cost | Owner-occupied | Renter-occupied |
| Less than $300 | 0 (0.0%) | 0 (0.0%) |
| $300 to $499 | 0 (0.0%) | 0 (0.0%) |
| $500 to $799 | 41 (6.0%) | 0 (0.0%) |
| $800 to $999 | 53 (7.7%) | 0 (0.0%) |
| $1,000 to $1,499 | 359 (52.4%) | 163 (57.0%) |
| $1,500 to $1,999 | 164 (23.9%) | 64 (22.4%) |
| $2,000 to $2,499 | 56 (8.2%) | 44 (15.4%) |
| $2,500 to $2,999 | 12 (1.8%) | 8 (2.8%) |
| $3,000 or more | 0 (0.0%) | 0 (0.0%) |
| Total | 685 (100.0%) | 286 (100.0%) |
Physical Housing Characteristics in Vernon Center
Housing Structures in Vernon Center
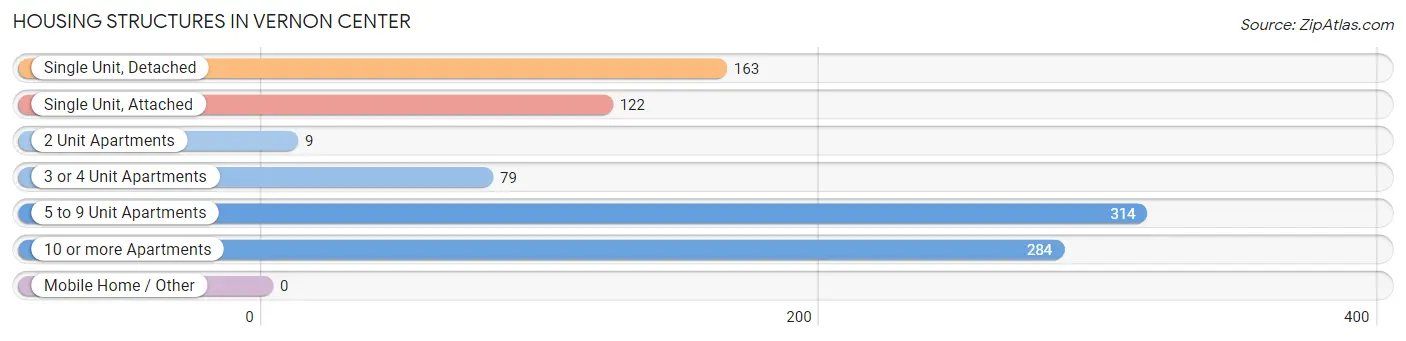
| Structure Type | # Housing Units | % Housing Units |
| Single Unit, Detached | 163 | 16.8% |
| Single Unit, Attached | 122 | 12.6% |
| 2 Unit Apartments | 9 | 0.9% |
| 3 or 4 Unit Apartments | 79 | 8.1% |
| 5 to 9 Unit Apartments | 314 | 32.3% |
| 10 or more Apartments | 284 | 29.2% |
| Mobile Home / Other | 0 | 0.0% |
| Total | 971 | 100.0% |
Housing Structures by Occupancy in Vernon Center
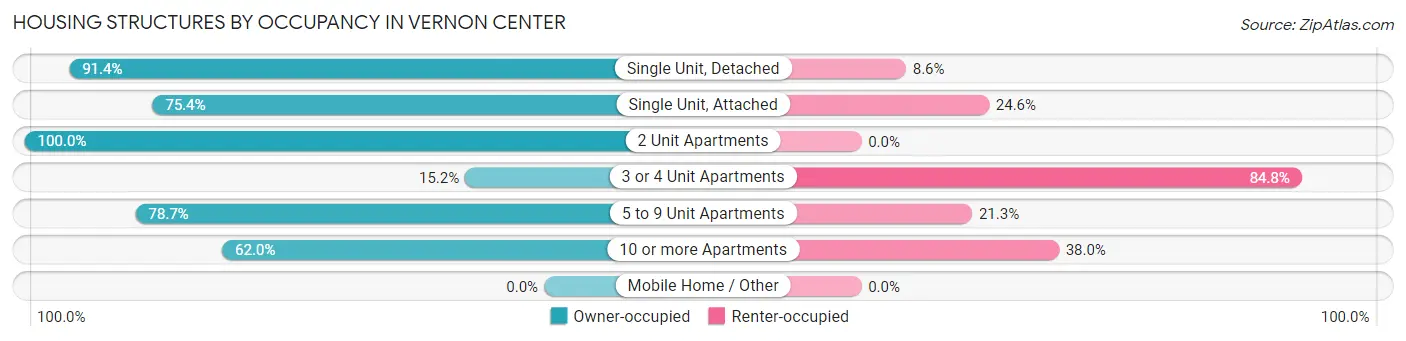
| Structure Type | Owner-occupied | Renter-occupied |
| Single Unit, Detached | 149 (91.4%) | 14 (8.6%) |
| Single Unit, Attached | 92 (75.4%) | 30 (24.6%) |
| 2 Unit Apartments | 9 (100.0%) | 0 (0.0%) |
| 3 or 4 Unit Apartments | 12 (15.2%) | 67 (84.8%) |
| 5 to 9 Unit Apartments | 247 (78.7%) | 67 (21.3%) |
| 10 or more Apartments | 176 (62.0%) | 108 (38.0%) |
| Mobile Home / Other | 0 (0.0%) | 0 (0.0%) |
| Total | 685 (70.6%) | 286 (29.4%) |
Housing Structures by Number of Rooms in Vernon Center
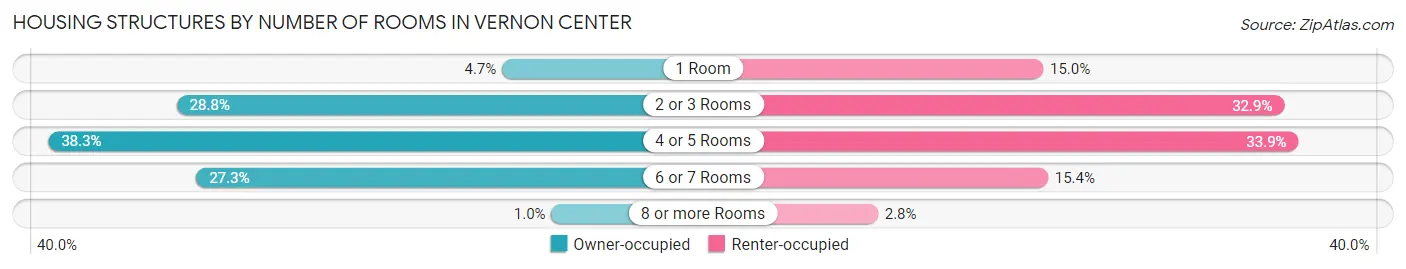
| Number of Rooms | Owner-occupied | Renter-occupied |
| 1 Room | 32 (4.7%) | 43 (15.0%) |
| 2 or 3 Rooms | 197 (28.8%) | 94 (32.9%) |
| 4 or 5 Rooms | 262 (38.3%) | 97 (33.9%) |
| 6 or 7 Rooms | 187 (27.3%) | 44 (15.4%) |
| 8 or more Rooms | 7 (1.0%) | 8 (2.8%) |
| Total | 685 (100.0%) | 286 (100.0%) |
Housing Structure by Heating Type in Vernon Center
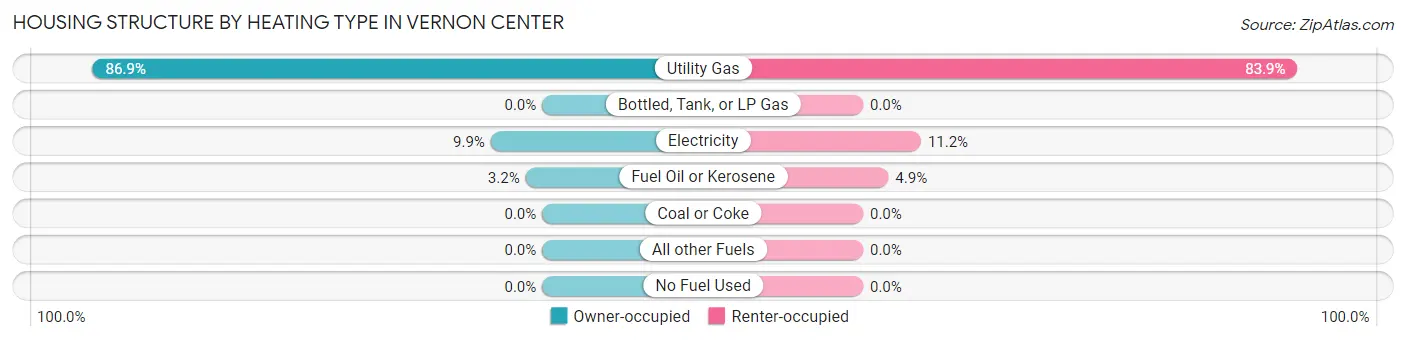
| Heating Type | Owner-occupied | Renter-occupied |
| Utility Gas | 595 (86.9%) | 240 (83.9%) |
| Bottled, Tank, or LP Gas | 0 (0.0%) | 0 (0.0%) |
| Electricity | 68 (9.9%) | 32 (11.2%) |
| Fuel Oil or Kerosene | 22 (3.2%) | 14 (4.9%) |
| Coal or Coke | 0 (0.0%) | 0 (0.0%) |
| All other Fuels | 0 (0.0%) | 0 (0.0%) |
| No Fuel Used | 0 (0.0%) | 0 (0.0%) |
| Total | 685 (100.0%) | 286 (100.0%) |
Household Vehicle Usage in Vernon Center
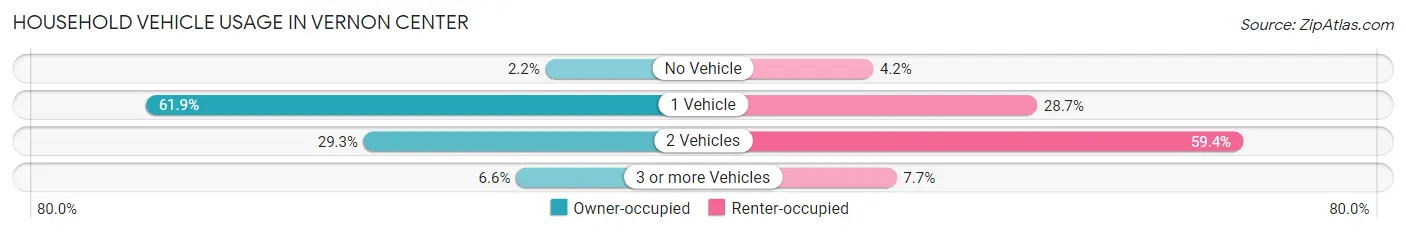
| Vehicles per Household | Owner-occupied | Renter-occupied |
| No Vehicle | 15 (2.2%) | 12 (4.2%) |
| 1 Vehicle | 424 (61.9%) | 82 (28.7%) |
| 2 Vehicles | 201 (29.3%) | 170 (59.4%) |
| 3 or more Vehicles | 45 (6.6%) | 22 (7.7%) |
| Total | 685 (100.0%) | 286 (100.0%) |
Real Estate & Mortgages in Vernon Center
Real Estate and Mortgage Overview in Vernon Center
| Characteristic | Without Mortgage | With Mortgage |
| Housing Units | 114 | 571 |
| Median Property Value | $141,700 | $146,300 |
| Median Household Income | - | - |
| Monthly Housing Costs | $876 | $0 |
| Real Estate Taxes | - | - |
Property Value by Mortgage Status in Vernon Center
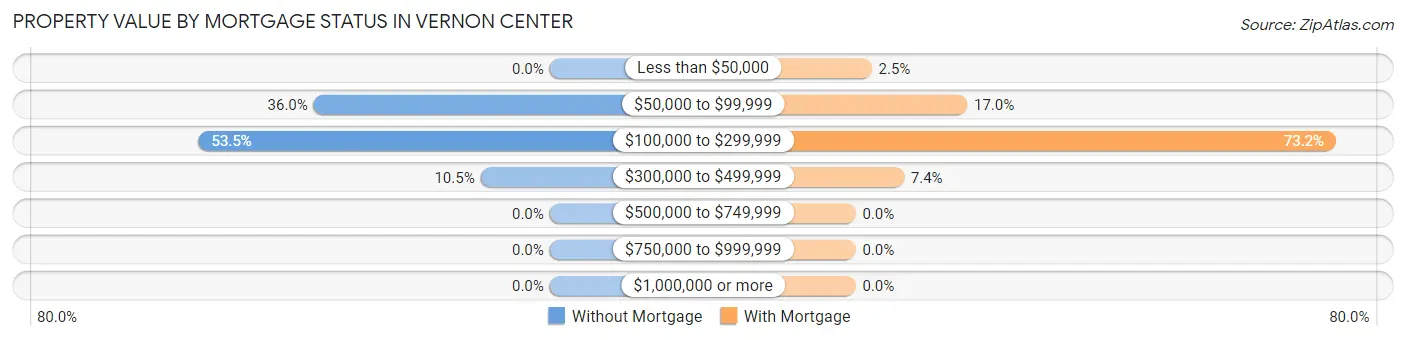
| Property Value | Without Mortgage | With Mortgage |
| Less than $50,000 | 0 (0.0%) | 14 (2.5%) |
| $50,000 to $99,999 | 41 (36.0%) | 97 (17.0%) |
| $100,000 to $299,999 | 61 (53.5%) | 418 (73.2%) |
| $300,000 to $499,999 | 12 (10.5%) | 42 (7.4%) |
| $500,000 to $749,999 | 0 (0.0%) | 0 (0.0%) |
| $750,000 to $999,999 | 0 (0.0%) | 0 (0.0%) |
| $1,000,000 or more | 0 (0.0%) | 0 (0.0%) |
| Total | 114 (100.0%) | 571 (100.0%) |
Household Income by Mortgage Status in Vernon Center
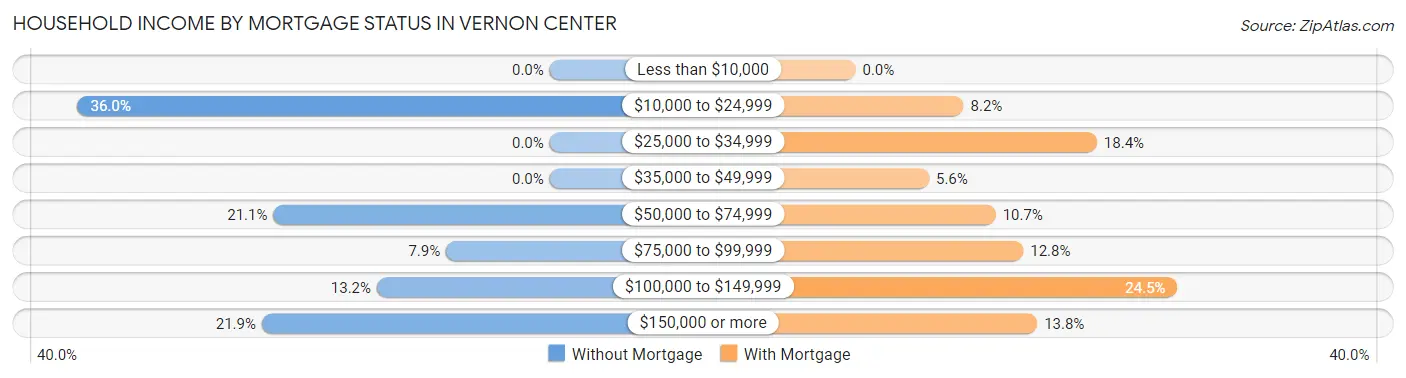
| Household Income | Without Mortgage | With Mortgage |
| Less than $10,000 | 0 (0.0%) | 0 (0.0%) |
| $10,000 to $24,999 | 41 (36.0%) | 47 (8.2%) |
| $25,000 to $34,999 | 0 (0.0%) | 105 (18.4%) |
| $35,000 to $49,999 | 0 (0.0%) | 32 (5.6%) |
| $50,000 to $74,999 | 24 (21.0%) | 61 (10.7%) |
| $75,000 to $99,999 | 9 (7.9%) | 73 (12.8%) |
| $100,000 to $149,999 | 15 (13.2%) | 140 (24.5%) |
| $150,000 or more | 25 (21.9%) | 79 (13.8%) |
| Total | 114 (100.0%) | 571 (100.0%) |
Property Value to Household Income Ratio in Vernon Center
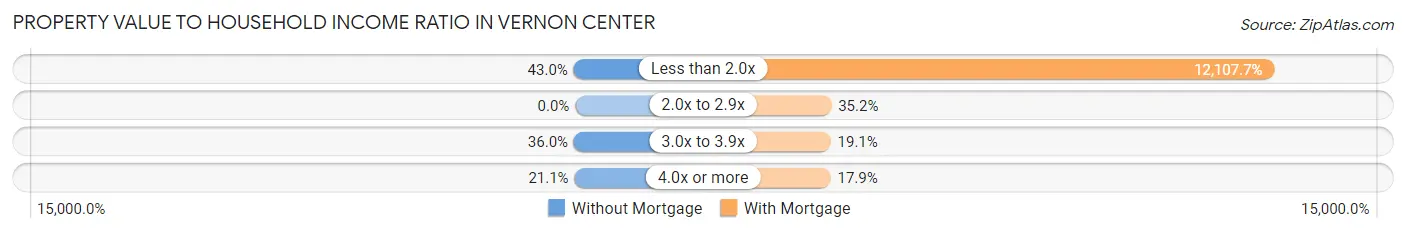
| Value-to-Income Ratio | Without Mortgage | With Mortgage |
| Less than 2.0x | 49 (43.0%) | 69,135 (12,107.7%) |
| 2.0x to 2.9x | 0 (0.0%) | 201 (35.2%) |
| 3.0x to 3.9x | 41 (36.0%) | 109 (19.1%) |
| 4.0x or more | 24 (21.0%) | 102 (17.9%) |
| Total | 114 (100.0%) | 571 (100.0%) |
Real Estate Taxes by Mortgage Status in Vernon Center
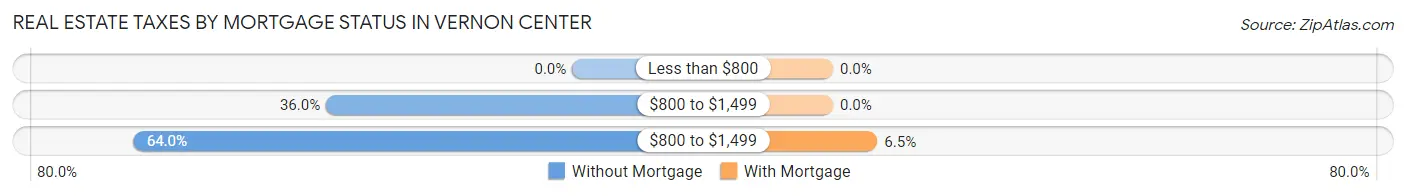
| Property Taxes | Without Mortgage | With Mortgage |
| Less than $800 | 0 (0.0%) | 0 (0.0%) |
| $800 to $1,499 | 41 (36.0%) | 0 (0.0%) |
| $800 to $1,499 | 73 (64.0%) | 37 (6.5%) |
| Total | 114 (100.0%) | 571 (100.0%) |
Health & Disability in Vernon Center
Health Insurance Coverage by Age in Vernon Center
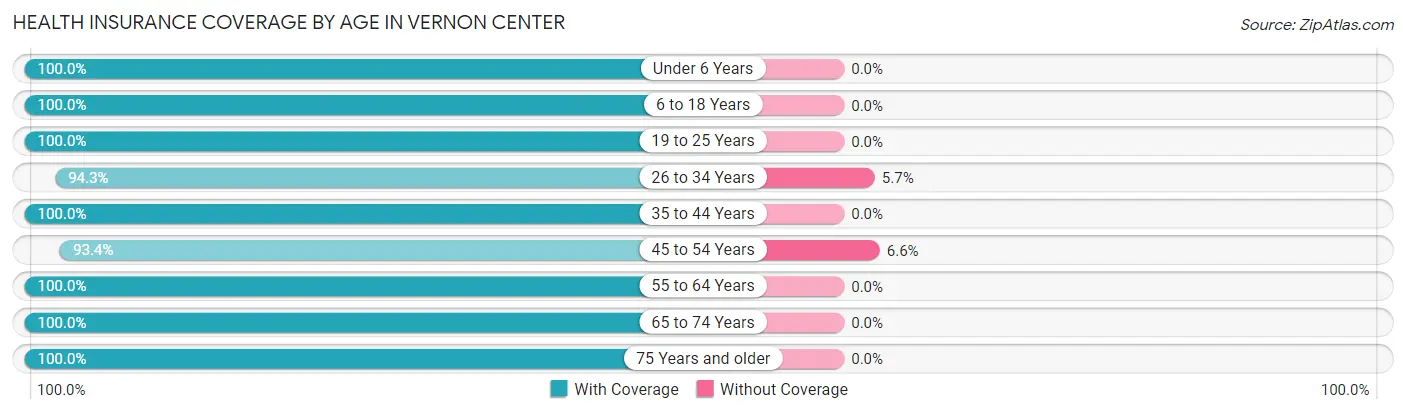
| Age Bracket | With Coverage | Without Coverage |
| Under 6 Years | 45 (100.0%) | 0 (0.0%) |
| 6 to 18 Years | 57 (100.0%) | 0 (0.0%) |
| 19 to 25 Years | 229 (100.0%) | 0 (0.0%) |
| 26 to 34 Years | 314 (94.3%) | 19 (5.7%) |
| 35 to 44 Years | 204 (100.0%) | 0 (0.0%) |
| 45 to 54 Years | 183 (93.4%) | 13 (6.6%) |
| 55 to 64 Years | 228 (100.0%) | 0 (0.0%) |
| 65 to 74 Years | 123 (100.0%) | 0 (0.0%) |
| 75 Years and older | 78 (100.0%) | 0 (0.0%) |
| Total | 1,461 (97.9%) | 32 (2.1%) |
Health Insurance Coverage by Citizenship Status in Vernon Center
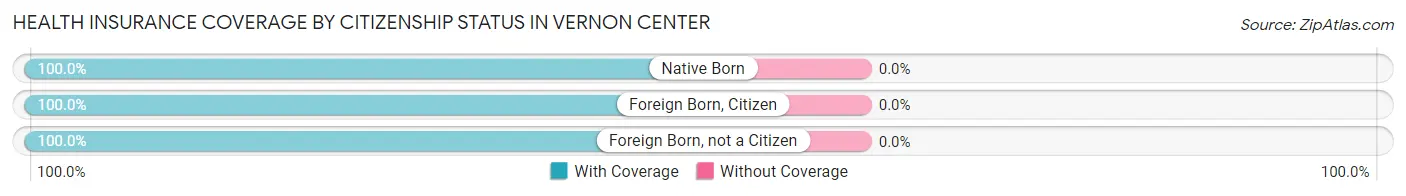
| Citizenship Status | With Coverage | Without Coverage |
| Native Born | 45 (100.0%) | 0 (0.0%) |
| Foreign Born, Citizen | 57 (100.0%) | 0 (0.0%) |
| Foreign Born, not a Citizen | 229 (100.0%) | 0 (0.0%) |
Health Insurance Coverage by Household Income in Vernon Center
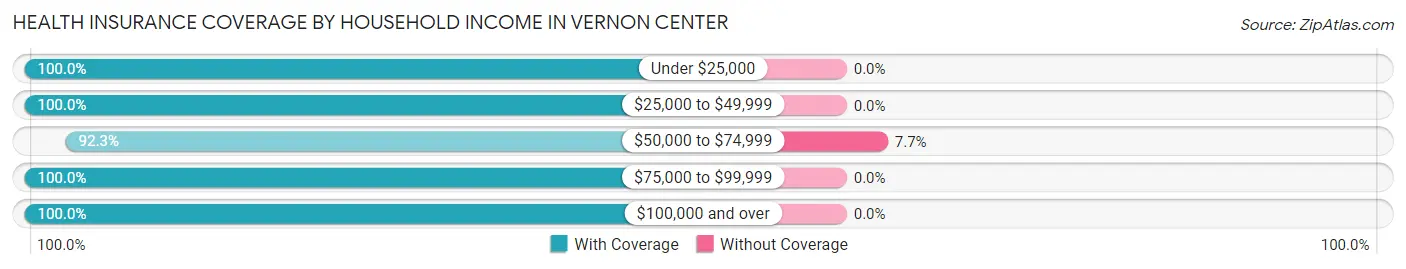
| Household Income | With Coverage | Without Coverage |
| Under $25,000 | 248 (100.0%) | 0 (0.0%) |
| $25,000 to $49,999 | 137 (100.0%) | 0 (0.0%) |
| $50,000 to $74,999 | 312 (92.3%) | 26 (7.7%) |
| $75,000 to $99,999 | 345 (100.0%) | 0 (0.0%) |
| $100,000 and over | 407 (100.0%) | 0 (0.0%) |
Public vs Private Health Insurance Coverage by Age in Vernon Center
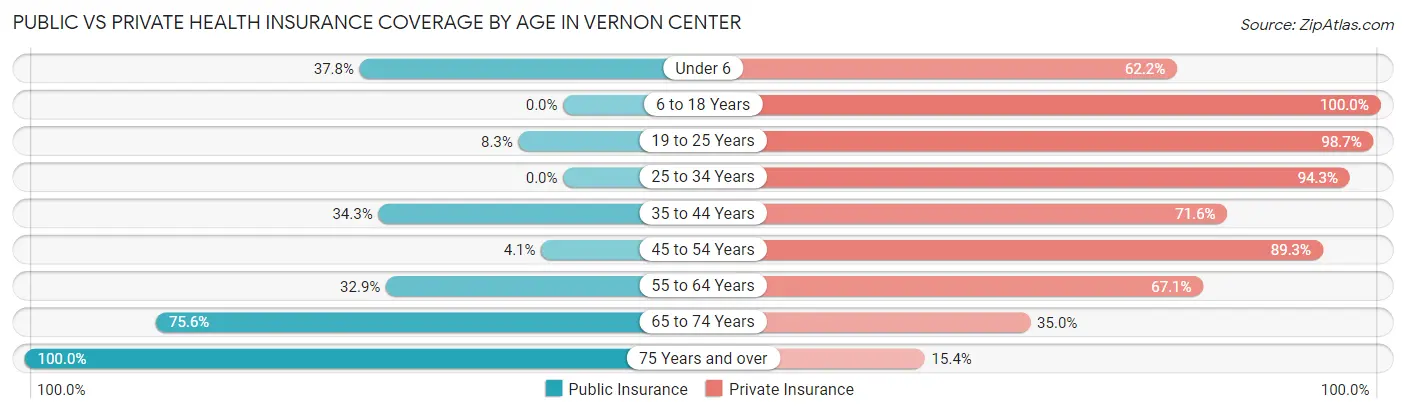
| Age Bracket | Public Insurance | Private Insurance |
| Under 6 | 17 (37.8%) | 28 (62.2%) |
| 6 to 18 Years | 0 (0.0%) | 57 (100.0%) |
| 19 to 25 Years | 19 (8.3%) | 226 (98.7%) |
| 25 to 34 Years | 0 (0.0%) | 314 (94.3%) |
| 35 to 44 Years | 70 (34.3%) | 146 (71.6%) |
| 45 to 54 Years | 8 (4.1%) | 175 (89.3%) |
| 55 to 64 Years | 75 (32.9%) | 153 (67.1%) |
| 65 to 74 Years | 93 (75.6%) | 43 (35.0%) |
| 75 Years and over | 78 (100.0%) | 12 (15.4%) |
| Total | 360 (24.1%) | 1,154 (77.3%) |
Disability Status by Sex by Age in Vernon Center
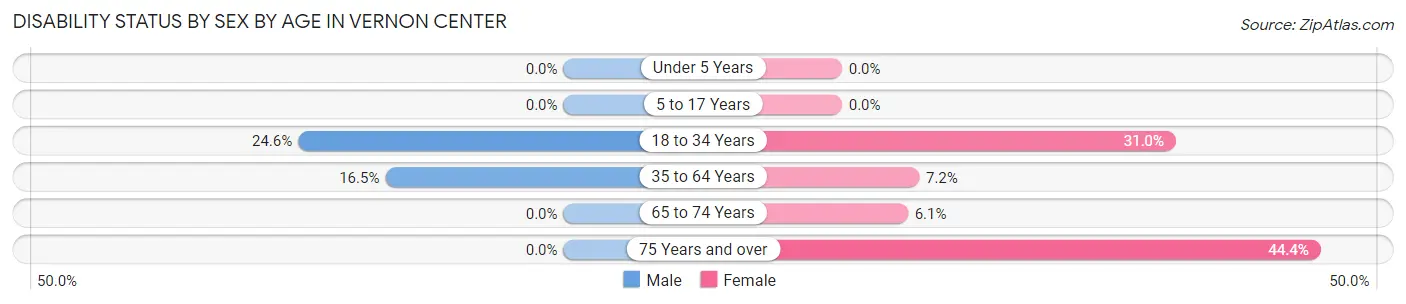
| Age Bracket | Male | Female |
| Under 5 Years | 0 (0.0%) | 0 (0.0%) |
| 5 to 17 Years | 0 (0.0%) | 0 (0.0%) |
| 18 to 34 Years | 82 (24.6%) | 71 (31.0%) |
| 35 to 64 Years | 60 (16.5%) | 19 (7.2%) |
| 65 to 74 Years | 0 (0.0%) | 3 (6.1%) |
| 75 Years and over | 0 (0.0%) | 12 (44.4%) |
Disability Class by Sex by Age in Vernon Center
Disability Class: Hearing Difficulty
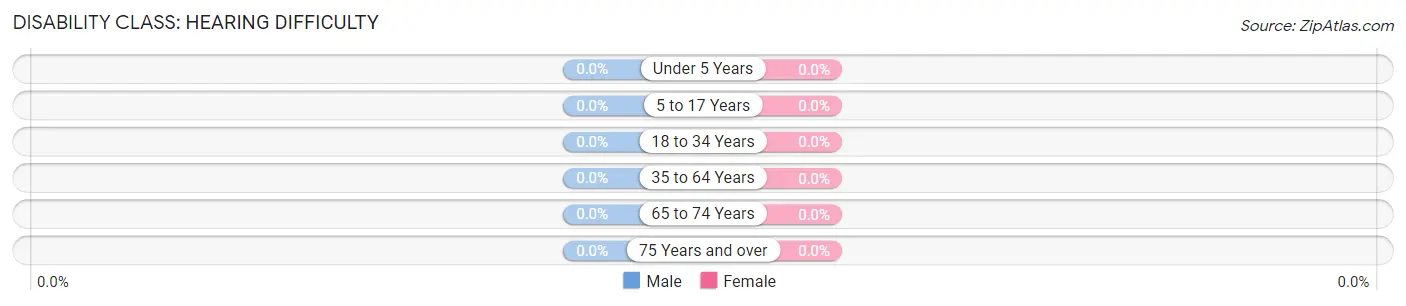
| Age Bracket | Male | Female |
| Under 5 Years | 0 (0.0%) | 0 (0.0%) |
| 5 to 17 Years | 0 (0.0%) | 0 (0.0%) |
| 18 to 34 Years | 0 (0.0%) | 0 (0.0%) |
| 35 to 64 Years | 0 (0.0%) | 0 (0.0%) |
| 65 to 74 Years | 0 (0.0%) | 0 (0.0%) |
| 75 Years and over | 0 (0.0%) | 0 (0.0%) |
Disability Class: Vision Difficulty
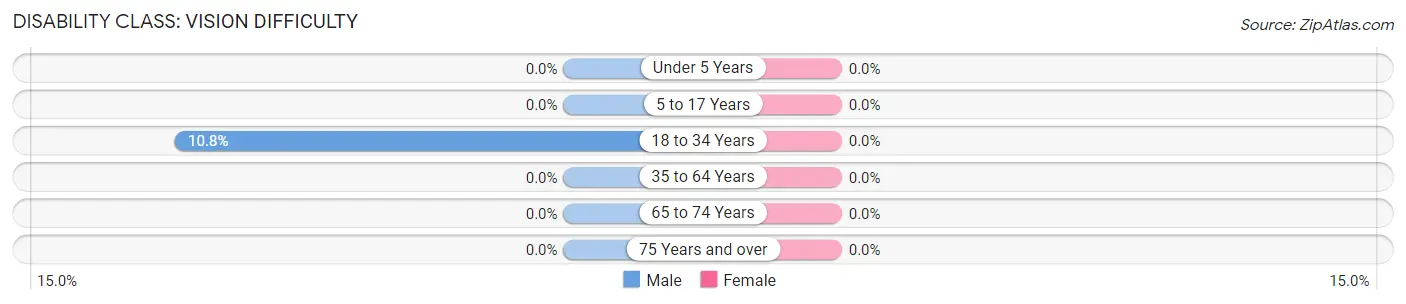
| Age Bracket | Male | Female |
| Under 5 Years | 0 (0.0%) | 0 (0.0%) |
| 5 to 17 Years | 0 (0.0%) | 0 (0.0%) |
| 18 to 34 Years | 36 (10.8%) | 0 (0.0%) |
| 35 to 64 Years | 0 (0.0%) | 0 (0.0%) |
| 65 to 74 Years | 0 (0.0%) | 0 (0.0%) |
| 75 Years and over | 0 (0.0%) | 0 (0.0%) |
Disability Class: Cognitive Difficulty
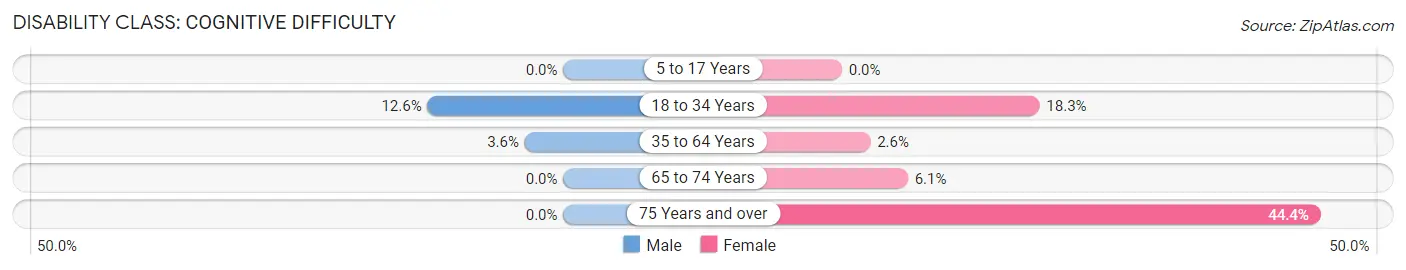
| Age Bracket | Male | Female |
| 5 to 17 Years | 0 (0.0%) | 0 (0.0%) |
| 18 to 34 Years | 42 (12.6%) | 42 (18.3%) |
| 35 to 64 Years | 13 (3.6%) | 7 (2.6%) |
| 65 to 74 Years | 0 (0.0%) | 3 (6.1%) |
| 75 Years and over | 0 (0.0%) | 12 (44.4%) |
Disability Class: Ambulatory Difficulty
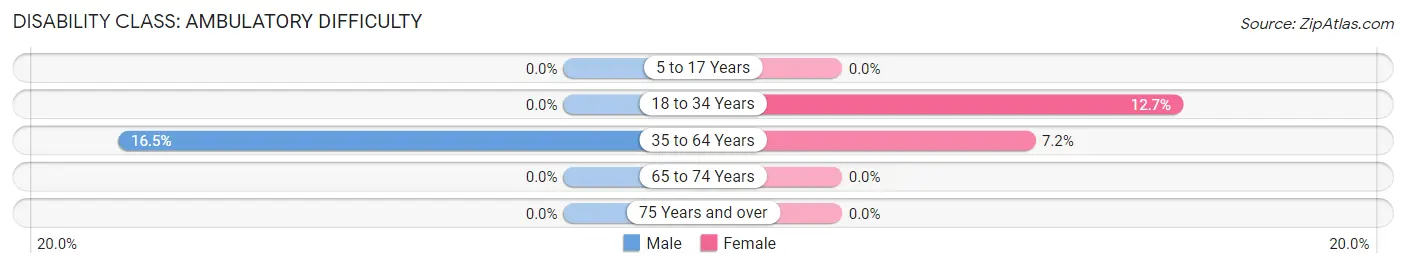
| Age Bracket | Male | Female |
| 5 to 17 Years | 0 (0.0%) | 0 (0.0%) |
| 18 to 34 Years | 0 (0.0%) | 29 (12.7%) |
| 35 to 64 Years | 60 (16.5%) | 19 (7.2%) |
| 65 to 74 Years | 0 (0.0%) | 0 (0.0%) |
| 75 Years and over | 0 (0.0%) | 0 (0.0%) |
Disability Class: Self-Care Difficulty
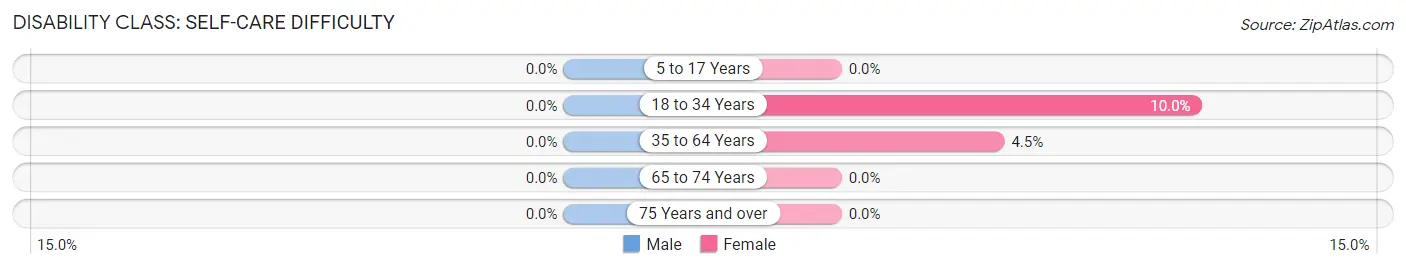
| Age Bracket | Male | Female |
| 5 to 17 Years | 0 (0.0%) | 0 (0.0%) |
| 18 to 34 Years | 0 (0.0%) | 23 (10.0%) |
| 35 to 64 Years | 0 (0.0%) | 12 (4.5%) |
| 65 to 74 Years | 0 (0.0%) | 0 (0.0%) |
| 75 Years and over | 0 (0.0%) | 0 (0.0%) |
Technology Access in Vernon Center
Computing Device Access in Vernon Center
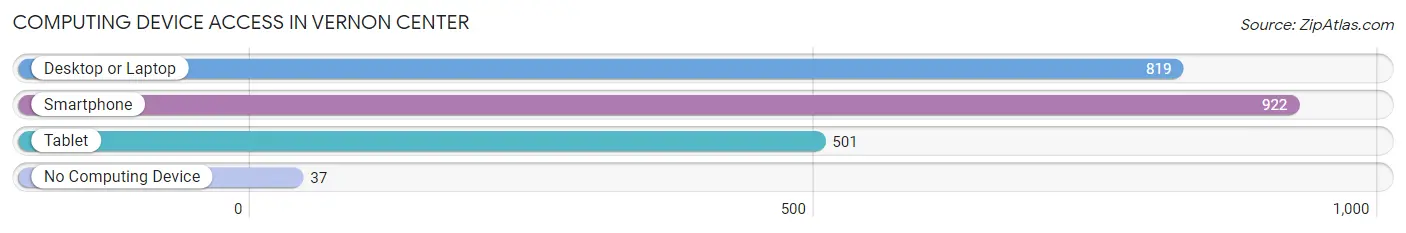
| Device Type | # Households | % Households |
| Desktop or Laptop | 819 | 84.4% |
| Smartphone | 922 | 95.0% |
| Tablet | 501 | 51.6% |
| No Computing Device | 37 | 3.8% |
| Total | 971 | 100.0% |
Internet Access in Vernon Center
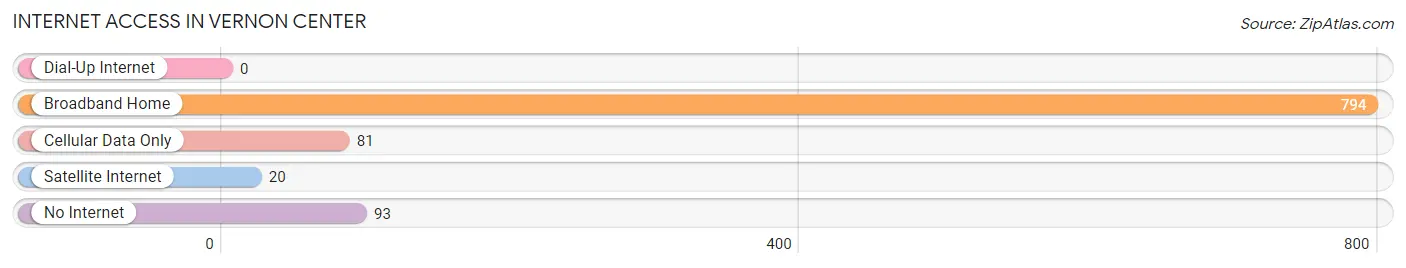
| Internet Type | # Households | % Households |
| Dial-Up Internet | 0 | 0.0% |
| Broadband Home | 794 | 81.8% |
| Cellular Data Only | 81 | 8.3% |
| Satellite Internet | 20 | 2.1% |
| No Internet | 93 | 9.6% |
| Total | 971 | 100.0% |
Vernon Center Summary
Vernon Center is a small unincorporated community located in Sussex County, New Jersey. It is situated in the northwest corner of the county, near the border with New York State. The community is located in the Kittatinny Valley, a region of the Appalachian Mountains. The area is known for its rural beauty and is home to a variety of wildlife, including deer, bear, and wild turkey.
History
The area that is now Vernon Center was first settled in the late 1700s by German and Dutch immigrants. The community was originally known as “Vernon” and was part of the township of Wantage. In 1824, the area was incorporated as the Township of Vernon. The name was changed to Vernon Center in 1845.
The community was an agricultural center for much of its history. The area was known for its dairy farms and orchards. In the late 19th century, the area began to develop as a resort destination. The area was home to several hotels and resorts, including the Vernon House, which was built in 1891.
Geography
Vernon Center is located in the Kittatinny Valley, a region of the Appalachian Mountains. The area is characterized by rolling hills and valleys, with elevations ranging from 500 to 1,000 feet. The area is home to a variety of wildlife, including deer, bear, and wild turkey.
The community is located in the northwest corner of Sussex County, near the border with New York State. It is bordered by the townships of Wantage, Frankford, and Montague. The nearest major cities are Scranton, Pennsylvania, and New York City.
Economy
The economy of Vernon Center is largely based on agriculture and tourism. The area is known for its dairy farms and orchards. The area is also home to several resorts and hotels, including the Vernon House.
The area is also home to several small businesses, including a general store, a hardware store, and a gas station. The community is also home to a post office and a volunteer fire department.
Demographics
As of the 2010 census, the population of Vernon Center was 1,845. The racial makeup of the community was 94.3% White, 2.2% African American, 0.3% Native American, 0.7% Asian, and 2.5% from other races. The median household income was $50,938.
Conclusion
Vernon Center is a small unincorporated community located in Sussex County, New Jersey. It is situated in the northwest corner of the county, near the border with New York State. The area is known for its rural beauty and is home to a variety of wildlife, including deer, bear, and wild turkey. The economy of Vernon Center is largely based on agriculture and tourism. The population of the community was 1,845 as of the 2010 census.
Common Questions
What is Per Capita Income in Vernon Center?
Per Capita income in Vernon Center is $50,045.
What is the Median Family Income in Vernon Center?
Median Family Income in Vernon Center is $84,625.
What is the Median Household income in Vernon Center?
Median Household Income in Vernon Center is $69,519.
What is Income or Wage Gap in Vernon Center?
Income or Wage Gap in Vernon Center is 37.0%.
Women in Vernon Center earn 63.0 cents for every dollar earned by a man.
What is Inequality or Gini Index in Vernon Center?
Inequality or Gini Index in Vernon Center is 0.38.
What is the Total Population of Vernon Center?
Total Population of Vernon Center is 1,493.
What is the Total Male Population of Vernon Center?
Total Male Population of Vernon Center is 870.
What is the Total Female Population of Vernon Center?
Total Female Population of Vernon Center is 623.
What is the Ratio of Males per 100 Females in Vernon Center?
There are 139.65 Males per 100 Females in Vernon Center.
What is the Ratio of Females per 100 Males in Vernon Center?
There are 71.61 Females per 100 Males in Vernon Center.
What is the Median Population Age in Vernon Center?
Median Population Age in Vernon Center is 41.4 Years.
What is the Average Family Size in Vernon Center
Average Family Size in Vernon Center is 2.2 People.
What is the Average Household Size in Vernon Center
Average Household Size in Vernon Center is 1.5 People.
How Large is the Labor Force in Vernon Center?
There are 1,186 People in the Labor Forcein in Vernon Center.
What is the Percentage of People in the Labor Force in Vernon Center?
82.0% of People are in the Labor Force in Vernon Center.
What is the Unemployment Rate in Vernon Center?
Unemployment Rate in Vernon Center is 1.8%.