Bonsall, CA Map & Demographics
Bonsall Map
Bonsall Overview
$64,948
PER CAPITA INCOME
$108,542
AVG FAMILY INCOME
$98,529
AVG HOUSEHOLD INCOME
47.0%
WAGE / INCOME GAP [ % ]
53.0¢/ $1
WAGE / INCOME GAP [ $ ]
0.54
INEQUALITY / GINI INDEX
4,131
TOTAL POPULATION
2,020
MALE POPULATION
2,111
FEMALE POPULATION
95.69
MALES / 100 FEMALES
104.50
FEMALES / 100 MALES
49.2
MEDIAN AGE
2.9
AVG FAMILY SIZE
2.4
AVG HOUSEHOLD SIZE
2,004
LABOR FORCE [ PEOPLE ]
57.8%
PERCENT IN LABOR FORCE
8.7%
UNEMPLOYMENT RATE
Bonsall Zip Codes
Bonsall Area Codes
Income in Bonsall
Income Overview in Bonsall
Per Capita Income in Bonsall is $64,948, while median incomes of families and households are $108,542 and $98,529 respectively.
| Characteristic | Number | Measure |
| Per Capita Income | 4,131 | $64,948 |
| Median Family Income | 1,149 | $108,542 |
| Mean Family Income | 1,149 | $177,472 |
| Median Household Income | 1,698 | $98,529 |
| Mean Household Income | 1,698 | $151,769 |
| Income Deficit | 1,149 | $0 |
| Wage / Income Gap (%) | 4,131 | 47.00% |
| Wage / Income Gap ($) | 4,131 | 53.00¢ per $1 |
| Gini / Inequality Index | 4,131 | 0.54 |
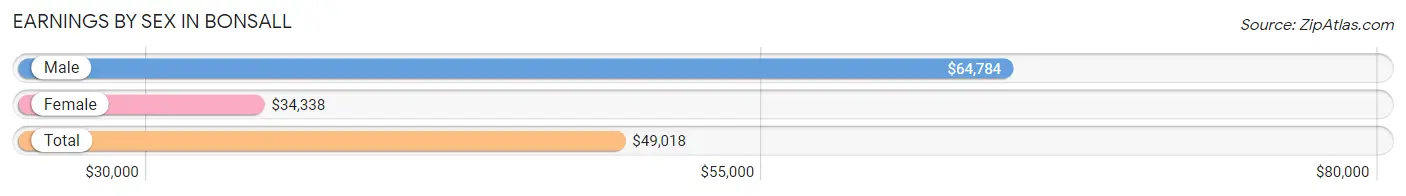
Earnings by Sex in Bonsall
Average Earnings in Bonsall are $49,018, $64,784 for men and $34,338 for women, a difference of 47.0%.
| Sex | Number | Average Earnings |
| Male | 1,079 (54.0%) | $64,784 |
| Female | 919 (46.0%) | $34,338 |
| Total | 1,998 (100.0%) | $49,018 |
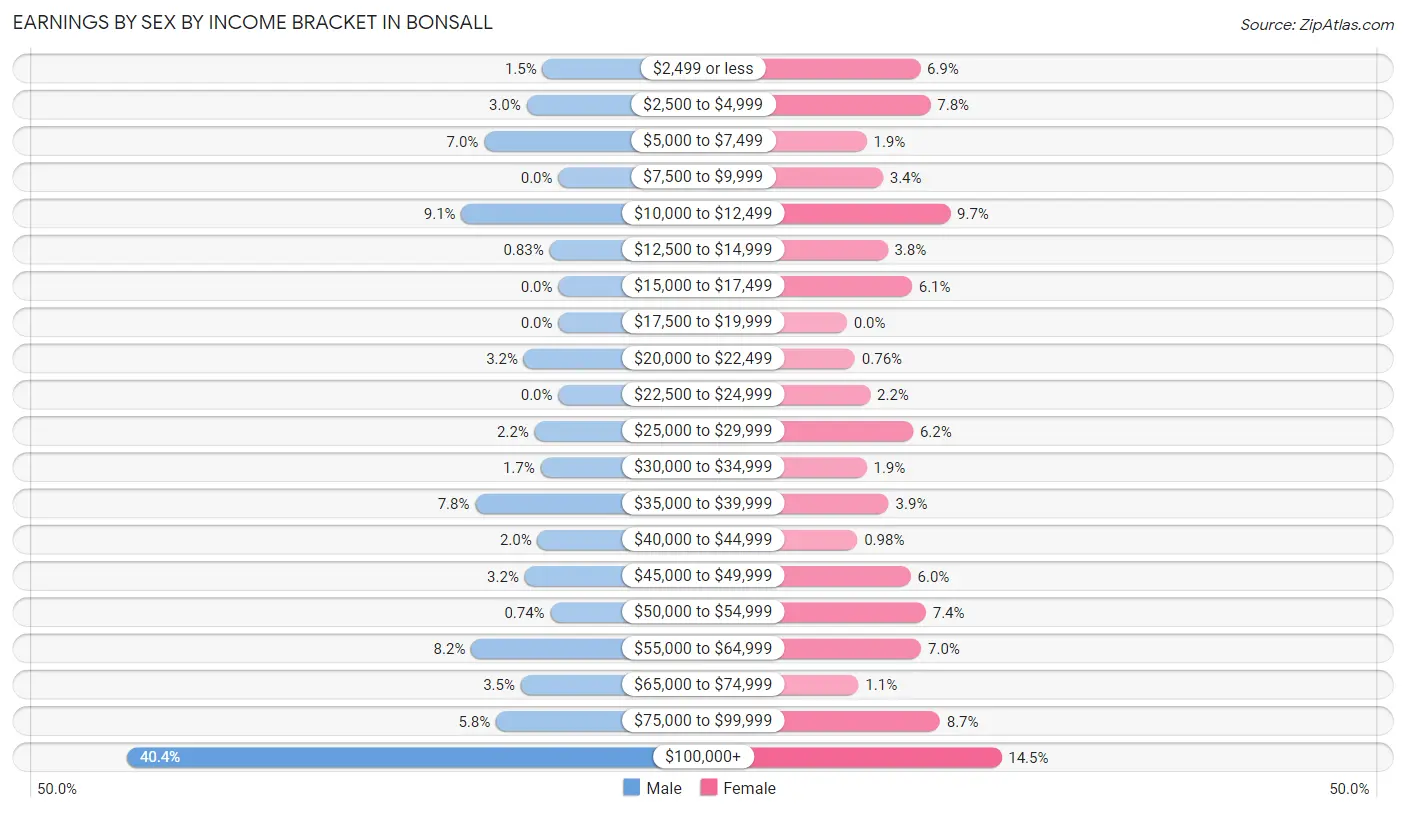
Earnings by Sex by Income Bracket in Bonsall
The most common earnings brackets in Bonsall are $100,000+ for men (436 | 40.4%) and $100,000+ for women (133 | 14.5%).
| Income | Male | Female |
| $2,499 or less | 16 (1.5%) | 63 (6.9%) |
| $2,500 to $4,999 | 32 (3.0%) | 72 (7.8%) |
| $5,000 to $7,499 | 75 (7.0%) | 17 (1.8%) |
| $7,500 to $9,999 | 0 (0.0%) | 31 (3.4%) |
| $10,000 to $12,499 | 98 (9.1%) | 89 (9.7%) |
| $12,500 to $14,999 | 9 (0.8%) | 35 (3.8%) |
| $15,000 to $17,499 | 0 (0.0%) | 56 (6.1%) |
| $17,500 to $19,999 | 0 (0.0%) | 0 (0.0%) |
| $20,000 to $22,499 | 35 (3.2%) | 7 (0.8%) |
| $22,500 to $24,999 | 0 (0.0%) | 20 (2.2%) |
| $25,000 to $29,999 | 24 (2.2%) | 57 (6.2%) |
| $30,000 to $34,999 | 18 (1.7%) | 17 (1.8%) |
| $35,000 to $39,999 | 84 (7.8%) | 36 (3.9%) |
| $40,000 to $44,999 | 21 (1.9%) | 9 (1.0%) |
| $45,000 to $49,999 | 34 (3.2%) | 55 (6.0%) |
| $50,000 to $54,999 | 8 (0.7%) | 68 (7.4%) |
| $55,000 to $64,999 | 88 (8.2%) | 64 (7.0%) |
| $65,000 to $74,999 | 38 (3.5%) | 10 (1.1%) |
| $75,000 to $99,999 | 63 (5.8%) | 80 (8.7%) |
| $100,000+ | 436 (40.4%) | 133 (14.5%) |
| Total | 1,079 (100.0%) | 919 (100.0%) |
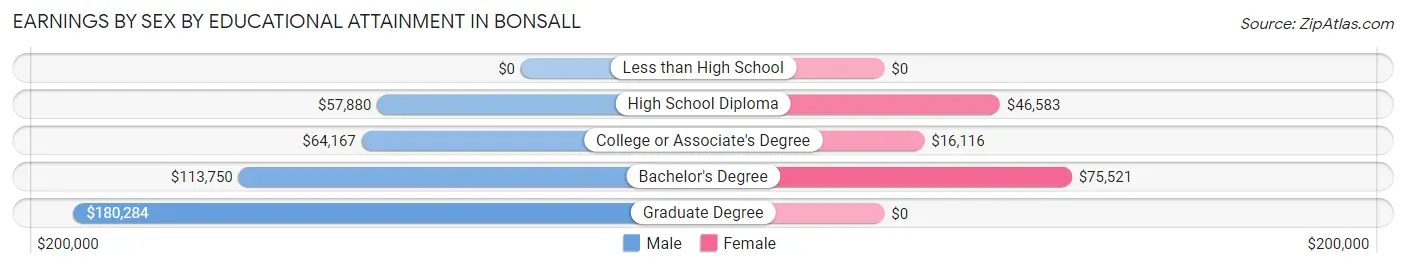
Earnings by Sex by Educational Attainment in Bonsall
Average earnings in Bonsall are $93,077 for men and $48,393 for women, a difference of 48.0%. Men with an educational attainment of graduate degree enjoy the highest average annual earnings of $180,284, while those with high school diploma education earn the least with $57,880. Women with an educational attainment of bachelor's degree earn the most with the average annual earnings of $75,521, while those with college or associate's degree education have the smallest earnings of $16,116.
| Educational Attainment | Male Income | Female Income |
| Less than High School | - | - |
| High School Diploma | $57,880 | $46,583 |
| College or Associate's Degree | $64,167 | $16,116 |
| Bachelor's Degree | $113,750 | $75,521 |
| Graduate Degree | $180,284 | $0 |
| Total | $93,077 | $48,393 |
Family Income in Bonsall
Family Income Brackets in Bonsall
According to the Bonsall family income data, there are 355 families falling into the $100,000 to $149,999 income range, which is the most common income bracket and makes up 30.9% of all families.
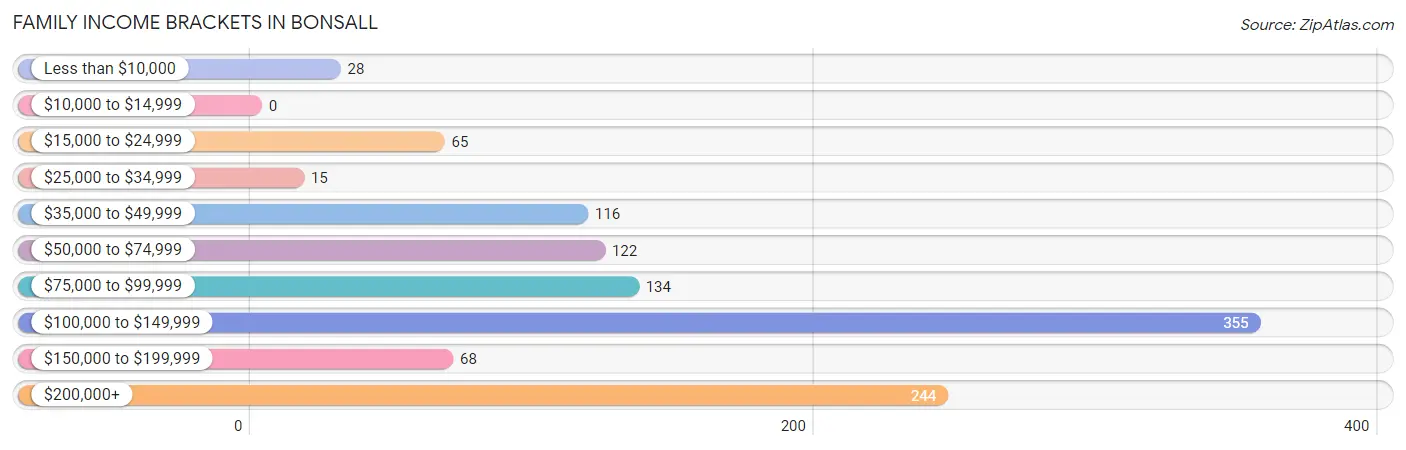
| Income Bracket | # Families | % Families |
| Less than $10,000 | 28 | 2.4% |
| $10,000 to $14,999 | 0 | 0.0% |
| $15,000 to $24,999 | 65 | 5.7% |
| $25,000 to $34,999 | 15 | 1.3% |
| $35,000 to $49,999 | 116 | 10.1% |
| $50,000 to $74,999 | 122 | 10.6% |
| $75,000 to $99,999 | 134 | 11.7% |
| $100,000 to $149,999 | 355 | 30.9% |
| $150,000 to $199,999 | 68 | 5.9% |
| $200,000+ | 244 | 21.2% |
Family Income by Famaliy Size in Bonsall
4-person families (201 | 17.5%) account for the highest median family income in Bonsall with $116,719 per family, while 2-person families (626 | 54.5%) have the highest median income of $53,672 per family member.
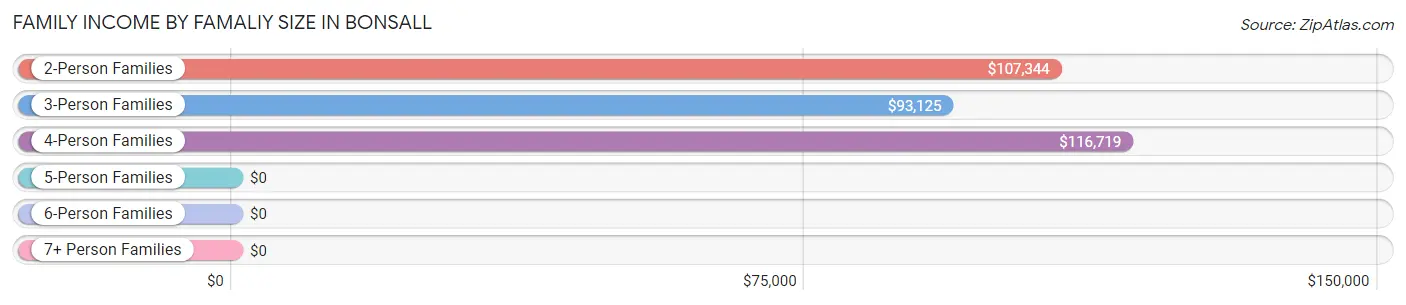
| Income Bracket | # Families | Median Income |
| 2-Person Families | 626 (54.5%) | $107,344 |
| 3-Person Families | 280 (24.4%) | $93,125 |
| 4-Person Families | 201 (17.5%) | $116,719 |
| 5-Person Families | 14 (1.2%) | $0 |
| 6-Person Families | 28 (2.4%) | $0 |
| 7+ Person Families | 0 (0.0%) | $0 |
| Total | 1,149 (100.0%) | $108,542 |
Family Income by Number of Earners in Bonsall
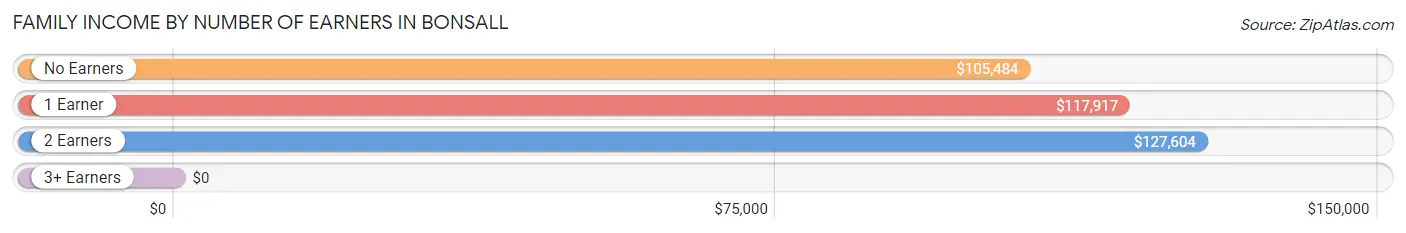
| Number of Earners | # Families | Median Income |
| No Earners | 329 (28.6%) | $105,484 |
| 1 Earner | 327 (28.5%) | $117,917 |
| 2 Earners | 445 (38.7%) | $127,604 |
| 3+ Earners | 48 (4.2%) | $0 |
| Total | 1,149 (100.0%) | $108,542 |
Household Income in Bonsall
Household Income Brackets in Bonsall
With 426 households falling in the category, the $100,000 to $149,999 income range is the most frequent in Bonsall, accounting for 25.1% of all households. In contrast, only 34 households (2.0%) fall into the $25,000 to $34,999 income bracket, making it the least populous group.
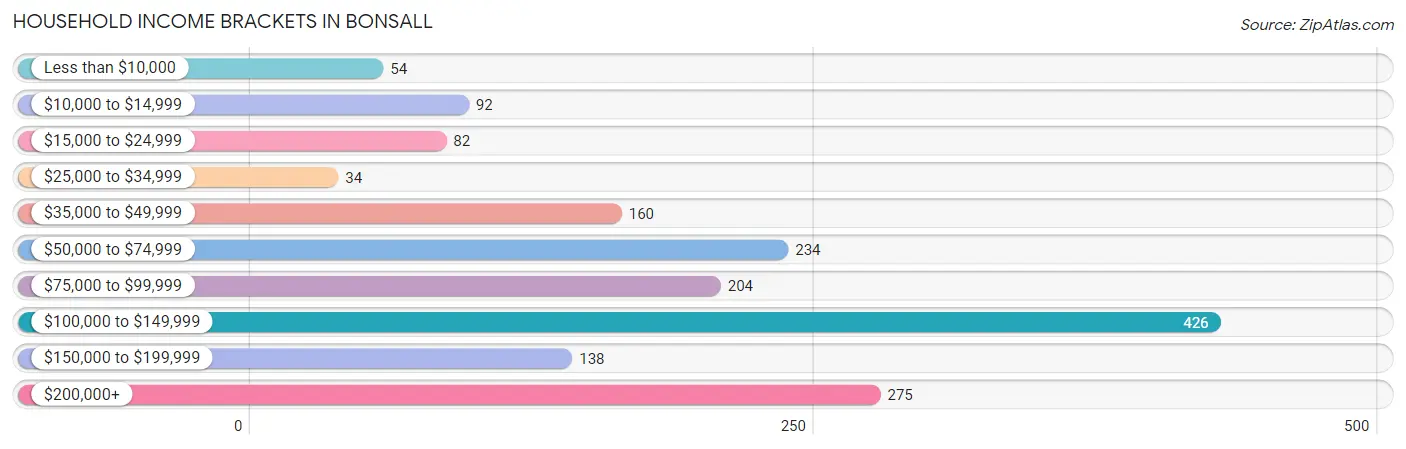
| Income Bracket | # Households | % Households |
| Less than $10,000 | 54 | 3.2% |
| $10,000 to $14,999 | 92 | 5.4% |
| $15,000 to $24,999 | 82 | 4.8% |
| $25,000 to $34,999 | 34 | 2.0% |
| $35,000 to $49,999 | 160 | 9.4% |
| $50,000 to $74,999 | 234 | 13.8% |
| $75,000 to $99,999 | 204 | 12.0% |
| $100,000 to $149,999 | 426 | 25.1% |
| $150,000 to $199,999 | 138 | 8.1% |
| $200,000+ | 275 | 16.2% |
Household Income by Householder Age in Bonsall
The median household income in Bonsall is $98,529, with the highest median household income of $117,833 found in the 45 to 64 years age bracket for the primary householder. A total of 780 households (45.9%) fall into this category. Meanwhile, the 15 to 24 years age bracket for the primary householder has the lowest median household income of $0, with 27 households (1.6%) in this group.
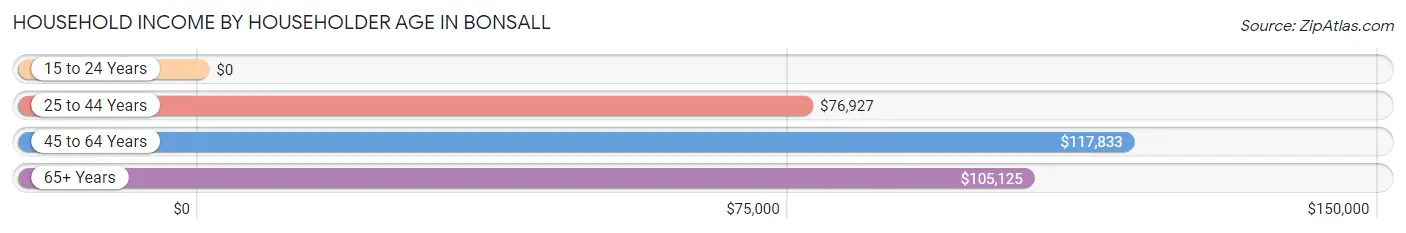
| Income Bracket | # Households | Median Income |
| 15 to 24 Years | 27 (1.6%) | $0 |
| 25 to 44 Years | 415 (24.4%) | $76,927 |
| 45 to 64 Years | 780 (45.9%) | $117,833 |
| 65+ Years | 476 (28.0%) | $105,125 |
| Total | 1,698 (100.0%) | $98,529 |
Poverty in Bonsall
Income Below Poverty by Sex and Age in Bonsall
With 15.4% poverty level for males and 6.1% for females among the residents of Bonsall, under 5 year old males and 25 to 34 year old females are the most vulnerable to poverty, with 55 males (45.8%) and 59 females (39.9%) in their respective age groups living below the poverty level.
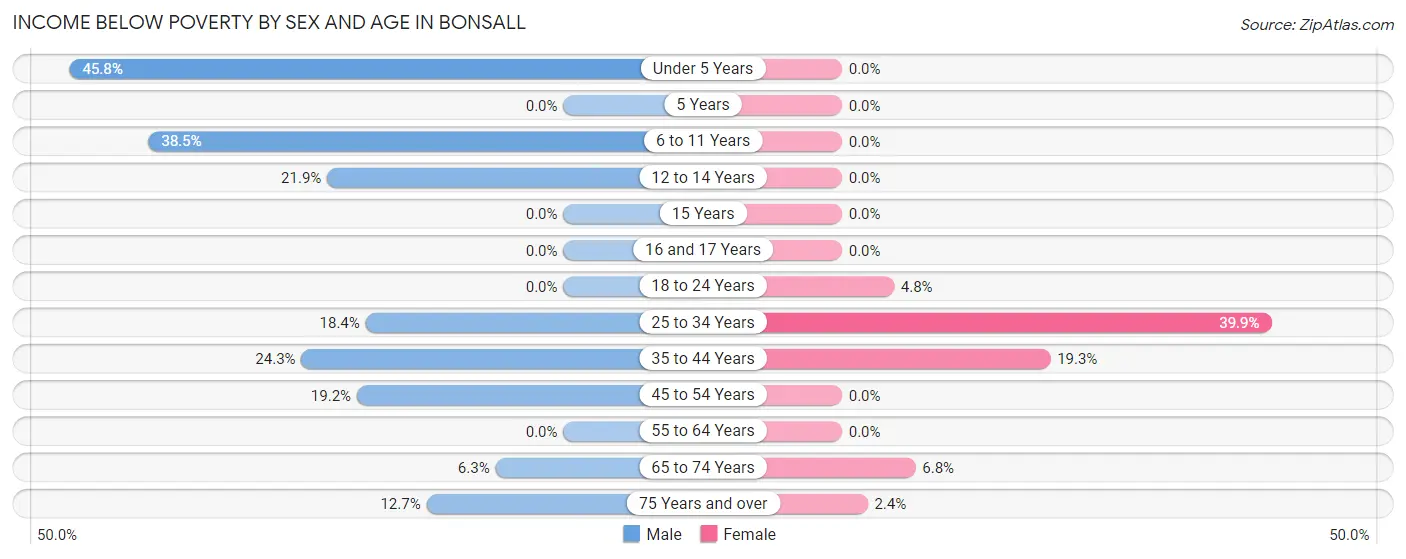
| Age Bracket | Male | Female |
| Under 5 Years | 55 (45.8%) | 0 (0.0%) |
| 5 Years | 0 (0.0%) | 0 (0.0%) |
| 6 to 11 Years | 47 (38.5%) | 0 (0.0%) |
| 12 to 14 Years | 16 (21.9%) | 0 (0.0%) |
| 15 Years | 0 (0.0%) | 0 (0.0%) |
| 16 and 17 Years | 0 (0.0%) | 0 (0.0%) |
| 18 to 24 Years | 0 (0.0%) | 7 (4.8%) |
| 25 to 34 Years | 20 (18.3%) | 59 (39.9%) |
| 35 to 44 Years | 70 (24.3%) | 35 (19.3%) |
| 45 to 54 Years | 73 (19.2%) | 0 (0.0%) |
| 55 to 64 Years | 0 (0.0%) | 0 (0.0%) |
| 65 to 74 Years | 15 (6.3%) | 20 (6.8%) |
| 75 Years and over | 16 (12.7%) | 6 (2.4%) |
| Total | 312 (15.4%) | 127 (6.1%) |
Income Above Poverty by Sex and Age in Bonsall
According to the poverty statistics in Bonsall, males aged 5 years and females aged under 5 years are the age groups that are most secure financially, with 100.0% of males and 100.0% of females in these age groups living above the poverty line.
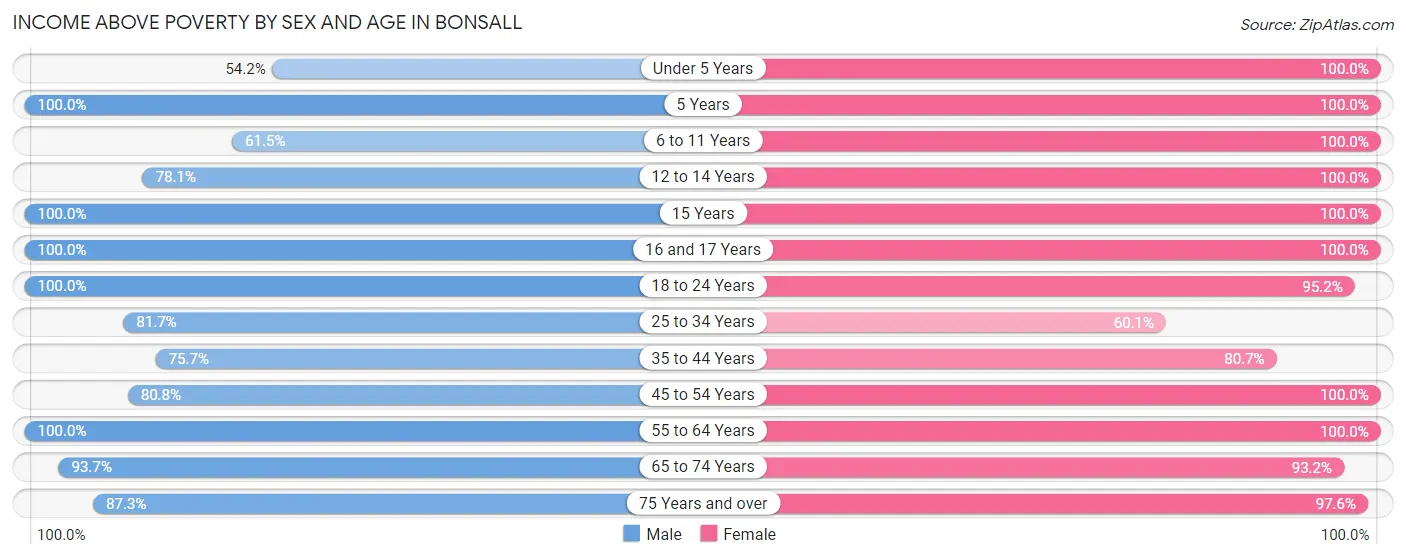
| Age Bracket | Male | Female |
| Under 5 Years | 65 (54.2%) | 70 (100.0%) |
| 5 Years | 18 (100.0%) | 7 (100.0%) |
| 6 to 11 Years | 75 (61.5%) | 104 (100.0%) |
| 12 to 14 Years | 57 (78.1%) | 37 (100.0%) |
| 15 Years | 7 (100.0%) | 59 (100.0%) |
| 16 and 17 Years | 75 (100.0%) | 88 (100.0%) |
| 18 to 24 Years | 143 (100.0%) | 138 (95.2%) |
| 25 to 34 Years | 89 (81.7%) | 89 (60.1%) |
| 35 to 44 Years | 218 (75.7%) | 146 (80.7%) |
| 45 to 54 Years | 308 (80.8%) | 360 (100.0%) |
| 55 to 64 Years | 320 (100.0%) | 320 (100.0%) |
| 65 to 74 Years | 223 (93.7%) | 273 (93.2%) |
| 75 Years and over | 110 (87.3%) | 246 (97.6%) |
| Total | 1,708 (84.6%) | 1,937 (93.9%) |
Income Below Poverty Among Married-Couple Families in Bonsall
The poverty statistics for married-couple families in Bonsall show that 4.3% or 36 of the total 837 families live below the poverty line. Families with 1 or 2 children have the highest poverty rate of 5.1%, comprising of 16 families. On the other hand, families with 3 or 4 children have the lowest poverty rate of 0.0%, which includes 0 families.
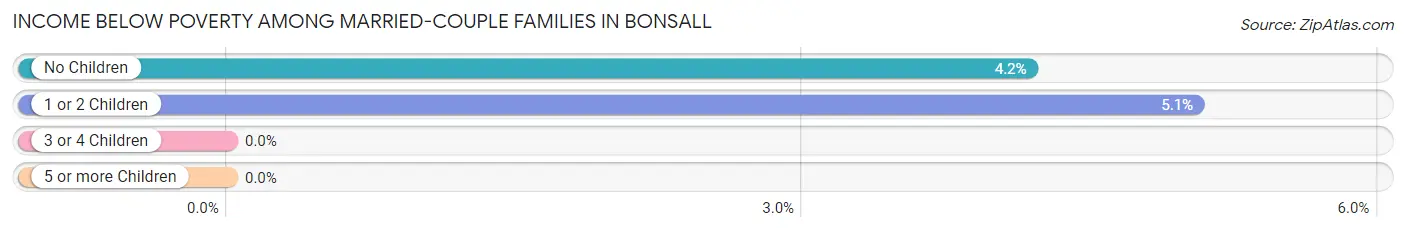
| Children | Above Poverty | Below Poverty |
| No Children | 458 (95.8%) | 20 (4.2%) |
| 1 or 2 Children | 301 (95.0%) | 16 (5.1%) |
| 3 or 4 Children | 42 (100.0%) | 0 (0.0%) |
| 5 or more Children | 0 (0.0%) | 0 (0.0%) |
| Total | 801 (95.7%) | 36 (4.3%) |
Income Below Poverty Among Single-Parent Households in Bonsall
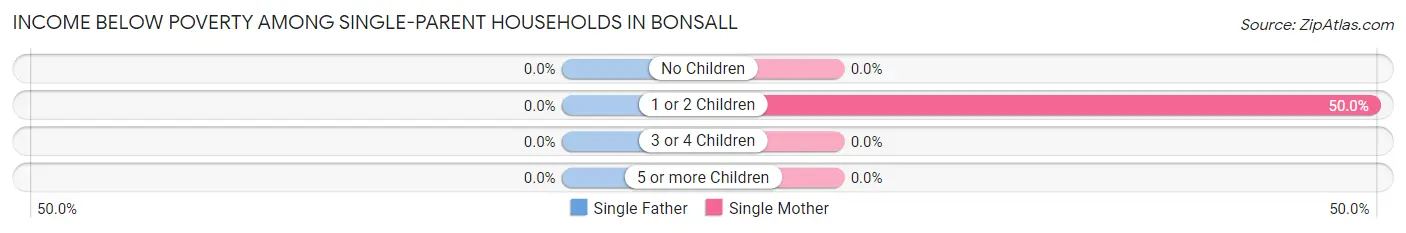
| Children | Single Father | Single Mother |
| No Children | 0 (0.0%) | 0 (0.0%) |
| 1 or 2 Children | 0 (0.0%) | 48 (50.0%) |
| 3 or 4 Children | 0 (0.0%) | 0 (0.0%) |
| 5 or more Children | 0 (0.0%) | 0 (0.0%) |
| Total | 0 (0.0%) | 48 (20.8%) |
Income Below Poverty Among Married-Couple vs Single-Parent Households in Bonsall
The poverty data for Bonsall shows that 36 of the married-couple family households (4.3%) and 48 of the single-parent households (15.4%) are living below the poverty level. Within the married-couple family households, those with 1 or 2 children have the highest poverty rate, with 16 households (5.1%) falling below the poverty line. Among the single-parent households, those with 1 or 2 children have the highest poverty rate, with 48 household (35.0%) living below poverty.
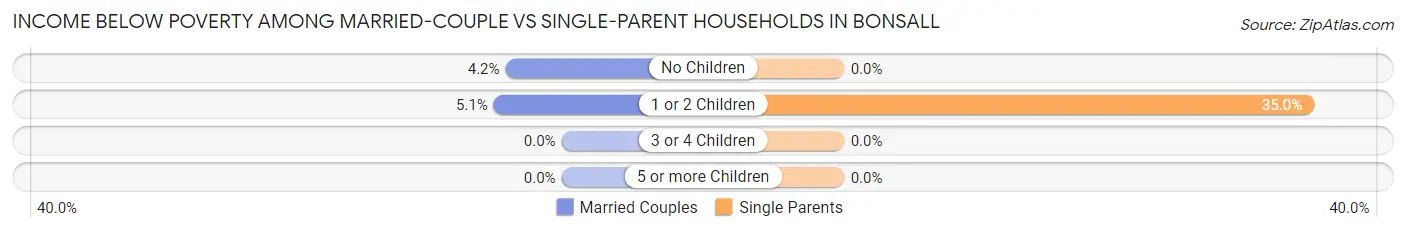
| Children | Married-Couple Families | Single-Parent Households |
| No Children | 20 (4.2%) | 0 (0.0%) |
| 1 or 2 Children | 16 (5.1%) | 48 (35.0%) |
| 3 or 4 Children | 0 (0.0%) | 0 (0.0%) |
| 5 or more Children | 0 (0.0%) | 0 (0.0%) |
| Total | 36 (4.3%) | 48 (15.4%) |
Race in Bonsall
The most populous races in Bonsall are White / Caucasian (3,476 | 84.1%), Hispanic or Latino (1,002 | 24.3%), and Two or more Races (332 | 8.0%).
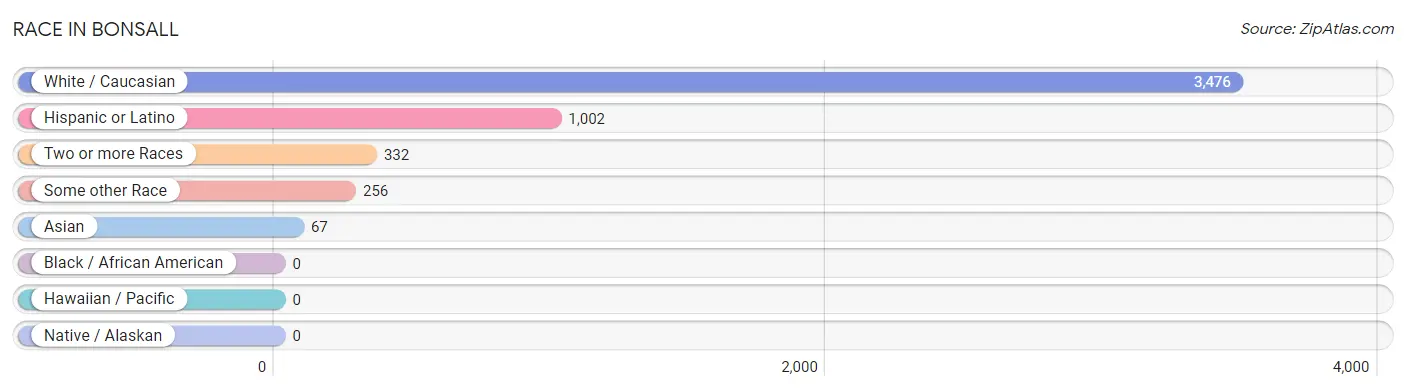
| Race | # Population | % Population |
| Asian | 67 | 1.6% |
| Black / African American | 0 | 0.0% |
| Hawaiian / Pacific | 0 | 0.0% |
| Hispanic or Latino | 1,002 | 24.3% |
| Native / Alaskan | 0 | 0.0% |
| White / Caucasian | 3,476 | 84.1% |
| Two or more Races | 332 | 8.0% |
| Some other Race | 256 | 6.2% |
| Total | 4,131 | 100.0% |
Ancestry in Bonsall
The most populous ancestries reported in Bonsall are Mexican (904 | 21.9%), English (680 | 16.5%), German (503 | 12.2%), Irish (442 | 10.7%), and Italian (240 | 5.8%), together accounting for 67.0% of all Bonsall residents.
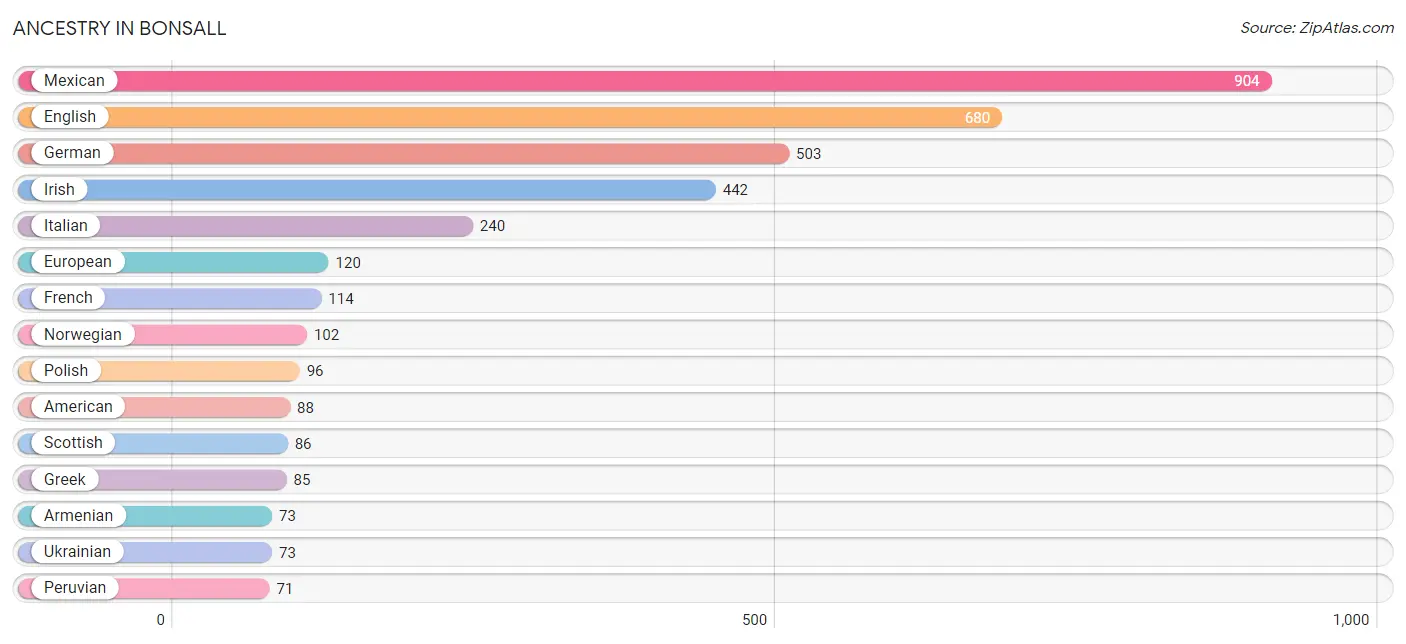
| Ancestry | # Population | % Population |
| American | 88 | 2.1% |
| Arab | 49 | 1.2% |
| Armenian | 73 | 1.8% |
| Austrian | 6 | 0.2% |
| Belgian | 30 | 0.7% |
| Bhutanese | 21 | 0.5% |
| British | 29 | 0.7% |
| Canadian | 60 | 1.5% |
| Celtic | 8 | 0.2% |
| Croatian | 11 | 0.3% |
| Danish | 50 | 1.2% |
| Dutch | 31 | 0.7% |
| Egyptian | 29 | 0.7% |
| English | 680 | 16.5% |
| European | 120 | 2.9% |
| French | 114 | 2.8% |
| German | 503 | 12.2% |
| Greek | 85 | 2.1% |
| Hungarian | 13 | 0.3% |
| Indian (Asian) | 47 | 1.1% |
| Iranian | 56 | 1.4% |
| Irish | 442 | 10.7% |
| Italian | 240 | 5.8% |
| Korean | 15 | 0.4% |
| Lebanese | 9 | 0.2% |
| Mexican | 904 | 21.9% |
| Navajo | 24 | 0.6% |
| Northern European | 19 | 0.5% |
| Norwegian | 102 | 2.5% |
| Pakistani | 23 | 0.6% |
| Palestinian | 9 | 0.2% |
| Peruvian | 71 | 1.7% |
| Polish | 96 | 2.3% |
| Portuguese | 30 | 0.7% |
| Puerto Rican | 24 | 0.6% |
| Scotch-Irish | 27 | 0.6% |
| Scottish | 86 | 2.1% |
| Slavic | 8 | 0.2% |
| South American | 71 | 1.7% |
| Sri Lankan | 23 | 0.6% |
| Swedish | 71 | 1.7% |
| Swiss | 16 | 0.4% |
| Thai | 29 | 0.7% |
| Ukrainian | 73 | 1.8% |
| Welsh | 29 | 0.7% |
| West Indian | 12 | 0.3% | View All 46 Rows |
Immigrants in Bonsall
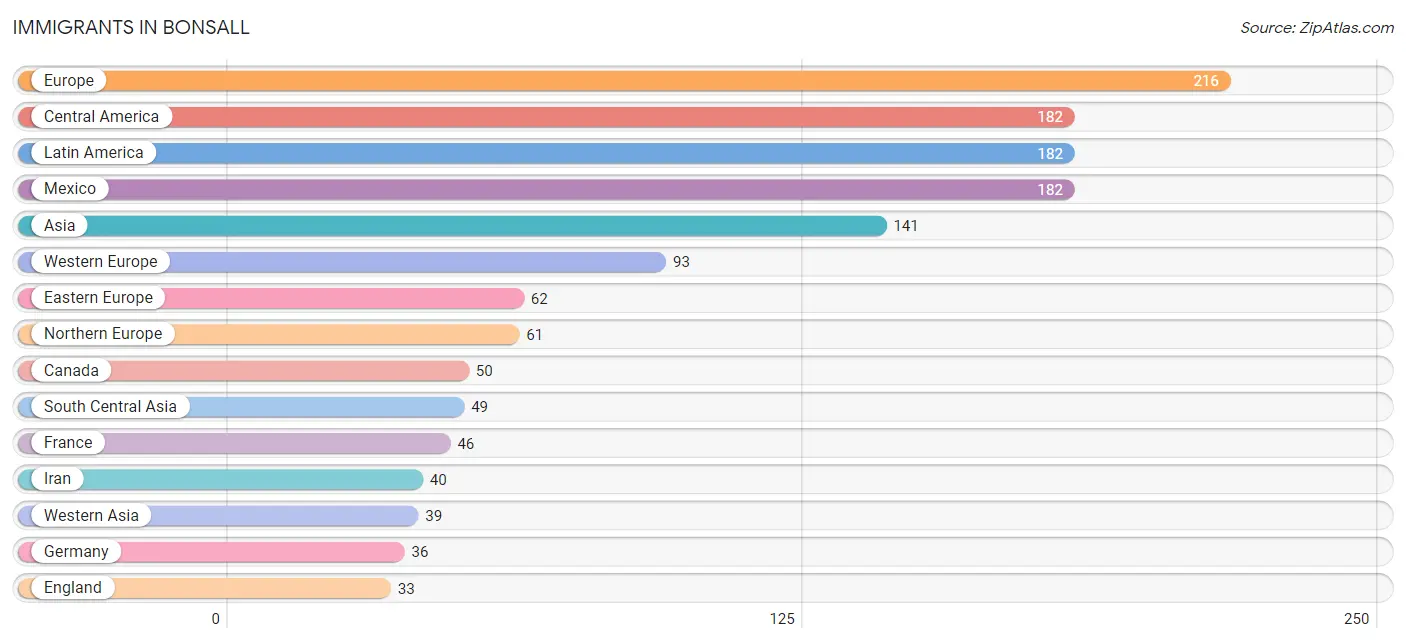
The most numerous immigrant groups reported in Bonsall came from Europe (216 | 5.2%), Central America (182 | 4.4%), Latin America (182 | 4.4%), Mexico (182 | 4.4%), and Asia (141 | 3.4%), together accounting for 21.9% of all Bonsall residents.
| Immigration Origin | # Population | % Population |
| Africa | 29 | 0.7% |
| Asia | 141 | 3.4% |
| Belgium | 11 | 0.3% |
| Canada | 50 | 1.2% |
| Central America | 182 | 4.4% |
| China | 25 | 0.6% |
| Denmark | 6 | 0.2% |
| Eastern Asia | 25 | 0.6% |
| Eastern Europe | 62 | 1.5% |
| Egypt | 20 | 0.5% |
| England | 33 | 0.8% |
| Europe | 216 | 5.2% |
| France | 46 | 1.1% |
| Germany | 36 | 0.9% |
| Iran | 40 | 1.0% |
| Ireland | 7 | 0.2% |
| Jordan | 11 | 0.3% |
| Latin America | 182 | 4.4% |
| Lebanon | 14 | 0.3% |
| Mexico | 182 | 4.4% |
| Northern Africa | 29 | 0.7% |
| Northern Europe | 61 | 1.5% |
| Pakistan | 9 | 0.2% |
| Philippines | 17 | 0.4% |
| Poland | 18 | 0.4% |
| South Central Asia | 49 | 1.2% |
| South Eastern Asia | 28 | 0.7% |
| Syria | 14 | 0.3% |
| Vietnam | 11 | 0.3% |
| Western Asia | 39 | 0.9% |
| Western Europe | 93 | 2.2% | View All 31 Rows |
Sex and Age in Bonsall
Sex and Age in Bonsall
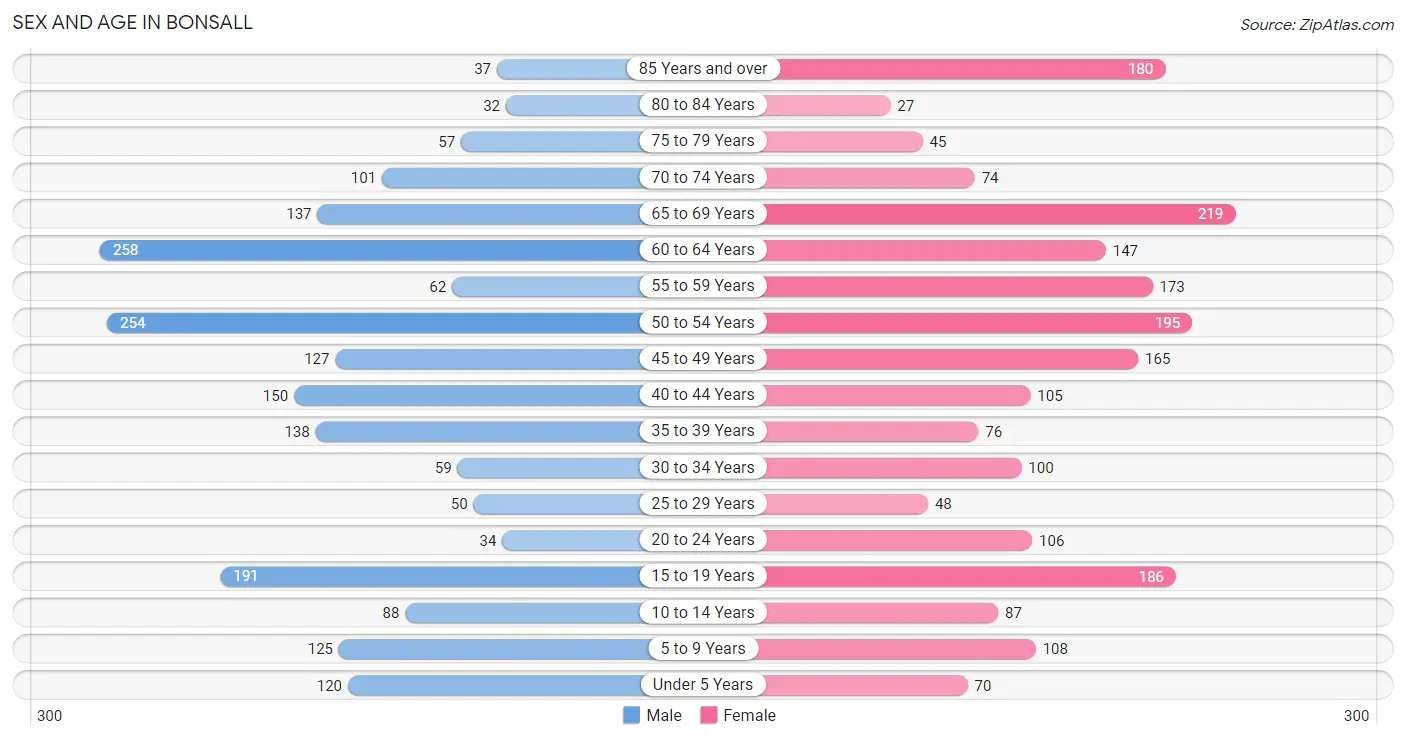
The most populous age groups in Bonsall are 60 to 64 Years (258 | 12.8%) for men and 65 to 69 Years (219 | 10.4%) for women.
| Age Bracket | Male | Female |
| Under 5 Years | 120 (5.9%) | 70 (3.3%) |
| 5 to 9 Years | 125 (6.2%) | 108 (5.1%) |
| 10 to 14 Years | 88 (4.4%) | 87 (4.1%) |
| 15 to 19 Years | 191 (9.5%) | 186 (8.8%) |
| 20 to 24 Years | 34 (1.7%) | 106 (5.0%) |
| 25 to 29 Years | 50 (2.5%) | 48 (2.3%) |
| 30 to 34 Years | 59 (2.9%) | 100 (4.7%) |
| 35 to 39 Years | 138 (6.8%) | 76 (3.6%) |
| 40 to 44 Years | 150 (7.4%) | 105 (5.0%) |
| 45 to 49 Years | 127 (6.3%) | 165 (7.8%) |
| 50 to 54 Years | 254 (12.6%) | 195 (9.2%) |
| 55 to 59 Years | 62 (3.1%) | 173 (8.2%) |
| 60 to 64 Years | 258 (12.8%) | 147 (7.0%) |
| 65 to 69 Years | 137 (6.8%) | 219 (10.4%) |
| 70 to 74 Years | 101 (5.0%) | 74 (3.5%) |
| 75 to 79 Years | 57 (2.8%) | 45 (2.1%) |
| 80 to 84 Years | 32 (1.6%) | 27 (1.3%) |
| 85 Years and over | 37 (1.8%) | 180 (8.5%) |
| Total | 2,020 (100.0%) | 2,111 (100.0%) |
Families and Households in Bonsall
Median Family Size in Bonsall
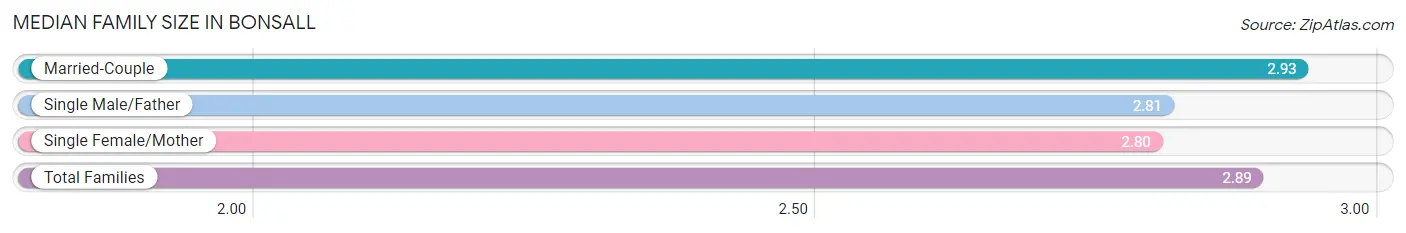
The median family size in Bonsall is 2.89 persons per family, with married-couple families (837 | 72.9%) accounting for the largest median family size of 2.93 persons per family. On the other hand, single female/mother families (231 | 20.1%) represent the smallest median family size with 2.80 persons per family.
| Family Type | # Families | Family Size |
| Married-Couple | 837 (72.9%) | 2.93 |
| Single Male/Father | 81 (7.0%) | 2.81 |
| Single Female/Mother | 231 (20.1%) | 2.80 |
| Total Families | 1,149 (100.0%) | 2.89 |
Median Household Size in Bonsall
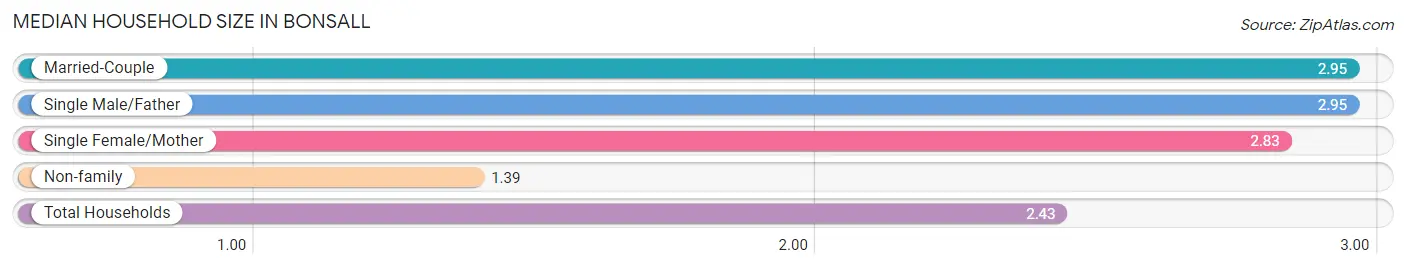
The median household size in Bonsall is 2.43 persons per household, with married-couple households (837 | 49.3%) accounting for the largest median household size of 2.95 persons per household. non-family households (549 | 32.3%) represent the smallest median household size with 1.39 persons per household.
| Household Type | # Households | Household Size |
| Married-Couple | 837 (49.3%) | 2.95 |
| Single Male/Father | 81 (4.8%) | 2.95 |
| Single Female/Mother | 231 (13.6%) | 2.83 |
| Non-family | 549 (32.3%) | 1.39 |
| Total Households | 1,698 (100.0%) | 2.43 |
Household Size by Marriage Status in Bonsall
Out of a total of 1,698 households in Bonsall, 1,149 (67.7%) are family households, while 549 (32.3%) are nonfamily households. The most numerous type of family households are 2-person households, comprising 595, and the most common type of nonfamily households are 1-person households, comprising 402.
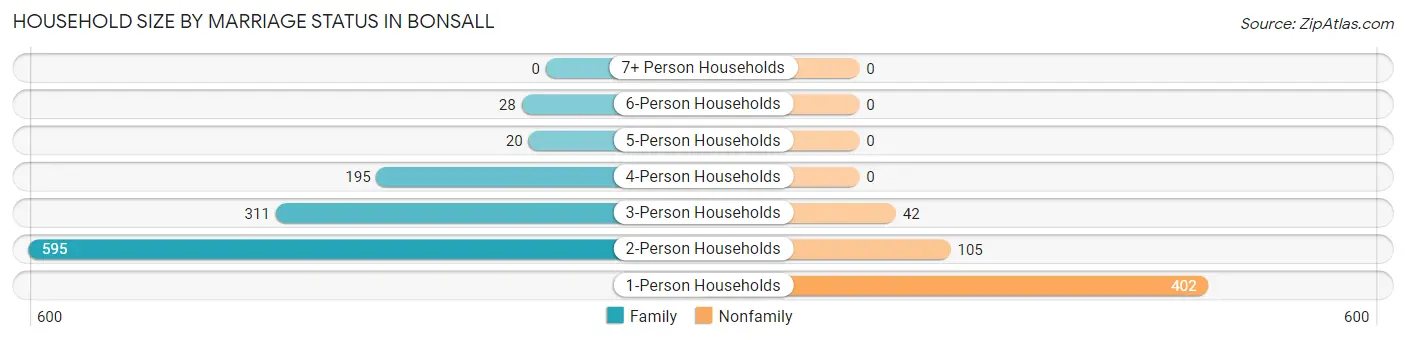
| Household Size | Family Households | Nonfamily Households |
| 1-Person Households | - | 402 (23.7%) |
| 2-Person Households | 595 (35.0%) | 105 (6.2%) |
| 3-Person Households | 311 (18.3%) | 42 (2.5%) |
| 4-Person Households | 195 (11.5%) | 0 (0.0%) |
| 5-Person Households | 20 (1.2%) | 0 (0.0%) |
| 6-Person Households | 28 (1.7%) | 0 (0.0%) |
| 7+ Person Households | 0 (0.0%) | 0 (0.0%) |
| Total | 1,149 (67.7%) | 549 (32.3%) |
Female Fertility in Bonsall
Fertility by Age in Bonsall
Average fertility rate in Bonsall is 46.0 births per 1,000 women. Women in the age bracket of 20 to 34 years have the highest fertility rate with 130.0 births per 1,000 women. Women in the age bracket of 20 to 34 years acount for 78.6% of all women with births.
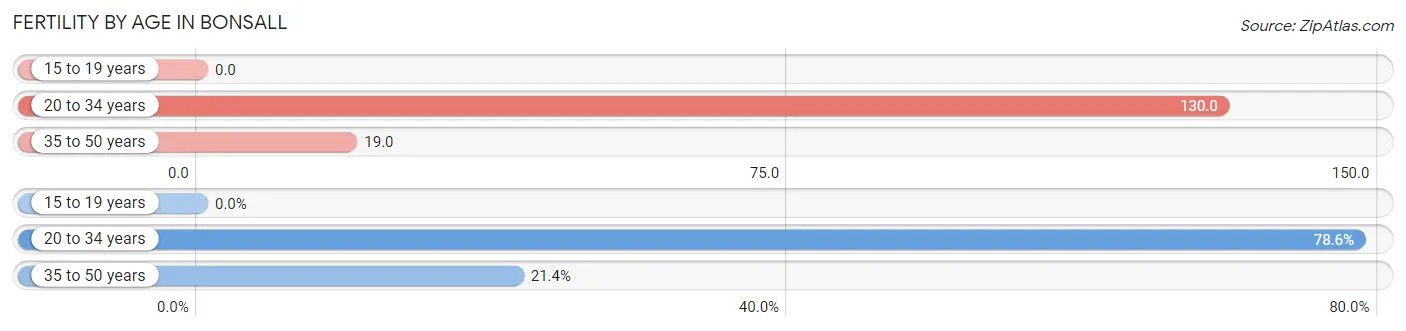
| Age Bracket | Women with Births | Births / 1,000 Women |
| 15 to 19 years | 0 (0.0%) | 0.0 |
| 20 to 34 years | 33 (78.6%) | 130.0 |
| 35 to 50 years | 9 (21.4%) | 19.0 |
| Total | 42 (100.0%) | 46.0 |
Fertility by Age by Marriage Status in Bonsall
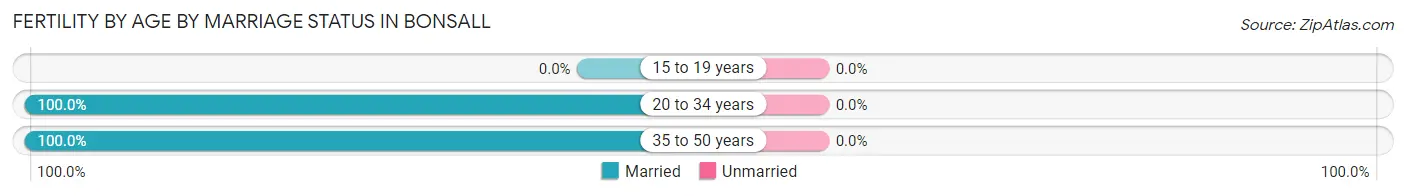
| Age Bracket | Married | Unmarried |
| 15 to 19 years | 0 (0.0%) | 0 (0.0%) |
| 20 to 34 years | 33 (100.0%) | 0 (0.0%) |
| 35 to 50 years | 9 (100.0%) | 0 (0.0%) |
| Total | 42 (100.0%) | 0 (0.0%) |
Fertility by Education in Bonsall
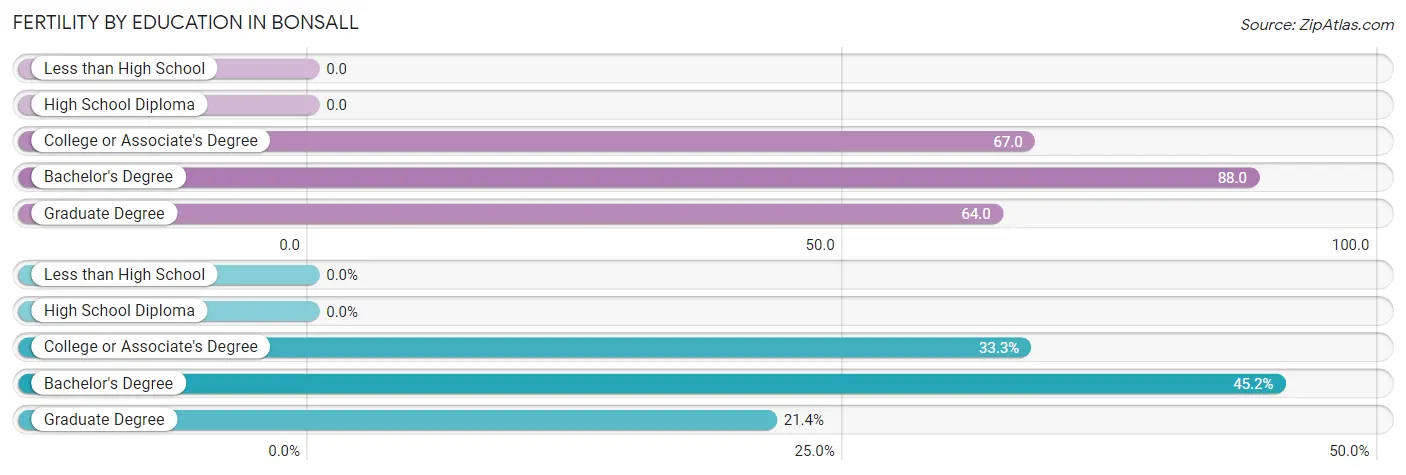
| Educational Attainment | Women with Births | Births / 1,000 Women |
| Less than High School | 0 (0.0%) | 0.0 |
| High School Diploma | 0 (0.0%) | 0.0 |
| College or Associate's Degree | 14 (33.3%) | 67.0 |
| Bachelor's Degree | 19 (45.2%) | 88.0 |
| Graduate Degree | 9 (21.4%) | 64.0 |
| Total | 42 (100.0%) | 46.0 |
Fertility by Education by Marriage Status in Bonsall
| Educational Attainment | Married | Unmarried |
| Less than High School | 0 (0.0%) | 0 (0.0%) |
| High School Diploma | 0 (0.0%) | 0 (0.0%) |
| College or Associate's Degree | 14 (100.0%) | 0 (0.0%) |
| Bachelor's Degree | 19 (100.0%) | 0 (0.0%) |
| Graduate Degree | 9 (100.0%) | 0 (0.0%) |
| Total | 42 (100.0%) | 0 (0.0%) |
Employment Characteristics in Bonsall
Employment by Class of Employer in Bonsall
Among the 1,798 employed individuals in Bonsall, private company employees (1,182 | 65.7%), self-employed (not incorporated) (180 | 10.0%), and local government employees (163 | 9.1%) make up the most common classes of employment.
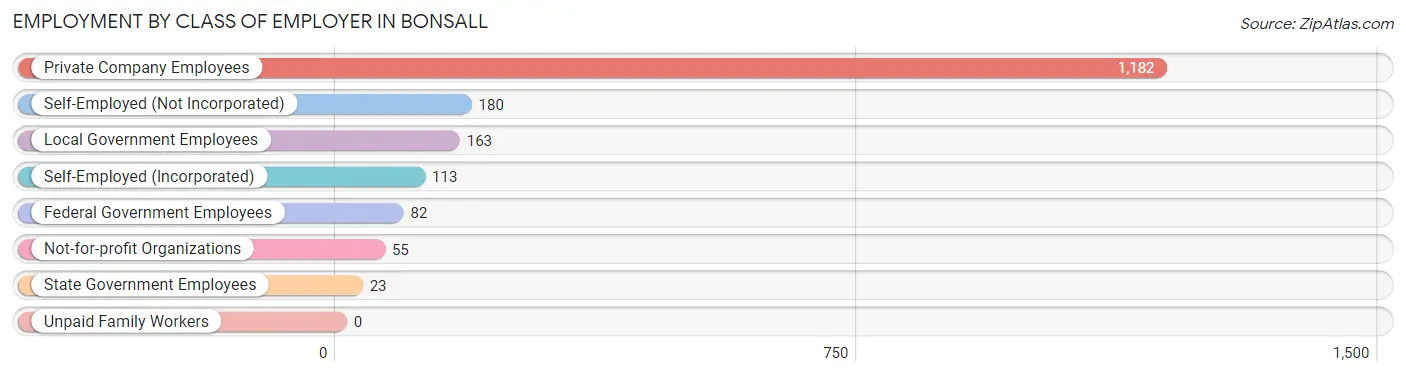
| Employer Class | # Employees | % Employees |
| Private Company Employees | 1,182 | 65.7% |
| Self-Employed (Incorporated) | 113 | 6.3% |
| Self-Employed (Not Incorporated) | 180 | 10.0% |
| Not-for-profit Organizations | 55 | 3.1% |
| Local Government Employees | 163 | 9.1% |
| State Government Employees | 23 | 1.3% |
| Federal Government Employees | 82 | 4.6% |
| Unpaid Family Workers | 0 | 0.0% |
| Total | 1,798 | 100.0% |
Employment Status by Age in Bonsall
According to the labor force statistics for Bonsall, out of the total population over 16 years of age (3,467), 57.8% or 2,004 individuals are in the labor force, with 8.7% or 174 of them unemployed. The age group with the highest labor force participation rate is 30 to 34 years, with 95.0% or 151 individuals in the labor force. Within the labor force, the 25 to 29 years age range has the highest percentage of unemployed individuals, with 51.9% or 40 of them being unemployed.
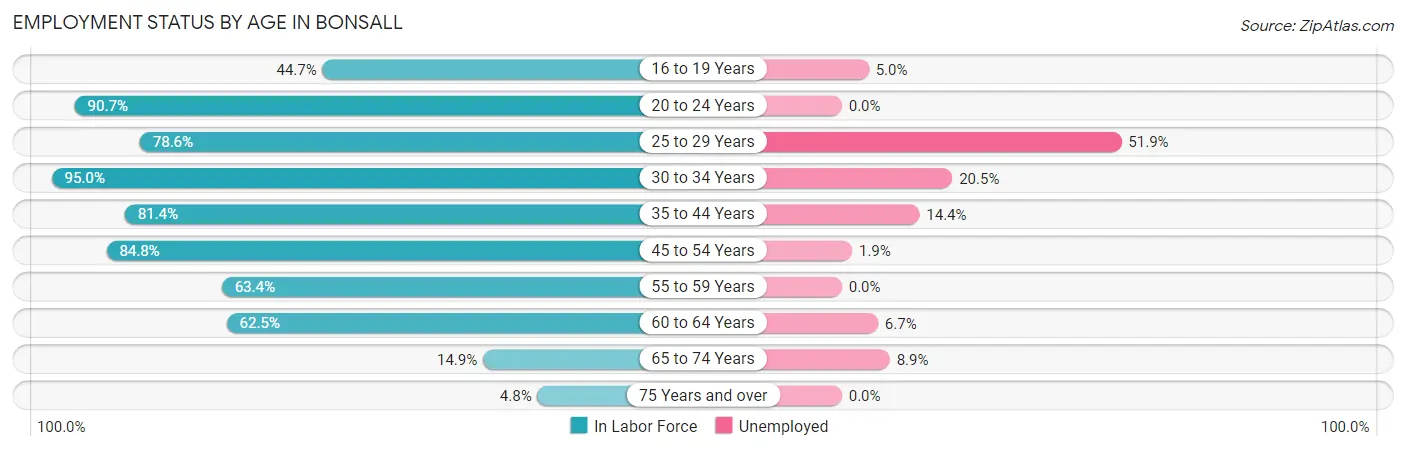
| Age Bracket | In Labor Force | Unemployed |
| 16 to 19 Years | 139 (44.7%) | 7 (5.0%) |
| 20 to 24 Years | 127 (90.7%) | 0 (0.0%) |
| 25 to 29 Years | 77 (78.6%) | 40 (51.9%) |
| 30 to 34 Years | 151 (95.0%) | 31 (20.5%) |
| 35 to 44 Years | 382 (81.4%) | 55 (14.4%) |
| 45 to 54 Years | 628 (84.8%) | 12 (1.9%) |
| 55 to 59 Years | 149 (63.4%) | 0 (0.0%) |
| 60 to 64 Years | 253 (62.5%) | 17 (6.7%) |
| 65 to 74 Years | 79 (14.9%) | 7 (8.9%) |
| 75 Years and over | 18 (4.8%) | 0 (0.0%) |
| Total | 2,004 (57.8%) | 174 (8.7%) |
Employment Status by Educational Attainment in Bonsall
According to labor force statistics for Bonsall, 77.8% of individuals (1,639) out of the total population between 25 and 64 years of age (2,107) are in the labor force, with 9.4% or 154 of them being unemployed. The group with the highest labor force participation rate are those with the educational attainment of college / associate degree, with 84.3% or 618 individuals in the labor force. Within the labor force, individuals with college / associate degree education have the highest percentage of unemployment, with 18.7% or 116 of them being unemployed.
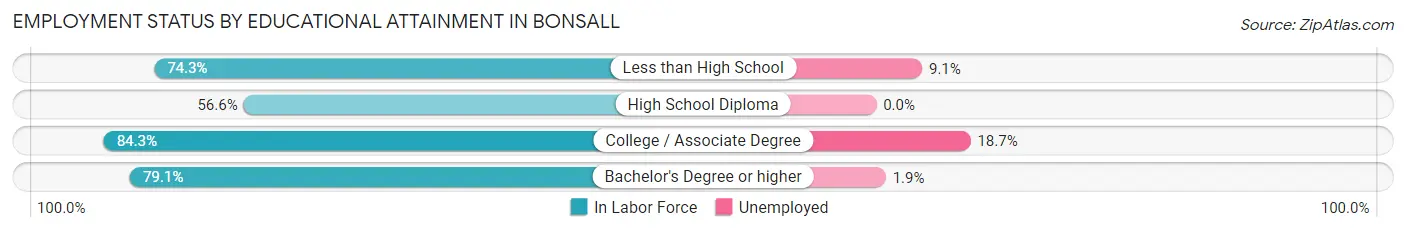
| Educational Attainment | In Labor Force | Unemployed |
| Less than High School | 318 (74.3%) | 39 (9.1%) |
| High School Diploma | 112 (56.6%) | 0 (0.0%) |
| College / Associate Degree | 618 (84.3%) | 137 (18.7%) |
| Bachelor's Degree or higher | 592 (79.1%) | 14 (1.9%) |
| Total | 1,639 (77.8%) | 198 (9.4%) |
Employment Occupations by Sex in Bonsall
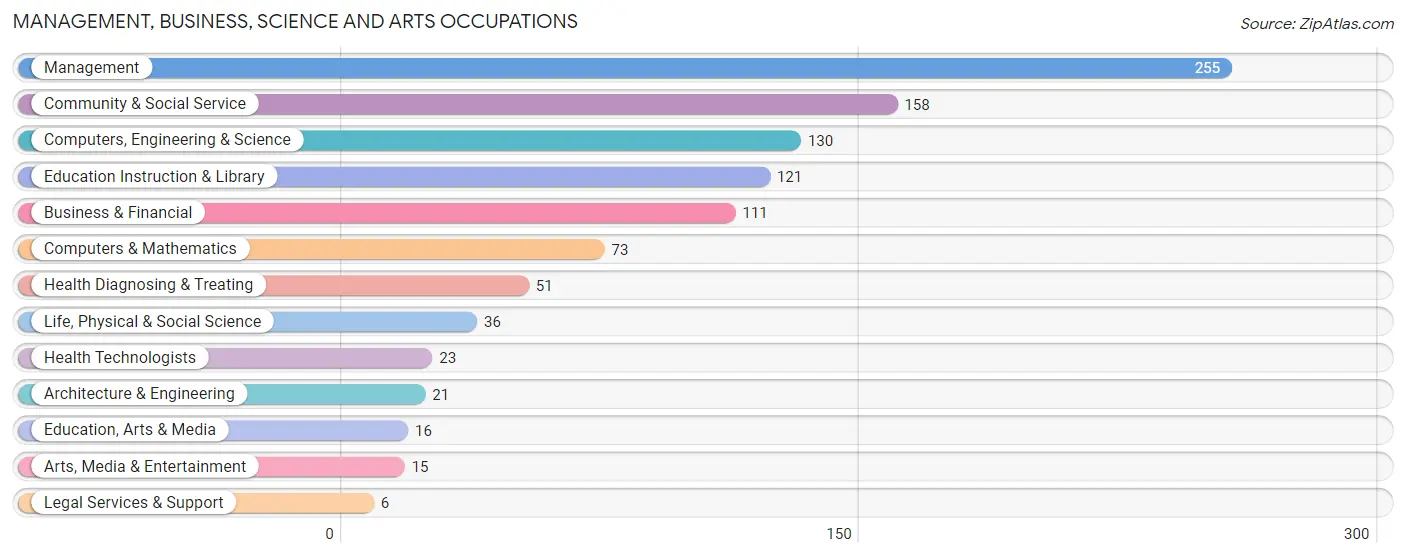
Management, Business, Science and Arts Occupations
The most common Management, Business, Science and Arts occupations in Bonsall are Management (255 | 14.4%), Community & Social Service (158 | 8.9%), Computers, Engineering & Science (130 | 7.3%), Education Instruction & Library (121 | 6.8%), and Business & Financial (111 | 6.3%).
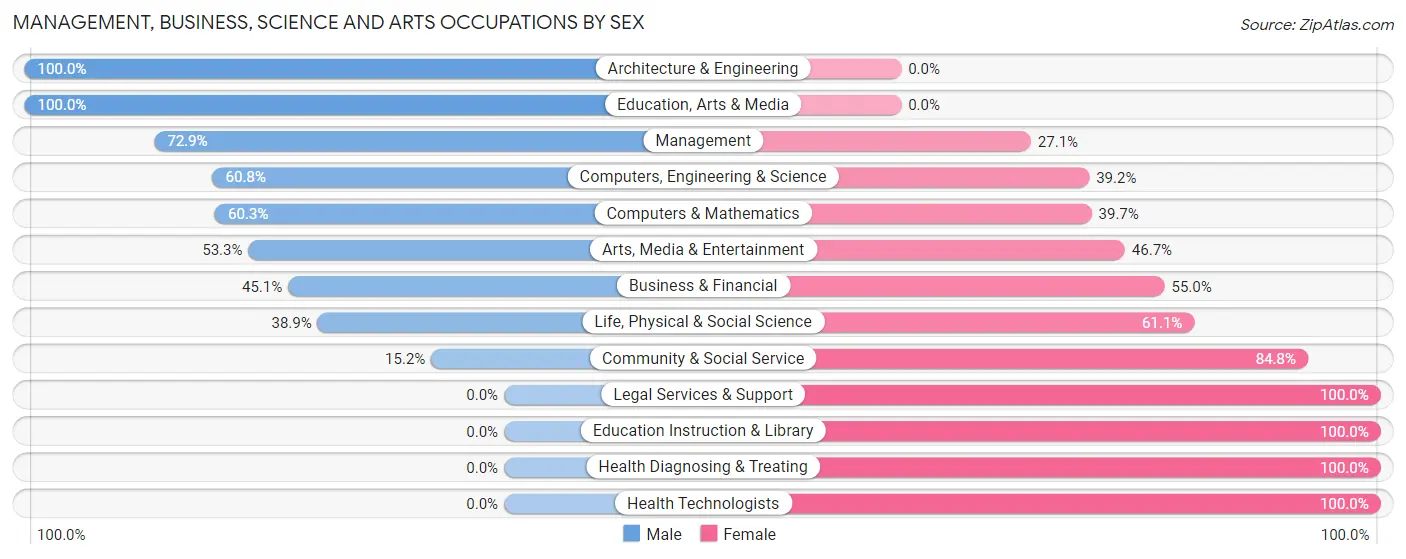
Management, Business, Science and Arts Occupations by Sex
Within the Management, Business, Science and Arts occupations in Bonsall, the most male-oriented occupations are Architecture & Engineering (100.0%), Education, Arts & Media (100.0%), and Management (72.9%), while the most female-oriented occupations are Legal Services & Support (100.0%), Education Instruction & Library (100.0%), and Health Diagnosing & Treating (100.0%).
| Occupation | Male | Female |
| Management | 186 (72.9%) | 69 (27.1%) |
| Business & Financial | 50 (45.1%) | 61 (54.9%) |
| Computers, Engineering & Science | 79 (60.8%) | 51 (39.2%) |
| Computers & Mathematics | 44 (60.3%) | 29 (39.7%) |
| Architecture & Engineering | 21 (100.0%) | 0 (0.0%) |
| Life, Physical & Social Science | 14 (38.9%) | 22 (61.1%) |
| Community & Social Service | 24 (15.2%) | 134 (84.8%) |
| Education, Arts & Media | 16 (100.0%) | 0 (0.0%) |
| Legal Services & Support | 0 (0.0%) | 6 (100.0%) |
| Education Instruction & Library | 0 (0.0%) | 121 (100.0%) |
| Arts, Media & Entertainment | 8 (53.3%) | 7 (46.7%) |
| Health Diagnosing & Treating | 0 (0.0%) | 51 (100.0%) |
| Health Technologists | 0 (0.0%) | 23 (100.0%) |
| Total (Category) | 339 (48.1%) | 366 (51.9%) |
| Total (Overall) | 986 (55.7%) | 785 (44.3%) |
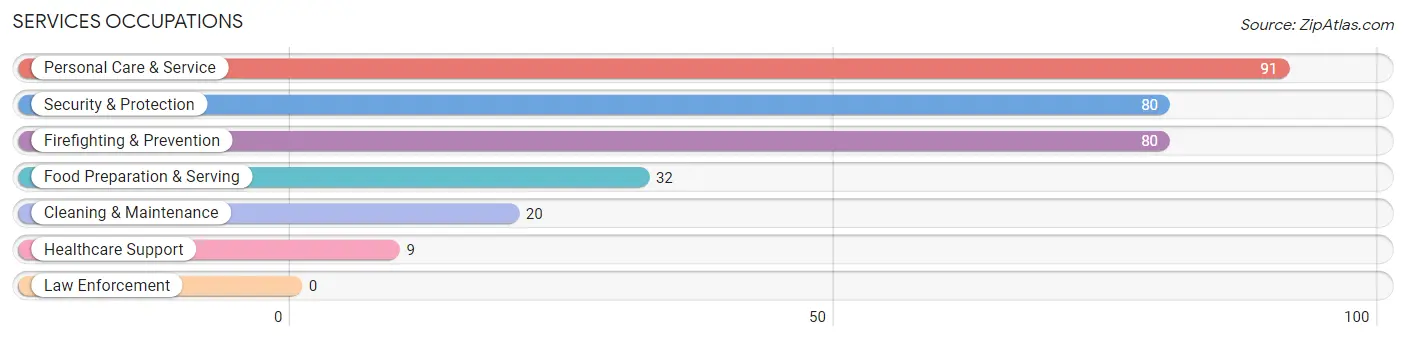
Services Occupations
The most common Services occupations in Bonsall are Personal Care & Service (91 | 5.1%), Security & Protection (80 | 4.5%), Firefighting & Prevention (80 | 4.5%), Food Preparation & Serving (32 | 1.8%), and Cleaning & Maintenance (20 | 1.1%).
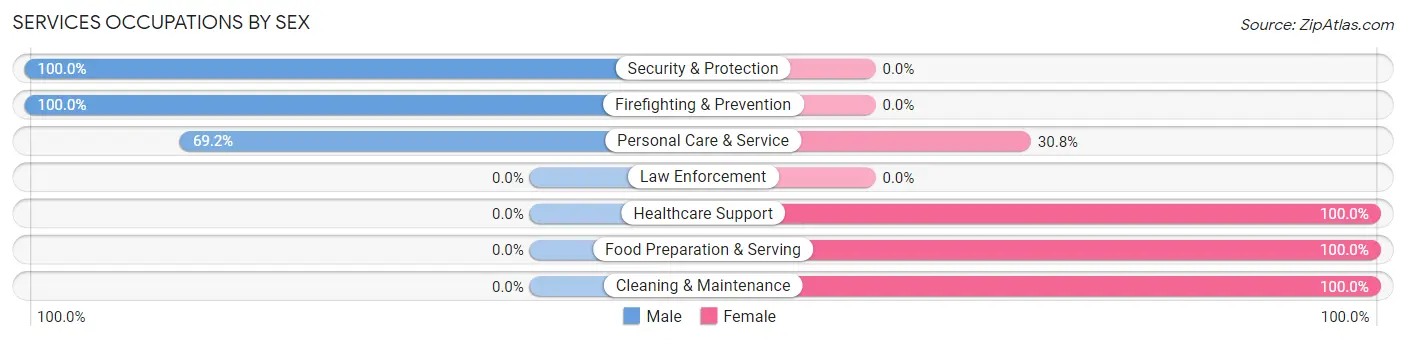
Services Occupations by Sex
Within the Services occupations in Bonsall, the most male-oriented occupations are Security & Protection (100.0%), Firefighting & Prevention (100.0%), and Personal Care & Service (69.2%), while the most female-oriented occupations are Healthcare Support (100.0%), Food Preparation & Serving (100.0%), and Cleaning & Maintenance (100.0%).
| Occupation | Male | Female |
| Healthcare Support | 0 (0.0%) | 9 (100.0%) |
| Security & Protection | 80 (100.0%) | 0 (0.0%) |
| Firefighting & Prevention | 80 (100.0%) | 0 (0.0%) |
| Law Enforcement | 0 (0.0%) | 0 (0.0%) |
| Food Preparation & Serving | 0 (0.0%) | 32 (100.0%) |
| Cleaning & Maintenance | 0 (0.0%) | 20 (100.0%) |
| Personal Care & Service | 63 (69.2%) | 28 (30.8%) |
| Total (Category) | 143 (61.6%) | 89 (38.4%) |
| Total (Overall) | 986 (55.7%) | 785 (44.3%) |
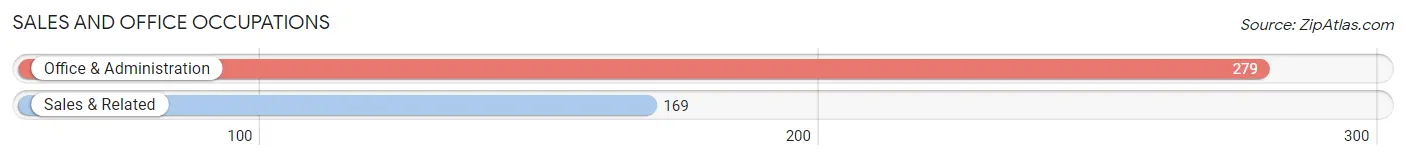
Sales and Office Occupations
The most common Sales and Office occupations in Bonsall are Office & Administration (279 | 15.8%), and Sales & Related (169 | 9.5%).
Sales and Office Occupations by Sex
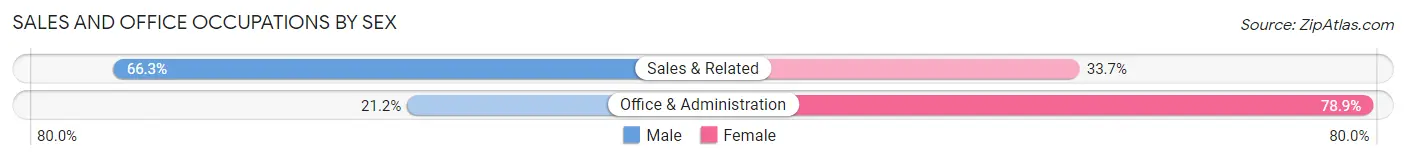
| Occupation | Male | Female |
| Sales & Related | 112 (66.3%) | 57 (33.7%) |
| Office & Administration | 59 (21.1%) | 220 (78.8%) |
| Total (Category) | 171 (38.2%) | 277 (61.8%) |
| Total (Overall) | 986 (55.7%) | 785 (44.3%) |
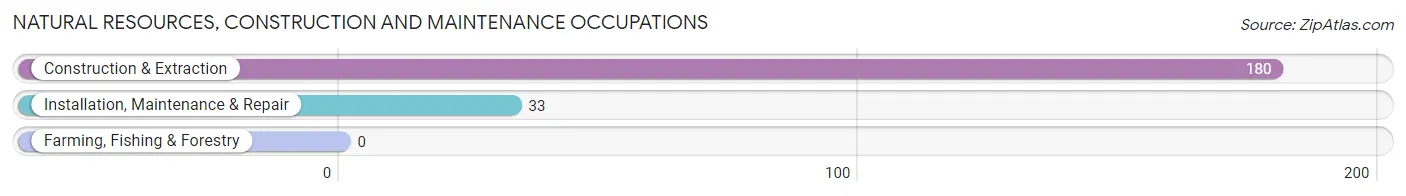
Natural Resources, Construction and Maintenance Occupations
The most common Natural Resources, Construction and Maintenance occupations in Bonsall are Construction & Extraction (180 | 10.2%), and Installation, Maintenance & Repair (33 | 1.9%).
Natural Resources, Construction and Maintenance Occupations by Sex
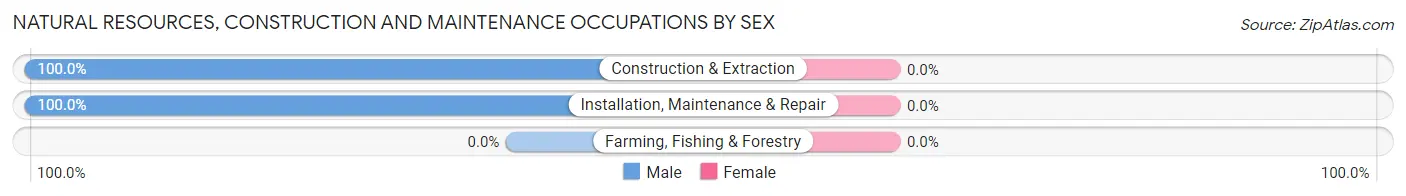
| Occupation | Male | Female |
| Farming, Fishing & Forestry | 0 (0.0%) | 0 (0.0%) |
| Construction & Extraction | 180 (100.0%) | 0 (0.0%) |
| Installation, Maintenance & Repair | 33 (100.0%) | 0 (0.0%) |
| Total (Category) | 213 (100.0%) | 0 (0.0%) |
| Total (Overall) | 986 (55.7%) | 785 (44.3%) |
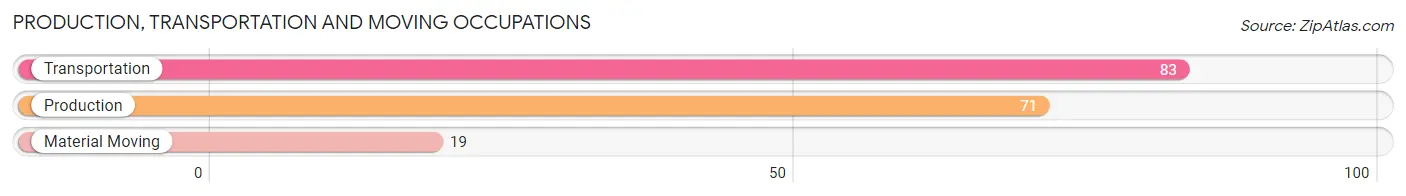
Production, Transportation and Moving Occupations
The most common Production, Transportation and Moving occupations in Bonsall are Transportation (83 | 4.7%), Production (71 | 4.0%), and Material Moving (19 | 1.1%).
Production, Transportation and Moving Occupations by Sex
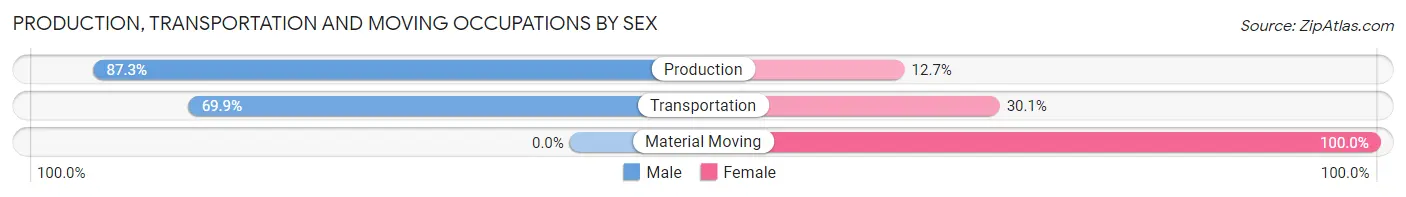
| Occupation | Male | Female |
| Production | 62 (87.3%) | 9 (12.7%) |
| Transportation | 58 (69.9%) | 25 (30.1%) |
| Material Moving | 0 (0.0%) | 19 (100.0%) |
| Total (Category) | 120 (69.4%) | 53 (30.6%) |
| Total (Overall) | 986 (55.7%) | 785 (44.3%) |
Employment Industries by Sex in Bonsall
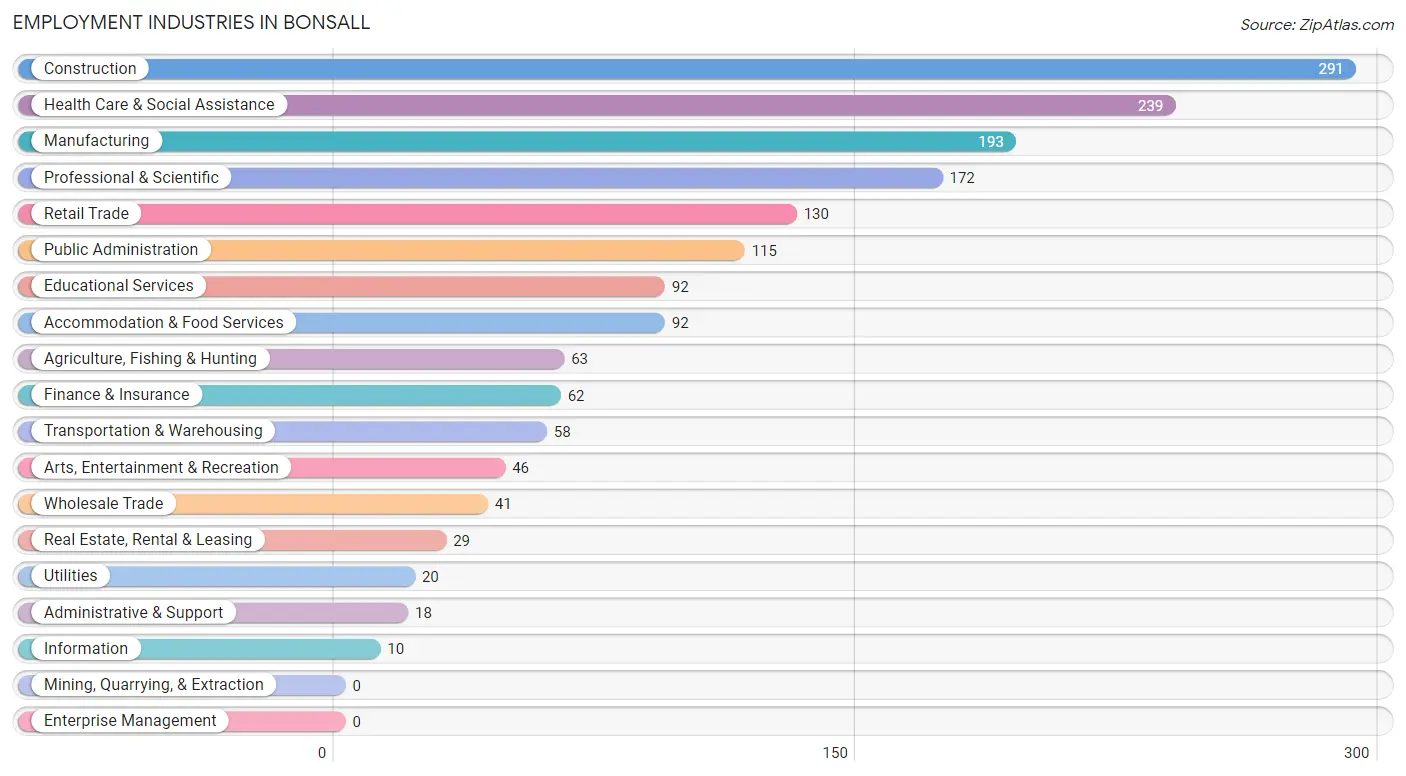
Employment Industries in Bonsall
The major employment industries in Bonsall include Construction (291 | 16.4%), Health Care & Social Assistance (239 | 13.5%), Manufacturing (193 | 10.9%), Professional & Scientific (172 | 9.7%), and Retail Trade (130 | 7.3%).
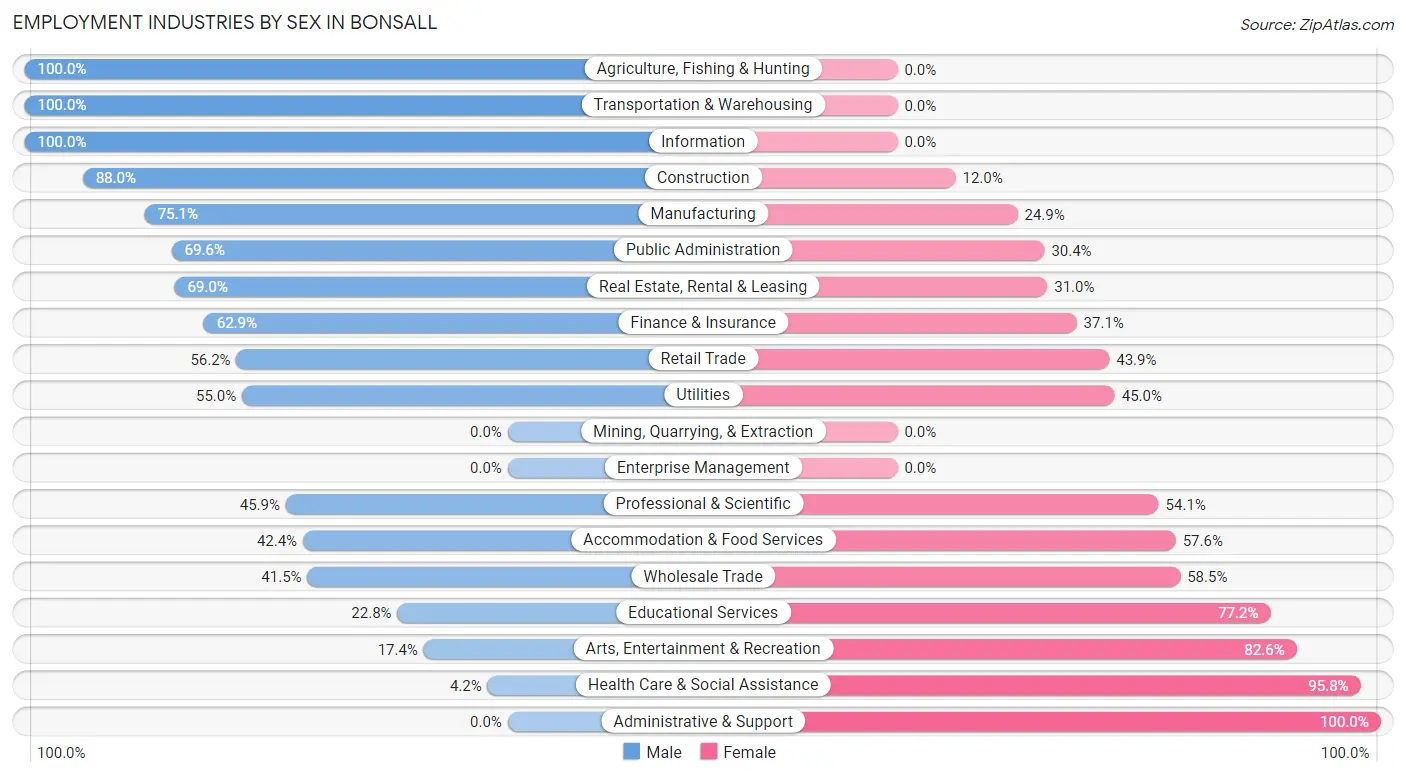
Employment Industries by Sex in Bonsall
The Bonsall industries that see more men than women are Agriculture, Fishing & Hunting (100.0%), Transportation & Warehousing (100.0%), and Information (100.0%), whereas the industries that tend to have a higher number of women are Administrative & Support (100.0%), Health Care & Social Assistance (95.8%), and Arts, Entertainment & Recreation (82.6%).
| Industry | Male | Female |
| Agriculture, Fishing & Hunting | 63 (100.0%) | 0 (0.0%) |
| Mining, Quarrying, & Extraction | 0 (0.0%) | 0 (0.0%) |
| Construction | 256 (88.0%) | 35 (12.0%) |
| Manufacturing | 145 (75.1%) | 48 (24.9%) |
| Wholesale Trade | 17 (41.5%) | 24 (58.5%) |
| Retail Trade | 73 (56.1%) | 57 (43.9%) |
| Transportation & Warehousing | 58 (100.0%) | 0 (0.0%) |
| Utilities | 11 (55.0%) | 9 (45.0%) |
| Information | 10 (100.0%) | 0 (0.0%) |
| Finance & Insurance | 39 (62.9%) | 23 (37.1%) |
| Real Estate, Rental & Leasing | 20 (69.0%) | 9 (31.0%) |
| Professional & Scientific | 79 (45.9%) | 93 (54.1%) |
| Enterprise Management | 0 (0.0%) | 0 (0.0%) |
| Administrative & Support | 0 (0.0%) | 18 (100.0%) |
| Educational Services | 21 (22.8%) | 71 (77.2%) |
| Health Care & Social Assistance | 10 (4.2%) | 229 (95.8%) |
| Arts, Entertainment & Recreation | 8 (17.4%) | 38 (82.6%) |
| Accommodation & Food Services | 39 (42.4%) | 53 (57.6%) |
| Public Administration | 80 (69.6%) | 35 (30.4%) |
| Total | 986 (55.7%) | 785 (44.3%) |
Education in Bonsall
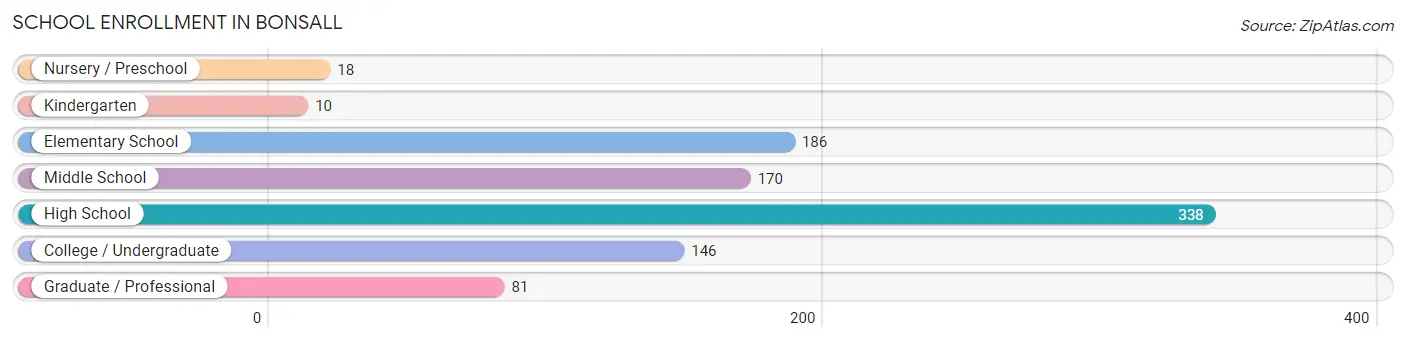
School Enrollment in Bonsall
The most common levels of schooling among the 949 students in Bonsall are high school (338 | 35.6%), elementary school (186 | 19.6%), and middle school (170 | 17.9%).
| School Level | # Students | % Students |
| Nursery / Preschool | 18 | 1.9% |
| Kindergarten | 10 | 1.1% |
| Elementary School | 186 | 19.6% |
| Middle School | 170 | 17.9% |
| High School | 338 | 35.6% |
| College / Undergraduate | 146 | 15.4% |
| Graduate / Professional | 81 | 8.5% |
| Total | 949 | 100.0% |
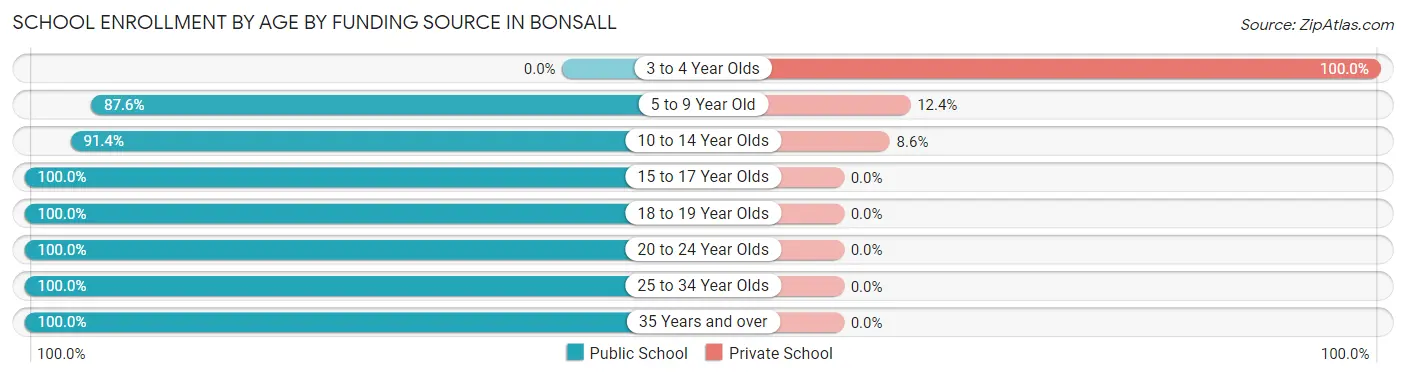
School Enrollment by Age by Funding Source in Bonsall
Out of a total of 949 students who are enrolled in schools in Bonsall, 53 (5.6%) attend a private institution, while the remaining 896 (94.4%) are enrolled in public schools. The age group of 3 to 4 year olds has the highest likelihood of being enrolled in private schools, with 10 (100.0% in the age bracket) enrolled. Conversely, the age group of 15 to 17 year olds has the lowest likelihood of being enrolled in a private school, with 229 (100.0% in the age bracket) attending a public institution.
| Age Bracket | Public School | Private School |
| 3 to 4 Year Olds | 0 (0.0%) | 10 (100.0%) |
| 5 to 9 Year Old | 198 (87.6%) | 28 (12.4%) |
| 10 to 14 Year Olds | 160 (91.4%) | 15 (8.6%) |
| 15 to 17 Year Olds | 229 (100.0%) | 0 (0.0%) |
| 18 to 19 Year Olds | 130 (100.0%) | 0 (0.0%) |
| 20 to 24 Year Olds | 78 (100.0%) | 0 (0.0%) |
| 25 to 34 Year Olds | 29 (100.0%) | 0 (0.0%) |
| 35 Years and over | 72 (100.0%) | 0 (0.0%) |
| Total | 896 (94.4%) | 53 (5.6%) |
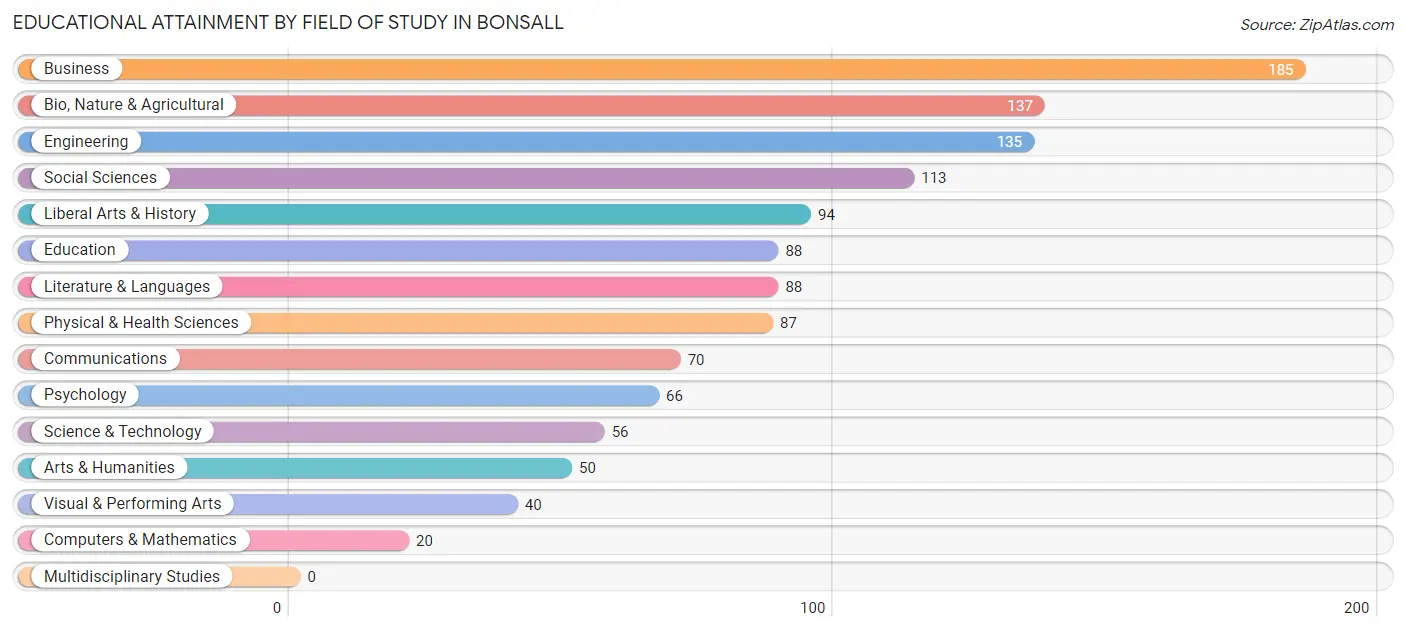
Educational Attainment by Field of Study in Bonsall
Business (185 | 15.0%), bio, nature & agricultural (137 | 11.2%), engineering (135 | 11.0%), social sciences (113 | 9.2%), and liberal arts & history (94 | 7.6%) are the most common fields of study among 1,229 individuals in Bonsall who have obtained a bachelor's degree or higher.
| Field of Study | # Graduates | % Graduates |
| Computers & Mathematics | 20 | 1.6% |
| Bio, Nature & Agricultural | 137 | 11.2% |
| Physical & Health Sciences | 87 | 7.1% |
| Psychology | 66 | 5.4% |
| Social Sciences | 113 | 9.2% |
| Engineering | 135 | 11.0% |
| Multidisciplinary Studies | 0 | 0.0% |
| Science & Technology | 56 | 4.6% |
| Business | 185 | 15.0% |
| Education | 88 | 7.2% |
| Literature & Languages | 88 | 7.2% |
| Liberal Arts & History | 94 | 7.6% |
| Visual & Performing Arts | 40 | 3.3% |
| Communications | 70 | 5.7% |
| Arts & Humanities | 50 | 4.1% |
| Total | 1,229 | 100.0% |
Transportation & Commute in Bonsall
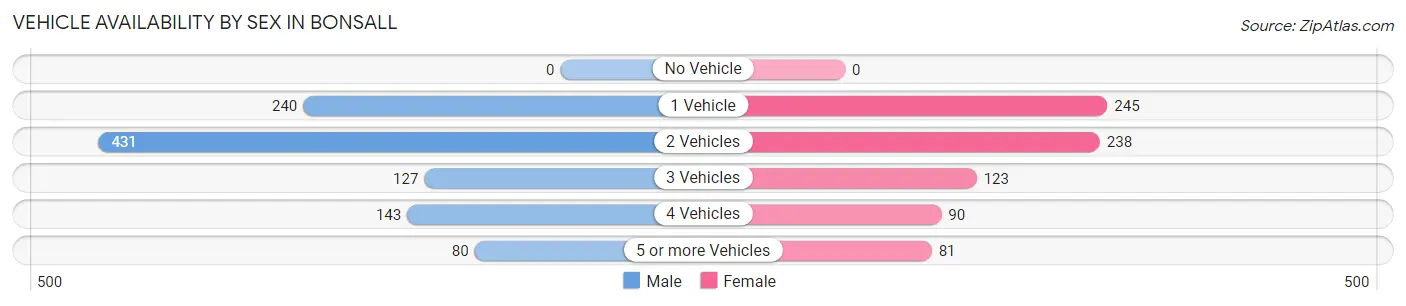
Vehicle Availability by Sex in Bonsall
The most prevalent vehicle ownership categories in Bonsall are males with 2 vehicles (431, accounting for 42.2%) and females with 2 vehicles (238, making up 55.5%).
| Vehicles Available | Male | Female |
| No Vehicle | 0 (0.0%) | 0 (0.0%) |
| 1 Vehicle | 240 (23.5%) | 245 (31.5%) |
| 2 Vehicles | 431 (42.2%) | 238 (30.6%) |
| 3 Vehicles | 127 (12.4%) | 123 (15.8%) |
| 4 Vehicles | 143 (14.0%) | 90 (11.6%) |
| 5 or more Vehicles | 80 (7.8%) | 81 (10.4%) |
| Total | 1,021 (100.0%) | 777 (100.0%) |
Commute Time in Bonsall
The most frequently occuring commute durations in Bonsall are 30 to 34 minutes (357 commuters, 23.7%), 45 to 59 minutes (213 commuters, 14.1%), and 20 to 24 minutes (199 commuters, 13.2%).
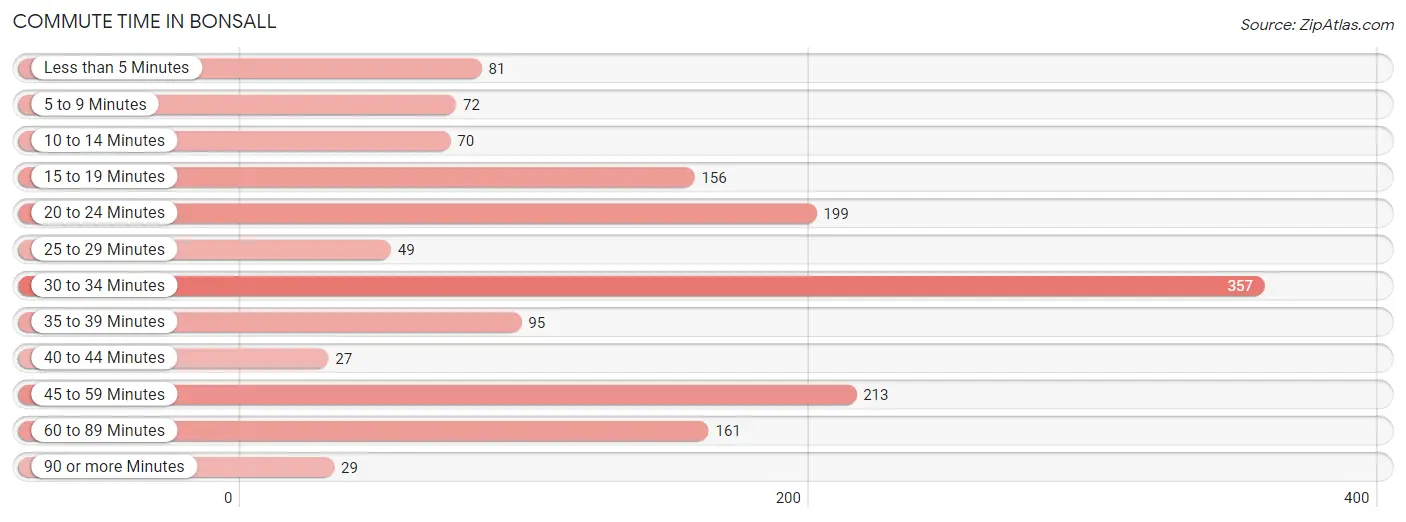
| Commute Time | # Commuters | % Commuters |
| Less than 5 Minutes | 81 | 5.4% |
| 5 to 9 Minutes | 72 | 4.8% |
| 10 to 14 Minutes | 70 | 4.6% |
| 15 to 19 Minutes | 156 | 10.3% |
| 20 to 24 Minutes | 199 | 13.2% |
| 25 to 29 Minutes | 49 | 3.3% |
| 30 to 34 Minutes | 357 | 23.7% |
| 35 to 39 Minutes | 95 | 6.3% |
| 40 to 44 Minutes | 27 | 1.8% |
| 45 to 59 Minutes | 213 | 14.1% |
| 60 to 89 Minutes | 161 | 10.7% |
| 90 or more Minutes | 29 | 1.9% |
Commute Time by Sex in Bonsall
The most common commute times in Bonsall are 30 to 34 minutes (195 commuters, 22.3%) for males and 30 to 34 minutes (162 commuters, 25.6%) for females.
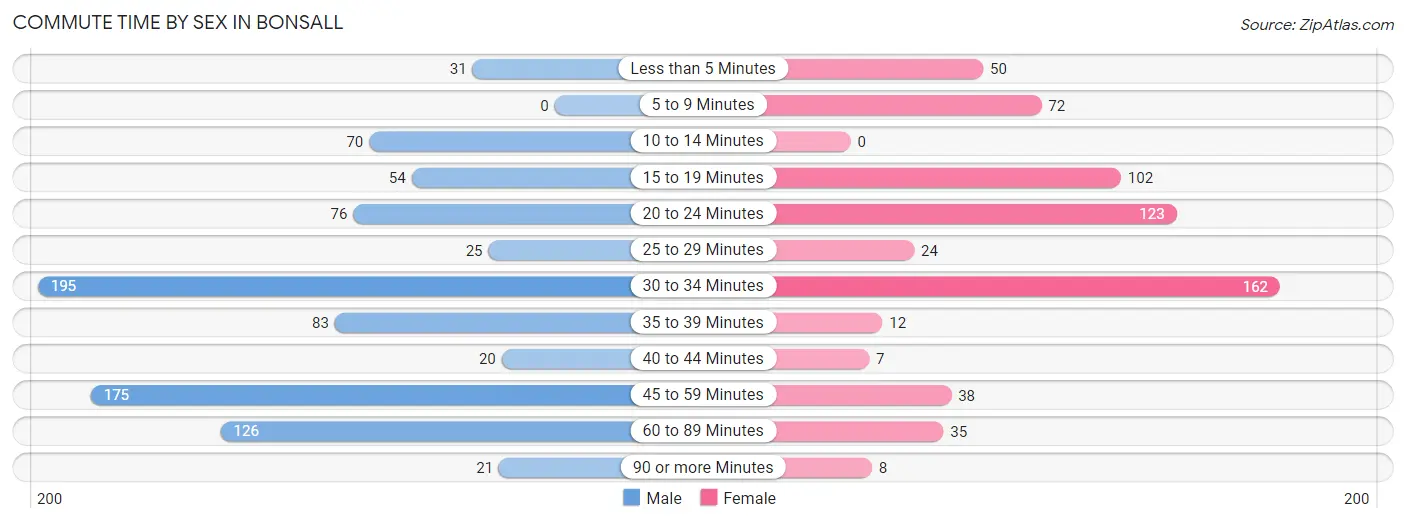
| Commute Time | Male | Female |
| Less than 5 Minutes | 31 (3.5%) | 50 (7.9%) |
| 5 to 9 Minutes | 0 (0.0%) | 72 (11.4%) |
| 10 to 14 Minutes | 70 (8.0%) | 0 (0.0%) |
| 15 to 19 Minutes | 54 (6.2%) | 102 (16.1%) |
| 20 to 24 Minutes | 76 (8.7%) | 123 (19.4%) |
| 25 to 29 Minutes | 25 (2.9%) | 24 (3.8%) |
| 30 to 34 Minutes | 195 (22.3%) | 162 (25.6%) |
| 35 to 39 Minutes | 83 (9.5%) | 12 (1.9%) |
| 40 to 44 Minutes | 20 (2.3%) | 7 (1.1%) |
| 45 to 59 Minutes | 175 (20.0%) | 38 (6.0%) |
| 60 to 89 Minutes | 126 (14.4%) | 35 (5.5%) |
| 90 or more Minutes | 21 (2.4%) | 8 (1.3%) |
Time of Departure to Work by Sex in Bonsall
The most frequent times of departure to work in Bonsall are 12:00 AM to 4:59 AM (145, 16.6%) for males and 9:00 AM to 9:59 AM (156, 24.6%) for females.
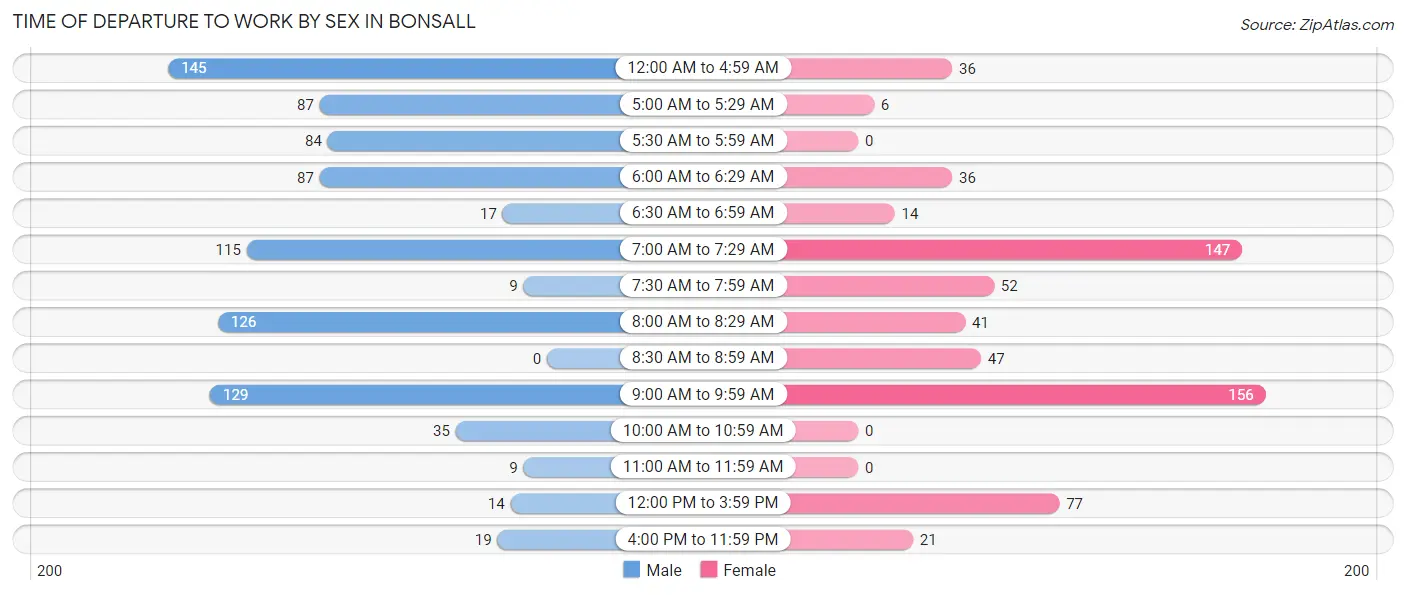
| Time of Departure | Male | Female |
| 12:00 AM to 4:59 AM | 145 (16.6%) | 36 (5.7%) |
| 5:00 AM to 5:29 AM | 87 (9.9%) | 6 (0.9%) |
| 5:30 AM to 5:59 AM | 84 (9.6%) | 0 (0.0%) |
| 6:00 AM to 6:29 AM | 87 (9.9%) | 36 (5.7%) |
| 6:30 AM to 6:59 AM | 17 (1.9%) | 14 (2.2%) |
| 7:00 AM to 7:29 AM | 115 (13.1%) | 147 (23.2%) |
| 7:30 AM to 7:59 AM | 9 (1.0%) | 52 (8.2%) |
| 8:00 AM to 8:29 AM | 126 (14.4%) | 41 (6.5%) |
| 8:30 AM to 8:59 AM | 0 (0.0%) | 47 (7.4%) |
| 9:00 AM to 9:59 AM | 129 (14.7%) | 156 (24.6%) |
| 10:00 AM to 10:59 AM | 35 (4.0%) | 0 (0.0%) |
| 11:00 AM to 11:59 AM | 9 (1.0%) | 0 (0.0%) |
| 12:00 PM to 3:59 PM | 14 (1.6%) | 77 (12.2%) |
| 4:00 PM to 11:59 PM | 19 (2.2%) | 21 (3.3%) |
| Total | 876 (100.0%) | 633 (100.0%) |
Housing Occupancy in Bonsall
Occupancy by Ownership in Bonsall
Of the total 1,698 dwellings in Bonsall, owner-occupied units account for 1,084 (63.8%), while renter-occupied units make up 614 (36.2%).
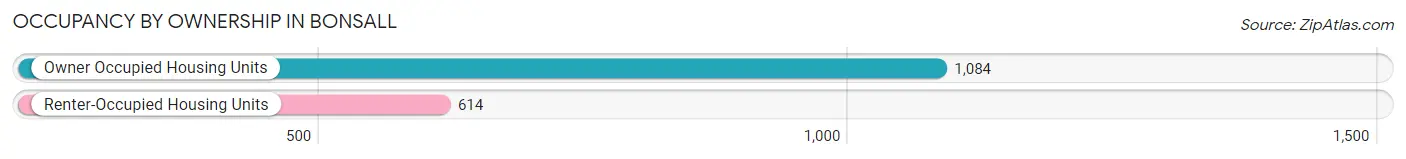
| Occupancy | # Housing Units | % Housing Units |
| Owner Occupied Housing Units | 1,084 | 63.8% |
| Renter-Occupied Housing Units | 614 | 36.2% |
| Total Occupied Housing Units | 1,698 | 100.0% |
Occupancy by Household Size in Bonsall
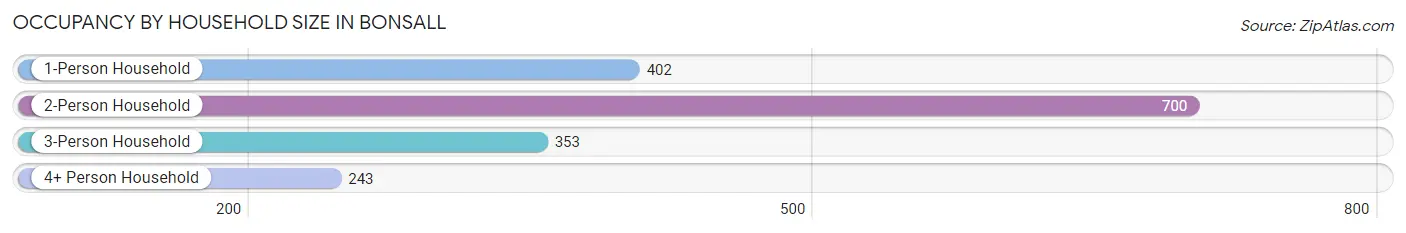
| Household Size | # Housing Units | % Housing Units |
| 1-Person Household | 402 | 23.7% |
| 2-Person Household | 700 | 41.2% |
| 3-Person Household | 353 | 20.8% |
| 4+ Person Household | 243 | 14.3% |
| Total Housing Units | 1,698 | 100.0% |
Occupancy by Ownership by Household Size in Bonsall
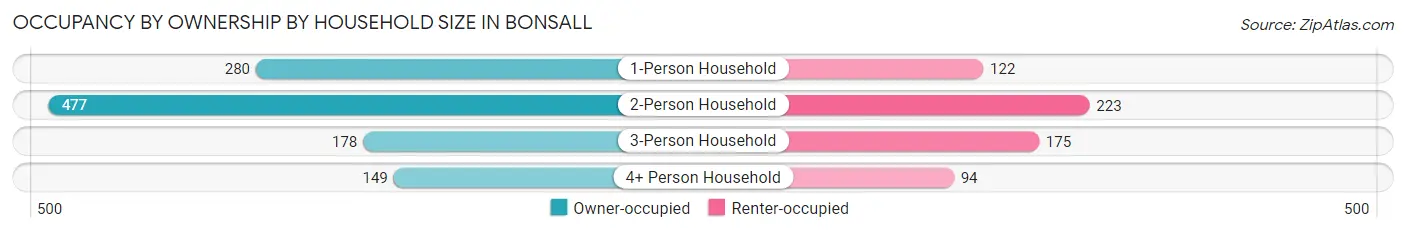
| Household Size | Owner-occupied | Renter-occupied |
| 1-Person Household | 280 (69.7%) | 122 (30.3%) |
| 2-Person Household | 477 (68.1%) | 223 (31.9%) |
| 3-Person Household | 178 (50.4%) | 175 (49.6%) |
| 4+ Person Household | 149 (61.3%) | 94 (38.7%) |
| Total Housing Units | 1,084 (63.8%) | 614 (36.2%) |
Occupancy by Educational Attainment in Bonsall
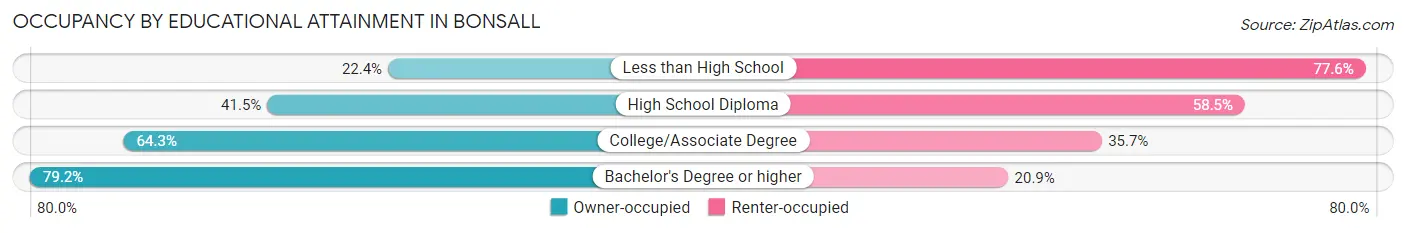
| Household Size | Owner-occupied | Renter-occupied |
| Less than High School | 51 (22.4%) | 177 (77.6%) |
| High School Diploma | 49 (41.5%) | 69 (58.5%) |
| College/Associate Degree | 373 (64.3%) | 207 (35.7%) |
| Bachelor's Degree or higher | 611 (79.1%) | 161 (20.8%) |
Occupancy by Age of Householder in Bonsall
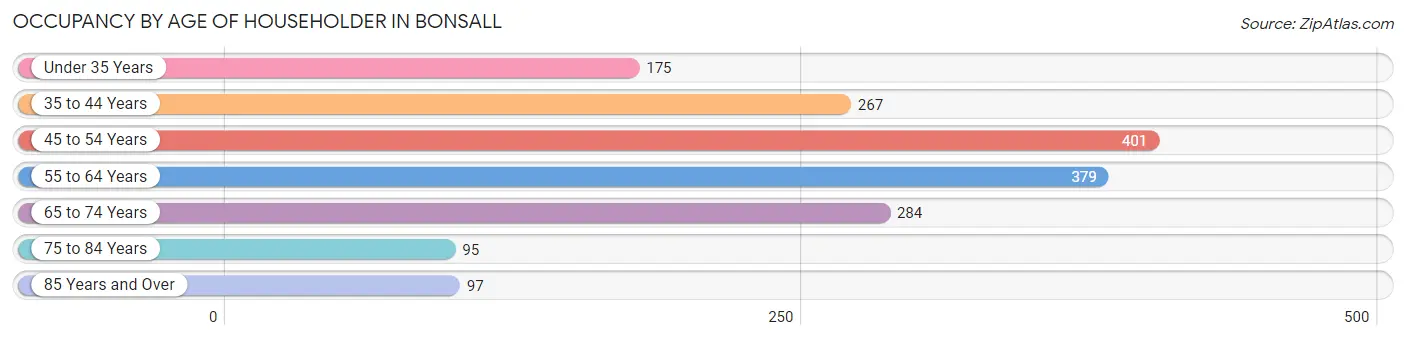
| Age Bracket | # Households | % Households |
| Under 35 Years | 175 | 10.3% |
| 35 to 44 Years | 267 | 15.7% |
| 45 to 54 Years | 401 | 23.6% |
| 55 to 64 Years | 379 | 22.3% |
| 65 to 74 Years | 284 | 16.7% |
| 75 to 84 Years | 95 | 5.6% |
| 85 Years and Over | 97 | 5.7% |
| Total | 1,698 | 100.0% |
Housing Finances in Bonsall
Median Income by Occupancy in Bonsall
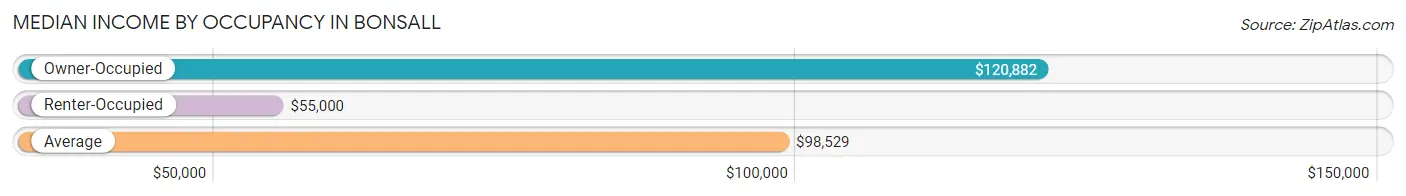
| Occupancy Type | # Households | Median Income |
| Owner-Occupied | 1,084 (63.8%) | $120,882 |
| Renter-Occupied | 614 (36.2%) | $55,000 |
| Average | 1,698 (100.0%) | $98,529 |
Occupancy by Householder Income Bracket in Bonsall
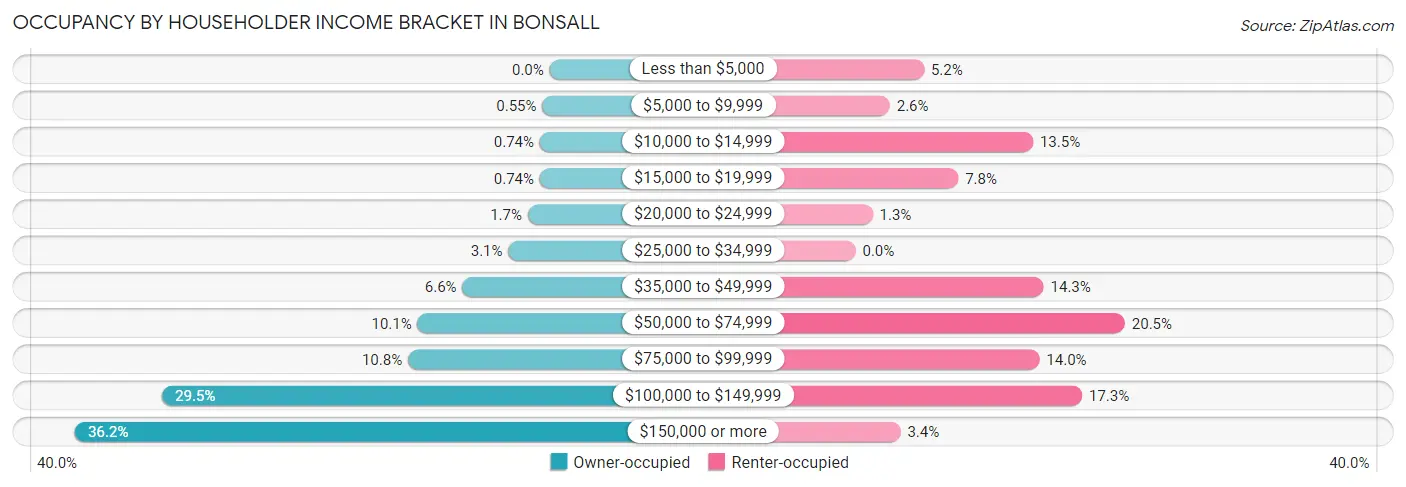
| Income Bracket | Owner-occupied | Renter-occupied |
| Less than $5,000 | 0 (0.0%) | 32 (5.2%) |
| $5,000 to $9,999 | 6 (0.5%) | 16 (2.6%) |
| $10,000 to $14,999 | 8 (0.7%) | 83 (13.5%) |
| $15,000 to $19,999 | 8 (0.7%) | 48 (7.8%) |
| $20,000 to $24,999 | 18 (1.7%) | 8 (1.3%) |
| $25,000 to $34,999 | 34 (3.1%) | 0 (0.0%) |
| $35,000 to $49,999 | 72 (6.6%) | 88 (14.3%) |
| $50,000 to $74,999 | 109 (10.1%) | 126 (20.5%) |
| $75,000 to $99,999 | 117 (10.8%) | 86 (14.0%) |
| $100,000 to $149,999 | 320 (29.5%) | 106 (17.3%) |
| $150,000 or more | 392 (36.2%) | 21 (3.4%) |
| Total | 1,084 (100.0%) | 614 (100.0%) |
Monthly Housing Cost Tiers in Bonsall
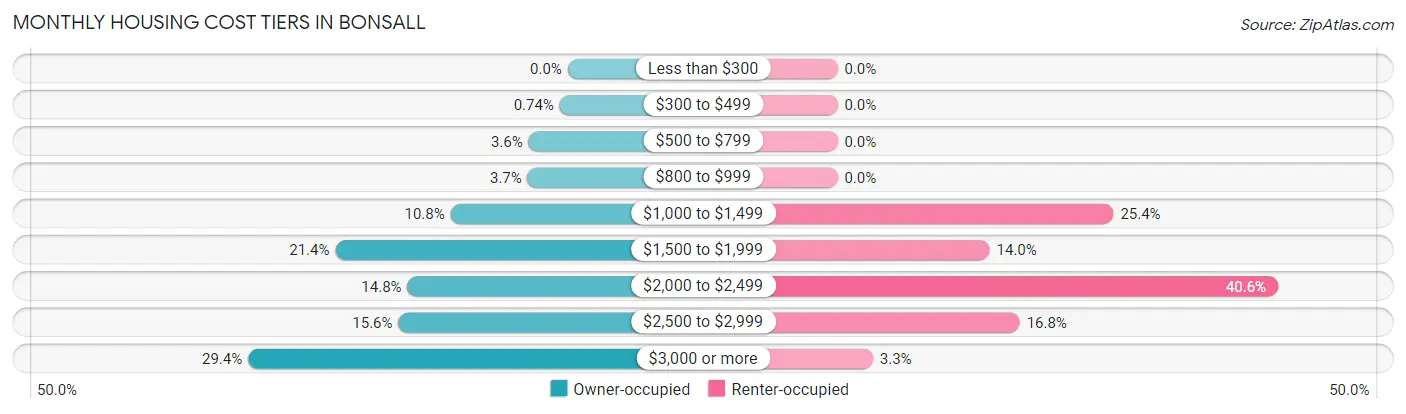
| Monthly Cost | Owner-occupied | Renter-occupied |
| Less than $300 | 0 (0.0%) | 0 (0.0%) |
| $300 to $499 | 8 (0.7%) | 0 (0.0%) |
| $500 to $799 | 39 (3.6%) | 0 (0.0%) |
| $800 to $999 | 40 (3.7%) | 0 (0.0%) |
| $1,000 to $1,499 | 117 (10.8%) | 156 (25.4%) |
| $1,500 to $1,999 | 232 (21.4%) | 86 (14.0%) |
| $2,000 to $2,499 | 160 (14.8%) | 249 (40.6%) |
| $2,500 to $2,999 | 169 (15.6%) | 103 (16.8%) |
| $3,000 or more | 319 (29.4%) | 20 (3.3%) |
| Total | 1,084 (100.0%) | 614 (100.0%) |
Physical Housing Characteristics in Bonsall
Housing Structures in Bonsall
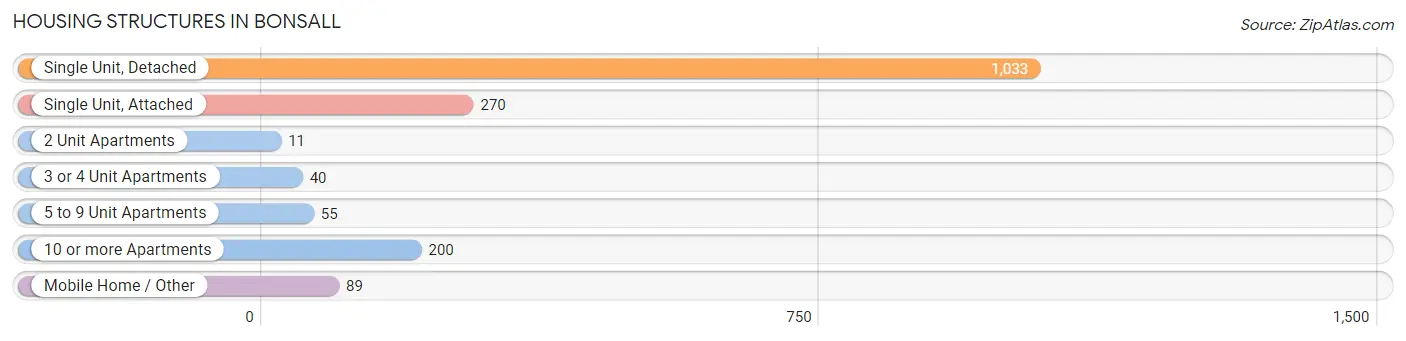
| Structure Type | # Housing Units | % Housing Units |
| Single Unit, Detached | 1,033 | 60.8% |
| Single Unit, Attached | 270 | 15.9% |
| 2 Unit Apartments | 11 | 0.6% |
| 3 or 4 Unit Apartments | 40 | 2.4% |
| 5 to 9 Unit Apartments | 55 | 3.2% |
| 10 or more Apartments | 200 | 11.8% |
| Mobile Home / Other | 89 | 5.2% |
| Total | 1,698 | 100.0% |
Housing Structures by Occupancy in Bonsall
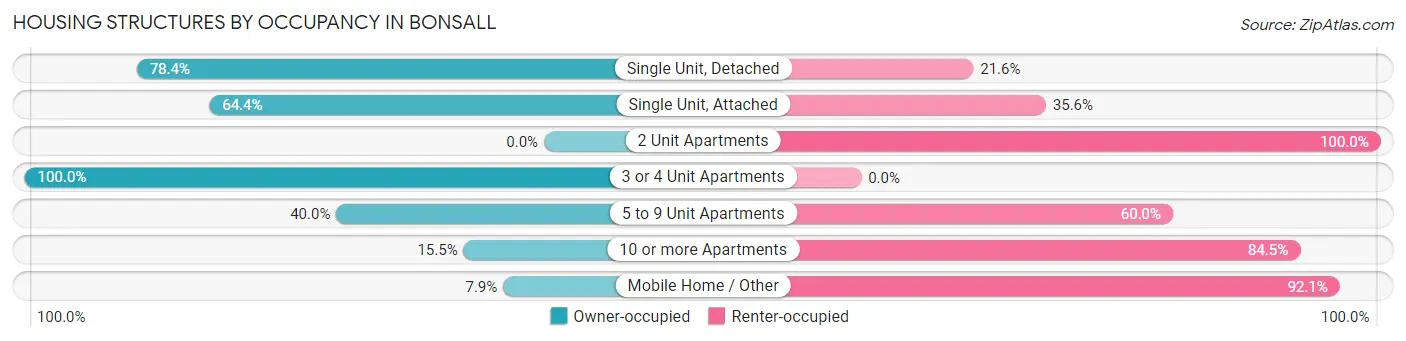
| Structure Type | Owner-occupied | Renter-occupied |
| Single Unit, Detached | 810 (78.4%) | 223 (21.6%) |
| Single Unit, Attached | 174 (64.4%) | 96 (35.6%) |
| 2 Unit Apartments | 0 (0.0%) | 11 (100.0%) |
| 3 or 4 Unit Apartments | 40 (100.0%) | 0 (0.0%) |
| 5 to 9 Unit Apartments | 22 (40.0%) | 33 (60.0%) |
| 10 or more Apartments | 31 (15.5%) | 169 (84.5%) |
| Mobile Home / Other | 7 (7.9%) | 82 (92.1%) |
| Total | 1,084 (63.8%) | 614 (36.2%) |
Housing Structures by Number of Rooms in Bonsall
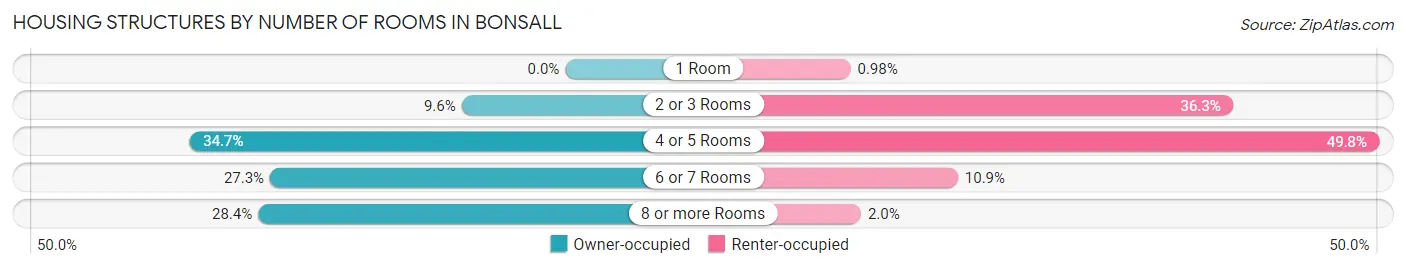
| Number of Rooms | Owner-occupied | Renter-occupied |
| 1 Room | 0 (0.0%) | 6 (1.0%) |
| 2 or 3 Rooms | 104 (9.6%) | 223 (36.3%) |
| 4 or 5 Rooms | 376 (34.7%) | 306 (49.8%) |
| 6 or 7 Rooms | 296 (27.3%) | 67 (10.9%) |
| 8 or more Rooms | 308 (28.4%) | 12 (1.9%) |
| Total | 1,084 (100.0%) | 614 (100.0%) |
Housing Structure by Heating Type in Bonsall
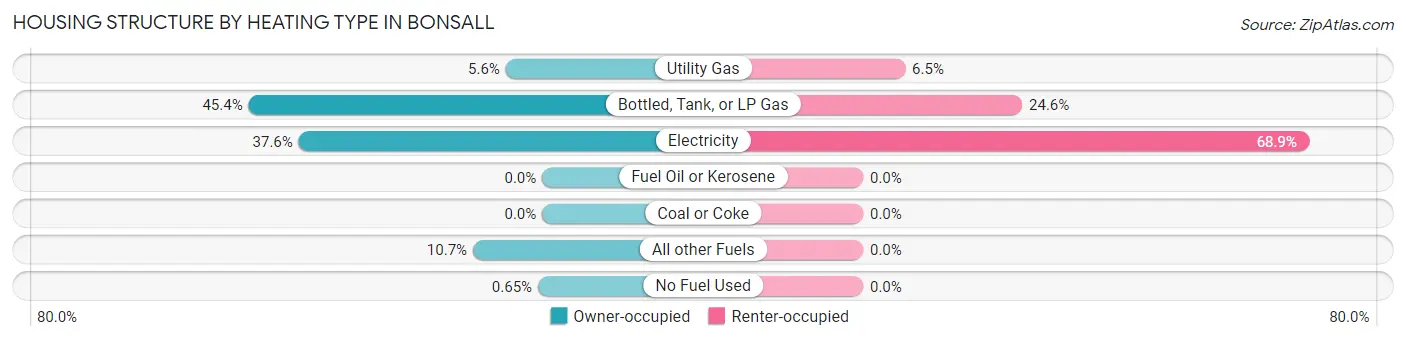
| Heating Type | Owner-occupied | Renter-occupied |
| Utility Gas | 61 (5.6%) | 40 (6.5%) |
| Bottled, Tank, or LP Gas | 492 (45.4%) | 151 (24.6%) |
| Electricity | 408 (37.6%) | 423 (68.9%) |
| Fuel Oil or Kerosene | 0 (0.0%) | 0 (0.0%) |
| Coal or Coke | 0 (0.0%) | 0 (0.0%) |
| All other Fuels | 116 (10.7%) | 0 (0.0%) |
| No Fuel Used | 7 (0.6%) | 0 (0.0%) |
| Total | 1,084 (100.0%) | 614 (100.0%) |
Household Vehicle Usage in Bonsall
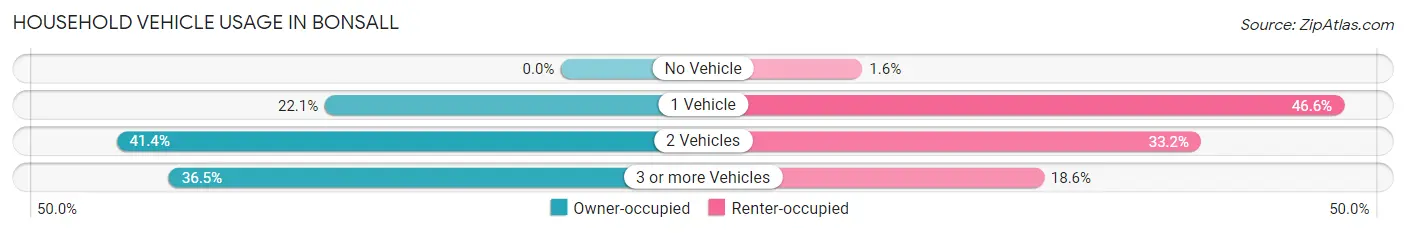
| Vehicles per Household | Owner-occupied | Renter-occupied |
| No Vehicle | 0 (0.0%) | 10 (1.6%) |
| 1 Vehicle | 239 (22.1%) | 286 (46.6%) |
| 2 Vehicles | 449 (41.4%) | 204 (33.2%) |
| 3 or more Vehicles | 396 (36.5%) | 114 (18.6%) |
| Total | 1,084 (100.0%) | 614 (100.0%) |
Real Estate & Mortgages in Bonsall
Real Estate and Mortgage Overview in Bonsall
| Characteristic | Without Mortgage | With Mortgage |
| Housing Units | 315 | 769 |
| Median Property Value | $945,400 | $838,000 |
| Median Household Income | $93,490 | $290 |
| Monthly Housing Costs | $1,379 | $303 |
| Real Estate Taxes | $6,285 | $0 |
Property Value by Mortgage Status in Bonsall
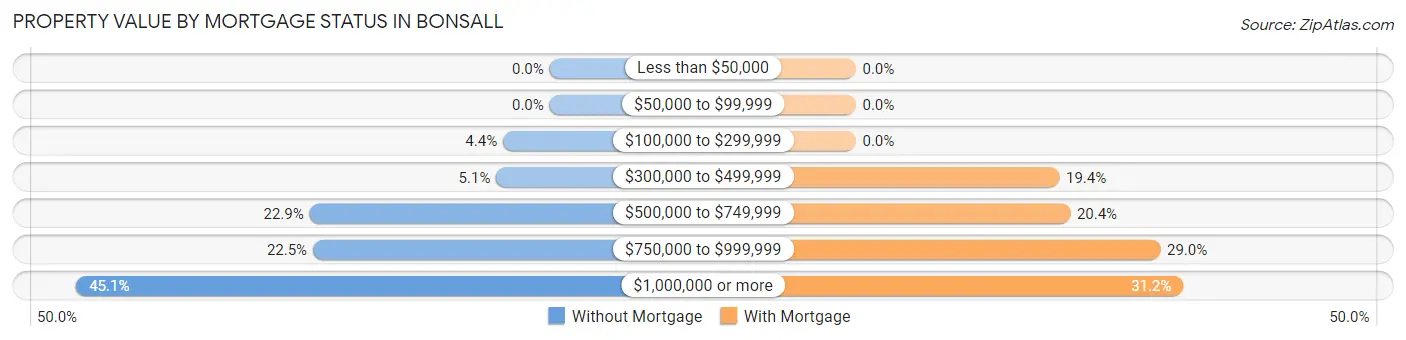
| Property Value | Without Mortgage | With Mortgage |
| Less than $50,000 | 0 (0.0%) | 0 (0.0%) |
| $50,000 to $99,999 | 0 (0.0%) | 0 (0.0%) |
| $100,000 to $299,999 | 14 (4.4%) | 0 (0.0%) |
| $300,000 to $499,999 | 16 (5.1%) | 149 (19.4%) |
| $500,000 to $749,999 | 72 (22.9%) | 157 (20.4%) |
| $750,000 to $999,999 | 71 (22.5%) | 223 (29.0%) |
| $1,000,000 or more | 142 (45.1%) | 240 (31.2%) |
| Total | 315 (100.0%) | 769 (100.0%) |
Household Income by Mortgage Status in Bonsall
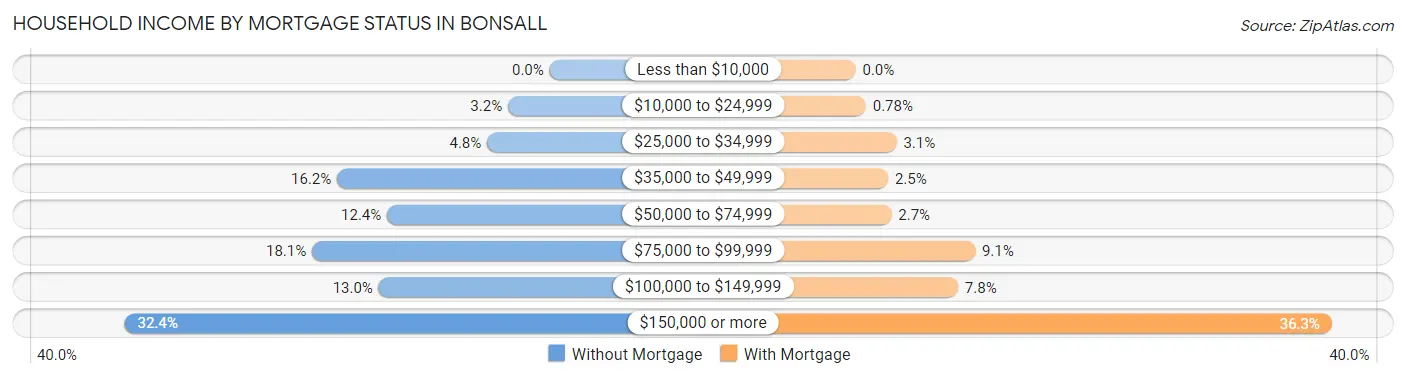
| Household Income | Without Mortgage | With Mortgage |
| Less than $10,000 | 0 (0.0%) | 0 (0.0%) |
| $10,000 to $24,999 | 10 (3.2%) | 6 (0.8%) |
| $25,000 to $34,999 | 15 (4.8%) | 24 (3.1%) |
| $35,000 to $49,999 | 51 (16.2%) | 19 (2.5%) |
| $50,000 to $74,999 | 39 (12.4%) | 21 (2.7%) |
| $75,000 to $99,999 | 57 (18.1%) | 70 (9.1%) |
| $100,000 to $149,999 | 41 (13.0%) | 60 (7.8%) |
| $150,000 or more | 102 (32.4%) | 279 (36.3%) |
| Total | 315 (100.0%) | 769 (100.0%) |
Property Value to Household Income Ratio in Bonsall
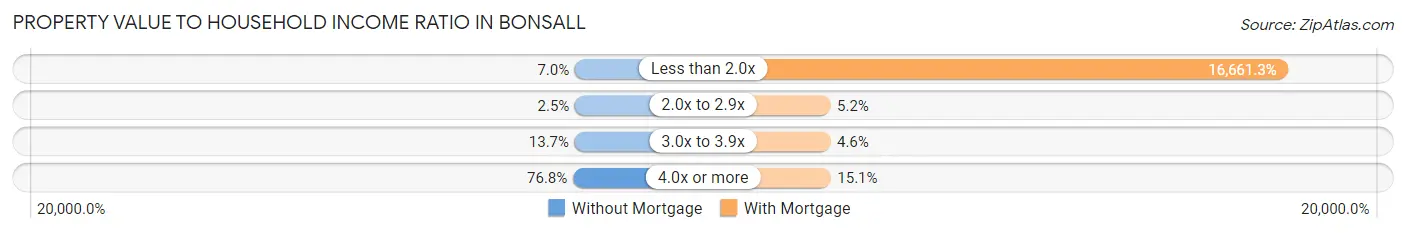
| Value-to-Income Ratio | Without Mortgage | With Mortgage |
| Less than 2.0x | 22 (7.0%) | 128,125 (16,661.3%) |
| 2.0x to 2.9x | 8 (2.5%) | 40 (5.2%) |
| 3.0x to 3.9x | 43 (13.7%) | 35 (4.5%) |
| 4.0x or more | 242 (76.8%) | 116 (15.1%) |
| Total | 315 (100.0%) | 769 (100.0%) |
Real Estate Taxes by Mortgage Status in Bonsall
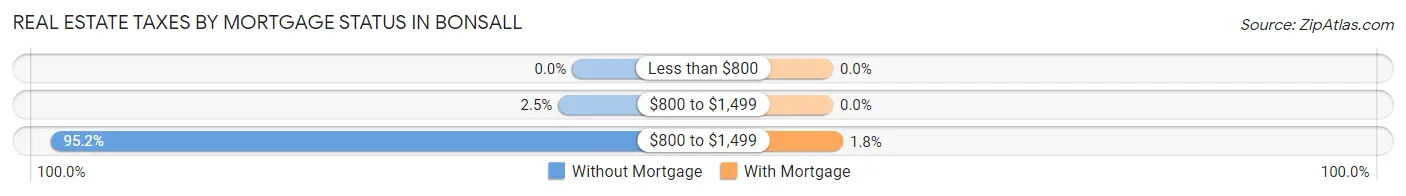
| Property Taxes | Without Mortgage | With Mortgage |
| Less than $800 | 0 (0.0%) | 0 (0.0%) |
| $800 to $1,499 | 8 (2.5%) | 0 (0.0%) |
| $800 to $1,499 | 300 (95.2%) | 14 (1.8%) |
| Total | 315 (100.0%) | 769 (100.0%) |
Health & Disability in Bonsall
Health Insurance Coverage by Age in Bonsall
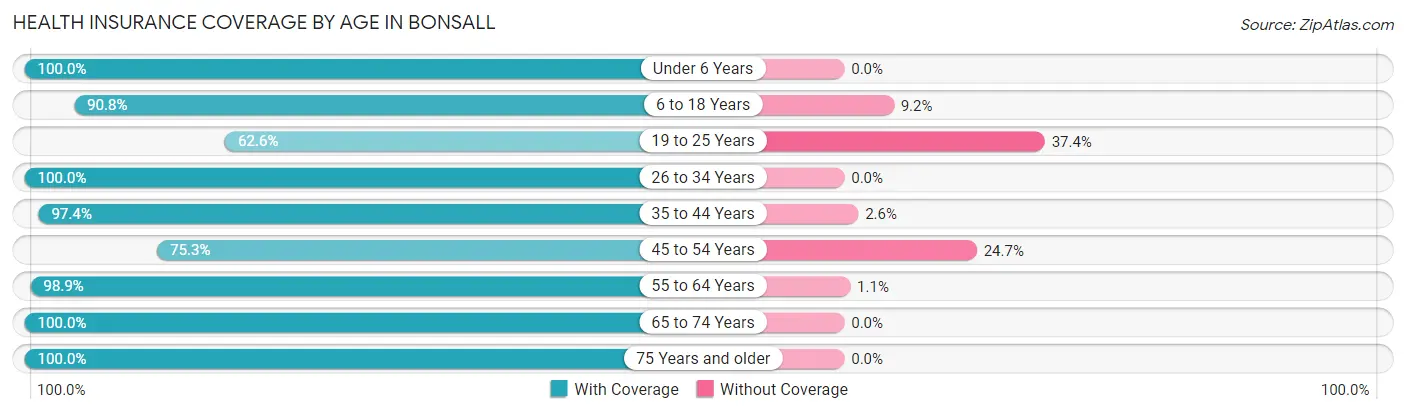
| Age Bracket | With Coverage | Without Coverage |
| Under 6 Years | 215 (100.0%) | 0 (0.0%) |
| 6 to 18 Years | 630 (90.8%) | 64 (9.2%) |
| 19 to 25 Years | 119 (62.6%) | 71 (37.4%) |
| 26 to 34 Years | 217 (100.0%) | 0 (0.0%) |
| 35 to 44 Years | 449 (97.4%) | 12 (2.6%) |
| 45 to 54 Years | 558 (75.3%) | 183 (24.7%) |
| 55 to 64 Years | 633 (98.9%) | 7 (1.1%) |
| 65 to 74 Years | 531 (100.0%) | 0 (0.0%) |
| 75 Years and older | 378 (100.0%) | 0 (0.0%) |
| Total | 3,730 (91.7%) | 337 (8.3%) |
Health Insurance Coverage by Citizenship Status in Bonsall
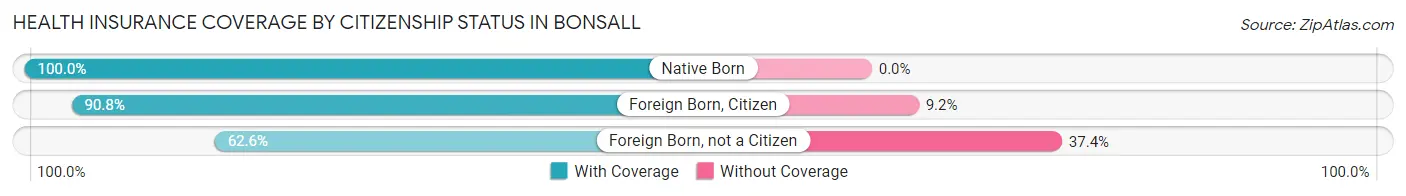
| Citizenship Status | With Coverage | Without Coverage |
| Native Born | 215 (100.0%) | 0 (0.0%) |
| Foreign Born, Citizen | 630 (90.8%) | 64 (9.2%) |
| Foreign Born, not a Citizen | 119 (62.6%) | 71 (37.4%) |
Health Insurance Coverage by Household Income in Bonsall
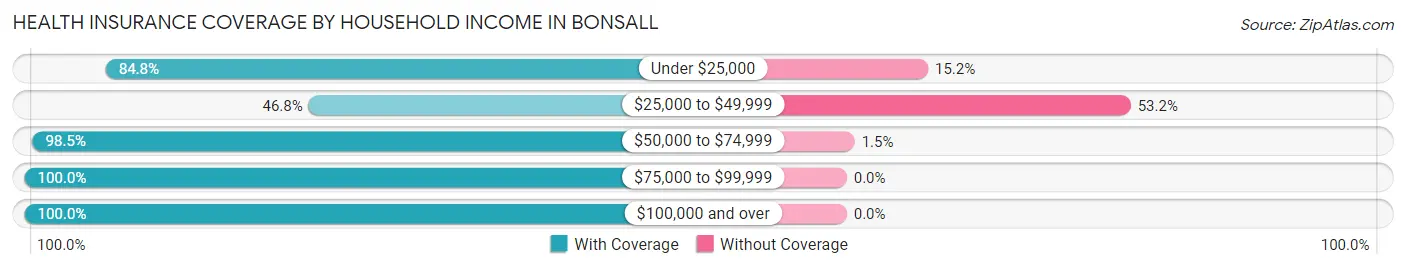
| Household Income | With Coverage | Without Coverage |
| Under $25,000 | 323 (84.8%) | 58 (15.2%) |
| $25,000 to $49,999 | 234 (46.8%) | 266 (53.2%) |
| $50,000 to $74,999 | 465 (98.5%) | 7 (1.5%) |
| $75,000 to $99,999 | 401 (100.0%) | 0 (0.0%) |
| $100,000 and over | 2,307 (100.0%) | 0 (0.0%) |
Public vs Private Health Insurance Coverage by Age in Bonsall
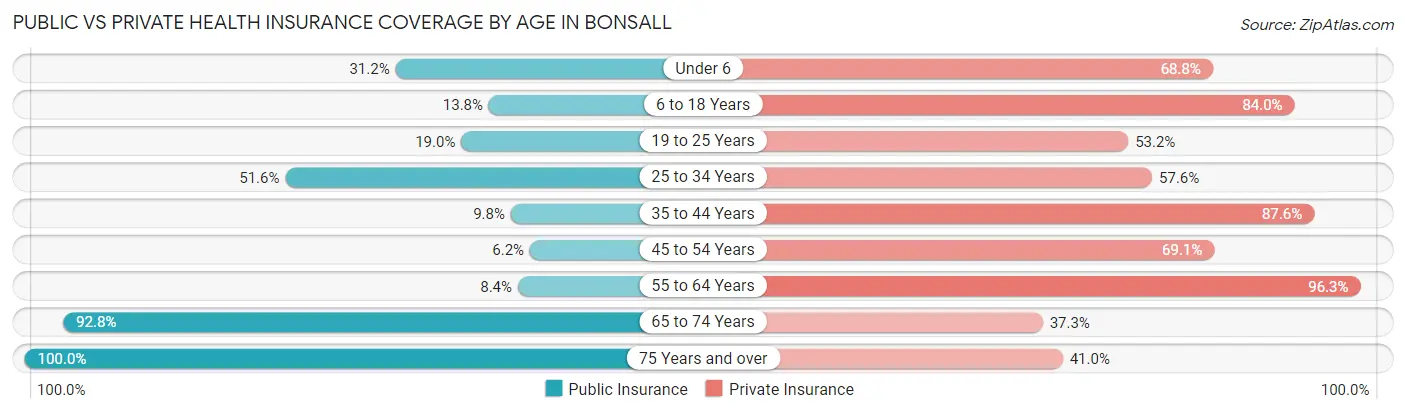
| Age Bracket | Public Insurance | Private Insurance |
| Under 6 | 67 (31.2%) | 148 (68.8%) |
| 6 to 18 Years | 96 (13.8%) | 583 (84.0%) |
| 19 to 25 Years | 36 (19.0%) | 101 (53.2%) |
| 25 to 34 Years | 112 (51.6%) | 125 (57.6%) |
| 35 to 44 Years | 45 (9.8%) | 404 (87.6%) |
| 45 to 54 Years | 46 (6.2%) | 512 (69.1%) |
| 55 to 64 Years | 54 (8.4%) | 616 (96.3%) |
| 65 to 74 Years | 493 (92.8%) | 198 (37.3%) |
| 75 Years and over | 378 (100.0%) | 155 (41.0%) |
| Total | 1,327 (32.6%) | 2,842 (69.9%) |
Disability Status by Sex by Age in Bonsall
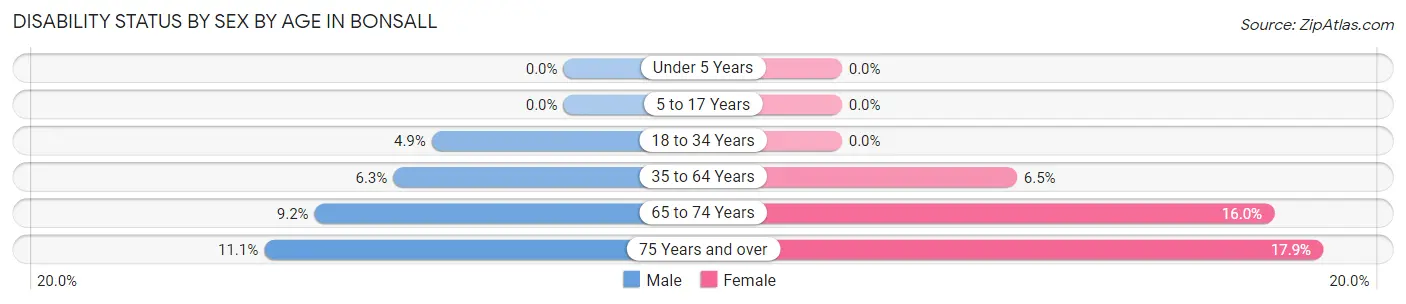
| Age Bracket | Male | Female |
| Under 5 Years | 0 (0.0%) | 0 (0.0%) |
| 5 to 17 Years | 0 (0.0%) | 0 (0.0%) |
| 18 to 34 Years | 11 (4.9%) | 0 (0.0%) |
| 35 to 64 Years | 62 (6.3%) | 56 (6.5%) |
| 65 to 74 Years | 22 (9.2%) | 47 (16.0%) |
| 75 Years and over | 14 (11.1%) | 45 (17.9%) |
Disability Class by Sex by Age in Bonsall
Disability Class: Hearing Difficulty
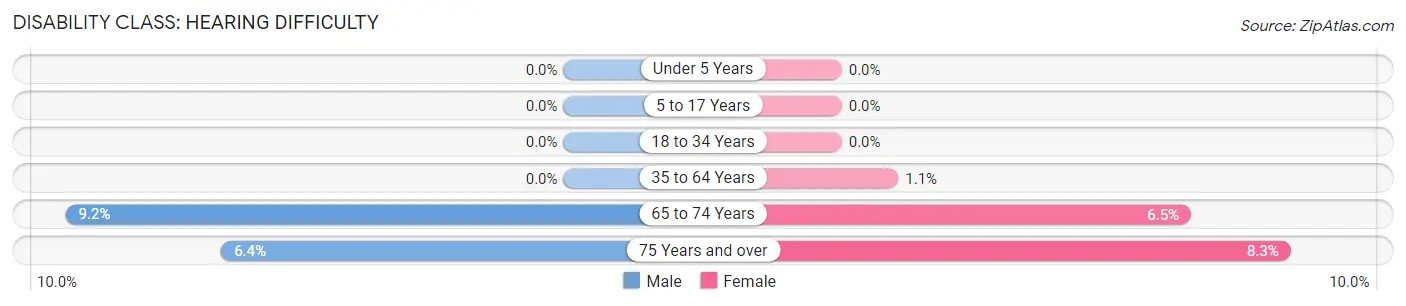
| Age Bracket | Male | Female |
| Under 5 Years | 0 (0.0%) | 0 (0.0%) |
| 5 to 17 Years | 0 (0.0%) | 0 (0.0%) |
| 18 to 34 Years | 0 (0.0%) | 0 (0.0%) |
| 35 to 64 Years | 0 (0.0%) | 9 (1.1%) |
| 65 to 74 Years | 22 (9.2%) | 19 (6.5%) |
| 75 Years and over | 8 (6.4%) | 21 (8.3%) |
Disability Class: Vision Difficulty
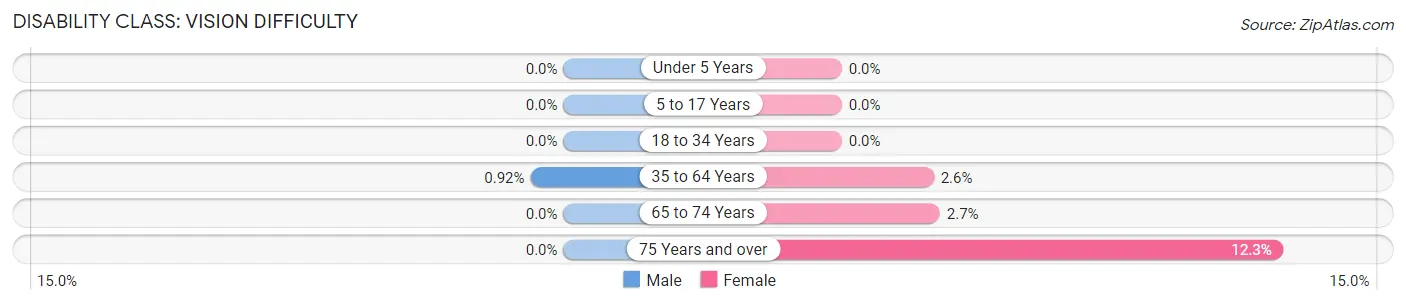
| Age Bracket | Male | Female |
| Under 5 Years | 0 (0.0%) | 0 (0.0%) |
| 5 to 17 Years | 0 (0.0%) | 0 (0.0%) |
| 18 to 34 Years | 0 (0.0%) | 0 (0.0%) |
| 35 to 64 Years | 9 (0.9%) | 22 (2.6%) |
| 65 to 74 Years | 0 (0.0%) | 8 (2.7%) |
| 75 Years and over | 0 (0.0%) | 31 (12.3%) |
Disability Class: Cognitive Difficulty
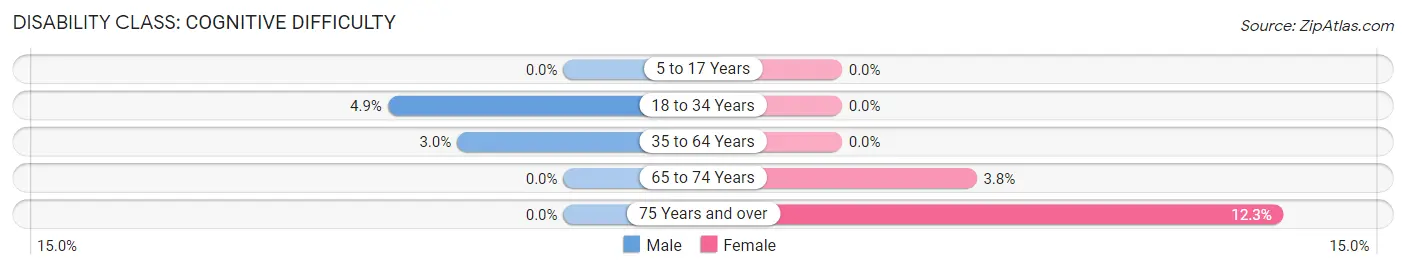
| Age Bracket | Male | Female |
| 5 to 17 Years | 0 (0.0%) | 0 (0.0%) |
| 18 to 34 Years | 11 (4.9%) | 0 (0.0%) |
| 35 to 64 Years | 29 (3.0%) | 0 (0.0%) |
| 65 to 74 Years | 0 (0.0%) | 11 (3.7%) |
| 75 Years and over | 0 (0.0%) | 31 (12.3%) |
Disability Class: Ambulatory Difficulty
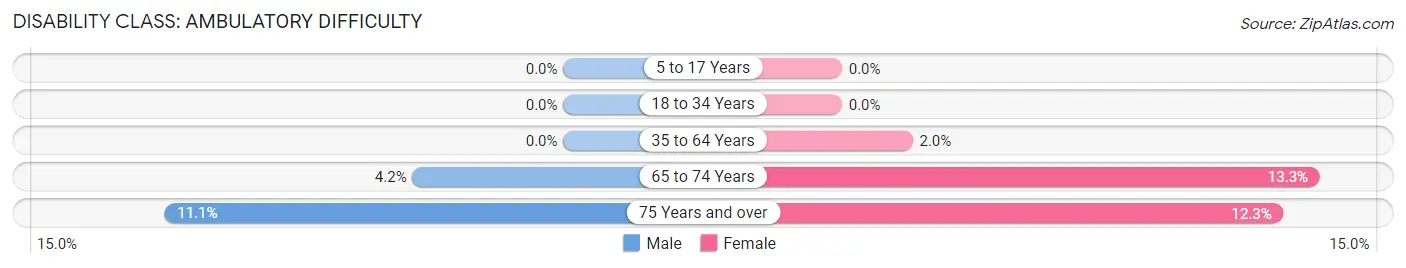
| Age Bracket | Male | Female |
| 5 to 17 Years | 0 (0.0%) | 0 (0.0%) |
| 18 to 34 Years | 0 (0.0%) | 0 (0.0%) |
| 35 to 64 Years | 0 (0.0%) | 17 (2.0%) |
| 65 to 74 Years | 10 (4.2%) | 39 (13.3%) |
| 75 Years and over | 14 (11.1%) | 31 (12.3%) |
Disability Class: Self-Care Difficulty
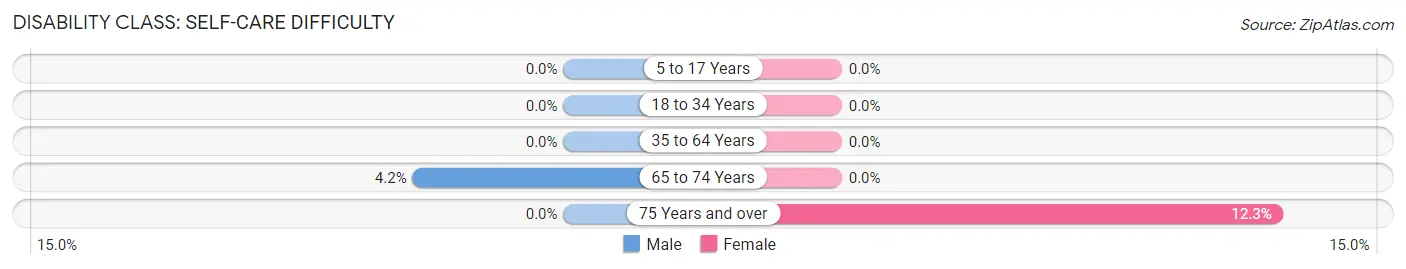
| Age Bracket | Male | Female |
| 5 to 17 Years | 0 (0.0%) | 0 (0.0%) |
| 18 to 34 Years | 0 (0.0%) | 0 (0.0%) |
| 35 to 64 Years | 0 (0.0%) | 0 (0.0%) |
| 65 to 74 Years | 10 (4.2%) | 0 (0.0%) |
| 75 Years and over | 0 (0.0%) | 31 (12.3%) |
Technology Access in Bonsall
Computing Device Access in Bonsall
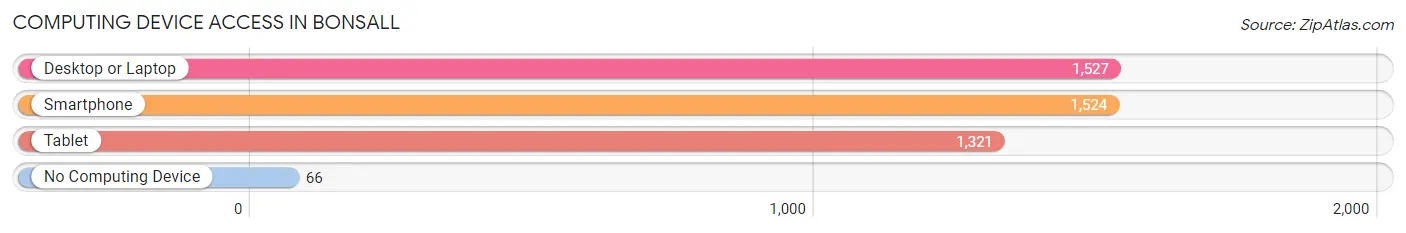
| Device Type | # Households | % Households |
| Desktop or Laptop | 1,527 | 89.9% |
| Smartphone | 1,524 | 89.7% |
| Tablet | 1,321 | 77.8% |
| No Computing Device | 66 | 3.9% |
| Total | 1,698 | 100.0% |
Internet Access in Bonsall
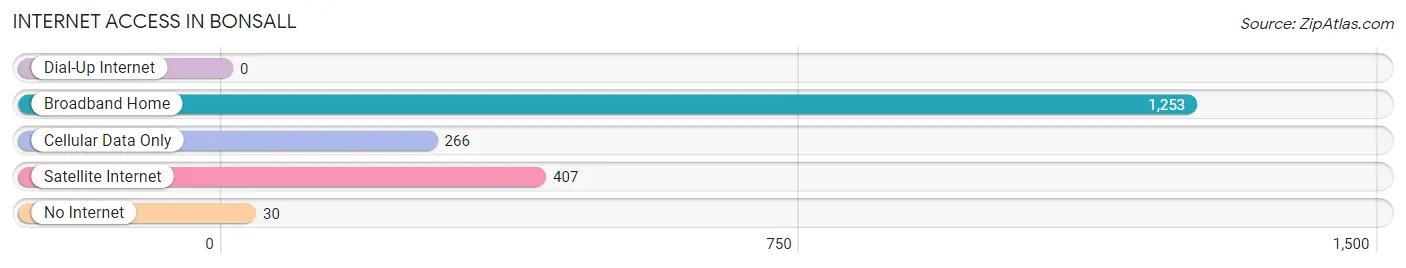
| Internet Type | # Households | % Households |
| Dial-Up Internet | 0 | 0.0% |
| Broadband Home | 1,253 | 73.8% |
| Cellular Data Only | 266 | 15.7% |
| Satellite Internet | 407 | 24.0% |
| No Internet | 30 | 1.8% |
| Total | 1,698 | 100.0% |
Bonsall Summary
Bonsall is a small unincorporated community located in San Diego County, California. It is situated in the foothills of the San Luis Rey River Valley, approximately 10 miles east of Oceanside and 30 miles north of San Diego. The population of Bonsall was estimated to be 3,982 in 2019.
History
Bonsall was originally inhabited by the Luiseño Indians, who were the first people to settle in the area. The Luiseño Indians were a semi-nomadic people who lived in the area for thousands of years before the arrival of the Spanish in the late 1700s. The Spanish established a mission in the area in 1798, which was later abandoned in 1821.
In the mid-1800s, the area was settled by American settlers, who established a small farming community. The town was named after William Bonsall, who was one of the first settlers in the area. The town was officially incorporated in 1887.
Geography
Bonsall is located in the foothills of the San Luis Rey River Valley, approximately 10 miles east of Oceanside and 30 miles north of San Diego. The town is situated at an elevation of approximately 500 feet above sea level. The climate in Bonsall is generally mild, with temperatures ranging from the mid-50s to the mid-80s throughout the year.
The town is surrounded by rolling hills and is home to a variety of wildlife, including deer, coyotes, bobcats, and mountain lions. The area is also home to a variety of plant life, including oak trees, sycamores, and manzanita.
Economy
The economy of Bonsall is largely based on agriculture. The town is home to a variety of farms, including avocado, citrus, and olive farms. The town is also home to a number of wineries, which produce a variety of wines.
In addition to agriculture, Bonsall is home to a number of businesses, including restaurants, retail stores, and professional services. The town is also home to a number of small manufacturing companies, which produce a variety of products, including furniture, clothing, and electronics.
Demographics
As of 2019, the population of Bonsall was estimated to be 3,982. The population is largely white (83.3%), with smaller percentages of Hispanic (7.7%), Asian (3.2%), and African American (2.2%) residents. The median household income in Bonsall is $76,945, which is higher than the national average of $60,293. The median age in Bonsall is 44.7, which is slightly higher than the national average of 38.2.
Conclusion
Bonsall is a small unincorporated community located in San Diego County, California. It is situated in the foothills of the San Luis Rey River Valley, approximately 10 miles east of Oceanside and 30 miles north of San Diego. The population of Bonsall was estimated to be 3,982 in 2019. The economy of Bonsall is largely based on agriculture, with a variety of farms and wineries in the area. The population is largely white, with smaller percentages of Hispanic, Asian, and African American residents. The median household income in Bonsall is $76,945, which is higher than the national average.
Common Questions
What is Per Capita Income in Bonsall?
Per Capita income in Bonsall is $64,948.
What is the Median Family Income in Bonsall?
Median Family Income in Bonsall is $108,542.
What is the Median Household income in Bonsall?
Median Household Income in Bonsall is $98,529.
What is Income or Wage Gap in Bonsall?
Income or Wage Gap in Bonsall is 47.0%.
Women in Bonsall earn 53.0 cents for every dollar earned by a man.
What is Inequality or Gini Index in Bonsall?
Inequality or Gini Index in Bonsall is 0.54.
What is the Total Population of Bonsall?
Total Population of Bonsall is 4,131.
What is the Total Male Population of Bonsall?
Total Male Population of Bonsall is 2,020.
What is the Total Female Population of Bonsall?
Total Female Population of Bonsall is 2,111.
What is the Ratio of Males per 100 Females in Bonsall?
There are 95.69 Males per 100 Females in Bonsall.
What is the Ratio of Females per 100 Males in Bonsall?
There are 104.50 Females per 100 Males in Bonsall.
What is the Median Population Age in Bonsall?
Median Population Age in Bonsall is 49.2 Years.
What is the Average Family Size in Bonsall
Average Family Size in Bonsall is 2.9 People.
What is the Average Household Size in Bonsall
Average Household Size in Bonsall is 2.4 People.
How Large is the Labor Force in Bonsall?
There are 2,004 People in the Labor Forcein in Bonsall.
What is the Percentage of People in the Labor Force in Bonsall?
57.8% of People are in the Labor Force in Bonsall.
What is the Unemployment Rate in Bonsall?
Unemployment Rate in Bonsall is 8.7%.