Cities with the Highest Percentage of Population Walking to Work in Montana
RELATED REPORTS & OPTIONS
Walk to Work
Montana
Compare Cities
Map of Cities with the Highest Percentage of Population Walking to Work in Montana
0.0%
80.0%
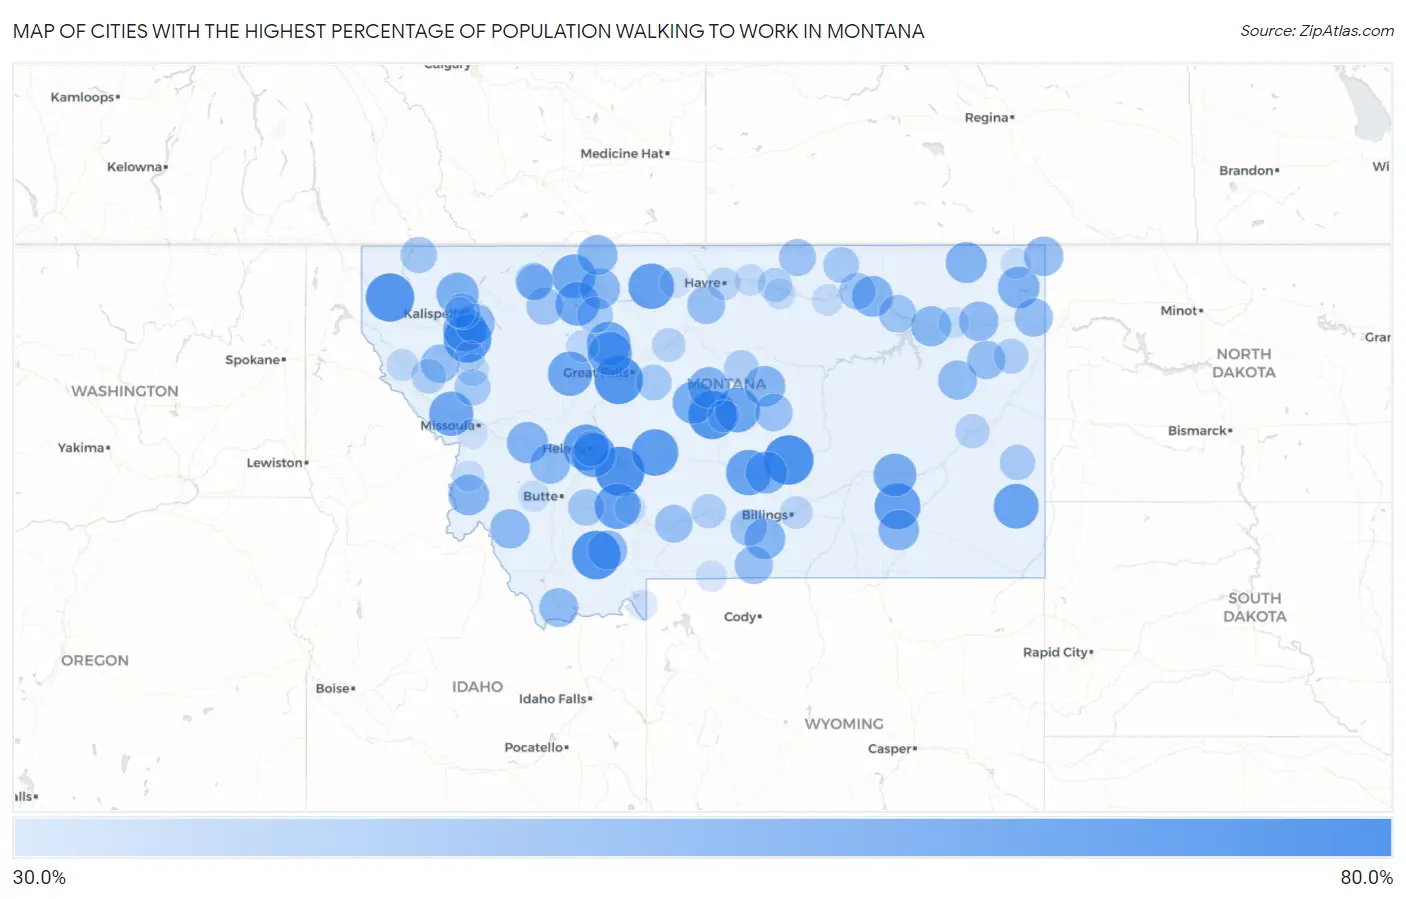
Cities with the Highest Percentage of Population Walking to Work in Montana
| City | % Walk to Work | vs State | vs National | |
| 1. | Roundup | 68.1% | 37.3% (+30.8)#1 | 33.4% (+34.7)#181 |
| 2. | Townsend | 67.4% | 37.3% (+30.1)#2 | 33.4% (+34.0)#209 |
| 3. | Virginia City | 66.5% | 37.3% (+29.2)#3 | 33.4% (+33.1)#256 |
| 4. | Libby | 66.2% | 37.3% (+28.9)#4 | 33.4% (+32.8)#276 |
| 5. | Ulm | 66.2% | 37.3% (+28.9)#5 | 33.4% (+32.8)#277 |
| 6. | Hobson | 66.1% | 37.3% (+28.8)#6 | 33.4% (+32.7)#290 |
| 7. | Lakeview | 65.3% | 37.3% (+28.0)#7 | 33.4% (+31.9)#337 |
| 8. | Rollins | 65.1% | 37.3% (+27.8)#8 | 33.4% (+31.7)#351 |
| 9. | White Sulphur Springs | 63.2% | 37.3% (+25.9)#9 | 33.4% (+29.8)#489 |
| 10. | Helena West Side | 62.3% | 37.3% (+25.0)#10 | 33.4% (+28.9)#577 |
| 11. | Colstrip | 61.9% | 37.3% (+24.6)#11 | 33.4% (+28.5)#616 |
| 12. | Chester | 61.7% | 37.3% (+24.4)#12 | 33.4% (+28.3)#638 |
| 13. | Three Forks | 61.4% | 37.3% (+24.1)#13 | 33.4% (+28.0)#674 |
| 14. | Ryegate | 61.4% | 37.3% (+24.1)#14 | 33.4% (+28.0)#679 |
| 15. | Ekalaka | 60.4% | 37.3% (+23.1)#15 | 33.4% (+27.0)#812 |
| 16. | Lewistown | 60.3% | 37.3% (+23.0)#16 | 33.4% (+26.9)#822 |
| 17. | Alberton | 59.3% | 37.3% (+22.0)#17 | 33.4% (+25.9)#960 |
| 18. | Augusta | 59.3% | 37.3% (+22.0)#18 | 33.4% (+25.9)#967 |
| 19. | Montana City | 59.1% | 37.3% (+21.8)#19 | 33.4% (+25.7)#1,001 |
| 20. | Dutton | 58.6% | 37.3% (+21.3)#20 | 33.4% (+25.2)#1,062 |
| 21. | Cut Bank | 58.5% | 37.3% (+21.2)#21 | 33.4% (+25.1)#1,073 |
| 22. | Valier | 58.5% | 37.3% (+21.2)#22 | 33.4% (+25.1)#1,084 |
| 23. | Power | 58.5% | 37.3% (+21.2)#23 | 33.4% (+25.1)#1,093 |
| 24. | Lakeside | 58.1% | 37.3% (+20.8)#24 | 33.4% (+24.7)#1,153 |
| 25. | Forsyth | 57.1% | 37.3% (+19.8)#25 | 33.4% (+23.7)#1,313 |
| 26. | Stanford | 56.3% | 37.3% (+19.0)#26 | 33.4% (+22.9)#1,462 |
| 27. | Whitefish | 55.9% | 37.3% (+18.6)#27 | 33.4% (+22.5)#1,505 |
| 28. | Lavina | 55.2% | 37.3% (+17.9)#28 | 33.4% (+21.8)#1,655 |
| 29. | Medicine Lake | 54.8% | 37.3% (+17.5)#29 | 33.4% (+21.4)#1,713 |
| 30. | Drummond | 54.3% | 37.3% (+17.0)#30 | 33.4% (+20.9)#1,798 |
| 31. | Scobey | 53.9% | 37.3% (+16.6)#31 | 33.4% (+20.5)#1,857 |
| 32. | Denton | 53.5% | 37.3% (+16.2)#32 | 33.4% (+20.1)#1,942 |
| 33. | Hinsdale | 53.5% | 37.3% (+16.2)#33 | 33.4% (+20.1)#1,944 |
| 34. | Darby | 53.4% | 37.3% (+16.1)#34 | 33.4% (+20.0)#1,959 |
| 35. | Roy | 53.3% | 37.3% (+16.0)#35 | 33.4% (+19.9)#1,983 |
| 36. | Joliet | 53.1% | 37.3% (+15.8)#36 | 33.4% (+19.7)#2,018 |
| 37. | Lame Deer | 53.0% | 37.3% (+15.7)#37 | 33.4% (+19.6)#2,030 |
| 38. | Shelby | 52.7% | 37.3% (+15.4)#38 | 33.4% (+19.3)#2,083 |
| 39. | Frazer | 52.5% | 37.3% (+15.2)#39 | 33.4% (+19.1)#2,138 |
| 40. | Deer Lodge | 52.3% | 37.3% (+15.0)#40 | 33.4% (+18.9)#2,170 |
| 41. | Sunburst | 52.1% | 37.3% (+14.8)#41 | 33.4% (+18.7)#2,226 |
| 42. | Wisdom | 51.5% | 37.3% (+14.2)#42 | 33.4% (+18.1)#2,325 |
| 43. | Bigfork | 51.3% | 37.3% (+14.0)#43 | 33.4% (+17.9)#2,347 |
| 44. | Poplar | 51.3% | 37.3% (+14.0)#44 | 33.4% (+17.9)#2,361 |
| 45. | Westby | 51.2% | 37.3% (+13.9)#45 | 33.4% (+17.8)#2,372 |
| 46. | Ennis | 51.0% | 37.3% (+13.7)#46 | 33.4% (+17.6)#2,410 |
| 47. | Circle | 50.8% | 37.3% (+13.5)#47 | 33.4% (+17.4)#2,438 |
| 48. | Lima | 50.6% | 37.3% (+13.3)#48 | 33.4% (+17.2)#2,475 |
| 49. | Hot Springs | 49.5% | 37.3% (+12.2)#49 | 33.4% (+16.1)#2,711 |
| 50. | Bainville | 49.5% | 37.3% (+12.2)#50 | 33.4% (+16.1)#2,718 |
| 51. | Richey | 49.4% | 37.3% (+12.1)#51 | 33.4% (+16.0)#2,739 |
| 52. | Bearcreek | 49.1% | 37.3% (+11.8)#52 | 33.4% (+15.7)#2,798 |
| 53. | Rocky Boy West | 48.8% | 37.3% (+11.5)#53 | 33.4% (+15.4)#2,844 |
| 54. | Livingston | 48.5% | 37.3% (+11.2)#54 | 33.4% (+15.1)#2,876 |
| 55. | Grass Range | 48.5% | 37.3% (+11.2)#55 | 33.4% (+15.1)#2,902 |
| 56. | Glasgow | 48.1% | 37.3% (+10.8)#56 | 33.4% (+14.7)#2,983 |
| 57. | Heart Butte | 47.5% | 37.3% (+10.2)#57 | 33.4% (+14.1)#3,091 |
| 58. | Turner | 47.3% | 37.3% (+10.00)#58 | 33.4% (+13.9)#3,144 |
| 59. | Columbus | 47.2% | 37.3% (+9.90)#59 | 33.4% (+13.8)#3,159 |
| 60. | North Browning | 47.1% | 37.3% (+9.80)#60 | 33.4% (+13.7)#3,181 |
| 61. | Saco | 46.8% | 37.3% (+9.50)#61 | 33.4% (+13.4)#3,222 |
| 62. | Whitehall | 46.2% | 37.3% (+8.90)#62 | 33.4% (+12.8)#3,342 |
| 63. | Browning | 46.2% | 37.3% (+8.90)#63 | 33.4% (+12.8)#3,344 |
| 64. | Eureka | 46.1% | 37.3% (+8.80)#64 | 33.4% (+12.7)#3,358 |
| 65. | Evergreen | 45.7% | 37.3% (+8.40)#65 | 33.4% (+12.3)#3,413 |
| 66. | Conrad | 45.5% | 37.3% (+8.20)#66 | 33.4% (+12.1)#3,459 |
| 67. | St Ignatius | 45.5% | 37.3% (+8.20)#67 | 33.4% (+12.1)#3,471 |
| 68. | Belt | 45.0% | 37.3% (+7.70)#68 | 33.4% (+11.6)#3,588 |
| 69. | Whitewater | 45.0% | 37.3% (+7.70)#69 | 33.4% (+11.6)#3,591 |
| 70. | Helena | 44.8% | 37.3% (+7.50)#70 | 33.4% (+11.4)#3,612 |
| 71. | Plevna | 44.5% | 37.3% (+7.20)#71 | 33.4% (+11.1)#3,697 |
| 72. | Fox Lake | 43.8% | 37.3% (+6.50)#72 | 33.4% (+10.4)#3,834 |
| 73. | Plains | 43.7% | 37.3% (+6.40)#73 | 33.4% (+10.3)#3,845 |
| 74. | Winifred | 43.5% | 37.3% (+6.20)#74 | 33.4% (+10.1)#3,900 |
| 75. | Big Timber | 43.0% | 37.3% (+5.70)#75 | 33.4% (+9.60)#3,991 |
| 76. | Harlem | 42.6% | 37.3% (+5.30)#76 | 33.4% (+9.20)#4,069 |
| 77. | Terry | 42.5% | 37.3% (+5.20)#77 | 33.4% (+9.10)#4,107 |
| 78. | New Miami Colony | 41.8% | 37.3% (+4.50)#78 | 33.4% (+8.40)#4,260 |
| 79. | Fort Benton | 41.7% | 37.3% (+4.40)#79 | 33.4% (+8.30)#4,278 |
| 80. | Havre | 40.5% | 37.3% (+3.20)#80 | 33.4% (+7.10)#4,569 |
| 81. | Lockwood | 40.3% | 37.3% (+3.00)#81 | 33.4% (+6.90)#4,639 |
| 82. | Ronan | 40.1% | 37.3% (+2.80)#82 | 33.4% (+6.70)#4,687 |
| 83. | Moore | 39.6% | 37.3% (+2.30)#83 | 33.4% (+6.20)#4,780 |
| 84. | Choteau | 39.5% | 37.3% (+2.20)#84 | 33.4% (+6.10)#4,800 |
| 85. | Thompson Falls | 39.2% | 37.3% (+1.90)#85 | 33.4% (+5.80)#4,885 |
| 86. | Chinook | 38.6% | 37.3% (+1.30)#86 | 33.4% (+5.20)#5,024 |
| 87. | Malta | 38.4% | 37.3% (+1.10)#87 | 33.4% (+5.00)#5,091 |
| 88. | Fort Belknap Agency | 38.1% | 37.3% (+0.800)#88 | 33.4% (+4.70)#5,153 |
| 89. | Anaconda Deer Lodge County | 37.9% | 37.3% (+0.600)#89 | 33.4% (+4.50)#5,173 |
| 90. | Manhattan | 37.9% | 37.3% (+0.600)#90 | 33.4% (+4.50)#5,179 |
| 91. | Hamilton | 37.8% | 37.3% (+0.500)#91 | 33.4% (+4.40)#5,201 |
| 92. | Wolf Point | 37.6% | 37.3% (+0.300)#92 | 33.4% (+4.20)#5,261 |
| 93. | Plentywood | 37.5% | 37.3% (+0.200)#93 | 33.4% (+4.10)#5,290 |
| 94. | Cooke City | 37.5% | 37.3% (+0.200)#94 | 33.4% (+4.10)#5,308 |
| 95. | Kalispell | 36.9% | 37.3% (-0.400)#95 | 33.4% (+3.50)#5,420 |
| 96. | Rudyard | 36.8% | 37.3% (-0.500)#96 | 33.4% (+3.40)#5,462 |
| 97. | Camrose Colony | 36.7% | 37.3% (-0.600)#97 | 33.4% (+3.30)#5,496 |
| 98. | Polson | 36.4% | 37.3% (-0.900)#98 | 33.4% (+3.00)#5,565 |
| 99. | Lolo | 36.4% | 37.3% (-0.900)#99 | 33.4% (+3.00)#5,567 |
| 100. | West Yellowstone | 36.2% | 37.3% (-1.10)#100 | 33.4% (+2.80)#5,617 |
Common Questions
What are the Top 10 Cities with the Highest Percentage of Population Walking to Work in Montana?
Top 10 Cities with the Highest Percentage of Population Walking to Work in Montana are:
#1
68.1%
#2
67.4%
#3
66.5%
#4
66.2%
#5
66.2%
#6
66.1%
#7
65.1%
#8
63.2%
#9
62.3%
#10
61.9%
What city has the Highest Percentage of Population Walking to Work in Montana?
Roundup has the Highest Percentage of Population Walking to Work in Montana with 68.1%.
What is the Percentage of Population Walking to Work in the State of Montana?
Percentage of Population Walking to Work in Montana is 37.3%.
What is the Percentage of Population Walking to Work in the United States?
Percentage of Population Walking to Work in the United States is 33.4%.