Cities with the Highest Percentage of Population Walking to Work in Pennsylvania
RELATED REPORTS & OPTIONS
Walk to Work
Pennsylvania
Compare Cities
Map of Cities with the Highest Percentage of Population Walking to Work in Pennsylvania
0.0%
100.0%
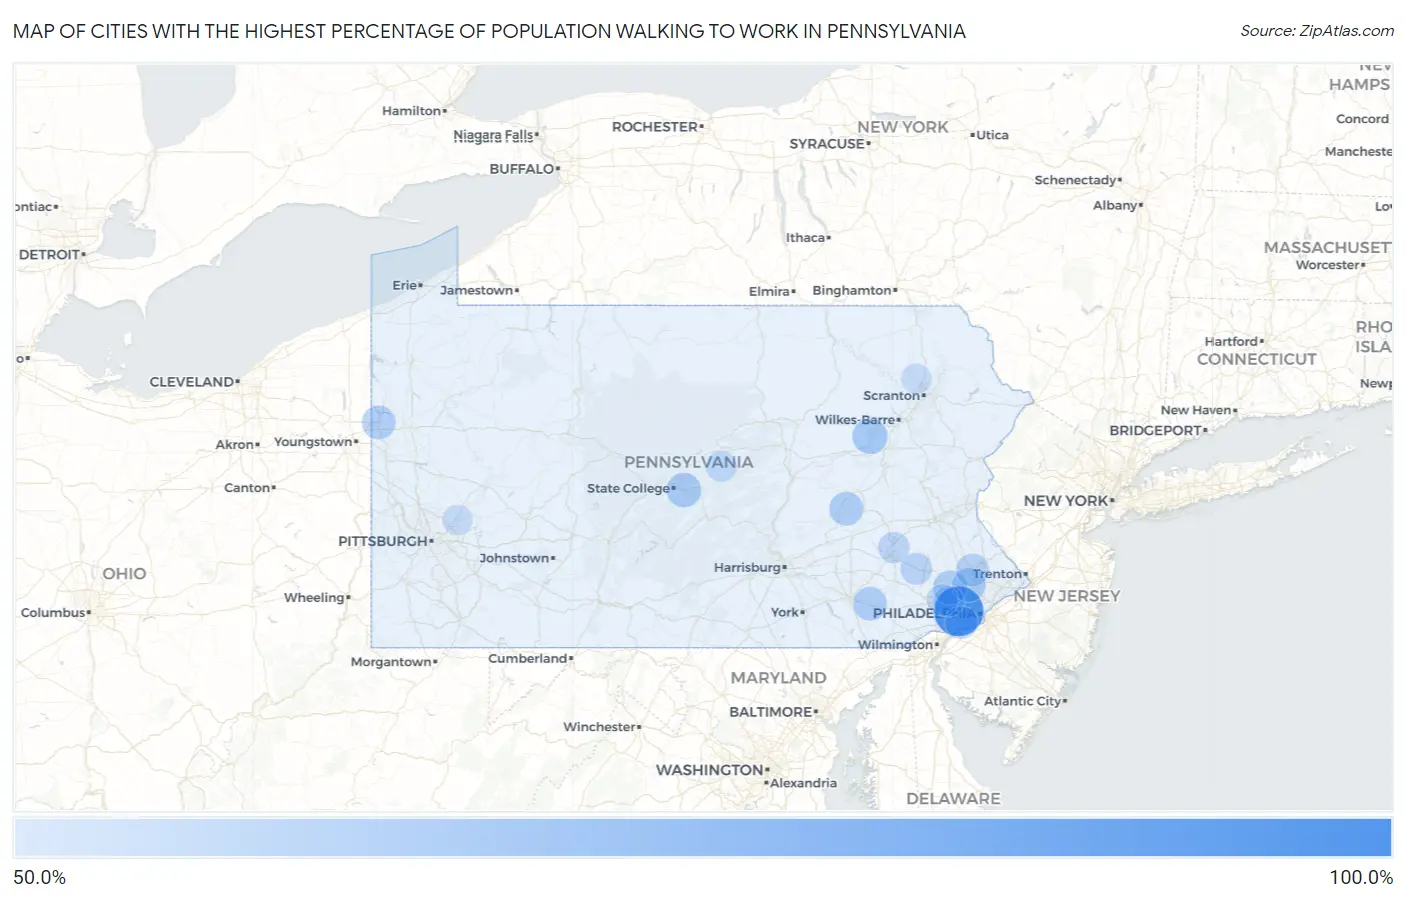
Cities with the Highest Percentage of Population Walking to Work in Pennsylvania
| City | % Walk to Work | vs State | vs National | |
| 1. | Broomall | 87.0% | 32.1% (+54.9)#1 | 33.4% (+53.6)#3 |
| 2. | Schwenksville Borough | 77.2% | 32.1% (+45.1)#2 | 33.4% (+43.8)#24 |
| 3. | Economy Borough | 77.0% | 32.1% (+44.9)#3 | 33.4% (+43.6)#27 |
| 4. | Donegal Borough | 69.5% | 32.1% (+37.4)#4 | 33.4% (+36.1)#124 |
| 5. | Bangor Borough | 69.3% | 32.1% (+37.2)#5 | 33.4% (+35.9)#130 |
| 6. | Williamstown Borough | 69.1% | 32.1% (+37.0)#6 | 33.4% (+35.7)#143 |
| 7. | West Middlesex Borough | 68.5% | 32.1% (+36.4)#7 | 33.4% (+35.1)#160 |
| 8. | Sugar Notch Borough | 68.3% | 32.1% (+36.2)#8 | 33.4% (+34.9)#172 |
| 9. | Montoursville Borough | 67.2% | 32.1% (+35.1)#9 | 33.4% (+33.8)#227 |
| 10. | Harmony Borough | 66.9% | 32.1% (+34.8)#10 | 33.4% (+33.5)#236 |
| 11. | West Kittanning Borough | 66.3% | 32.1% (+34.2)#11 | 33.4% (+32.9)#268 |
| 12. | Bendersville Borough | 65.8% | 32.1% (+33.7)#12 | 33.4% (+32.4)#300 |
| 13. | Fawn Grove Borough | 65.5% | 32.1% (+33.4)#13 | 33.4% (+32.1)#314 |
| 14. | Northumberland Borough | 65.2% | 32.1% (+33.1)#14 | 33.4% (+31.8)#340 |
| 15. | North Braddock Borough | 65.1% | 32.1% (+33.0)#15 | 33.4% (+31.7)#346 |
| 16. | Springboro Borough | 64.5% | 32.1% (+32.4)#16 | 33.4% (+31.1)#380 |
| 17. | Royalton Borough | 64.2% | 32.1% (+32.1)#17 | 33.4% (+30.8)#408 |
| 18. | Bedford Borough | 63.6% | 32.1% (+31.5)#18 | 33.4% (+30.2)#442 |
| 19. | Mocanaqua | 63.5% | 32.1% (+31.4)#19 | 33.4% (+30.1)#452 |
| 20. | Trappe Borough | 63.4% | 32.1% (+31.3)#20 | 33.4% (+30.0)#466 |
| 21. | Export Borough | 63.1% | 32.1% (+31.0)#21 | 33.4% (+29.7)#503 |
| 22. | Bolivar Borough | 62.7% | 32.1% (+30.6)#22 | 33.4% (+29.3)#532 |
| 23. | South Williamsport Borough | 62.6% | 32.1% (+30.5)#23 | 33.4% (+29.2)#534 |
| 24. | Dayton Borough | 62.6% | 32.1% (+30.5)#24 | 33.4% (+29.2)#537 |
| 25. | Boalsburg | 62.5% | 32.1% (+30.4)#25 | 33.4% (+29.1)#540 |
| 26. | Troy Borough | 62.3% | 32.1% (+30.2)#26 | 33.4% (+28.9)#578 |
| 27. | Alexandria Borough | 62.3% | 32.1% (+30.2)#27 | 33.4% (+28.9)#584 |
| 28. | New Philadelphia Borough | 62.2% | 32.1% (+30.1)#28 | 33.4% (+28.8)#593 |
| 29. | Biglerville Borough | 61.8% | 32.1% (+29.7)#29 | 33.4% (+28.4)#623 |
| 30. | Robesonia Borough | 61.7% | 32.1% (+29.6)#30 | 33.4% (+28.3)#630 |
| 31. | Gallitzin Borough | 61.7% | 32.1% (+29.6)#31 | 33.4% (+28.3)#633 |
| 32. | Audubon | 61.5% | 32.1% (+29.4)#32 | 33.4% (+28.1)#645 |
| 33. | Langhorne Borough | 61.5% | 32.1% (+29.4)#33 | 33.4% (+28.1)#649 |
| 34. | Newtown | 61.5% | 32.1% (+29.4)#34 | 33.4% (+28.1)#662 |
| 35. | Gordonville | 61.4% | 32.1% (+29.3)#35 | 33.4% (+28.0)#678 |
| 36. | Wellsville Borough | 61.3% | 32.1% (+29.2)#36 | 33.4% (+27.9)#700 |
| 37. | Blue Bell | 61.2% | 32.1% (+29.1)#37 | 33.4% (+27.8)#705 |
| 38. | Midland Borough | 61.2% | 32.1% (+29.1)#38 | 33.4% (+27.8)#708 |
| 39. | Eau Claire Borough | 61.2% | 32.1% (+29.1)#39 | 33.4% (+27.8)#714 |
| 40. | Hermitage | 61.1% | 32.1% (+29.0)#40 | 33.4% (+27.7)#715 |
| 41. | Coudersport Borough | 61.1% | 32.1% (+29.0)#41 | 33.4% (+27.7)#722 |
| 42. | Houston Borough | 61.1% | 32.1% (+29.0)#42 | 33.4% (+27.7)#724 |
| 43. | Mifflintown Borough | 60.7% | 32.1% (+28.6)#43 | 33.4% (+27.3)#751 |
| 44. | Avalon Borough | 60.5% | 32.1% (+28.4)#44 | 33.4% (+27.1)#771 |
| 45. | Mount Pleasant Borough | 60.5% | 32.1% (+28.4)#45 | 33.4% (+27.1)#772 |
| 46. | Marietta Borough | 60.3% | 32.1% (+28.2)#46 | 33.4% (+26.9)#823 |
| 47. | Centre Hall Borough | 60.1% | 32.1% (+28.0)#47 | 33.4% (+26.7)#860 |
| 48. | Conneautville Borough | 60.1% | 32.1% (+28.0)#48 | 33.4% (+26.7)#862 |
| 49. | Saltillo Borough | 60.1% | 32.1% (+28.0)#49 | 33.4% (+26.7)#864 |
| 50. | Muncy Borough | 60.0% | 32.1% (+27.9)#50 | 33.4% (+26.6)#871 |
| 51. | Montgomeryville | 59.9% | 32.1% (+27.8)#51 | 33.4% (+26.5)#876 |
| 52. | Folsom | 59.4% | 32.1% (+27.3)#52 | 33.4% (+26.0)#937 |
| 53. | Mcadoo Borough | 59.3% | 32.1% (+27.2)#53 | 33.4% (+25.9)#953 |
| 54. | Johnsonburg Borough | 59.3% | 32.1% (+27.2)#54 | 33.4% (+25.9)#954 |
| 55. | Spartansburg Borough | 59.3% | 32.1% (+27.2)#55 | 33.4% (+25.9)#966 |
| 56. | Glenfield Borough | 59.2% | 32.1% (+27.1)#56 | 33.4% (+25.8)#987 |
| 57. | Plum Borough | 58.8% | 32.1% (+26.7)#57 | 33.4% (+25.4)#1,024 |
| 58. | Westfield Borough | 58.7% | 32.1% (+26.6)#58 | 33.4% (+25.3)#1,046 |
| 59. | Lewistown Borough | 58.6% | 32.1% (+26.5)#59 | 33.4% (+25.2)#1,054 |
| 60. | Oklahoma Borough | 58.5% | 32.1% (+26.4)#60 | 33.4% (+25.1)#1,078 |
| 61. | Archbald Borough | 58.4% | 32.1% (+26.3)#61 | 33.4% (+25.0)#1,102 |
| 62. | Douglassville | 58.4% | 32.1% (+26.3)#62 | 33.4% (+25.0)#1,113 |
| 63. | Baden Borough | 58.3% | 32.1% (+26.2)#63 | 33.4% (+24.9)#1,119 |
| 64. | Shinglehouse Borough | 58.3% | 32.1% (+26.2)#64 | 33.4% (+24.9)#1,123 |
| 65. | Duryea Borough | 58.1% | 32.1% (+26.0)#65 | 33.4% (+24.7)#1,150 |
| 66. | Cochranton Borough | 58.1% | 32.1% (+26.0)#66 | 33.4% (+24.7)#1,157 |
| 67. | Abbottstown Borough | 57.9% | 32.1% (+25.8)#67 | 33.4% (+24.5)#1,171 |
| 68. | Northampton Borough | 57.7% | 32.1% (+25.6)#68 | 33.4% (+24.3)#1,190 |
| 69. | Paoli | 57.6% | 32.1% (+25.5)#69 | 33.4% (+24.2)#1,203 |
| 70. | Quarryville Borough | 57.6% | 32.1% (+25.5)#70 | 33.4% (+24.2)#1,209 |
| 71. | Lititz Borough | 57.5% | 32.1% (+25.4)#71 | 33.4% (+24.1)#1,220 |
| 72. | South Temple | 57.3% | 32.1% (+25.2)#72 | 33.4% (+23.9)#1,262 |
| 73. | Windber Borough | 57.2% | 32.1% (+25.1)#73 | 33.4% (+23.8)#1,288 |
| 74. | Rimersburg Borough | 57.2% | 32.1% (+25.1)#74 | 33.4% (+23.8)#1,298 |
| 75. | Bernville Borough | 57.1% | 32.1% (+25.0)#75 | 33.4% (+23.7)#1,314 |
| 76. | Rebersburg | 57.1% | 32.1% (+25.0)#76 | 33.4% (+23.7)#1,316 |
| 77. | Scottdale Borough | 56.8% | 32.1% (+24.7)#77 | 33.4% (+23.4)#1,337 |
| 78. | South Bethlehem Borough | 56.8% | 32.1% (+24.7)#78 | 33.4% (+23.4)#1,342 |
| 79. | Denver Borough | 56.7% | 32.1% (+24.6)#79 | 33.4% (+23.3)#1,350 |
| 80. | Monaca Borough | 56.4% | 32.1% (+24.3)#80 | 33.4% (+23.0)#1,424 |
| 81. | Hulmeville Borough | 56.4% | 32.1% (+24.3)#81 | 33.4% (+23.0)#1,434 |
| 82. | Carmichaels Borough | 56.4% | 32.1% (+24.3)#82 | 33.4% (+23.0)#1,438 |
| 83. | New Albany Borough | 56.4% | 32.1% (+24.3)#83 | 33.4% (+23.0)#1,439 |
| 84. | Berwyn | 56.2% | 32.1% (+24.1)#84 | 33.4% (+22.8)#1,472 |
| 85. | Glenburn | 56.0% | 32.1% (+23.9)#85 | 33.4% (+22.6)#1,497 |
| 86. | Arnold | 55.7% | 32.1% (+23.6)#86 | 33.4% (+22.3)#1,528 |
| 87. | Millvale Borough | 55.6% | 32.1% (+23.5)#87 | 33.4% (+22.2)#1,542 |
| 88. | Emsworth Borough | 55.5% | 32.1% (+23.4)#88 | 33.4% (+22.1)#1,560 |
| 89. | Mars Borough | 55.4% | 32.1% (+23.3)#89 | 33.4% (+22.0)#1,603 |
| 90. | Sykesville Borough | 55.3% | 32.1% (+23.2)#90 | 33.4% (+21.9)#1,626 |
| 91. | Sutersville Borough | 55.3% | 32.1% (+23.2)#91 | 33.4% (+21.9)#1,634 |
| 92. | Ambridge Borough | 55.1% | 32.1% (+23.0)#92 | 33.4% (+21.7)#1,660 |
| 93. | Freeburg Borough | 54.6% | 32.1% (+22.5)#93 | 33.4% (+21.2)#1,728 |
| 94. | Vandergrift Borough | 54.5% | 32.1% (+22.4)#94 | 33.4% (+21.1)#1,741 |
| 95. | Walnutport Borough | 54.5% | 32.1% (+22.4)#95 | 33.4% (+21.1)#1,747 |
| 96. | Paxtang Borough | 54.5% | 32.1% (+22.4)#96 | 33.4% (+21.1)#1,748 |
| 97. | Hellertown Borough | 54.4% | 32.1% (+22.3)#97 | 33.4% (+21.0)#1,773 |
| 98. | Smethport Borough | 54.4% | 32.1% (+22.3)#98 | 33.4% (+21.0)#1,775 |
| 99. | Rose Valley Borough | 54.3% | 32.1% (+22.2)#99 | 33.4% (+20.9)#1,794 |
| 100. | Ulysses Borough | 54.3% | 32.1% (+22.2)#100 | 33.4% (+20.9)#1,797 |
Common Questions
What are the Top 10 Cities with the Highest Percentage of Population Walking to Work in Pennsylvania?
Top 10 Cities with the Highest Percentage of Population Walking to Work in Pennsylvania are:
#1
87.0%
#2
63.5%
#3
62.5%
#4
61.5%
#5
61.5%
#6
61.4%
#7
61.2%
#8
61.1%
#9
59.9%
#10
59.4%
What city has the Highest Percentage of Population Walking to Work in Pennsylvania?
Broomall has the Highest Percentage of Population Walking to Work in Pennsylvania with 87.0%.
What is the Percentage of Population Walking to Work in the State of Pennsylvania?
Percentage of Population Walking to Work in Pennsylvania is 32.1%.
What is the Percentage of Population Walking to Work in the United States?
Percentage of Population Walking to Work in the United States is 33.4%.