Morro Bay, CA Map & Demographics
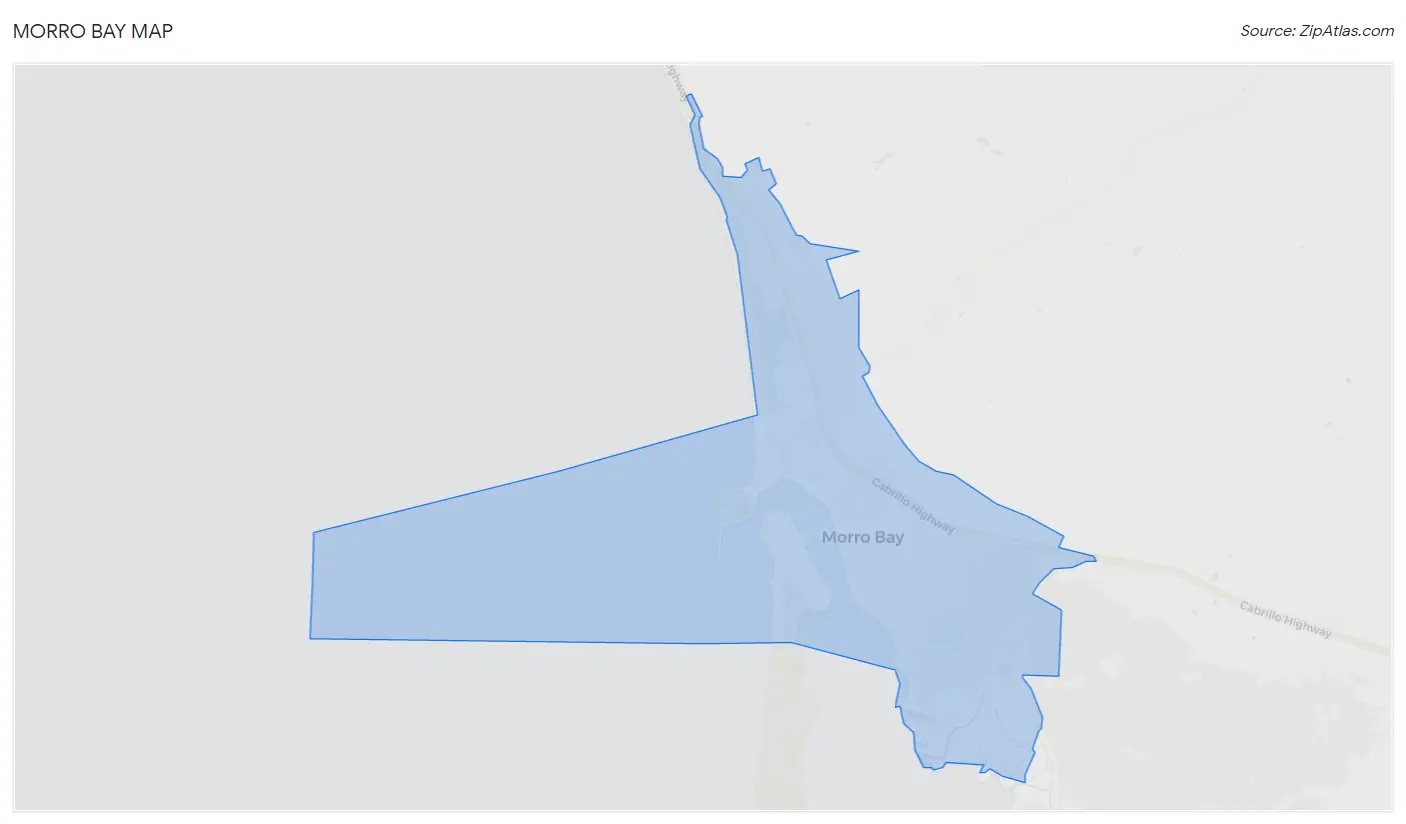
Morro Bay Map
Morro Bay Overview
$50,928
PER CAPITA INCOME
$111,801
AVG FAMILY INCOME
$88,547
AVG HOUSEHOLD INCOME
39.1%
WAGE / INCOME GAP [ % ]
60.9¢/ $1
WAGE / INCOME GAP [ $ ]
0.43
INEQUALITY / GINI INDEX
10,766
TOTAL POPULATION
5,258
MALE POPULATION
5,508
FEMALE POPULATION
95.46
MALES / 100 FEMALES
104.75
FEMALES / 100 MALES
52.1
MEDIAN AGE
2.8
AVG FAMILY SIZE
2.2
AVG HOUSEHOLD SIZE
5,493
LABOR FORCE [ PEOPLE ]
57.7%
PERCENT IN LABOR FORCE
9.2%
UNEMPLOYMENT RATE
Morro Bay Zip Codes
Morro Bay Area Codes
Income in Morro Bay
Income Overview in Morro Bay
Per Capita Income in Morro Bay is $50,928, while median incomes of families and households are $111,801 and $88,547 respectively.
| Characteristic | Number | Measure |
| Per Capita Income | 10,766 | $50,928 |
| Median Family Income | 2,783 | $111,801 |
| Mean Family Income | 2,783 | $133,899 |
| Median Household Income | 4,852 | $88,547 |
| Mean Household Income | 4,852 | $112,145 |
| Income Deficit | 2,783 | $0 |
| Wage / Income Gap (%) | 10,766 | 39.13% |
| Wage / Income Gap ($) | 10,766 | 60.87¢ per $1 |
| Gini / Inequality Index | 10,766 | 0.43 |
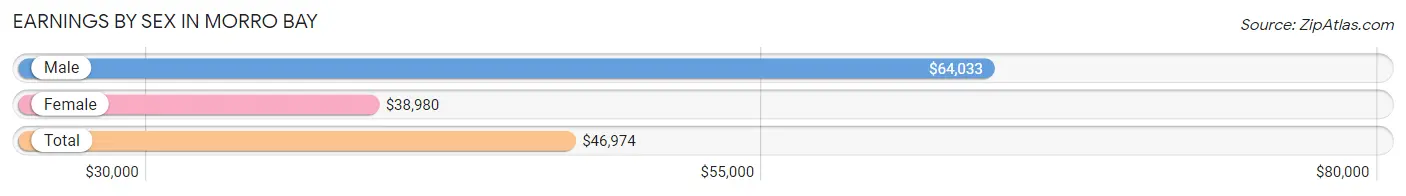
Earnings by Sex in Morro Bay
Average Earnings in Morro Bay are $46,974, $64,033 for men and $38,980 for women, a difference of 39.1%.
| Sex | Number | Average Earnings |
| Male | 2,981 (53.6%) | $64,033 |
| Female | 2,581 (46.4%) | $38,980 |
| Total | 5,562 (100.0%) | $46,974 |
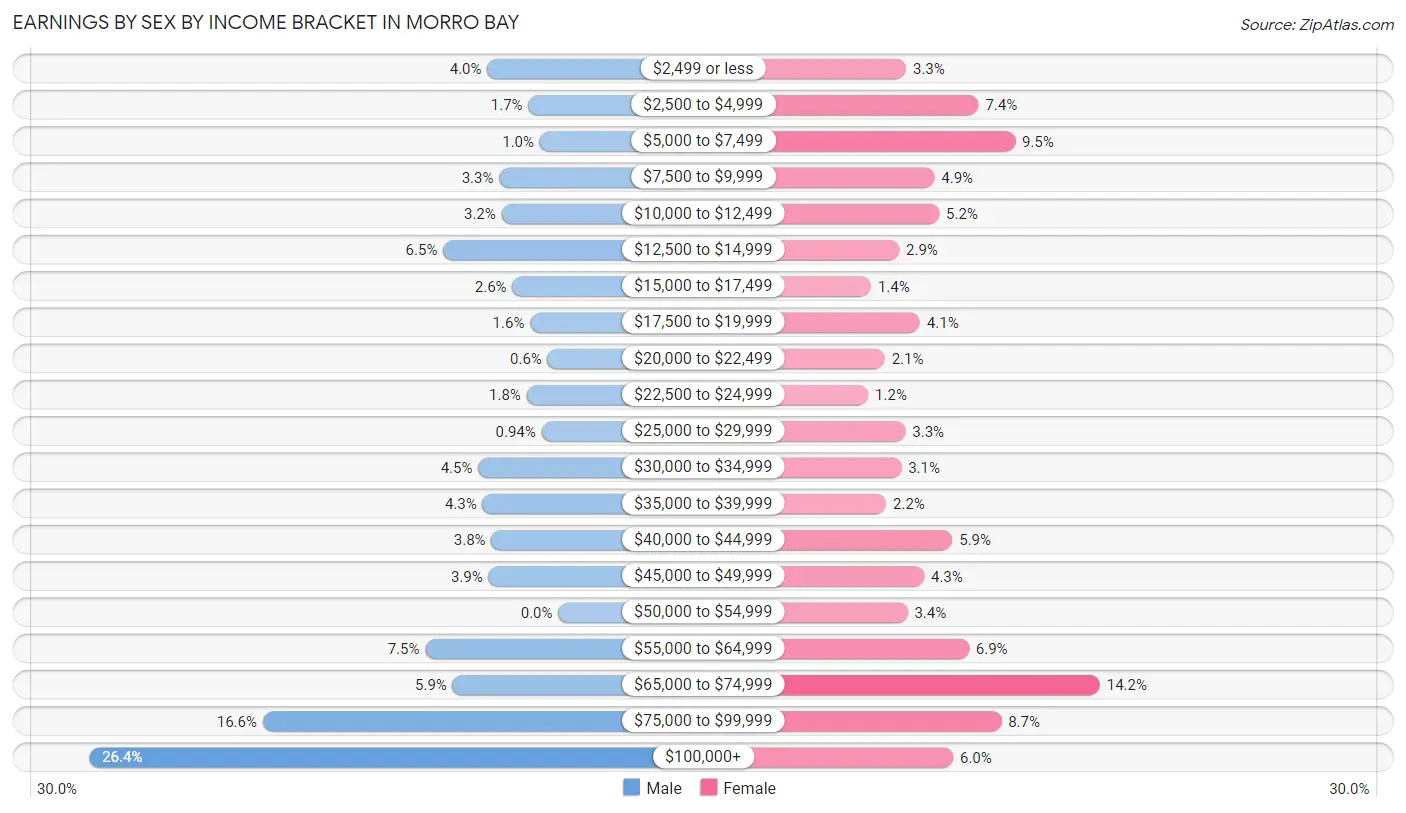
Earnings by Sex by Income Bracket in Morro Bay
The most common earnings brackets in Morro Bay are $100,000+ for men (786 | 26.4%) and $65,000 to $74,999 for women (367 | 14.2%).
| Income | Male | Female |
| $2,499 or less | 119 (4.0%) | 86 (3.3%) |
| $2,500 to $4,999 | 50 (1.7%) | 191 (7.4%) |
| $5,000 to $7,499 | 31 (1.0%) | 244 (9.5%) |
| $7,500 to $9,999 | 99 (3.3%) | 127 (4.9%) |
| $10,000 to $12,499 | 95 (3.2%) | 134 (5.2%) |
| $12,500 to $14,999 | 193 (6.5%) | 76 (2.9%) |
| $15,000 to $17,499 | 77 (2.6%) | 35 (1.4%) |
| $17,500 to $19,999 | 47 (1.6%) | 106 (4.1%) |
| $20,000 to $22,499 | 18 (0.6%) | 55 (2.1%) |
| $22,500 to $24,999 | 53 (1.8%) | 31 (1.2%) |
| $25,000 to $29,999 | 28 (0.9%) | 85 (3.3%) |
| $30,000 to $34,999 | 134 (4.5%) | 79 (3.1%) |
| $35,000 to $39,999 | 127 (4.3%) | 57 (2.2%) |
| $40,000 to $44,999 | 112 (3.8%) | 153 (5.9%) |
| $45,000 to $49,999 | 117 (3.9%) | 112 (4.3%) |
| $50,000 to $54,999 | 0 (0.0%) | 88 (3.4%) |
| $55,000 to $64,999 | 223 (7.5%) | 177 (6.9%) |
| $65,000 to $74,999 | 177 (5.9%) | 367 (14.2%) |
| $75,000 to $99,999 | 495 (16.6%) | 224 (8.7%) |
| $100,000+ | 786 (26.4%) | 154 (6.0%) |
| Total | 2,981 (100.0%) | 2,581 (100.0%) |
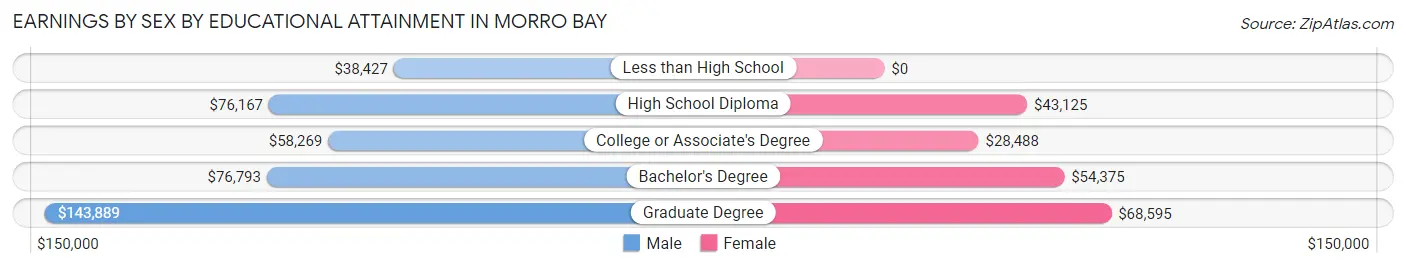
Earnings by Sex by Educational Attainment in Morro Bay
Average earnings in Morro Bay are $75,637 for men and $45,482 for women, a difference of 39.9%. Men with an educational attainment of graduate degree enjoy the highest average annual earnings of $143,889, while those with less than high school education earn the least with $38,427. Women with an educational attainment of graduate degree earn the most with the average annual earnings of $68,595, while those with college or associate's degree education have the smallest earnings of $28,488.
| Educational Attainment | Male Income | Female Income |
| Less than High School | $38,427 | $0 |
| High School Diploma | $76,167 | $43,125 |
| College or Associate's Degree | $58,269 | $28,488 |
| Bachelor's Degree | $76,793 | $54,375 |
| Graduate Degree | $143,889 | $68,595 |
| Total | $75,637 | $45,482 |
Family Income in Morro Bay
Family Income Brackets in Morro Bay
According to the Morro Bay family income data, there are 718 families falling into the $100,000 to $149,999 income range, which is the most common income bracket and makes up 25.8% of all families. Conversely, the $25,000 to $34,999 income bracket is the least frequent group with only 17 families (0.6%) belonging to this category.
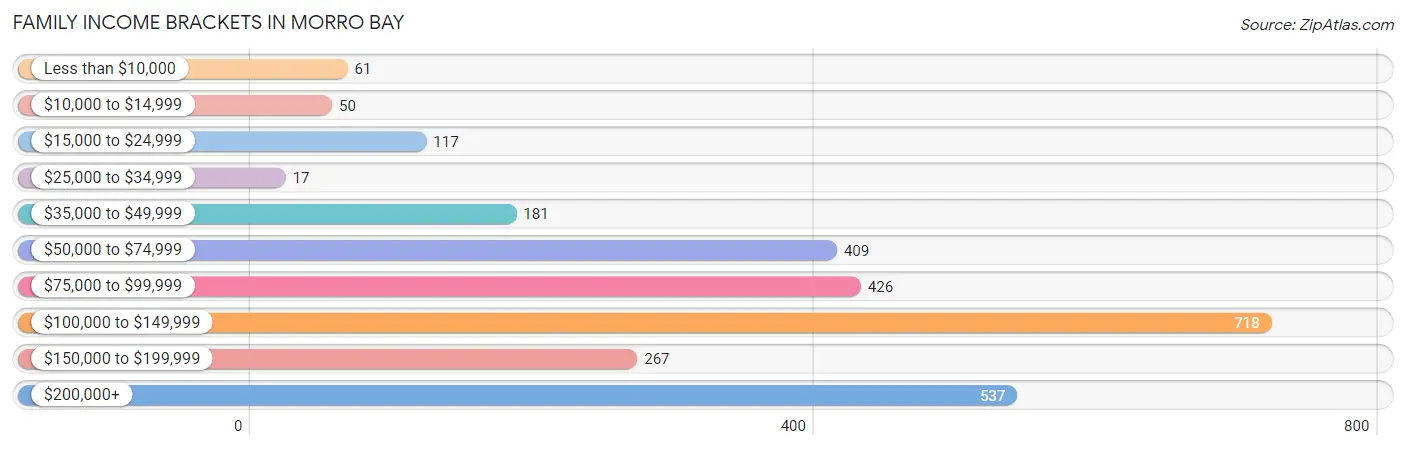
| Income Bracket | # Families | % Families |
| Less than $10,000 | 61 | 2.2% |
| $10,000 to $14,999 | 50 | 1.8% |
| $15,000 to $24,999 | 117 | 4.2% |
| $25,000 to $34,999 | 17 | 0.6% |
| $35,000 to $49,999 | 181 | 6.5% |
| $50,000 to $74,999 | 409 | 14.7% |
| $75,000 to $99,999 | 426 | 15.3% |
| $100,000 to $149,999 | 718 | 25.8% |
| $150,000 to $199,999 | 267 | 9.6% |
| $200,000+ | 537 | 19.3% |
Family Income by Famaliy Size in Morro Bay
4-person families (324 | 11.6%) account for the highest median family income in Morro Bay with $136,607 per family, while 2-person families (1,645 | 59.1%) have the highest median income of $53,890 per family member.
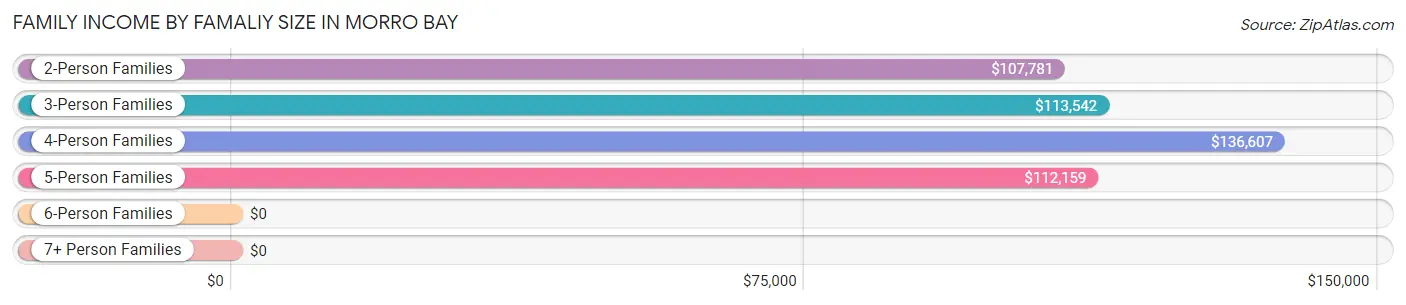
| Income Bracket | # Families | Median Income |
| 2-Person Families | 1,645 (59.1%) | $107,781 |
| 3-Person Families | 653 (23.5%) | $113,542 |
| 4-Person Families | 324 (11.6%) | $136,607 |
| 5-Person Families | 60 (2.2%) | $112,159 |
| 6-Person Families | 60 (2.2%) | $0 |
| 7+ Person Families | 41 (1.5%) | $0 |
| Total | 2,783 (100.0%) | $111,801 |
Family Income by Number of Earners in Morro Bay
The median family income in Morro Bay is $111,801, with families comprising 2 earners (1,049) having the highest median family income of $142,969, while families with 1 earner (767) have the lowest median family income of $91,375, accounting for 37.7% and 27.6% of families, respectively.
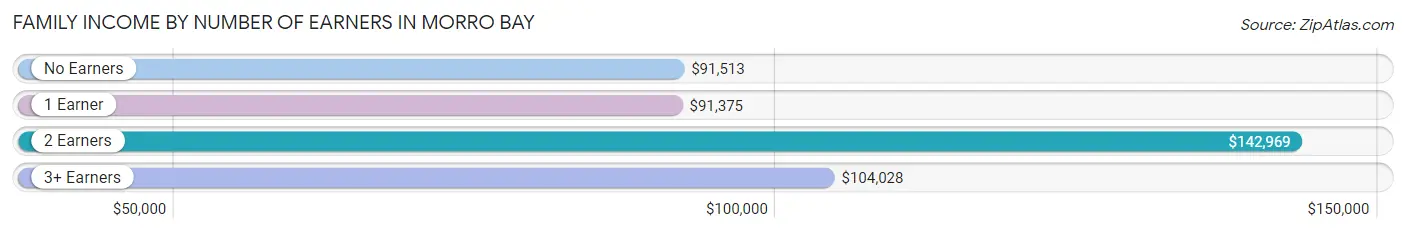
| Number of Earners | # Families | Median Income |
| No Earners | 707 (25.4%) | $91,513 |
| 1 Earner | 767 (27.6%) | $91,375 |
| 2 Earners | 1,049 (37.7%) | $142,969 |
| 3+ Earners | 260 (9.3%) | $104,028 |
| Total | 2,783 (100.0%) | $111,801 |
Household Income in Morro Bay
Household Income Brackets in Morro Bay
With 1,063 households falling in the category, the $100,000 to $149,999 income range is the most frequent in Morro Bay, accounting for 21.9% of all households. In contrast, only 146 households (3.0%) fall into the $10,000 to $14,999 income bracket, making it the least populous group.
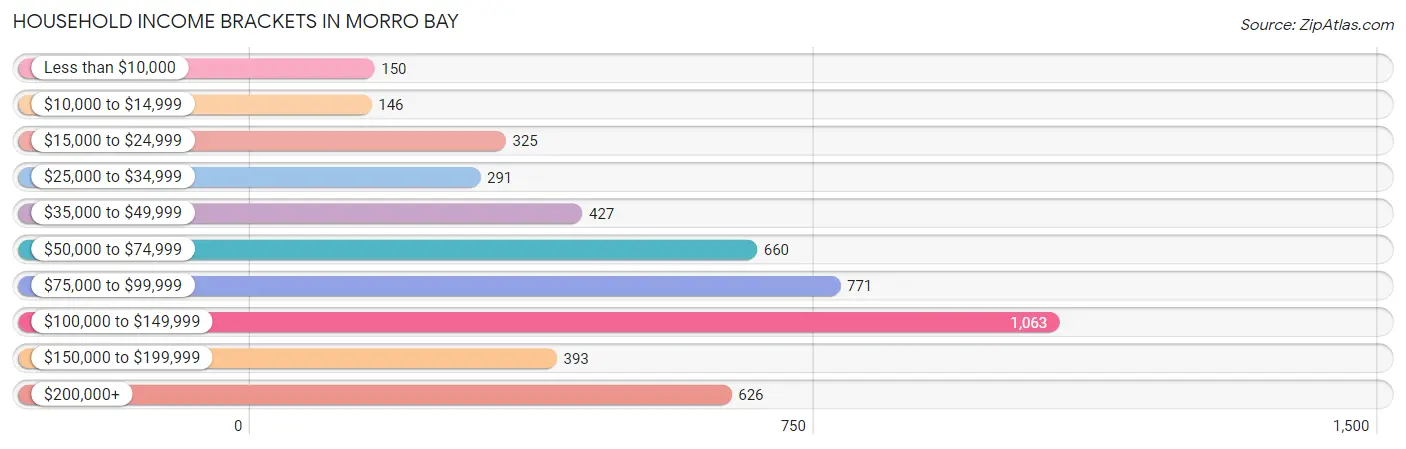
| Income Bracket | # Households | % Households |
| Less than $10,000 | 150 | 3.1% |
| $10,000 to $14,999 | 146 | 3.0% |
| $15,000 to $24,999 | 325 | 6.7% |
| $25,000 to $34,999 | 291 | 6.0% |
| $35,000 to $49,999 | 427 | 8.8% |
| $50,000 to $74,999 | 660 | 13.6% |
| $75,000 to $99,999 | 771 | 15.9% |
| $100,000 to $149,999 | 1,063 | 21.9% |
| $150,000 to $199,999 | 393 | 8.1% |
| $200,000+ | 626 | 12.9% |
Household Income by Householder Age in Morro Bay
The median household income in Morro Bay is $88,547, with the highest median household income of $91,939 found in the 45 to 64 years age bracket for the primary householder. A total of 1,699 households (35.0%) fall into this category. Meanwhile, the 15 to 24 years age bracket for the primary householder has the lowest median household income of $56,786, with 188 households (3.9%) in this group.
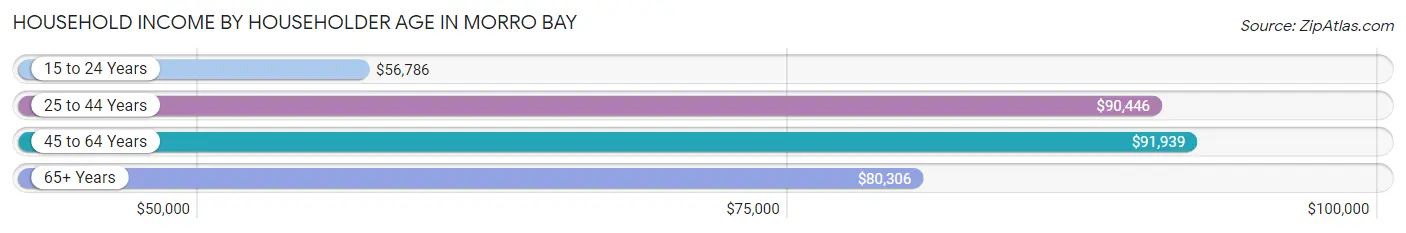
| Income Bracket | # Households | Median Income |
| 15 to 24 Years | 188 (3.9%) | $56,786 |
| 25 to 44 Years | 996 (20.5%) | $90,446 |
| 45 to 64 Years | 1,699 (35.0%) | $91,939 |
| 65+ Years | 1,969 (40.6%) | $80,306 |
| Total | 4,852 (100.0%) | $88,547 |
Poverty in Morro Bay
Income Below Poverty by Sex and Age in Morro Bay
With 9.5% poverty level for males and 10.0% for females among the residents of Morro Bay, 5 year old males and 16 and 17 year old females are the most vulnerable to poverty, with 13 males (50.0%) and 24 females (39.3%) in their respective age groups living below the poverty level.
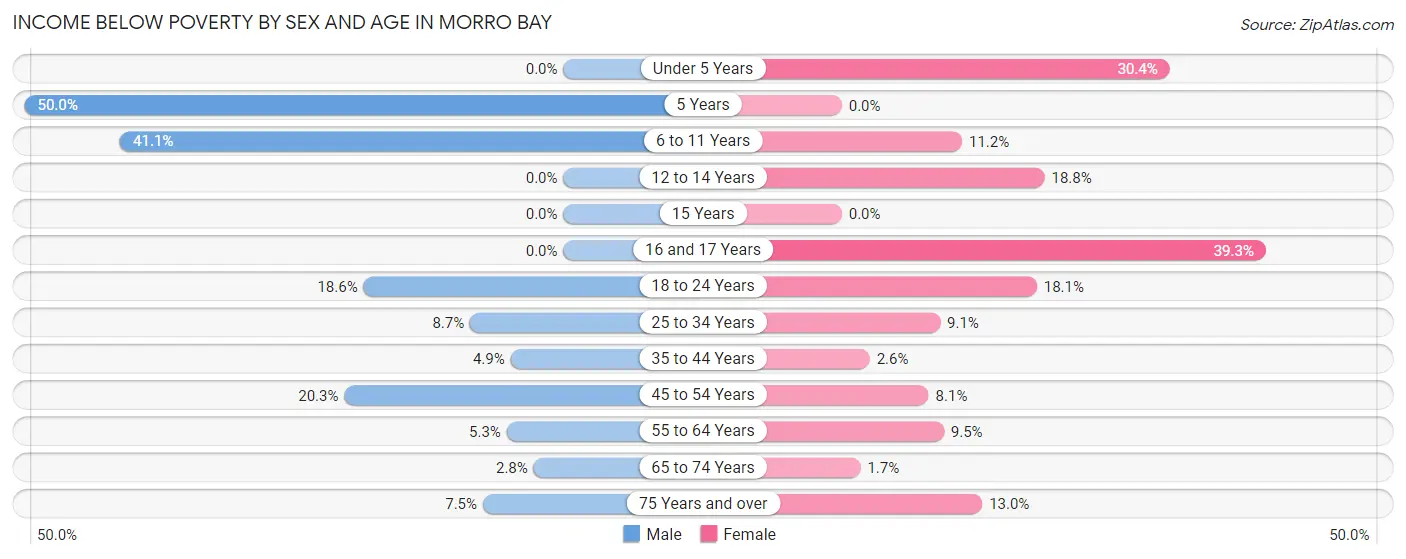
| Age Bracket | Male | Female |
| Under 5 Years | 0 (0.0%) | 70 (30.4%) |
| 5 Years | 13 (50.0%) | 0 (0.0%) |
| 6 to 11 Years | 95 (41.1%) | 25 (11.2%) |
| 12 to 14 Years | 0 (0.0%) | 16 (18.8%) |
| 15 Years | 0 (0.0%) | 0 (0.0%) |
| 16 and 17 Years | 0 (0.0%) | 24 (39.3%) |
| 18 to 24 Years | 95 (18.5%) | 95 (18.1%) |
| 25 to 34 Years | 56 (8.7%) | 57 (9.1%) |
| 35 to 44 Years | 22 (4.9%) | 11 (2.6%) |
| 45 to 54 Years | 98 (20.3%) | 57 (8.1%) |
| 55 to 64 Years | 52 (5.3%) | 92 (9.5%) |
| 65 to 74 Years | 28 (2.8%) | 15 (1.7%) |
| 75 Years and over | 34 (7.5%) | 80 (13.0%) |
| Total | 493 (9.5%) | 542 (10.0%) |
Income Above Poverty by Sex and Age in Morro Bay
According to the poverty statistics in Morro Bay, males aged under 5 years and females aged 5 years are the age groups that are most secure financially, with 100.0% of males and 100.0% of females in these age groups living above the poverty line.
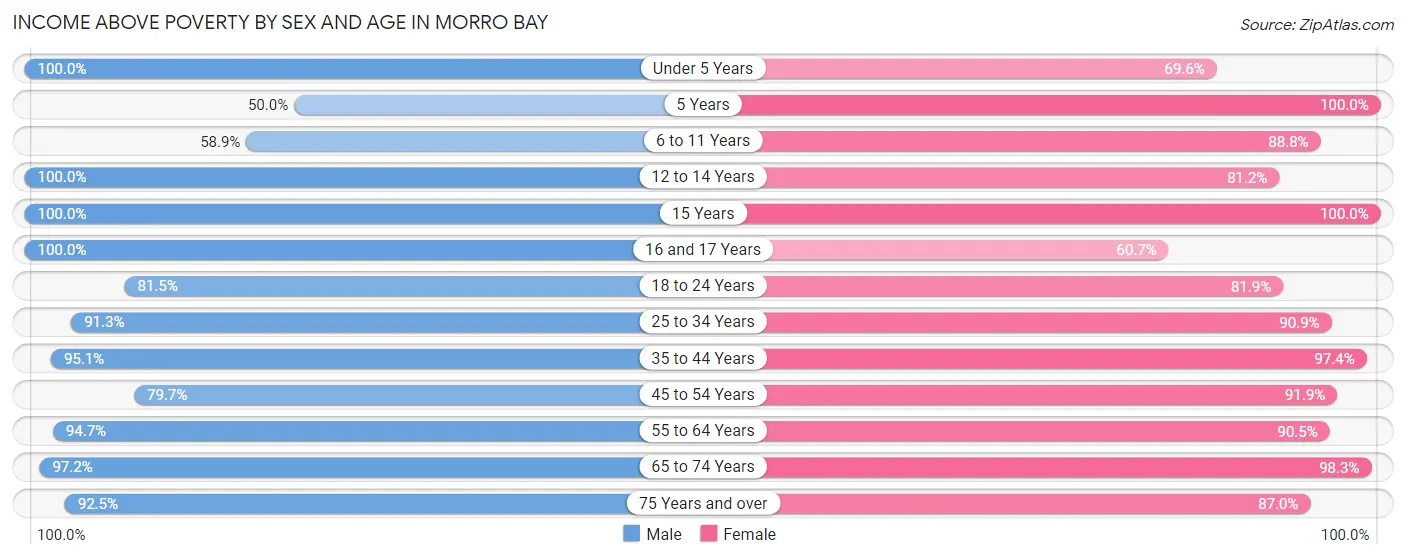
| Age Bracket | Male | Female |
| Under 5 Years | 105 (100.0%) | 160 (69.6%) |
| 5 Years | 13 (50.0%) | 32 (100.0%) |
| 6 to 11 Years | 136 (58.9%) | 199 (88.8%) |
| 12 to 14 Years | 48 (100.0%) | 69 (81.2%) |
| 15 Years | 201 (100.0%) | 44 (100.0%) |
| 16 and 17 Years | 42 (100.0%) | 37 (60.7%) |
| 18 to 24 Years | 417 (81.5%) | 430 (81.9%) |
| 25 to 34 Years | 591 (91.3%) | 568 (90.9%) |
| 35 to 44 Years | 427 (95.1%) | 413 (97.4%) |
| 45 to 54 Years | 384 (79.7%) | 650 (91.9%) |
| 55 to 64 Years | 937 (94.7%) | 879 (90.5%) |
| 65 to 74 Years | 988 (97.2%) | 851 (98.3%) |
| 75 Years and over | 421 (92.5%) | 534 (87.0%) |
| Total | 4,710 (90.5%) | 4,866 (90.0%) |
Income Below Poverty Among Married-Couple Families in Morro Bay
The poverty statistics for married-couple families in Morro Bay show that 3.4% or 73 of the total 2,176 families live below the poverty line. Families with 1 or 2 children have the highest poverty rate of 9.6%, comprising of 49 families. On the other hand, families with 3 or 4 children have the lowest poverty rate of 0.0%, which includes 0 families.
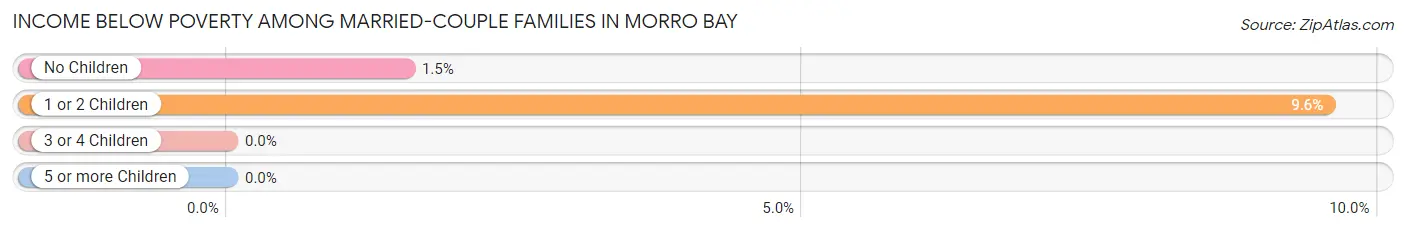
| Children | Above Poverty | Below Poverty |
| No Children | 1,539 (98.5%) | 24 (1.5%) |
| 1 or 2 Children | 464 (90.4%) | 49 (9.6%) |
| 3 or 4 Children | 100 (100.0%) | 0 (0.0%) |
| 5 or more Children | 0 (0.0%) | 0 (0.0%) |
| Total | 2,103 (96.7%) | 73 (3.4%) |
Income Below Poverty Among Single-Parent Households in Morro Bay
According to the poverty data in Morro Bay, 19.4% or 49 single-father households and 19.2% or 68 single-mother households are living below the poverty line. Among single-father households, those with 1 or 2 children have the highest poverty rate, with 38 households (47.5%) experiencing poverty. Likewise, among single-mother households, those with 3 or 4 children have the highest poverty rate, with 27 households (100.0%) falling below the poverty line.
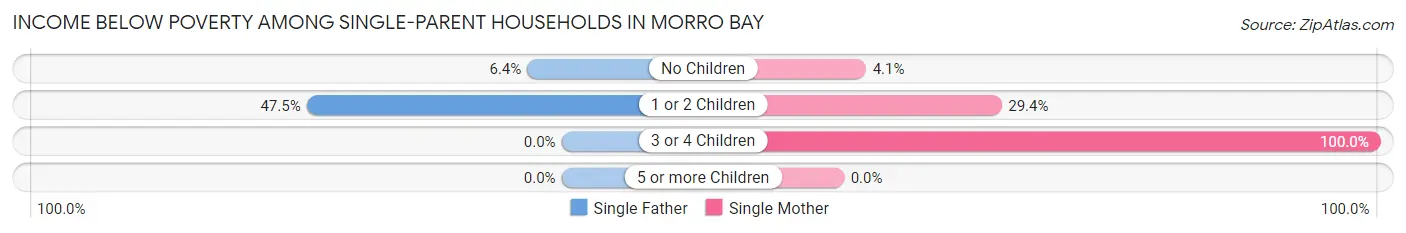
| Children | Single Father | Single Mother |
| No Children | 11 (6.4%) | 9 (4.1%) |
| 1 or 2 Children | 38 (47.5%) | 32 (29.4%) |
| 3 or 4 Children | 0 (0.0%) | 27 (100.0%) |
| 5 or more Children | 0 (0.0%) | 0 (0.0%) |
| Total | 49 (19.4%) | 68 (19.2%) |
Income Below Poverty Among Married-Couple vs Single-Parent Households in Morro Bay
The poverty data for Morro Bay shows that 73 of the married-couple family households (3.4%) and 117 of the single-parent households (19.3%) are living below the poverty level. Within the married-couple family households, those with 1 or 2 children have the highest poverty rate, with 49 households (9.6%) falling below the poverty line. Among the single-parent households, those with 3 or 4 children have the highest poverty rate, with 27 household (100.0%) living below poverty.
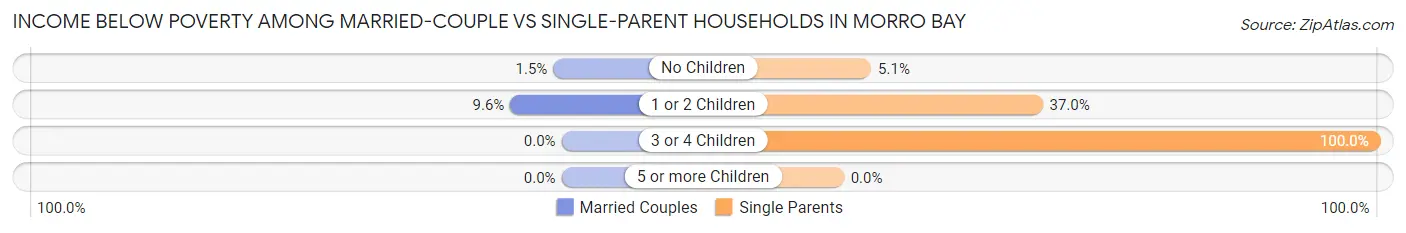
| Children | Married-Couple Families | Single-Parent Households |
| No Children | 24 (1.5%) | 20 (5.1%) |
| 1 or 2 Children | 49 (9.6%) | 70 (37.0%) |
| 3 or 4 Children | 0 (0.0%) | 27 (100.0%) |
| 5 or more Children | 0 (0.0%) | 0 (0.0%) |
| Total | 73 (3.4%) | 117 (19.3%) |
Race in Morro Bay
The most populous races in Morro Bay are White / Caucasian (8,459 | 78.6%), Hispanic or Latino (1,513 | 14.1%), and Some other Race (910 | 8.5%).
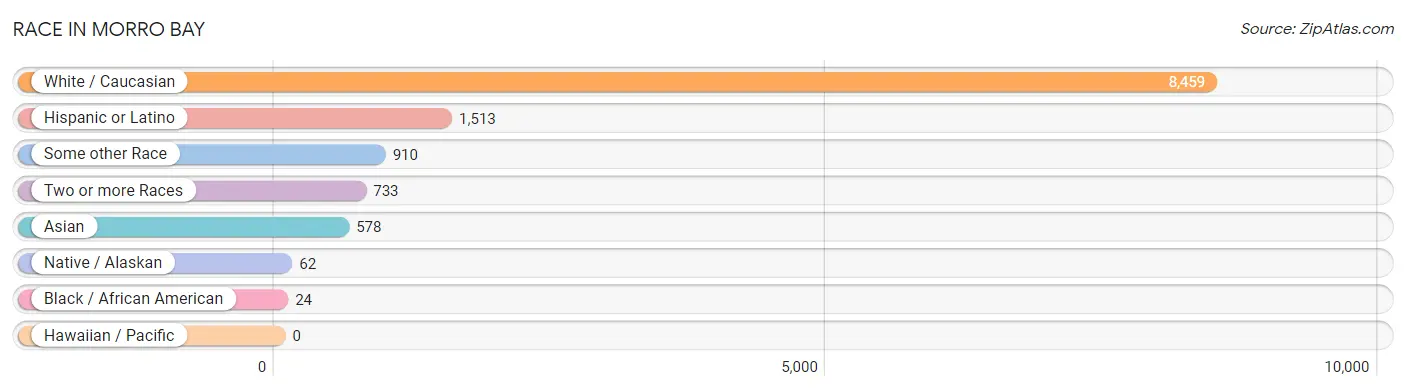
| Race | # Population | % Population |
| Asian | 578 | 5.4% |
| Black / African American | 24 | 0.2% |
| Hawaiian / Pacific | 0 | 0.0% |
| Hispanic or Latino | 1,513 | 14.1% |
| Native / Alaskan | 62 | 0.6% |
| White / Caucasian | 8,459 | 78.6% |
| Two or more Races | 733 | 6.8% |
| Some other Race | 910 | 8.5% |
| Total | 10,766 | 100.0% |
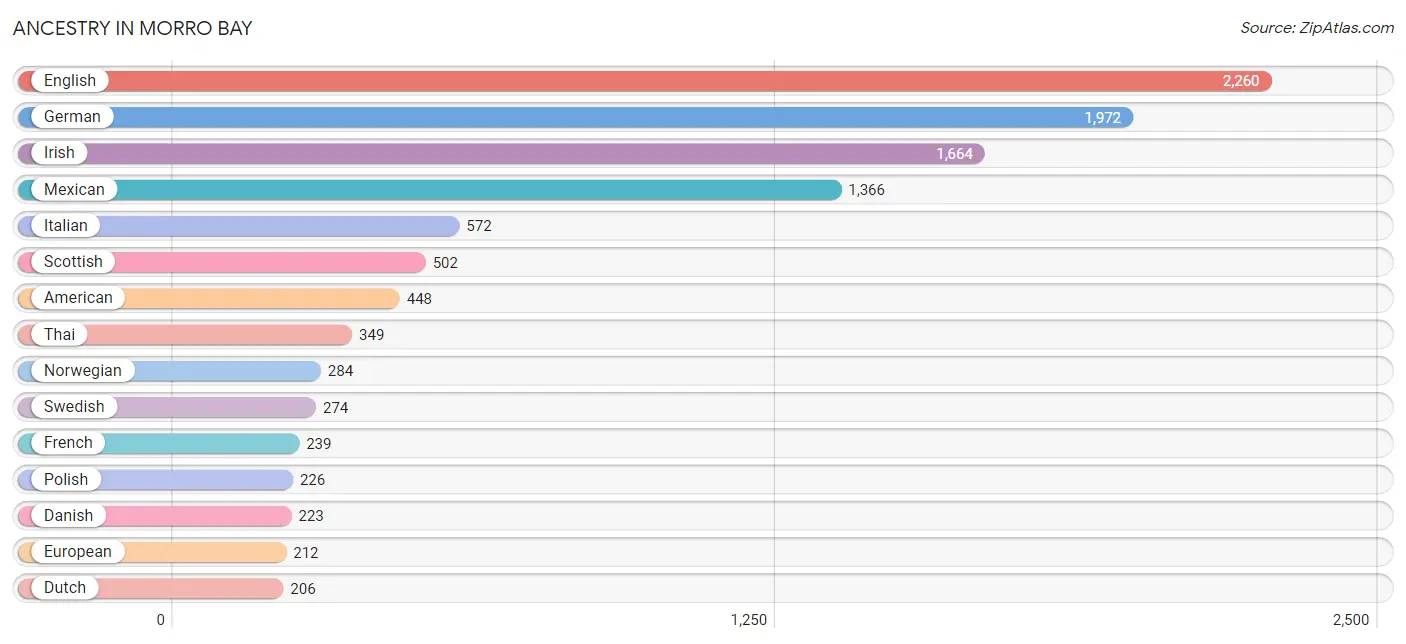
Ancestry in Morro Bay
The most populous ancestries reported in Morro Bay are English (2,260 | 21.0%), German (1,972 | 18.3%), Irish (1,664 | 15.5%), Mexican (1,366 | 12.7%), and Italian (572 | 5.3%), together accounting for 72.8% of all Morro Bay residents.
| Ancestry | # Population | % Population |
| American | 448 | 4.2% |
| Arab | 37 | 0.3% |
| Armenian | 33 | 0.3% |
| Austrian | 23 | 0.2% |
| Bhutanese | 39 | 0.4% |
| Blackfeet | 24 | 0.2% |
| British | 14 | 0.1% |
| Burmese | 14 | 0.1% |
| Canadian | 18 | 0.2% |
| Celtic | 30 | 0.3% |
| Cherokee | 41 | 0.4% |
| Choctaw | 33 | 0.3% |
| Colombian | 7 | 0.1% |
| Croatian | 202 | 1.9% |
| Czech | 31 | 0.3% |
| Danish | 223 | 2.1% |
| Dutch | 206 | 1.9% |
| Eastern European | 27 | 0.3% |
| Ecuadorian | 26 | 0.2% |
| English | 2,260 | 21.0% |
| European | 212 | 2.0% |
| French | 239 | 2.2% |
| French Canadian | 61 | 0.6% |
| German | 1,972 | 18.3% |
| German Russian | 8 | 0.1% |
| Greek | 36 | 0.3% |
| Houma | 11 | 0.1% |
| Hungarian | 48 | 0.4% |
| Indian (Asian) | 27 | 0.3% |
| Irish | 1,664 | 15.5% |
| Italian | 572 | 5.3% |
| Korean | 109 | 1.0% |
| Lithuanian | 24 | 0.2% |
| Mexican | 1,366 | 12.7% |
| Mexican American Indian | 6 | 0.1% |
| Northern European | 65 | 0.6% |
| Norwegian | 284 | 2.6% |
| Polish | 226 | 2.1% |
| Portuguese | 100 | 0.9% |
| Puerto Rican | 21 | 0.2% |
| Romanian | 33 | 0.3% |
| Russian | 127 | 1.2% |
| Scandinavian | 94 | 0.9% |
| Scotch-Irish | 119 | 1.1% |
| Scottish | 502 | 4.7% |
| Serbian | 202 | 1.9% |
| Slavic | 11 | 0.1% |
| Slovak | 8 | 0.1% |
| Slovene | 22 | 0.2% |
| South American | 33 | 0.3% |
| Spaniard | 9 | 0.1% |
| Spanish | 28 | 0.3% |
| Sri Lankan | 97 | 0.9% |
| Swedish | 274 | 2.5% |
| Swiss | 115 | 1.1% |
| Syrian | 25 | 0.2% |
| Thai | 349 | 3.2% |
| Ukrainian | 14 | 0.1% |
| Welsh | 110 | 1.0% |
| Yugoslavian | 19 | 0.2% | View All 60 Rows |
Immigrants in Morro Bay
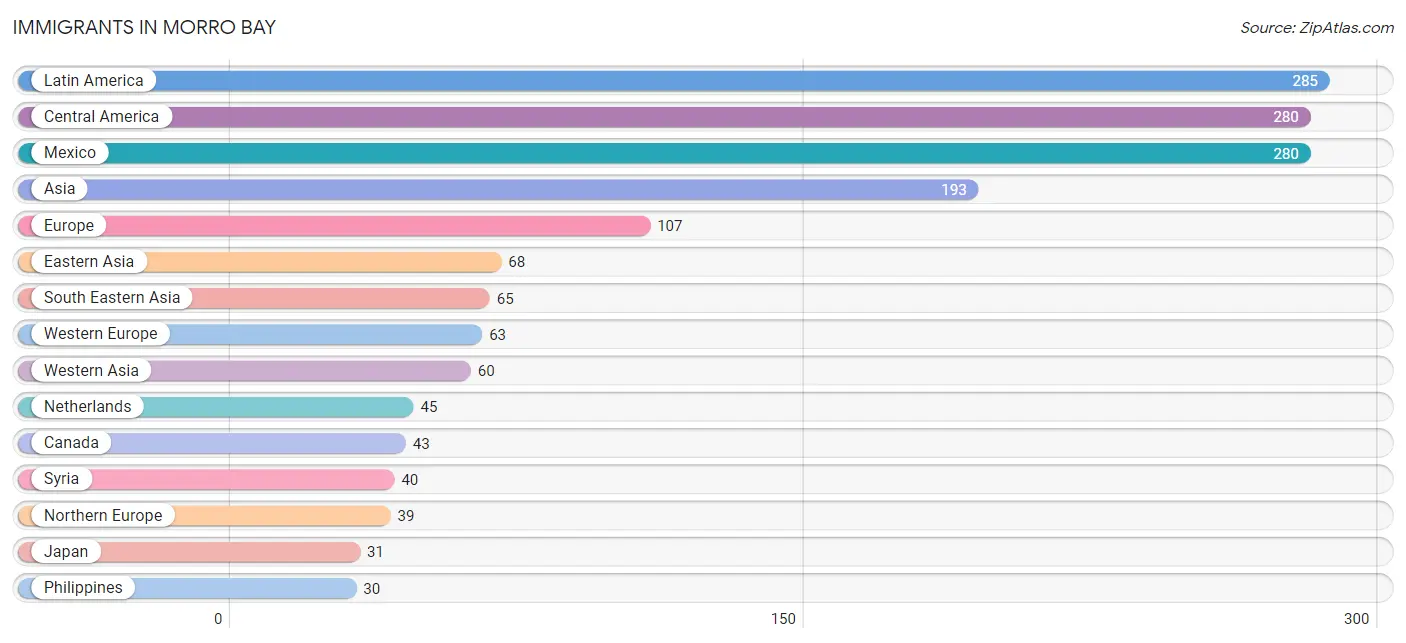
The most numerous immigrant groups reported in Morro Bay came from Latin America (285 | 2.6%), Central America (280 | 2.6%), Mexico (280 | 2.6%), Asia (193 | 1.8%), and Europe (107 | 1.0%), together accounting for 10.6% of all Morro Bay residents.
| Immigration Origin | # Population | % Population |
| Argentina | 5 | 0.1% |
| Armenia | 8 | 0.1% |
| Asia | 193 | 1.8% |
| Azores | 5 | 0.1% |
| Canada | 43 | 0.4% |
| Central America | 280 | 2.6% |
| China | 23 | 0.2% |
| Eastern Asia | 68 | 0.6% |
| Europe | 107 | 1.0% |
| Germany | 18 | 0.2% |
| Indonesia | 9 | 0.1% |
| Ireland | 6 | 0.1% |
| Japan | 31 | 0.3% |
| Korea | 14 | 0.1% |
| Kuwait | 12 | 0.1% |
| Latin America | 285 | 2.6% |
| Mexico | 280 | 2.6% |
| Netherlands | 45 | 0.4% |
| Northern Europe | 39 | 0.4% |
| Norway | 6 | 0.1% |
| Philippines | 30 | 0.3% |
| Portugal | 5 | 0.1% |
| Scotland | 27 | 0.3% |
| South America | 5 | 0.1% |
| South Eastern Asia | 65 | 0.6% |
| Southern Europe | 5 | 0.1% |
| Syria | 40 | 0.4% |
| Vietnam | 26 | 0.2% |
| Western Asia | 60 | 0.6% |
| Western Europe | 63 | 0.6% | View All 30 Rows |
Sex and Age in Morro Bay
Sex and Age in Morro Bay
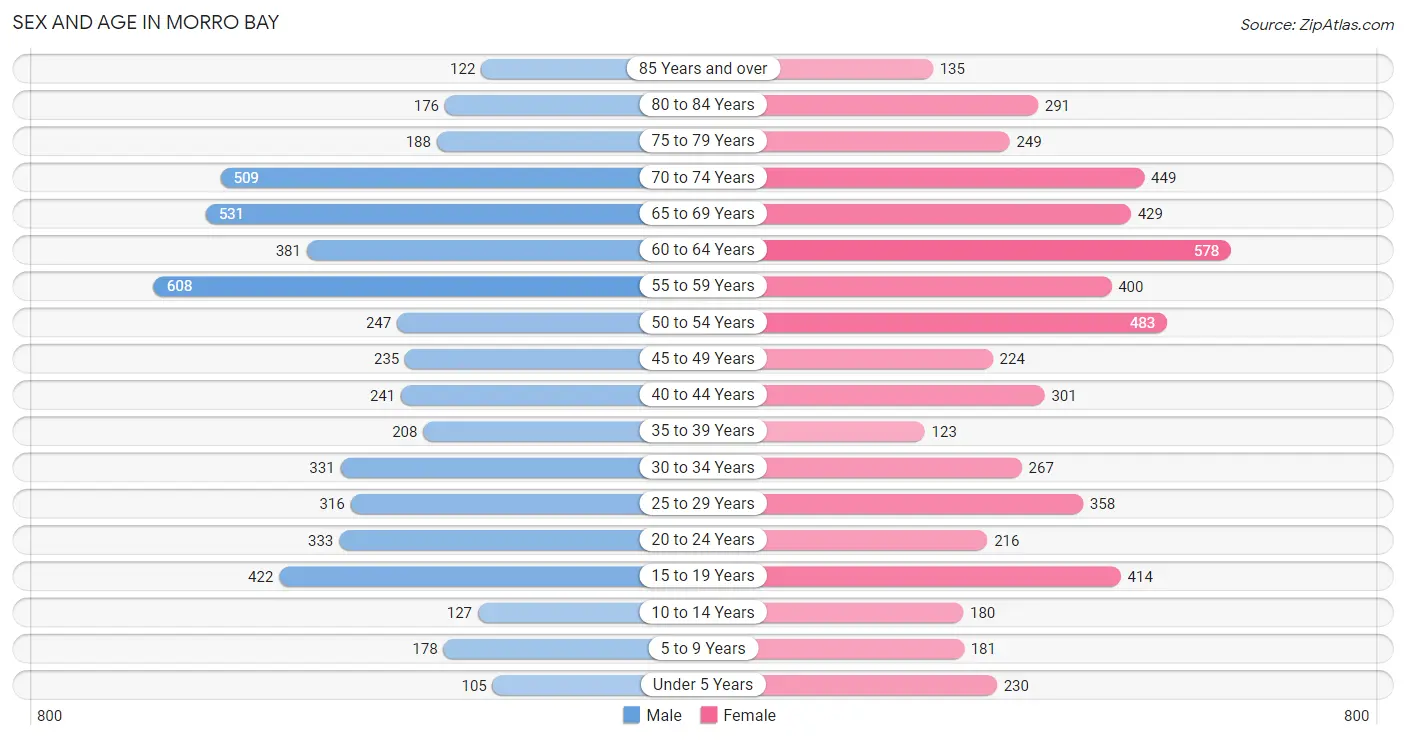
The most populous age groups in Morro Bay are 55 to 59 Years (608 | 11.6%) for men and 60 to 64 Years (578 | 10.5%) for women.
| Age Bracket | Male | Female |
| Under 5 Years | 105 (2.0%) | 230 (4.2%) |
| 5 to 9 Years | 178 (3.4%) | 181 (3.3%) |
| 10 to 14 Years | 127 (2.4%) | 180 (3.3%) |
| 15 to 19 Years | 422 (8.0%) | 414 (7.5%) |
| 20 to 24 Years | 333 (6.3%) | 216 (3.9%) |
| 25 to 29 Years | 316 (6.0%) | 358 (6.5%) |
| 30 to 34 Years | 331 (6.3%) | 267 (4.9%) |
| 35 to 39 Years | 208 (4.0%) | 123 (2.2%) |
| 40 to 44 Years | 241 (4.6%) | 301 (5.5%) |
| 45 to 49 Years | 235 (4.5%) | 224 (4.1%) |
| 50 to 54 Years | 247 (4.7%) | 483 (8.8%) |
| 55 to 59 Years | 608 (11.6%) | 400 (7.3%) |
| 60 to 64 Years | 381 (7.2%) | 578 (10.5%) |
| 65 to 69 Years | 531 (10.1%) | 429 (7.8%) |
| 70 to 74 Years | 509 (9.7%) | 449 (8.2%) |
| 75 to 79 Years | 188 (3.6%) | 249 (4.5%) |
| 80 to 84 Years | 176 (3.4%) | 291 (5.3%) |
| 85 Years and over | 122 (2.3%) | 135 (2.5%) |
| Total | 5,258 (100.0%) | 5,508 (100.0%) |
Families and Households in Morro Bay
Median Family Size in Morro Bay
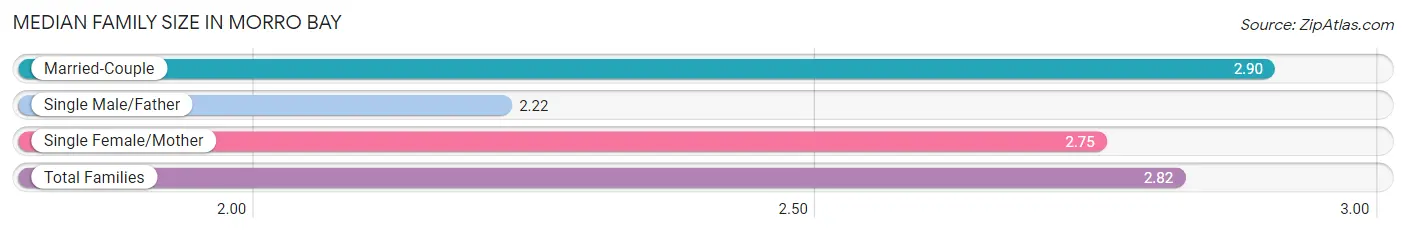
The median family size in Morro Bay is 2.82 persons per family, with married-couple families (2,176 | 78.2%) accounting for the largest median family size of 2.9 persons per family. On the other hand, single male/father families (252 | 9.0%) represent the smallest median family size with 2.22 persons per family.
| Family Type | # Families | Family Size |
| Married-Couple | 2,176 (78.2%) | 2.90 |
| Single Male/Father | 252 (9.0%) | 2.22 |
| Single Female/Mother | 355 (12.8%) | 2.75 |
| Total Families | 2,783 (100.0%) | 2.82 |
Median Household Size in Morro Bay
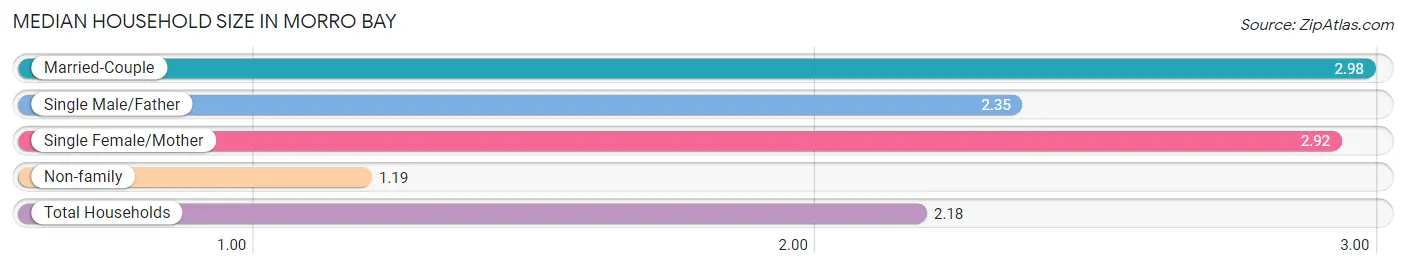
The median household size in Morro Bay is 2.18 persons per household, with married-couple households (2,176 | 44.9%) accounting for the largest median household size of 2.98 persons per household. non-family households (2,069 | 42.6%) represent the smallest median household size with 1.19 persons per household.
| Household Type | # Households | Household Size |
| Married-Couple | 2,176 (44.9%) | 2.98 |
| Single Male/Father | 252 (5.2%) | 2.35 |
| Single Female/Mother | 355 (7.3%) | 2.92 |
| Non-family | 2,069 (42.6%) | 1.19 |
| Total Households | 4,852 (100.0%) | 2.18 |
Household Size by Marriage Status in Morro Bay
Out of a total of 4,852 households in Morro Bay, 2,783 (57.4%) are family households, while 2,069 (42.6%) are nonfamily households. The most numerous type of family households are 2-person households, comprising 1,554, and the most common type of nonfamily households are 1-person households, comprising 1,721.
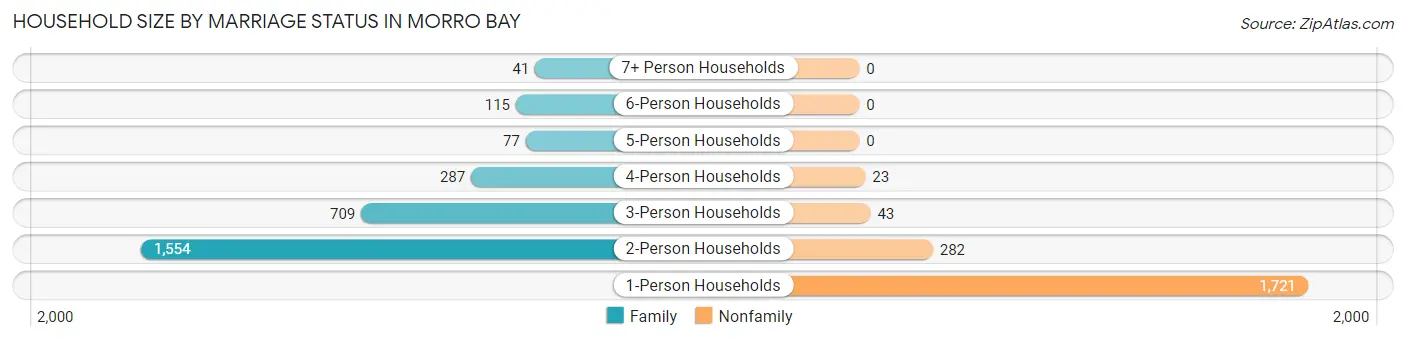
| Household Size | Family Households | Nonfamily Households |
| 1-Person Households | - | 1,721 (35.5%) |
| 2-Person Households | 1,554 (32.0%) | 282 (5.8%) |
| 3-Person Households | 709 (14.6%) | 43 (0.9%) |
| 4-Person Households | 287 (5.9%) | 23 (0.5%) |
| 5-Person Households | 77 (1.6%) | 0 (0.0%) |
| 6-Person Households | 115 (2.4%) | 0 (0.0%) |
| 7+ Person Households | 41 (0.9%) | 0 (0.0%) |
| Total | 2,783 (57.4%) | 2,069 (42.6%) |
Female Fertility in Morro Bay
Fertility by Age in Morro Bay
Average fertility rate in Morro Bay is 21.0 births per 1,000 women. Women in the age bracket of 20 to 34 years have the highest fertility rate with 43.0 births per 1,000 women. Women in the age bracket of 20 to 34 years acount for 90.0% of all women with births.
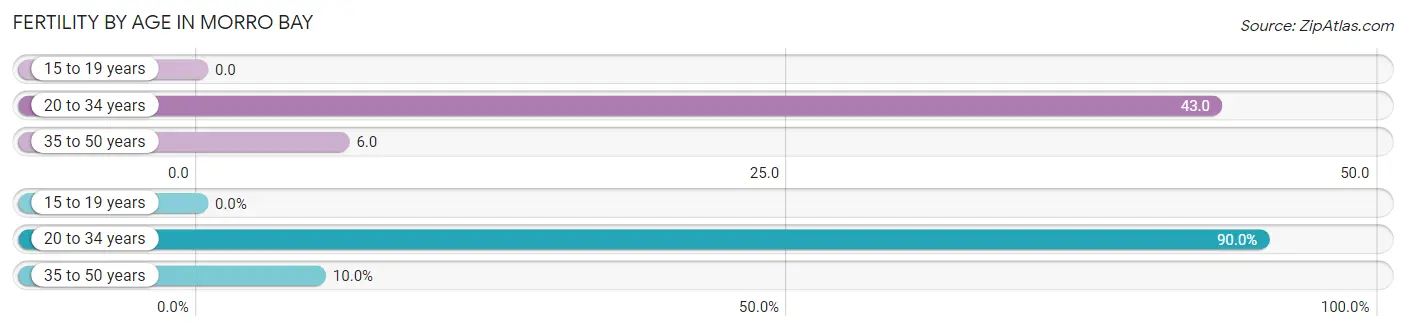
| Age Bracket | Women with Births | Births / 1,000 Women |
| 15 to 19 years | 0 (0.0%) | 0.0 |
| 20 to 34 years | 36 (90.0%) | 43.0 |
| 35 to 50 years | 4 (10.0%) | 6.0 |
| Total | 40 (100.0%) | 21.0 |
Fertility by Age by Marriage Status in Morro Bay
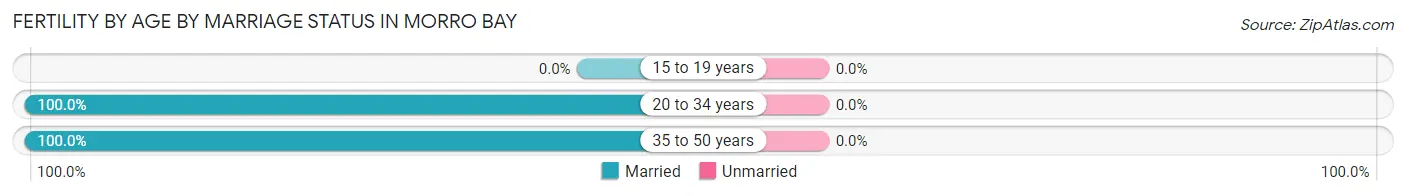
| Age Bracket | Married | Unmarried |
| 15 to 19 years | 0 (0.0%) | 0 (0.0%) |
| 20 to 34 years | 36 (100.0%) | 0 (0.0%) |
| 35 to 50 years | 4 (100.0%) | 0 (0.0%) |
| Total | 40 (100.0%) | 0 (0.0%) |
Fertility by Education in Morro Bay
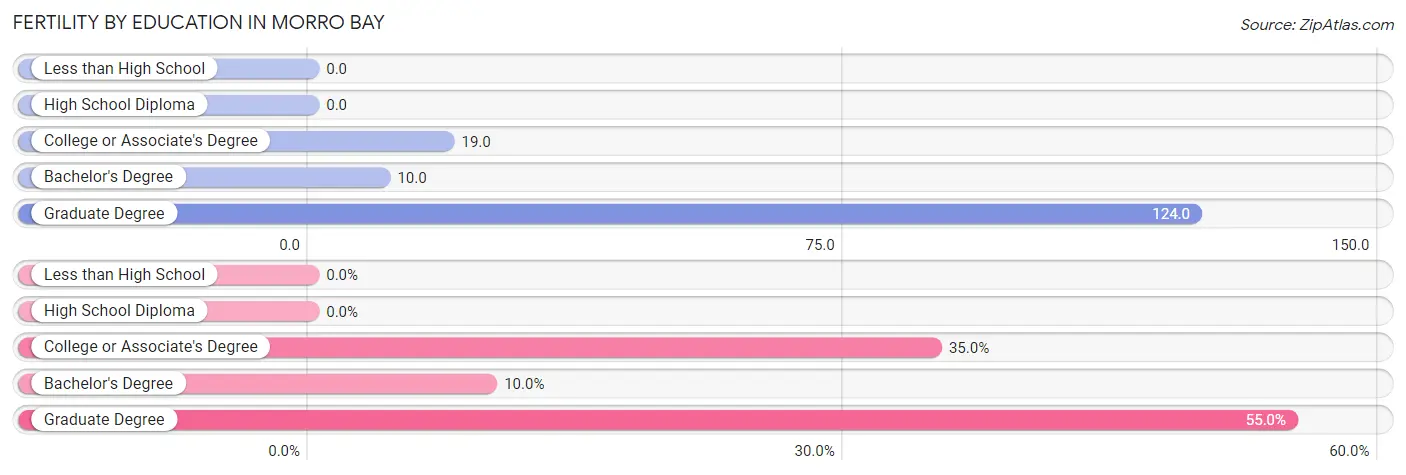
| Educational Attainment | Women with Births | Births / 1,000 Women |
| Less than High School | 0 (0.0%) | 0.0 |
| High School Diploma | 0 (0.0%) | 0.0 |
| College or Associate's Degree | 14 (35.0%) | 19.0 |
| Bachelor's Degree | 4 (10.0%) | 10.0 |
| Graduate Degree | 22 (55.0%) | 124.0 |
| Total | 40 (100.0%) | 21.0 |
Fertility by Education by Marriage Status in Morro Bay
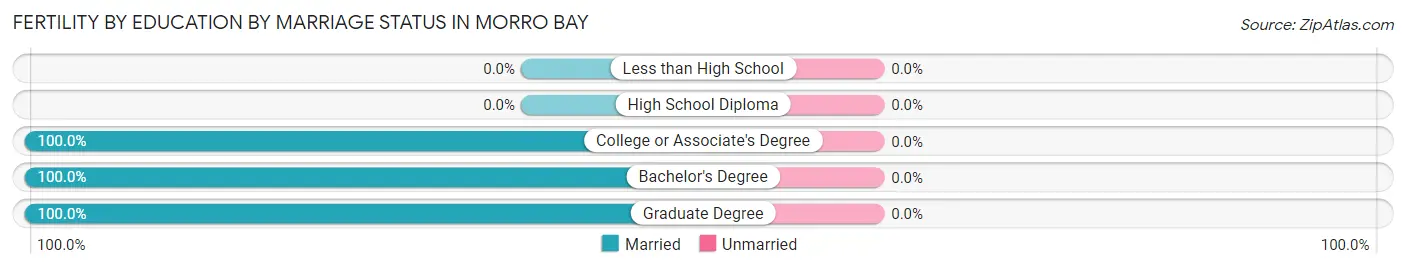
| Educational Attainment | Married | Unmarried |
| Less than High School | 0 (0.0%) | 0 (0.0%) |
| High School Diploma | 0 (0.0%) | 0 (0.0%) |
| College or Associate's Degree | 14 (100.0%) | 0 (0.0%) |
| Bachelor's Degree | 4 (100.0%) | 0 (0.0%) |
| Graduate Degree | 22 (100.0%) | 0 (0.0%) |
| Total | 40 (100.0%) | 0 (0.0%) |
Employment Characteristics in Morro Bay
Employment by Class of Employer in Morro Bay
Among the 4,874 employed individuals in Morro Bay, private company employees (2,942 | 60.4%), local government employees (532 | 10.9%), and self-employed (not incorporated) (459 | 9.4%) make up the most common classes of employment.
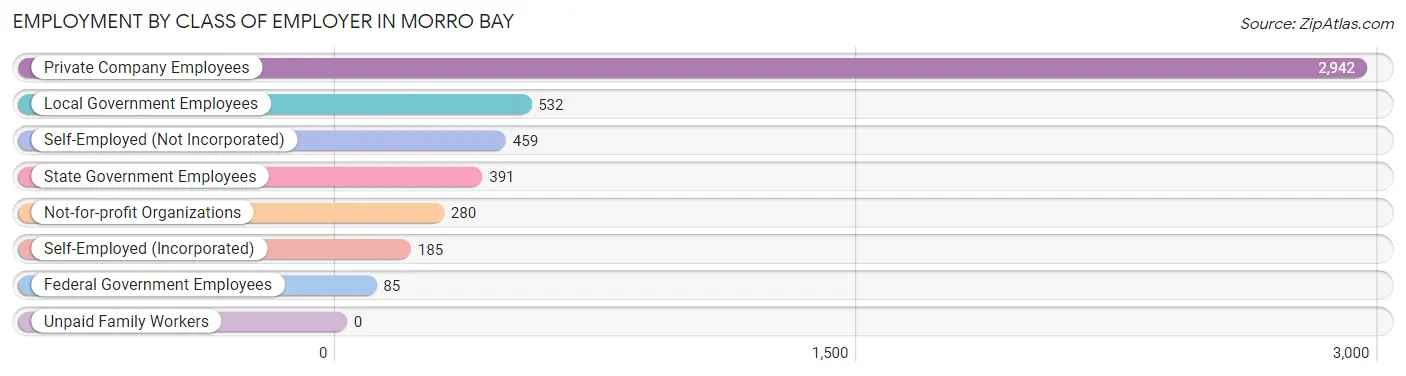
| Employer Class | # Employees | % Employees |
| Private Company Employees | 2,942 | 60.4% |
| Self-Employed (Incorporated) | 185 | 3.8% |
| Self-Employed (Not Incorporated) | 459 | 9.4% |
| Not-for-profit Organizations | 280 | 5.7% |
| Local Government Employees | 532 | 10.9% |
| State Government Employees | 391 | 8.0% |
| Federal Government Employees | 85 | 1.7% |
| Unpaid Family Workers | 0 | 0.0% |
| Total | 4,874 | 100.0% |
Employment Status by Age in Morro Bay
According to the labor force statistics for Morro Bay, out of the total population over 16 years of age (9,520), 57.7% or 5,493 individuals are in the labor force, with 9.2% or 505 of them unemployed. The age group with the highest labor force participation rate is 30 to 34 years, with 92.5% or 553 individuals in the labor force. Within the labor force, the 45 to 54 years age range has the highest percentage of unemployed individuals, with 27.8% or 270 of them being unemployed.
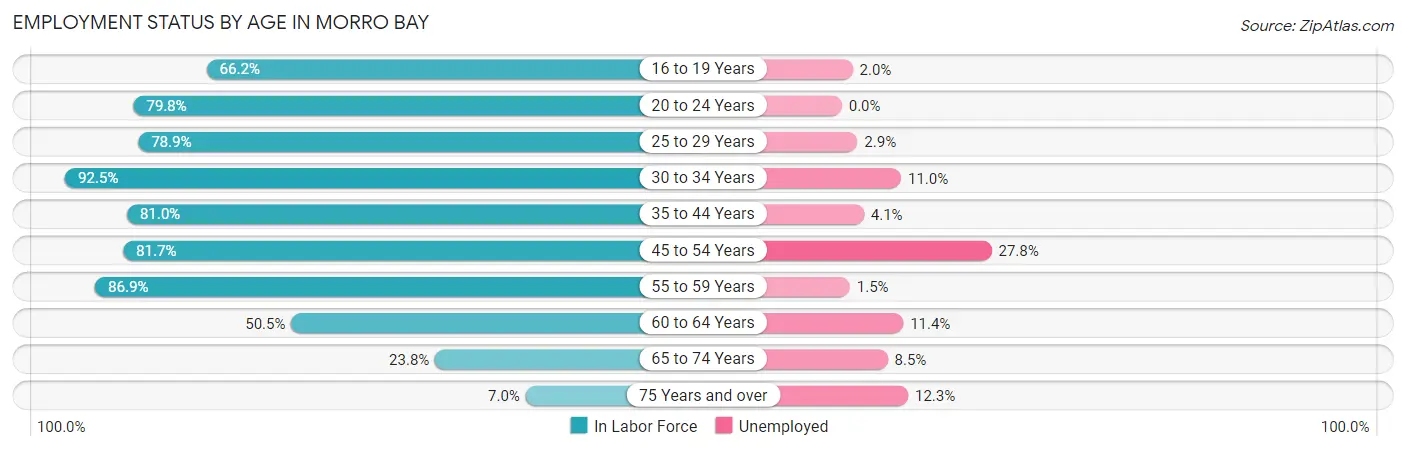
| Age Bracket | In Labor Force | Unemployed |
| 16 to 19 Years | 391 (66.2%) | 8 (2.0%) |
| 20 to 24 Years | 438 (79.8%) | 0 (0.0%) |
| 25 to 29 Years | 532 (78.9%) | 15 (2.9%) |
| 30 to 34 Years | 553 (92.5%) | 61 (11.0%) |
| 35 to 44 Years | 707 (81.0%) | 29 (4.1%) |
| 45 to 54 Years | 971 (81.7%) | 270 (27.8%) |
| 55 to 59 Years | 876 (86.9%) | 13 (1.5%) |
| 60 to 64 Years | 484 (50.5%) | 55 (11.4%) |
| 65 to 74 Years | 456 (23.8%) | 39 (8.5%) |
| 75 Years and over | 81 (7.0%) | 10 (12.3%) |
| Total | 5,493 (57.7%) | 505 (9.2%) |
Employment Status by Educational Attainment in Morro Bay
According to labor force statistics for Morro Bay, 77.8% of individuals (4,124) out of the total population between 25 and 64 years of age (5,301) are in the labor force, with 10.8% or 445 of them being unemployed. The group with the highest labor force participation rate are those with the educational attainment of bachelor's degree or higher, with 84.1% or 1,893 individuals in the labor force. Within the labor force, individuals with bachelor's degree or higher education have the highest percentage of unemployment, with 16.3% or 309 of them being unemployed.
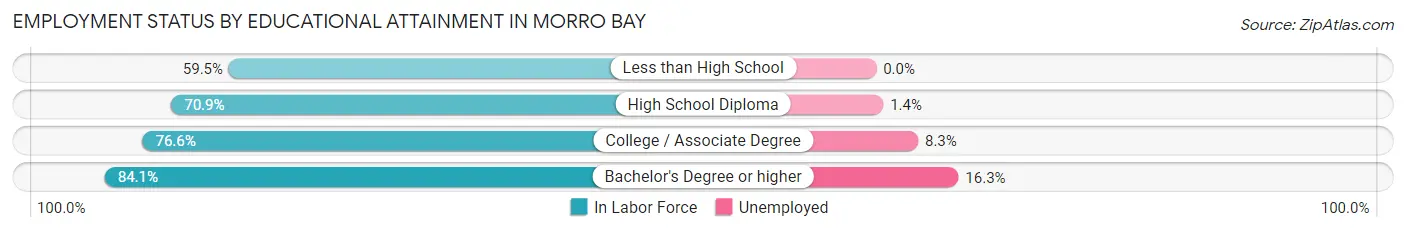
| Educational Attainment | In Labor Force | Unemployed |
| Less than High School | 229 (59.5%) | 0 (0.0%) |
| High School Diploma | 477 (70.9%) | 9 (1.4%) |
| College / Associate Degree | 1,526 (76.6%) | 165 (8.3%) |
| Bachelor's Degree or higher | 1,893 (84.1%) | 367 (16.3%) |
| Total | 4,124 (77.8%) | 573 (10.8%) |
Employment Occupations by Sex in Morro Bay
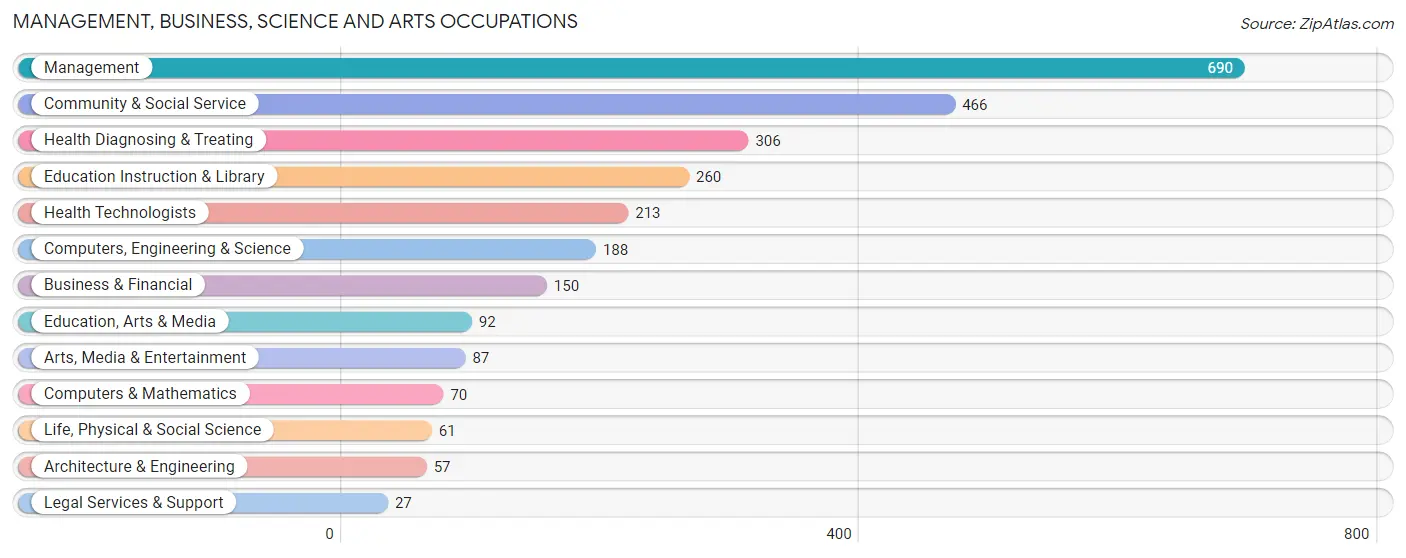
Management, Business, Science and Arts Occupations
The most common Management, Business, Science and Arts occupations in Morro Bay are Management (690 | 14.0%), Community & Social Service (466 | 9.4%), Health Diagnosing & Treating (306 | 6.2%), Education Instruction & Library (260 | 5.3%), and Health Technologists (213 | 4.3%).
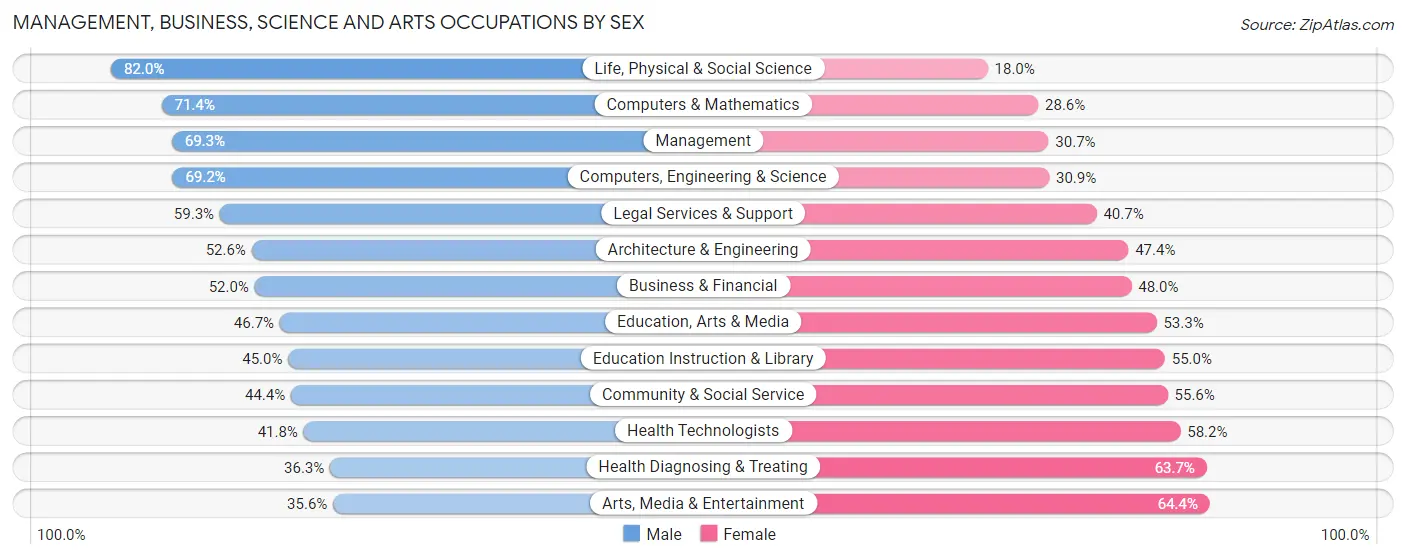
Management, Business, Science and Arts Occupations by Sex
Within the Management, Business, Science and Arts occupations in Morro Bay, the most male-oriented occupations are Life, Physical & Social Science (82.0%), Computers & Mathematics (71.4%), and Management (69.3%), while the most female-oriented occupations are Arts, Media & Entertainment (64.4%), Health Diagnosing & Treating (63.7%), and Health Technologists (58.2%).
| Occupation | Male | Female |
| Management | 478 (69.3%) | 212 (30.7%) |
| Business & Financial | 78 (52.0%) | 72 (48.0%) |
| Computers, Engineering & Science | 130 (69.2%) | 58 (30.8%) |
| Computers & Mathematics | 50 (71.4%) | 20 (28.6%) |
| Architecture & Engineering | 30 (52.6%) | 27 (47.4%) |
| Life, Physical & Social Science | 50 (82.0%) | 11 (18.0%) |
| Community & Social Service | 207 (44.4%) | 259 (55.6%) |
| Education, Arts & Media | 43 (46.7%) | 49 (53.3%) |
| Legal Services & Support | 16 (59.3%) | 11 (40.7%) |
| Education Instruction & Library | 117 (45.0%) | 143 (55.0%) |
| Arts, Media & Entertainment | 31 (35.6%) | 56 (64.4%) |
| Health Diagnosing & Treating | 111 (36.3%) | 195 (63.7%) |
| Health Technologists | 89 (41.8%) | 124 (58.2%) |
| Total (Category) | 1,004 (55.8%) | 796 (44.2%) |
| Total (Overall) | 2,722 (55.1%) | 2,216 (44.9%) |
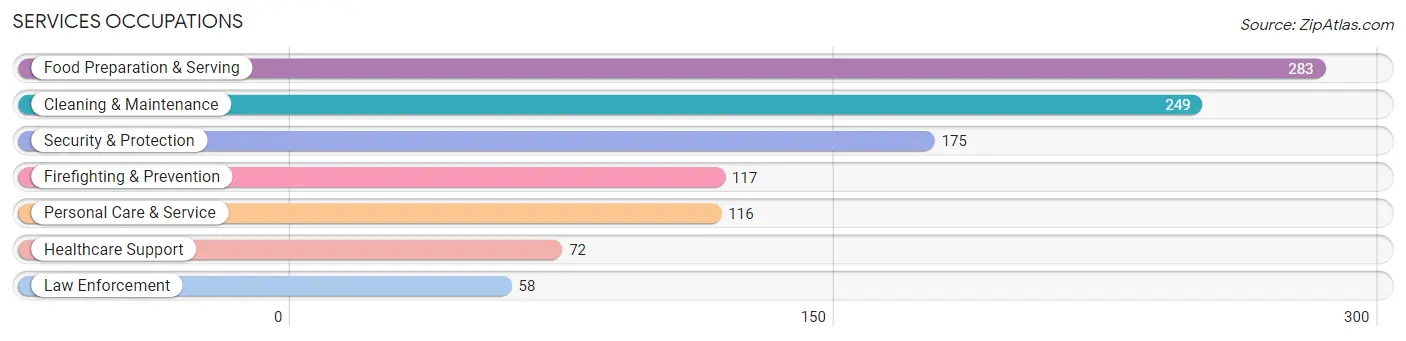
Services Occupations
The most common Services occupations in Morro Bay are Food Preparation & Serving (283 | 5.7%), Cleaning & Maintenance (249 | 5.0%), Security & Protection (175 | 3.5%), Firefighting & Prevention (117 | 2.4%), and Personal Care & Service (116 | 2.4%).
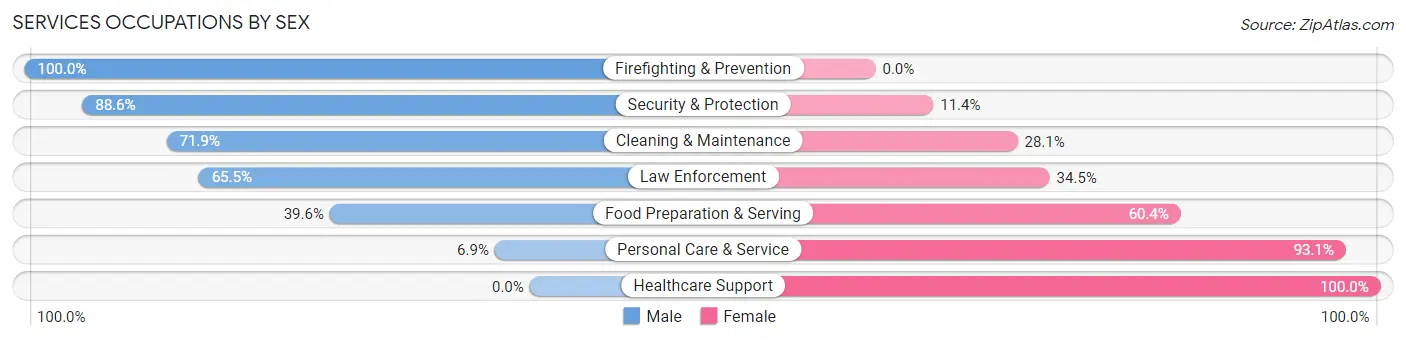
Services Occupations by Sex
Within the Services occupations in Morro Bay, the most male-oriented occupations are Firefighting & Prevention (100.0%), Security & Protection (88.6%), and Cleaning & Maintenance (71.9%), while the most female-oriented occupations are Healthcare Support (100.0%), Personal Care & Service (93.1%), and Food Preparation & Serving (60.4%).
| Occupation | Male | Female |
| Healthcare Support | 0 (0.0%) | 72 (100.0%) |
| Security & Protection | 155 (88.6%) | 20 (11.4%) |
| Firefighting & Prevention | 117 (100.0%) | 0 (0.0%) |
| Law Enforcement | 38 (65.5%) | 20 (34.5%) |
| Food Preparation & Serving | 112 (39.6%) | 171 (60.4%) |
| Cleaning & Maintenance | 179 (71.9%) | 70 (28.1%) |
| Personal Care & Service | 8 (6.9%) | 108 (93.1%) |
| Total (Category) | 454 (50.7%) | 441 (49.3%) |
| Total (Overall) | 2,722 (55.1%) | 2,216 (44.9%) |
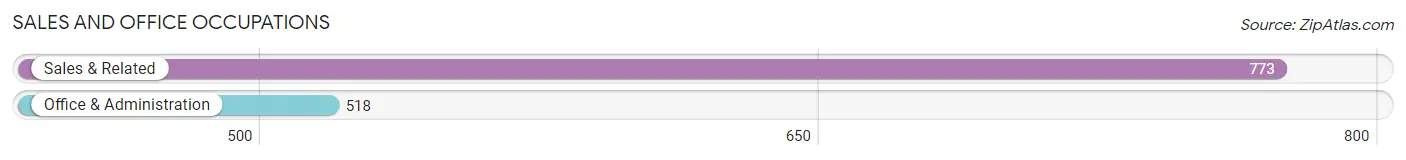
Sales and Office Occupations
The most common Sales and Office occupations in Morro Bay are Sales & Related (773 | 15.7%), and Office & Administration (518 | 10.5%).
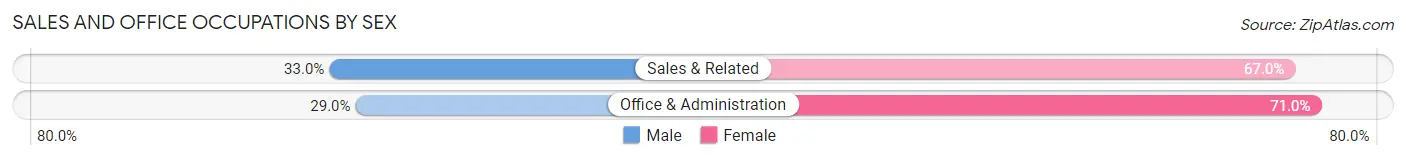
Sales and Office Occupations by Sex
| Occupation | Male | Female |
| Sales & Related | 255 (33.0%) | 518 (67.0%) |
| Office & Administration | 150 (29.0%) | 368 (71.0%) |
| Total (Category) | 405 (31.4%) | 886 (68.6%) |
| Total (Overall) | 2,722 (55.1%) | 2,216 (44.9%) |
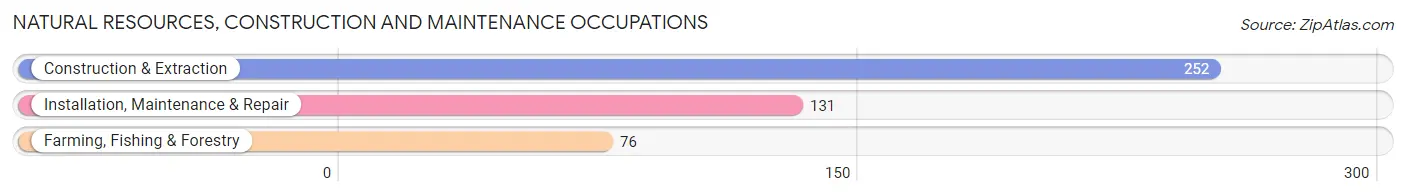
Natural Resources, Construction and Maintenance Occupations
The most common Natural Resources, Construction and Maintenance occupations in Morro Bay are Construction & Extraction (252 | 5.1%), Installation, Maintenance & Repair (131 | 2.6%), and Farming, Fishing & Forestry (76 | 1.5%).
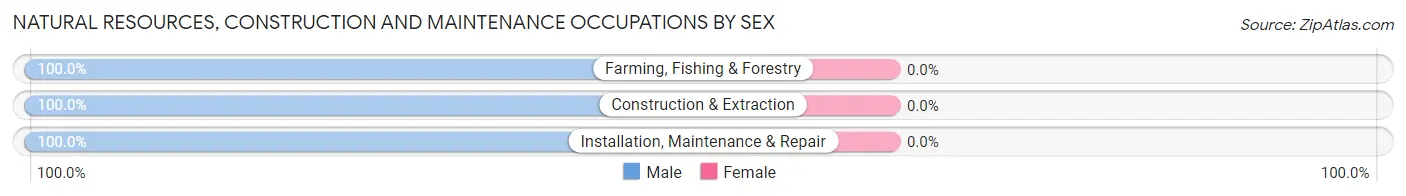
Natural Resources, Construction and Maintenance Occupations by Sex
| Occupation | Male | Female |
| Farming, Fishing & Forestry | 76 (100.0%) | 0 (0.0%) |
| Construction & Extraction | 252 (100.0%) | 0 (0.0%) |
| Installation, Maintenance & Repair | 131 (100.0%) | 0 (0.0%) |
| Total (Category) | 459 (100.0%) | 0 (0.0%) |
| Total (Overall) | 2,722 (55.1%) | 2,216 (44.9%) |
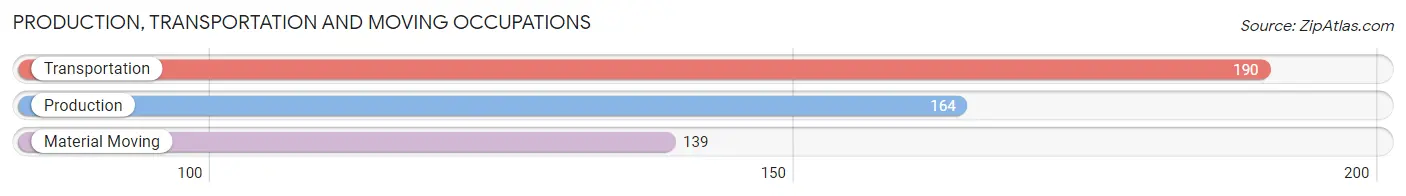
Production, Transportation and Moving Occupations
The most common Production, Transportation and Moving occupations in Morro Bay are Transportation (190 | 3.8%), Production (164 | 3.3%), and Material Moving (139 | 2.8%).
Production, Transportation and Moving Occupations by Sex
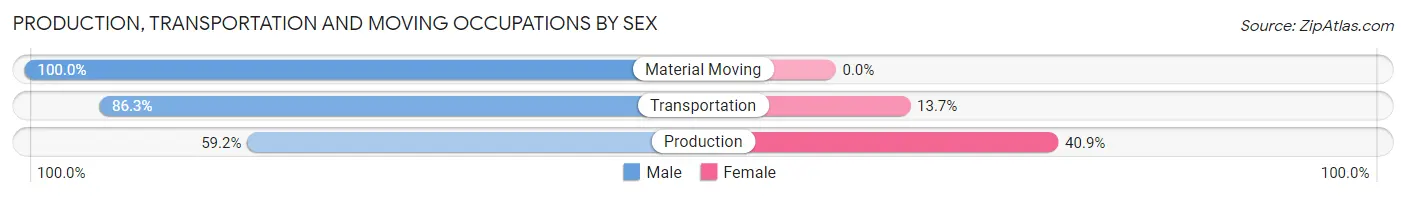
| Occupation | Male | Female |
| Production | 97 (59.2%) | 67 (40.8%) |
| Transportation | 164 (86.3%) | 26 (13.7%) |
| Material Moving | 139 (100.0%) | 0 (0.0%) |
| Total (Category) | 400 (81.1%) | 93 (18.9%) |
| Total (Overall) | 2,722 (55.1%) | 2,216 (44.9%) |
Employment Industries by Sex in Morro Bay
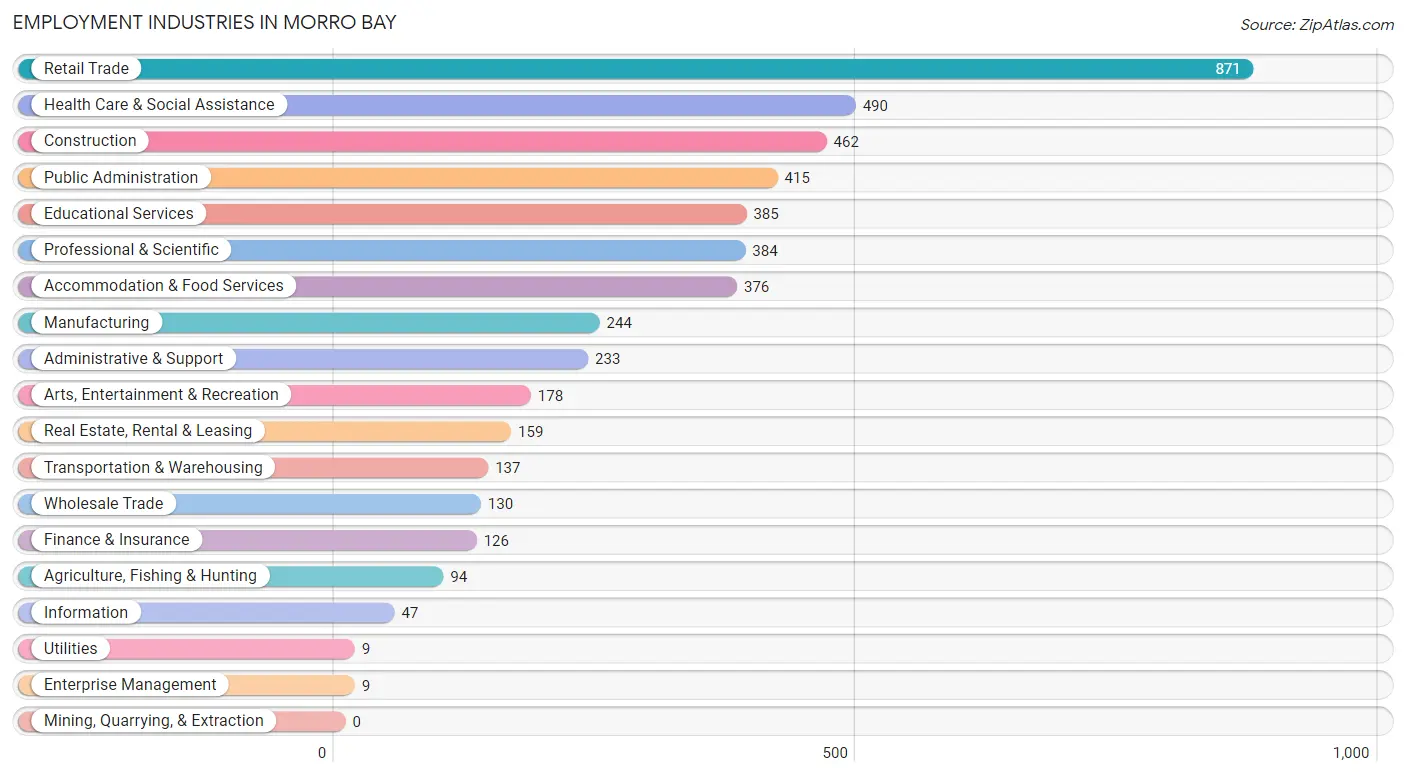
Employment Industries in Morro Bay
The major employment industries in Morro Bay include Retail Trade (871 | 17.6%), Health Care & Social Assistance (490 | 9.9%), Construction (462 | 9.4%), Public Administration (415 | 8.4%), and Educational Services (385 | 7.8%).
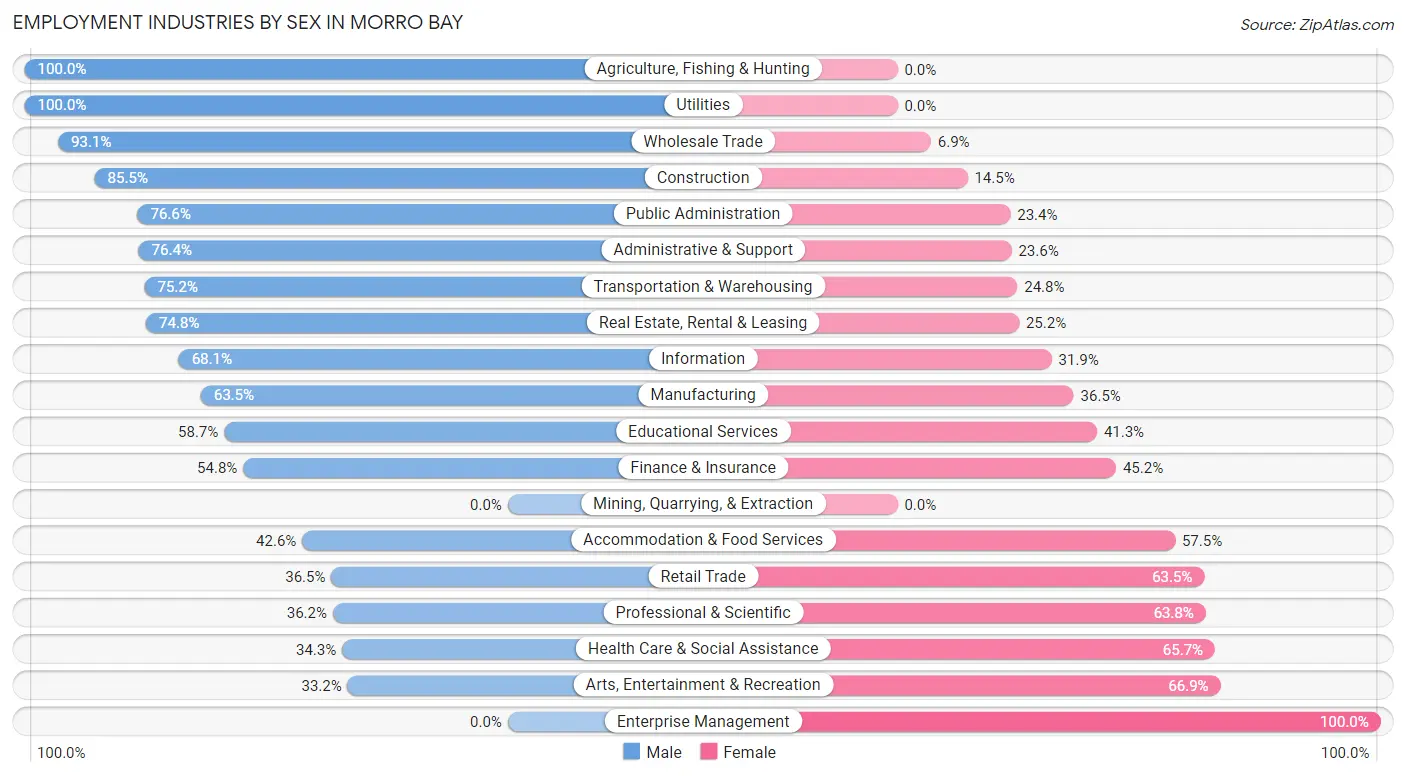
Employment Industries by Sex in Morro Bay
The Morro Bay industries that see more men than women are Agriculture, Fishing & Hunting (100.0%), Utilities (100.0%), and Wholesale Trade (93.1%), whereas the industries that tend to have a higher number of women are Enterprise Management (100.0%), Arts, Entertainment & Recreation (66.8%), and Health Care & Social Assistance (65.7%).
| Industry | Male | Female |
| Agriculture, Fishing & Hunting | 94 (100.0%) | 0 (0.0%) |
| Mining, Quarrying, & Extraction | 0 (0.0%) | 0 (0.0%) |
| Construction | 395 (85.5%) | 67 (14.5%) |
| Manufacturing | 155 (63.5%) | 89 (36.5%) |
| Wholesale Trade | 121 (93.1%) | 9 (6.9%) |
| Retail Trade | 318 (36.5%) | 553 (63.5%) |
| Transportation & Warehousing | 103 (75.2%) | 34 (24.8%) |
| Utilities | 9 (100.0%) | 0 (0.0%) |
| Information | 32 (68.1%) | 15 (31.9%) |
| Finance & Insurance | 69 (54.8%) | 57 (45.2%) |
| Real Estate, Rental & Leasing | 119 (74.8%) | 40 (25.2%) |
| Professional & Scientific | 139 (36.2%) | 245 (63.8%) |
| Enterprise Management | 0 (0.0%) | 9 (100.0%) |
| Administrative & Support | 178 (76.4%) | 55 (23.6%) |
| Educational Services | 226 (58.7%) | 159 (41.3%) |
| Health Care & Social Assistance | 168 (34.3%) | 322 (65.7%) |
| Arts, Entertainment & Recreation | 59 (33.2%) | 119 (66.8%) |
| Accommodation & Food Services | 160 (42.5%) | 216 (57.5%) |
| Public Administration | 318 (76.6%) | 97 (23.4%) |
| Total | 2,722 (55.1%) | 2,216 (44.9%) |
Education in Morro Bay
School Enrollment in Morro Bay
The most common levels of schooling among the 2,082 students in Morro Bay are college / undergraduate (717 | 34.4%), high school (565 | 27.1%), and elementary school (300 | 14.4%).
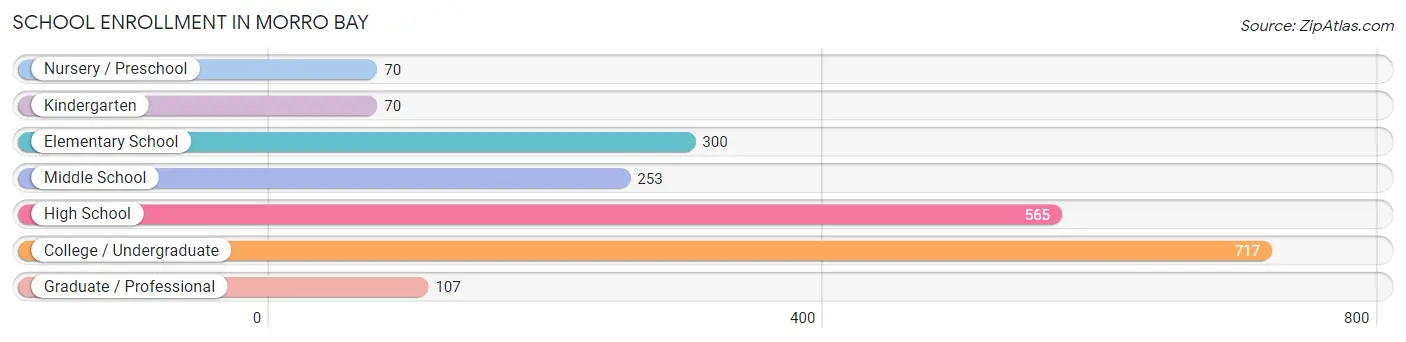
| School Level | # Students | % Students |
| Nursery / Preschool | 70 | 3.4% |
| Kindergarten | 70 | 3.4% |
| Elementary School | 300 | 14.4% |
| Middle School | 253 | 12.1% |
| High School | 565 | 27.1% |
| College / Undergraduate | 717 | 34.4% |
| Graduate / Professional | 107 | 5.1% |
| Total | 2,082 | 100.0% |
School Enrollment by Age by Funding Source in Morro Bay
Out of a total of 2,082 students who are enrolled in schools in Morro Bay, 77 (3.7%) attend a private institution, while the remaining 2,005 (96.3%) are enrolled in public schools. The age group of 5 to 9 year old has the highest likelihood of being enrolled in private schools, with 53 (15.3% in the age bracket) enrolled. Conversely, the age group of 15 to 17 year olds has the lowest likelihood of being enrolled in a private school, with 348 (100.0% in the age bracket) attending a public institution.
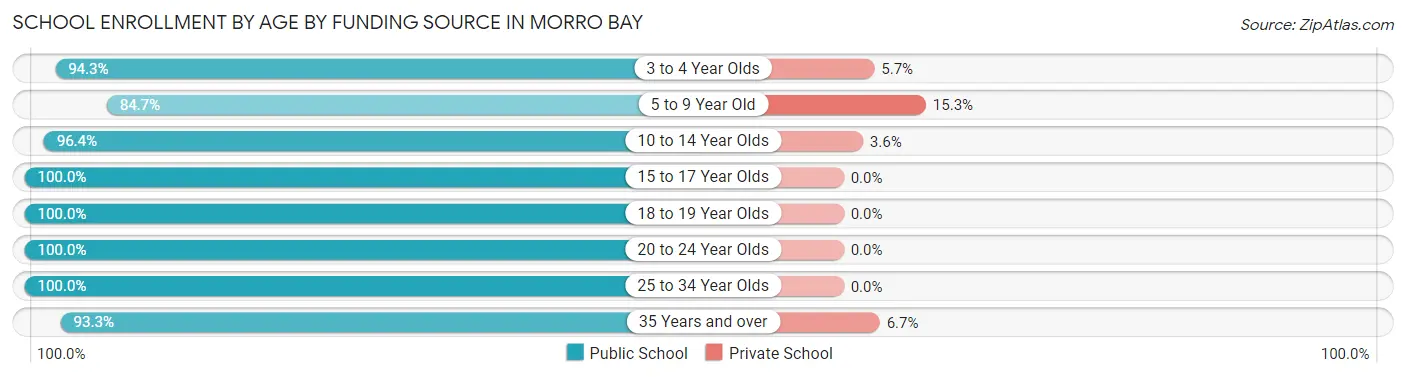
| Age Bracket | Public School | Private School |
| 3 to 4 Year Olds | 66 (94.3%) | 4 (5.7%) |
| 5 to 9 Year Old | 293 (84.7%) | 53 (15.3%) |
| 10 to 14 Year Olds | 296 (96.4%) | 11 (3.6%) |
| 15 to 17 Year Olds | 348 (100.0%) | 0 (0.0%) |
| 18 to 19 Year Olds | 480 (100.0%) | 0 (0.0%) |
| 20 to 24 Year Olds | 148 (100.0%) | 0 (0.0%) |
| 25 to 34 Year Olds | 264 (100.0%) | 0 (0.0%) |
| 35 Years and over | 111 (93.3%) | 8 (6.7%) |
| Total | 2,005 (96.3%) | 77 (3.7%) |
Educational Attainment by Field of Study in Morro Bay
Business (601 | 15.5%), bio, nature & agricultural (399 | 10.3%), communications (381 | 9.9%), psychology (349 | 9.0%), and education (339 | 8.8%) are the most common fields of study among 3,868 individuals in Morro Bay who have obtained a bachelor's degree or higher.
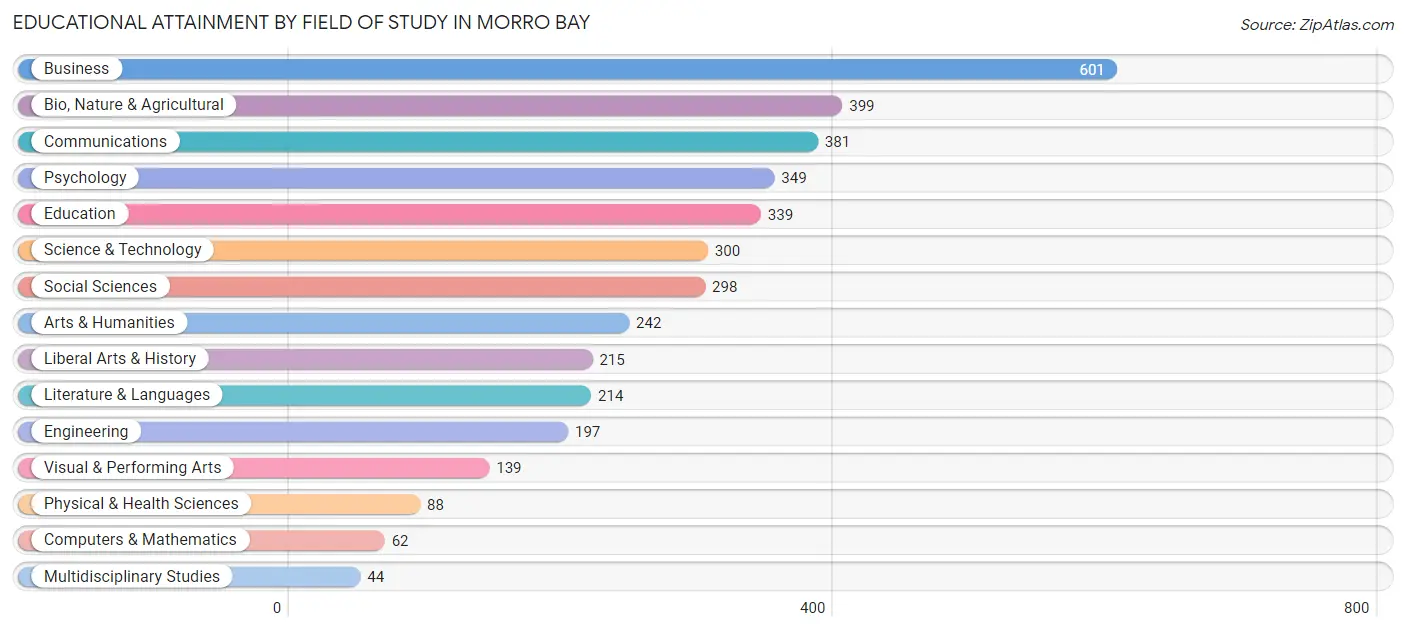
| Field of Study | # Graduates | % Graduates |
| Computers & Mathematics | 62 | 1.6% |
| Bio, Nature & Agricultural | 399 | 10.3% |
| Physical & Health Sciences | 88 | 2.3% |
| Psychology | 349 | 9.0% |
| Social Sciences | 298 | 7.7% |
| Engineering | 197 | 5.1% |
| Multidisciplinary Studies | 44 | 1.1% |
| Science & Technology | 300 | 7.8% |
| Business | 601 | 15.5% |
| Education | 339 | 8.8% |
| Literature & Languages | 214 | 5.5% |
| Liberal Arts & History | 215 | 5.6% |
| Visual & Performing Arts | 139 | 3.6% |
| Communications | 381 | 9.9% |
| Arts & Humanities | 242 | 6.3% |
| Total | 3,868 | 100.0% |
Transportation & Commute in Morro Bay
Vehicle Availability by Sex in Morro Bay
The most prevalent vehicle ownership categories in Morro Bay are males with 2 vehicles (1,127, accounting for 41.2%) and females with 2 vehicles (887, making up 52.7%).
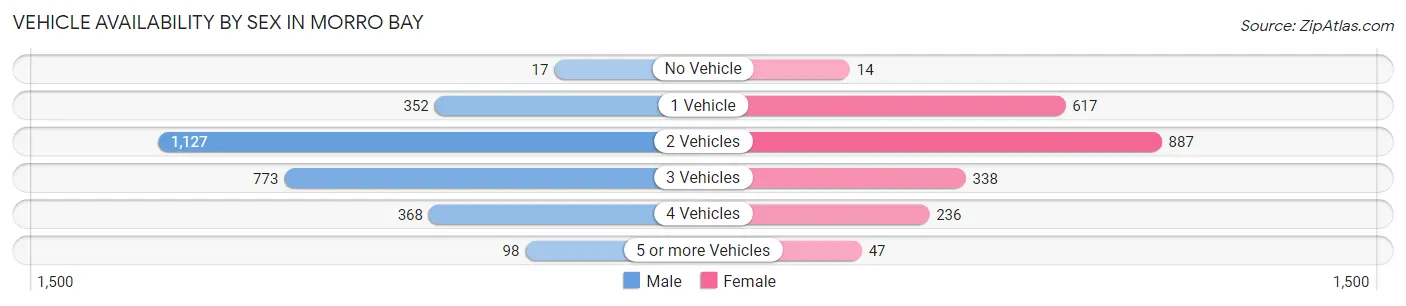
| Vehicles Available | Male | Female |
| No Vehicle | 17 (0.6%) | 14 (0.6%) |
| 1 Vehicle | 352 (12.9%) | 617 (28.8%) |
| 2 Vehicles | 1,127 (41.2%) | 887 (41.5%) |
| 3 Vehicles | 773 (28.3%) | 338 (15.8%) |
| 4 Vehicles | 368 (13.5%) | 236 (11.0%) |
| 5 or more Vehicles | 98 (3.6%) | 47 (2.2%) |
| Total | 2,735 (100.0%) | 2,139 (100.0%) |
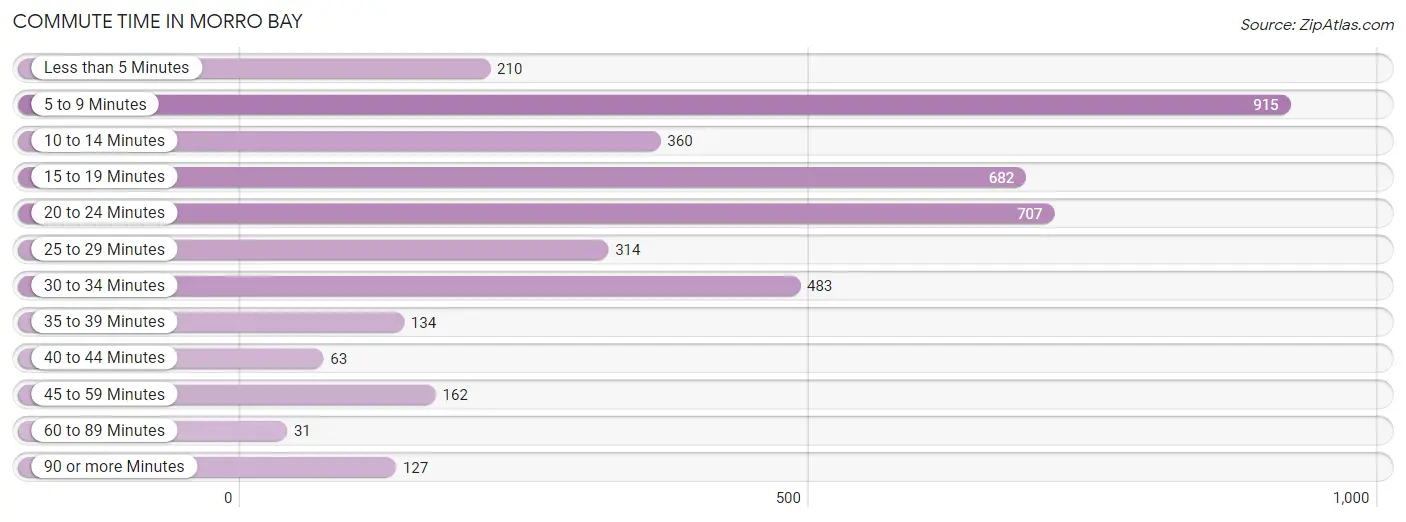
Commute Time in Morro Bay
The most frequently occuring commute durations in Morro Bay are 5 to 9 minutes (915 commuters, 21.8%), 20 to 24 minutes (707 commuters, 16.9%), and 15 to 19 minutes (682 commuters, 16.3%).
| Commute Time | # Commuters | % Commuters |
| Less than 5 Minutes | 210 | 5.0% |
| 5 to 9 Minutes | 915 | 21.8% |
| 10 to 14 Minutes | 360 | 8.6% |
| 15 to 19 Minutes | 682 | 16.3% |
| 20 to 24 Minutes | 707 | 16.9% |
| 25 to 29 Minutes | 314 | 7.5% |
| 30 to 34 Minutes | 483 | 11.5% |
| 35 to 39 Minutes | 134 | 3.2% |
| 40 to 44 Minutes | 63 | 1.5% |
| 45 to 59 Minutes | 162 | 3.9% |
| 60 to 89 Minutes | 31 | 0.7% |
| 90 or more Minutes | 127 | 3.0% |
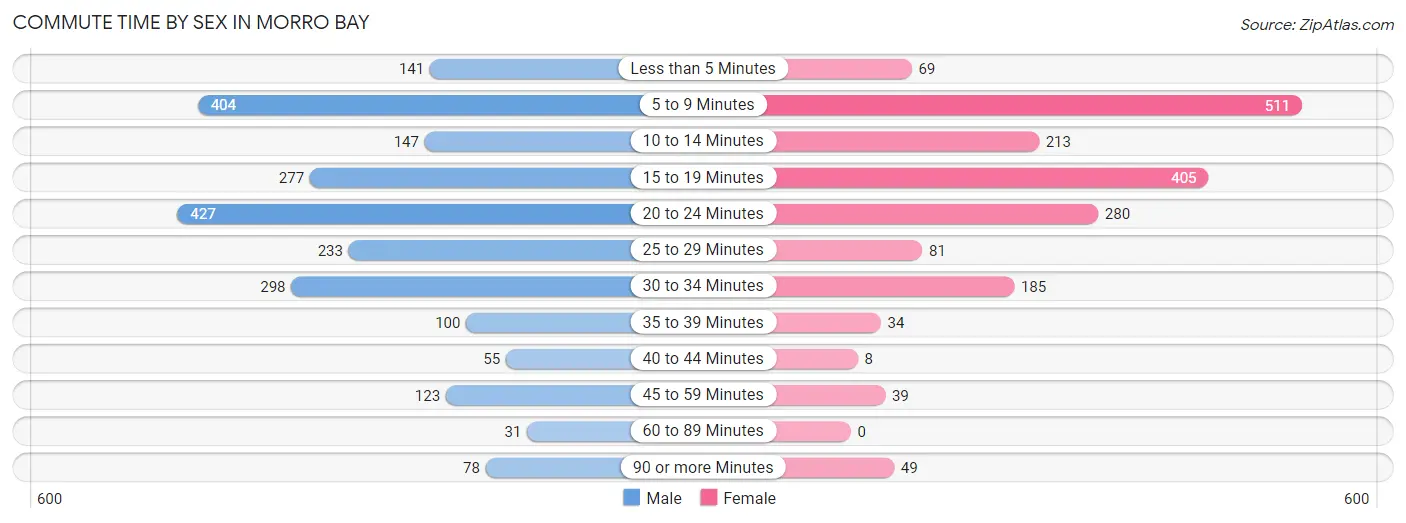
Commute Time by Sex in Morro Bay
The most common commute times in Morro Bay are 20 to 24 minutes (427 commuters, 18.4%) for males and 5 to 9 minutes (511 commuters, 27.3%) for females.
| Commute Time | Male | Female |
| Less than 5 Minutes | 141 (6.1%) | 69 (3.7%) |
| 5 to 9 Minutes | 404 (17.5%) | 511 (27.3%) |
| 10 to 14 Minutes | 147 (6.4%) | 213 (11.4%) |
| 15 to 19 Minutes | 277 (12.0%) | 405 (21.6%) |
| 20 to 24 Minutes | 427 (18.4%) | 280 (14.9%) |
| 25 to 29 Minutes | 233 (10.1%) | 81 (4.3%) |
| 30 to 34 Minutes | 298 (12.9%) | 185 (9.9%) |
| 35 to 39 Minutes | 100 (4.3%) | 34 (1.8%) |
| 40 to 44 Minutes | 55 (2.4%) | 8 (0.4%) |
| 45 to 59 Minutes | 123 (5.3%) | 39 (2.1%) |
| 60 to 89 Minutes | 31 (1.3%) | 0 (0.0%) |
| 90 or more Minutes | 78 (3.4%) | 49 (2.6%) |
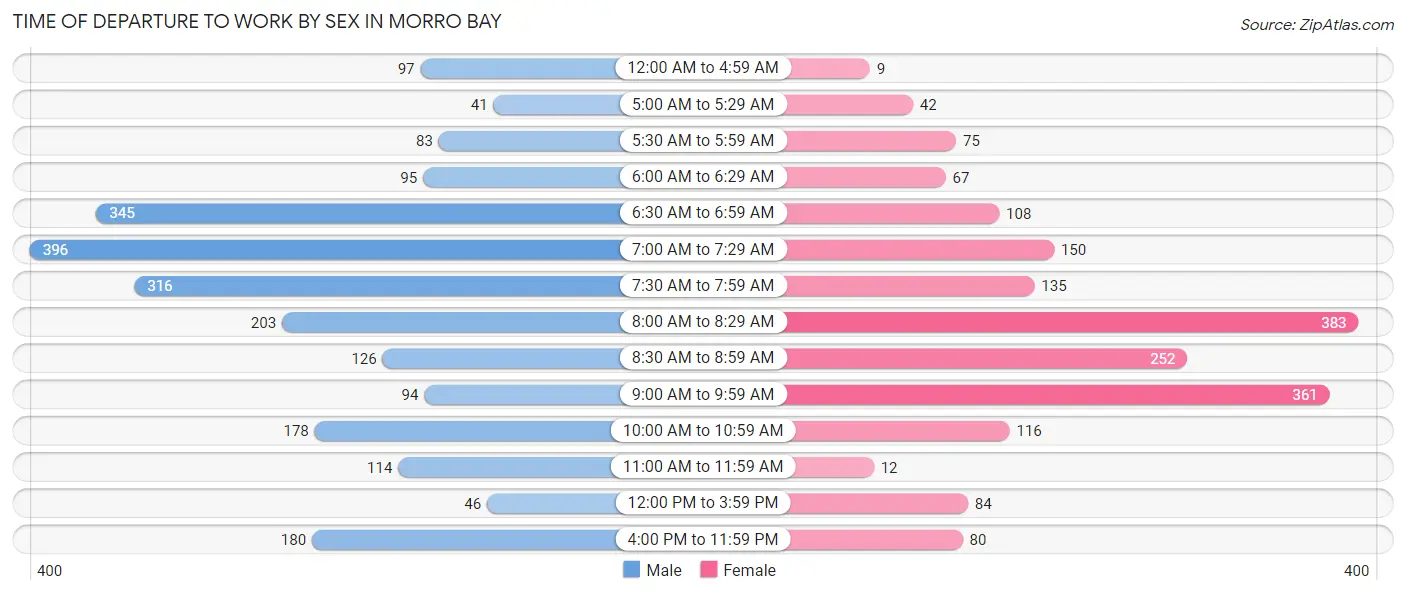
Time of Departure to Work by Sex in Morro Bay
The most frequent times of departure to work in Morro Bay are 7:00 AM to 7:29 AM (396, 17.1%) for males and 8:00 AM to 8:29 AM (383, 20.4%) for females.
| Time of Departure | Male | Female |
| 12:00 AM to 4:59 AM | 97 (4.2%) | 9 (0.5%) |
| 5:00 AM to 5:29 AM | 41 (1.8%) | 42 (2.2%) |
| 5:30 AM to 5:59 AM | 83 (3.6%) | 75 (4.0%) |
| 6:00 AM to 6:29 AM | 95 (4.1%) | 67 (3.6%) |
| 6:30 AM to 6:59 AM | 345 (14.9%) | 108 (5.8%) |
| 7:00 AM to 7:29 AM | 396 (17.1%) | 150 (8.0%) |
| 7:30 AM to 7:59 AM | 316 (13.7%) | 135 (7.2%) |
| 8:00 AM to 8:29 AM | 203 (8.8%) | 383 (20.4%) |
| 8:30 AM to 8:59 AM | 126 (5.4%) | 252 (13.5%) |
| 9:00 AM to 9:59 AM | 94 (4.1%) | 361 (19.3%) |
| 10:00 AM to 10:59 AM | 178 (7.7%) | 116 (6.2%) |
| 11:00 AM to 11:59 AM | 114 (4.9%) | 12 (0.6%) |
| 12:00 PM to 3:59 PM | 46 (2.0%) | 84 (4.5%) |
| 4:00 PM to 11:59 PM | 180 (7.8%) | 80 (4.3%) |
| Total | 2,314 (100.0%) | 1,874 (100.0%) |
Housing Occupancy in Morro Bay
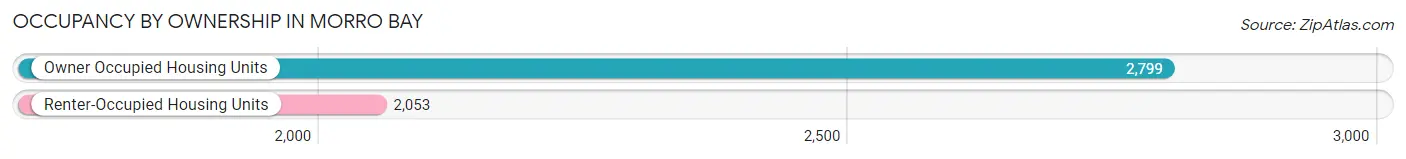
Occupancy by Ownership in Morro Bay
Of the total 4,852 dwellings in Morro Bay, owner-occupied units account for 2,799 (57.7%), while renter-occupied units make up 2,053 (42.3%).
| Occupancy | # Housing Units | % Housing Units |
| Owner Occupied Housing Units | 2,799 | 57.7% |
| Renter-Occupied Housing Units | 2,053 | 42.3% |
| Total Occupied Housing Units | 4,852 | 100.0% |
Occupancy by Household Size in Morro Bay
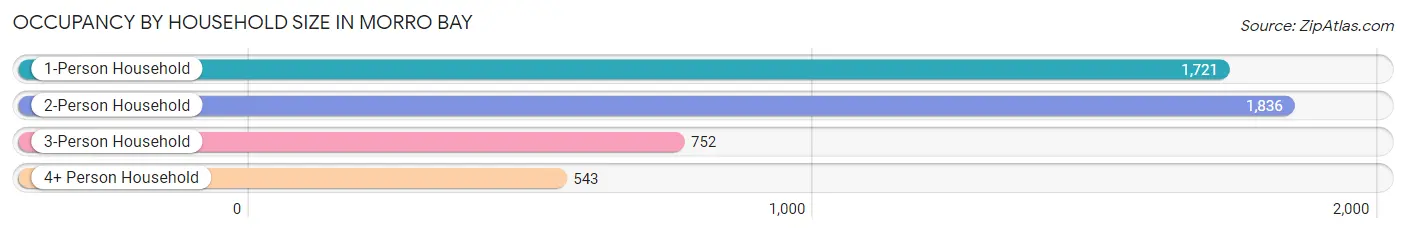
| Household Size | # Housing Units | % Housing Units |
| 1-Person Household | 1,721 | 35.5% |
| 2-Person Household | 1,836 | 37.8% |
| 3-Person Household | 752 | 15.5% |
| 4+ Person Household | 543 | 11.2% |
| Total Housing Units | 4,852 | 100.0% |
Occupancy by Ownership by Household Size in Morro Bay
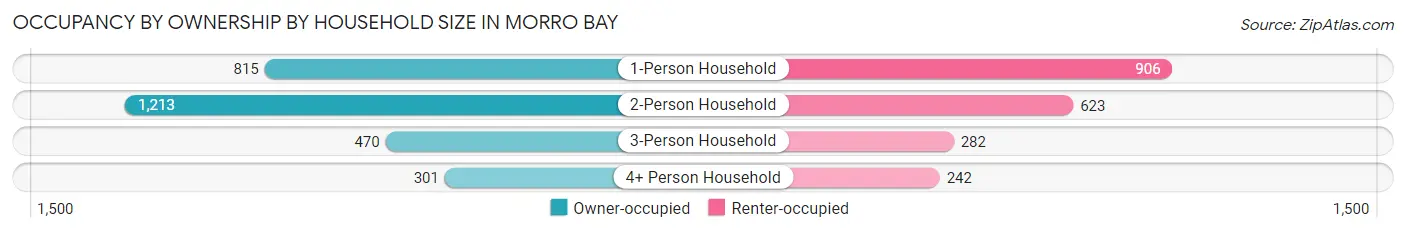
| Household Size | Owner-occupied | Renter-occupied |
| 1-Person Household | 815 (47.4%) | 906 (52.6%) |
| 2-Person Household | 1,213 (66.1%) | 623 (33.9%) |
| 3-Person Household | 470 (62.5%) | 282 (37.5%) |
| 4+ Person Household | 301 (55.4%) | 242 (44.6%) |
| Total Housing Units | 2,799 (57.7%) | 2,053 (42.3%) |
Occupancy by Educational Attainment in Morro Bay
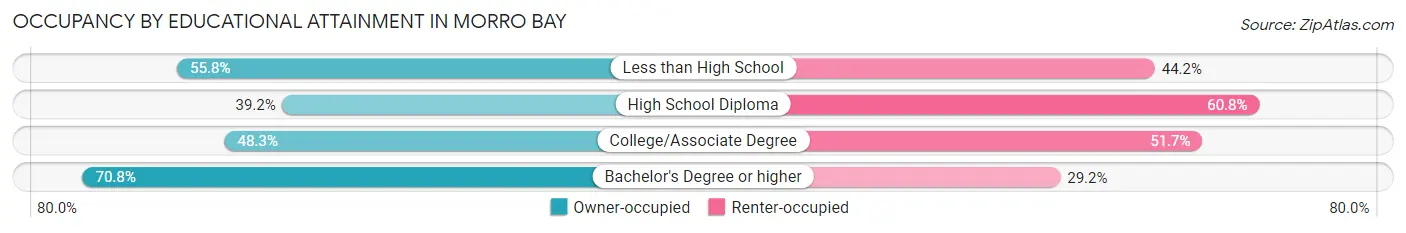
| Household Size | Owner-occupied | Renter-occupied |
| Less than High School | 77 (55.8%) | 61 (44.2%) |
| High School Diploma | 277 (39.2%) | 429 (60.8%) |
| College/Associate Degree | 842 (48.3%) | 902 (51.7%) |
| Bachelor's Degree or higher | 1,603 (70.8%) | 661 (29.2%) |
Occupancy by Age of Householder in Morro Bay
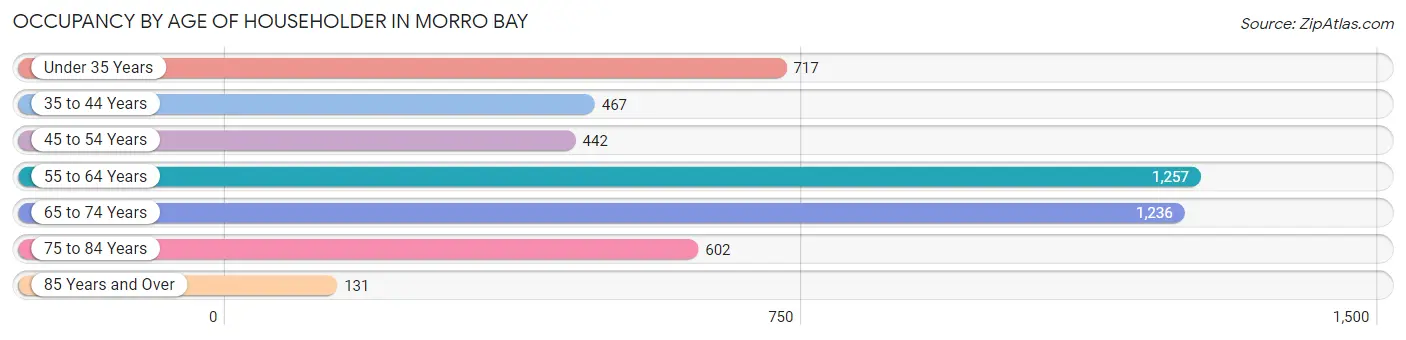
| Age Bracket | # Households | % Households |
| Under 35 Years | 717 | 14.8% |
| 35 to 44 Years | 467 | 9.6% |
| 45 to 54 Years | 442 | 9.1% |
| 55 to 64 Years | 1,257 | 25.9% |
| 65 to 74 Years | 1,236 | 25.5% |
| 75 to 84 Years | 602 | 12.4% |
| 85 Years and Over | 131 | 2.7% |
| Total | 4,852 | 100.0% |
Housing Finances in Morro Bay
Median Income by Occupancy in Morro Bay
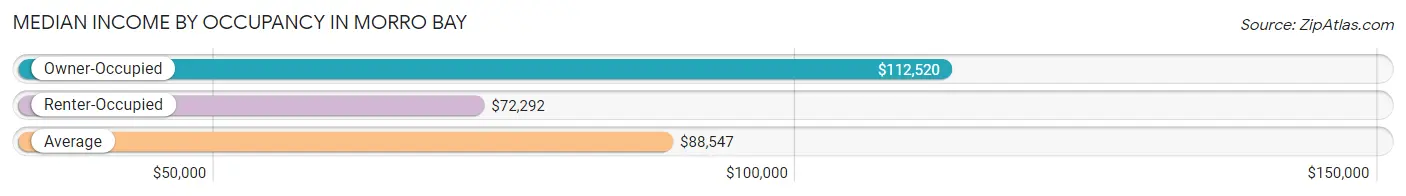
| Occupancy Type | # Households | Median Income |
| Owner-Occupied | 2,799 (57.7%) | $112,520 |
| Renter-Occupied | 2,053 (42.3%) | $72,292 |
| Average | 4,852 (100.0%) | $88,547 |
Occupancy by Householder Income Bracket in Morro Bay
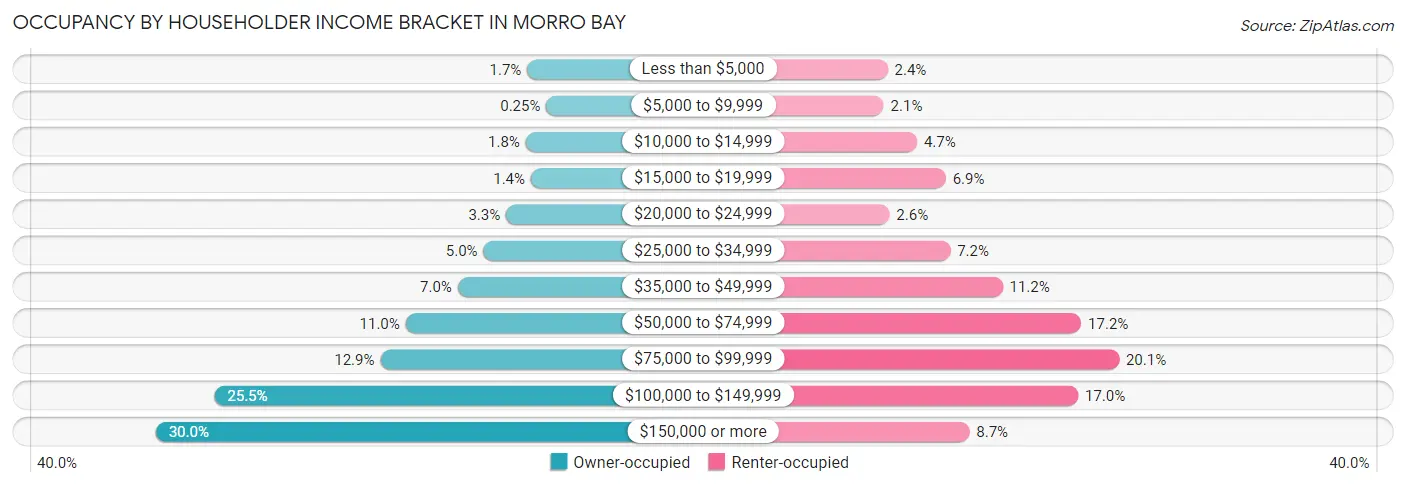
| Income Bracket | Owner-occupied | Renter-occupied |
| Less than $5,000 | 48 (1.7%) | 50 (2.4%) |
| $5,000 to $9,999 | 7 (0.3%) | 44 (2.1%) |
| $10,000 to $14,999 | 51 (1.8%) | 96 (4.7%) |
| $15,000 to $19,999 | 40 (1.4%) | 141 (6.9%) |
| $20,000 to $24,999 | 93 (3.3%) | 53 (2.6%) |
| $25,000 to $34,999 | 141 (5.0%) | 148 (7.2%) |
| $35,000 to $49,999 | 196 (7.0%) | 230 (11.2%) |
| $50,000 to $74,999 | 307 (11.0%) | 353 (17.2%) |
| $75,000 to $99,999 | 361 (12.9%) | 412 (20.1%) |
| $100,000 to $149,999 | 715 (25.5%) | 348 (17.0%) |
| $150,000 or more | 840 (30.0%) | 178 (8.7%) |
| Total | 2,799 (100.0%) | 2,053 (100.0%) |
Monthly Housing Cost Tiers in Morro Bay
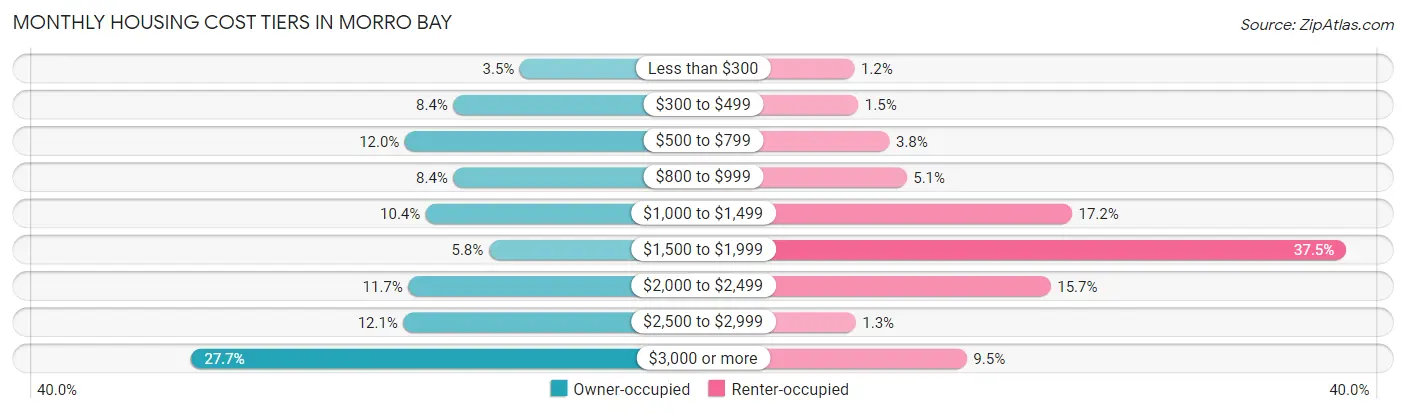
| Monthly Cost | Owner-occupied | Renter-occupied |
| Less than $300 | 98 (3.5%) | 25 (1.2%) |
| $300 to $499 | 235 (8.4%) | 31 (1.5%) |
| $500 to $799 | 335 (12.0%) | 78 (3.8%) |
| $800 to $999 | 235 (8.4%) | 104 (5.1%) |
| $1,000 to $1,499 | 292 (10.4%) | 354 (17.2%) |
| $1,500 to $1,999 | 162 (5.8%) | 769 (37.5%) |
| $2,000 to $2,499 | 328 (11.7%) | 322 (15.7%) |
| $2,500 to $2,999 | 338 (12.1%) | 27 (1.3%) |
| $3,000 or more | 776 (27.7%) | 195 (9.5%) |
| Total | 2,799 (100.0%) | 2,053 (100.0%) |
Physical Housing Characteristics in Morro Bay
Housing Structures in Morro Bay
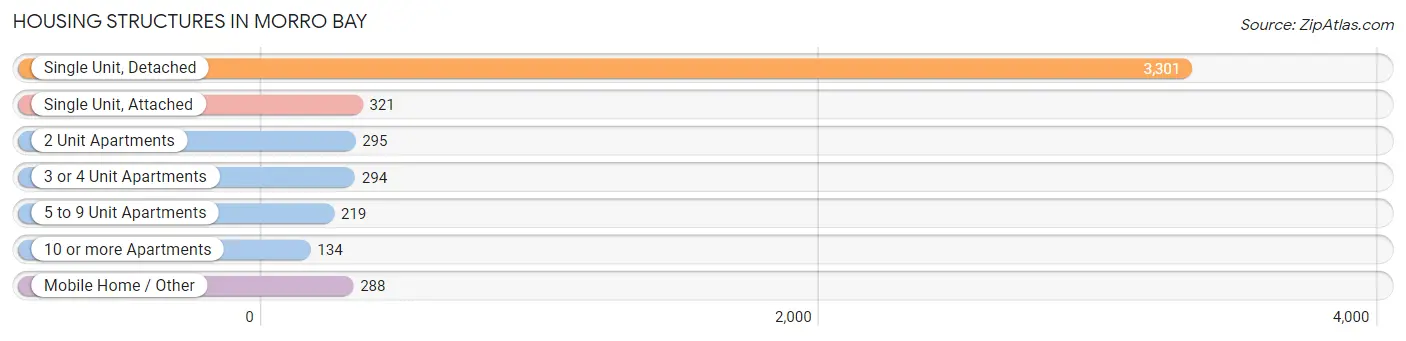
| Structure Type | # Housing Units | % Housing Units |
| Single Unit, Detached | 3,301 | 68.0% |
| Single Unit, Attached | 321 | 6.6% |
| 2 Unit Apartments | 295 | 6.1% |
| 3 or 4 Unit Apartments | 294 | 6.1% |
| 5 to 9 Unit Apartments | 219 | 4.5% |
| 10 or more Apartments | 134 | 2.8% |
| Mobile Home / Other | 288 | 5.9% |
| Total | 4,852 | 100.0% |
Housing Structures by Occupancy in Morro Bay
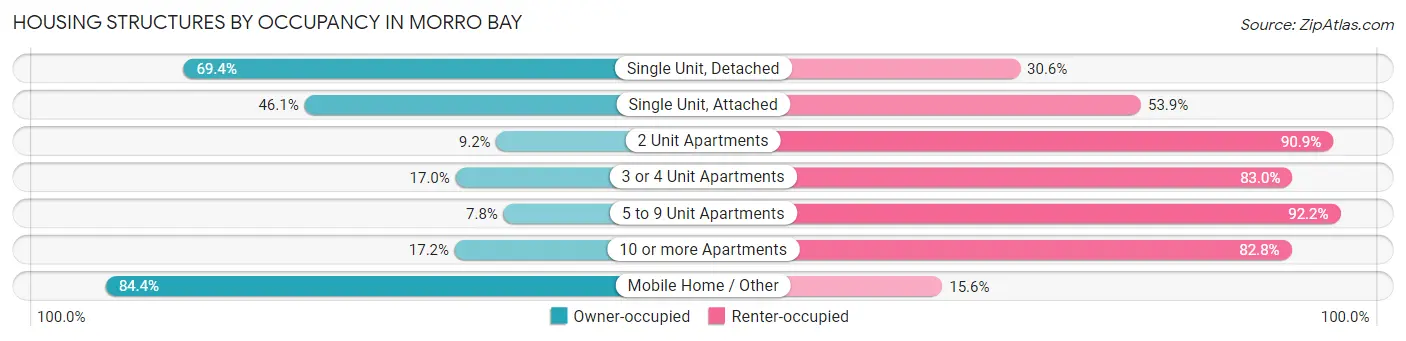
| Structure Type | Owner-occupied | Renter-occupied |
| Single Unit, Detached | 2,291 (69.4%) | 1,010 (30.6%) |
| Single Unit, Attached | 148 (46.1%) | 173 (53.9%) |
| 2 Unit Apartments | 27 (9.1%) | 268 (90.8%) |
| 3 or 4 Unit Apartments | 50 (17.0%) | 244 (83.0%) |
| 5 to 9 Unit Apartments | 17 (7.8%) | 202 (92.2%) |
| 10 or more Apartments | 23 (17.2%) | 111 (82.8%) |
| Mobile Home / Other | 243 (84.4%) | 45 (15.6%) |
| Total | 2,799 (57.7%) | 2,053 (42.3%) |
Housing Structures by Number of Rooms in Morro Bay
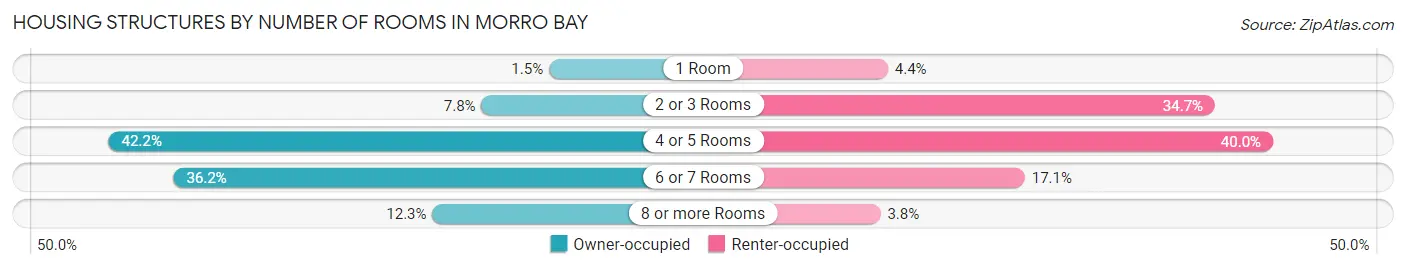
| Number of Rooms | Owner-occupied | Renter-occupied |
| 1 Room | 42 (1.5%) | 91 (4.4%) |
| 2 or 3 Rooms | 217 (7.7%) | 712 (34.7%) |
| 4 or 5 Rooms | 1,182 (42.2%) | 822 (40.0%) |
| 6 or 7 Rooms | 1,014 (36.2%) | 351 (17.1%) |
| 8 or more Rooms | 344 (12.3%) | 77 (3.7%) |
| Total | 2,799 (100.0%) | 2,053 (100.0%) |
Housing Structure by Heating Type in Morro Bay
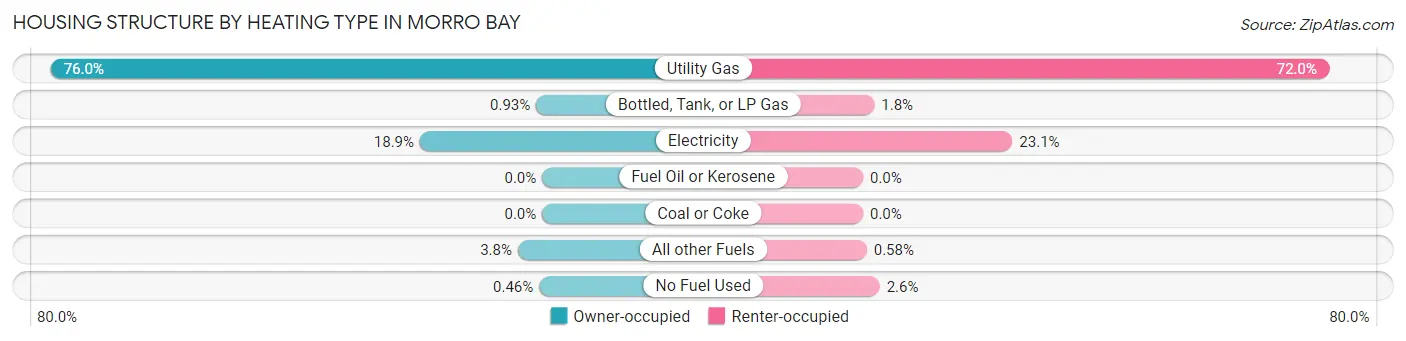
| Heating Type | Owner-occupied | Renter-occupied |
| Utility Gas | 2,126 (76.0%) | 1,478 (72.0%) |
| Bottled, Tank, or LP Gas | 26 (0.9%) | 36 (1.8%) |
| Electricity | 529 (18.9%) | 474 (23.1%) |
| Fuel Oil or Kerosene | 0 (0.0%) | 0 (0.0%) |
| Coal or Coke | 0 (0.0%) | 0 (0.0%) |
| All other Fuels | 105 (3.7%) | 12 (0.6%) |
| No Fuel Used | 13 (0.5%) | 53 (2.6%) |
| Total | 2,799 (100.0%) | 2,053 (100.0%) |
Household Vehicle Usage in Morro Bay
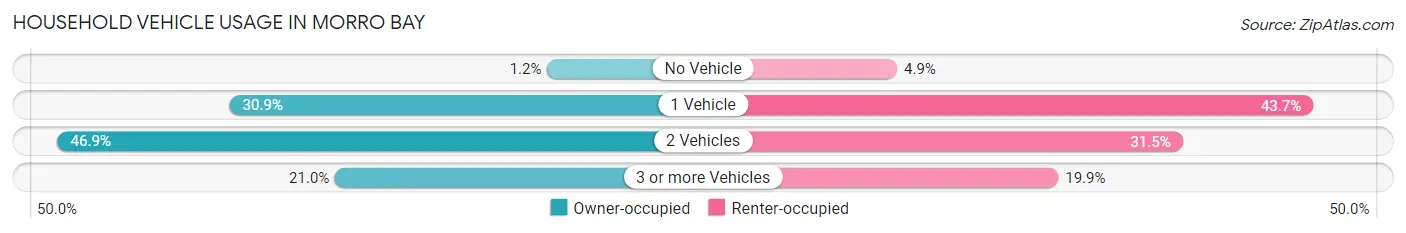
| Vehicles per Household | Owner-occupied | Renter-occupied |
| No Vehicle | 34 (1.2%) | 100 (4.9%) |
| 1 Vehicle | 864 (30.9%) | 897 (43.7%) |
| 2 Vehicles | 1,313 (46.9%) | 647 (31.5%) |
| 3 or more Vehicles | 588 (21.0%) | 409 (19.9%) |
| Total | 2,799 (100.0%) | 2,053 (100.0%) |
Real Estate & Mortgages in Morro Bay
Real Estate and Mortgage Overview in Morro Bay
| Characteristic | Without Mortgage | With Mortgage |
| Housing Units | 981 | 1,818 |
| Median Property Value | $693,800 | $841,100 |
| Median Household Income | $79,837 | $700 |
| Monthly Housing Costs | $689 | $776 |
| Real Estate Taxes | $2,970 | $19 |
Property Value by Mortgage Status in Morro Bay
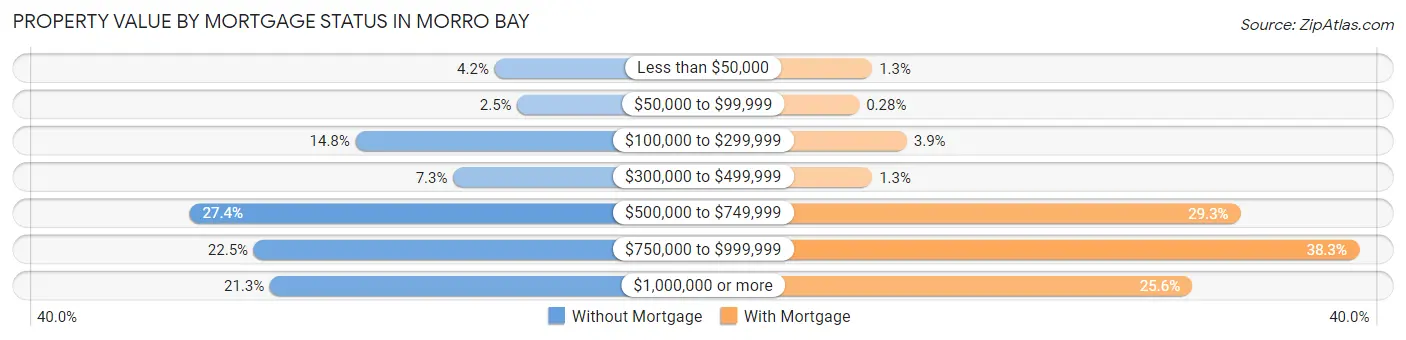
| Property Value | Without Mortgage | With Mortgage |
| Less than $50,000 | 41 (4.2%) | 23 (1.3%) |
| $50,000 to $99,999 | 24 (2.5%) | 5 (0.3%) |
| $100,000 to $299,999 | 145 (14.8%) | 71 (3.9%) |
| $300,000 to $499,999 | 72 (7.3%) | 23 (1.3%) |
| $500,000 to $749,999 | 269 (27.4%) | 533 (29.3%) |
| $750,000 to $999,999 | 221 (22.5%) | 697 (38.3%) |
| $1,000,000 or more | 209 (21.3%) | 466 (25.6%) |
| Total | 981 (100.0%) | 1,818 (100.0%) |
Household Income by Mortgage Status in Morro Bay
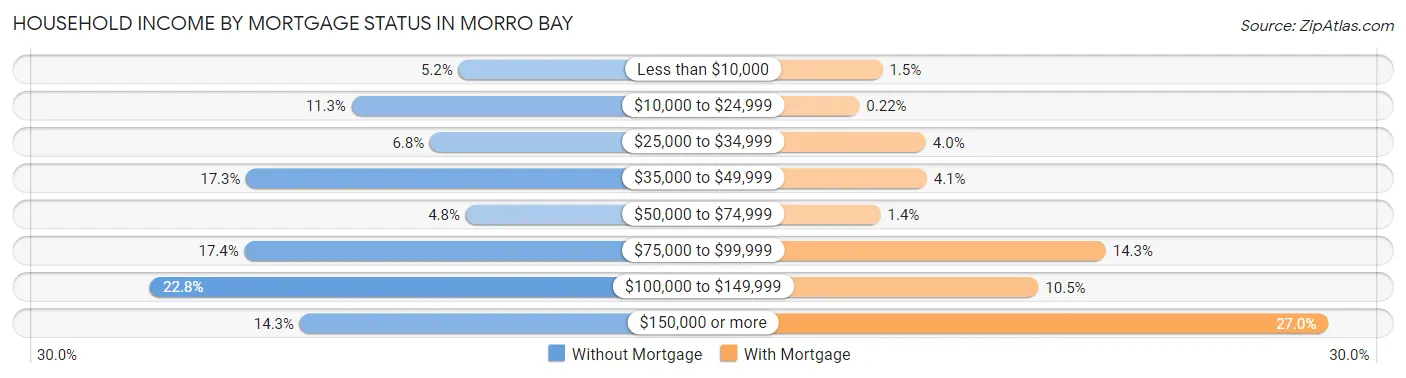
| Household Income | Without Mortgage | With Mortgage |
| Less than $10,000 | 51 (5.2%) | 28 (1.5%) |
| $10,000 to $24,999 | 111 (11.3%) | 4 (0.2%) |
| $25,000 to $34,999 | 67 (6.8%) | 73 (4.0%) |
| $35,000 to $49,999 | 170 (17.3%) | 74 (4.1%) |
| $50,000 to $74,999 | 47 (4.8%) | 26 (1.4%) |
| $75,000 to $99,999 | 171 (17.4%) | 260 (14.3%) |
| $100,000 to $149,999 | 224 (22.8%) | 190 (10.4%) |
| $150,000 or more | 140 (14.3%) | 491 (27.0%) |
| Total | 981 (100.0%) | 1,818 (100.0%) |
Property Value to Household Income Ratio in Morro Bay
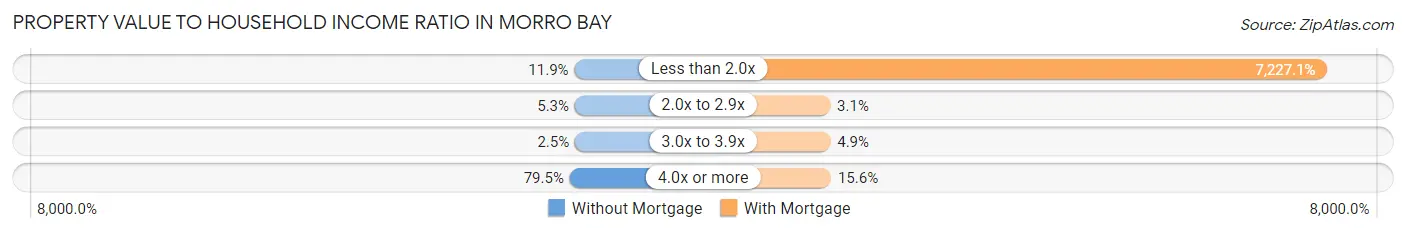
| Value-to-Income Ratio | Without Mortgage | With Mortgage |
| Less than 2.0x | 117 (11.9%) | 131,389 (7,227.1%) |
| 2.0x to 2.9x | 52 (5.3%) | 57 (3.1%) |
| 3.0x to 3.9x | 24 (2.5%) | 89 (4.9%) |
| 4.0x or more | 780 (79.5%) | 284 (15.6%) |
| Total | 981 (100.0%) | 1,818 (100.0%) |
Real Estate Taxes by Mortgage Status in Morro Bay
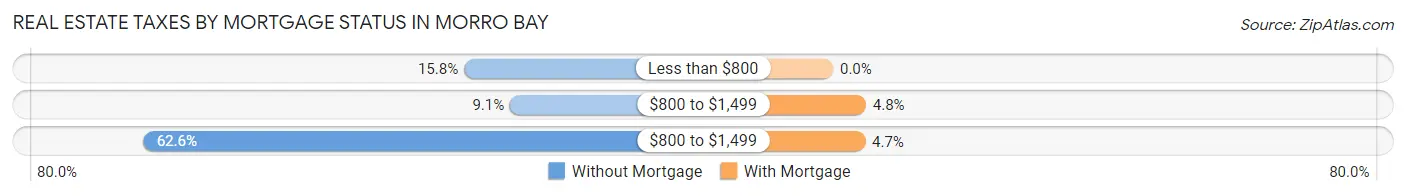
| Property Taxes | Without Mortgage | With Mortgage |
| Less than $800 | 155 (15.8%) | 0 (0.0%) |
| $800 to $1,499 | 89 (9.1%) | 87 (4.8%) |
| $800 to $1,499 | 614 (62.6%) | 85 (4.7%) |
| Total | 981 (100.0%) | 1,818 (100.0%) |
Health & Disability in Morro Bay
Health Insurance Coverage by Age in Morro Bay
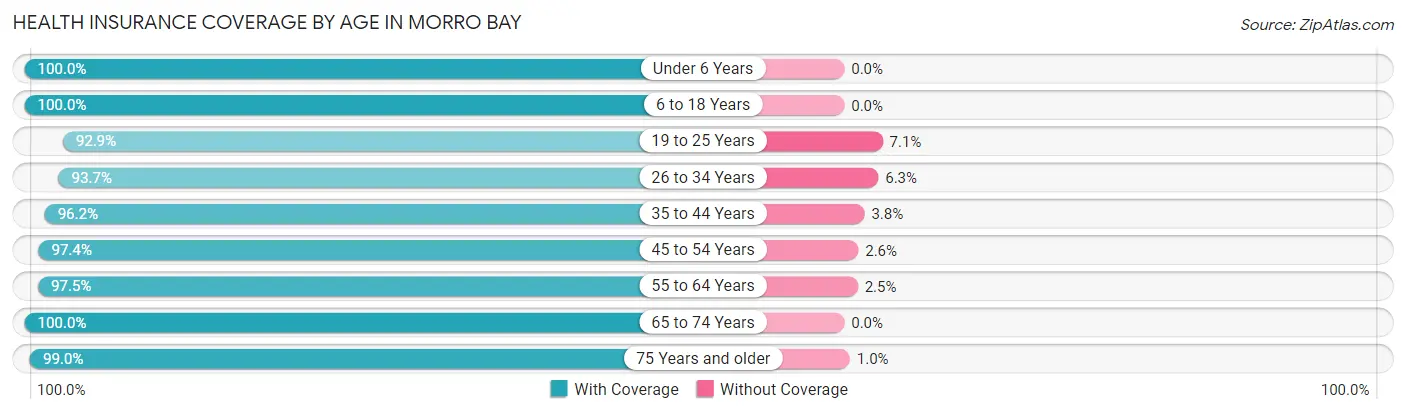
| Age Bracket | With Coverage | Without Coverage |
| Under 6 Years | 393 (100.0%) | 0 (0.0%) |
| 6 to 18 Years | 1,283 (100.0%) | 0 (0.0%) |
| 19 to 25 Years | 911 (92.9%) | 70 (7.1%) |
| 26 to 34 Years | 931 (93.7%) | 63 (6.3%) |
| 35 to 44 Years | 794 (96.2%) | 31 (3.8%) |
| 45 to 54 Years | 1,158 (97.4%) | 31 (2.6%) |
| 55 to 64 Years | 1,911 (97.5%) | 49 (2.5%) |
| 65 to 74 Years | 1,882 (100.0%) | 0 (0.0%) |
| 75 Years and older | 1,058 (99.0%) | 11 (1.0%) |
| Total | 10,321 (97.6%) | 255 (2.4%) |
Health Insurance Coverage by Citizenship Status in Morro Bay
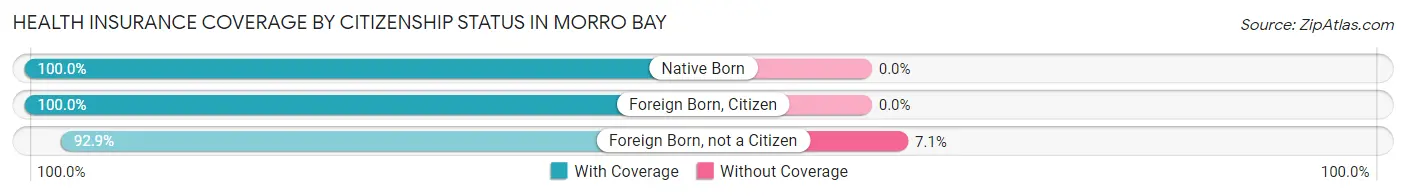
| Citizenship Status | With Coverage | Without Coverage |
| Native Born | 393 (100.0%) | 0 (0.0%) |
| Foreign Born, Citizen | 1,283 (100.0%) | 0 (0.0%) |
| Foreign Born, not a Citizen | 911 (92.9%) | 70 (7.1%) |
Health Insurance Coverage by Household Income in Morro Bay
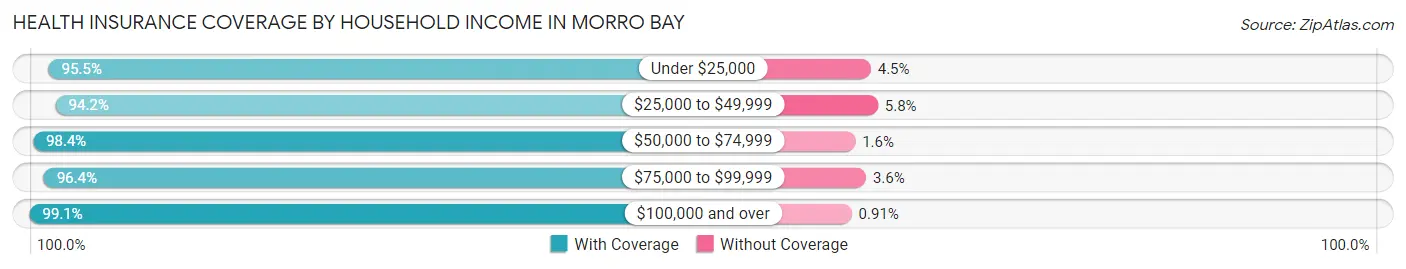
| Household Income | With Coverage | Without Coverage |
| Under $25,000 | 954 (95.5%) | 45 (4.5%) |
| $25,000 to $49,999 | 955 (94.2%) | 59 (5.8%) |
| $50,000 to $74,999 | 1,320 (98.4%) | 21 (1.6%) |
| $75,000 to $99,999 | 1,745 (96.4%) | 65 (3.6%) |
| $100,000 and over | 5,318 (99.1%) | 49 (0.9%) |
Public vs Private Health Insurance Coverage by Age in Morro Bay
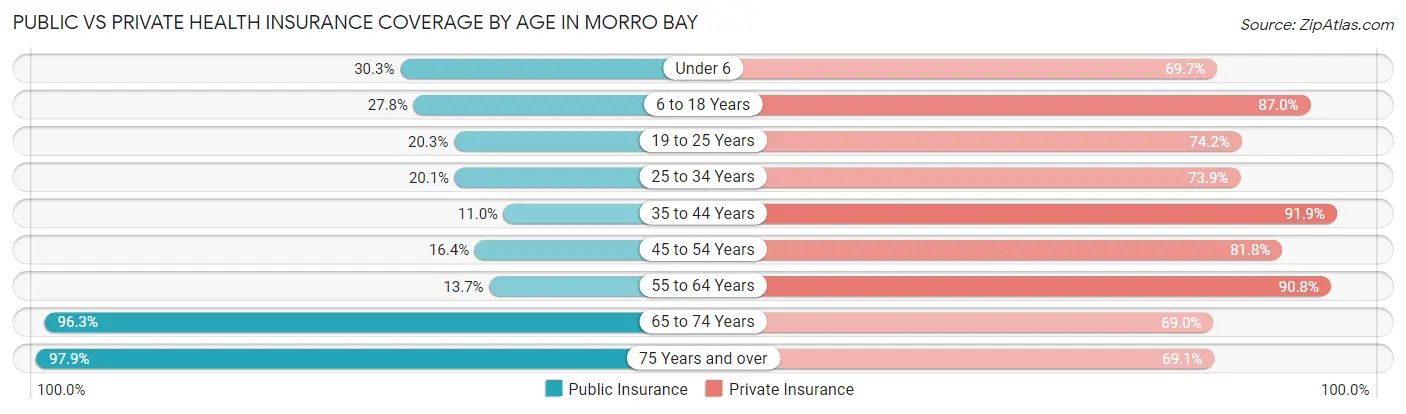
| Age Bracket | Public Insurance | Private Insurance |
| Under 6 | 119 (30.3%) | 274 (69.7%) |
| 6 to 18 Years | 356 (27.8%) | 1,116 (87.0%) |
| 19 to 25 Years | 199 (20.3%) | 728 (74.2%) |
| 25 to 34 Years | 200 (20.1%) | 735 (73.9%) |
| 35 to 44 Years | 91 (11.0%) | 758 (91.9%) |
| 45 to 54 Years | 195 (16.4%) | 972 (81.8%) |
| 55 to 64 Years | 269 (13.7%) | 1,779 (90.8%) |
| 65 to 74 Years | 1,812 (96.3%) | 1,298 (69.0%) |
| 75 Years and over | 1,046 (97.9%) | 739 (69.1%) |
| Total | 4,287 (40.5%) | 8,399 (79.4%) |
Disability Status by Sex by Age in Morro Bay
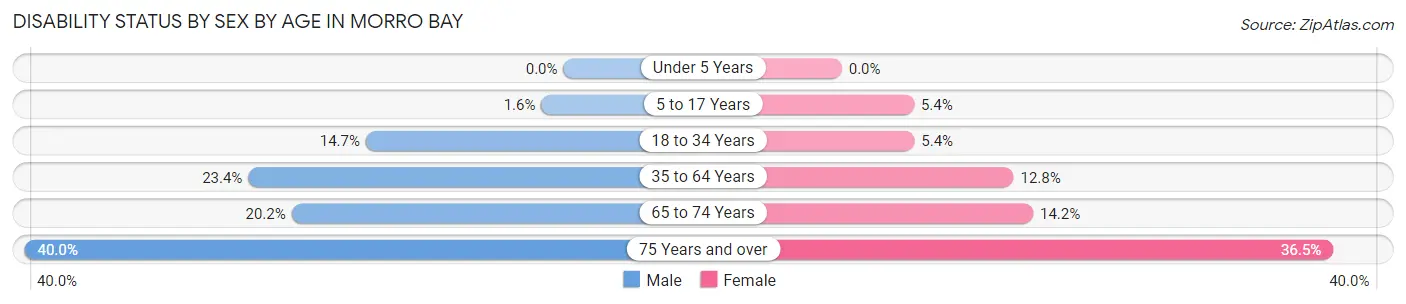
| Age Bracket | Male | Female |
| Under 5 Years | 0 (0.0%) | 0 (0.0%) |
| 5 to 17 Years | 9 (1.6%) | 25 (5.4%) |
| 18 to 34 Years | 169 (14.7%) | 62 (5.4%) |
| 35 to 64 Years | 438 (23.4%) | 268 (12.8%) |
| 65 to 74 Years | 205 (20.2%) | 123 (14.2%) |
| 75 Years and over | 182 (40.0%) | 224 (36.5%) |
Disability Class by Sex by Age in Morro Bay
Disability Class: Hearing Difficulty
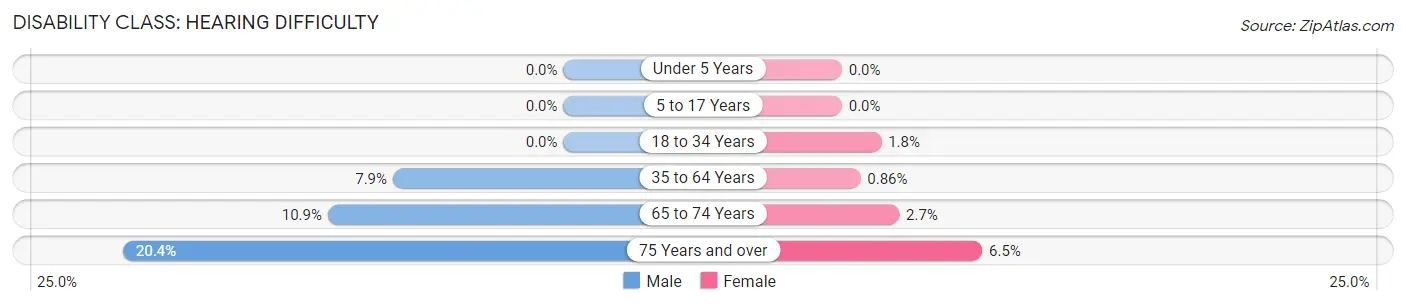
| Age Bracket | Male | Female |
| Under 5 Years | 0 (0.0%) | 0 (0.0%) |
| 5 to 17 Years | 0 (0.0%) | 0 (0.0%) |
| 18 to 34 Years | 0 (0.0%) | 21 (1.8%) |
| 35 to 64 Years | 148 (7.9%) | 18 (0.9%) |
| 65 to 74 Years | 111 (10.9%) | 23 (2.7%) |
| 75 Years and over | 93 (20.4%) | 40 (6.5%) |
Disability Class: Vision Difficulty
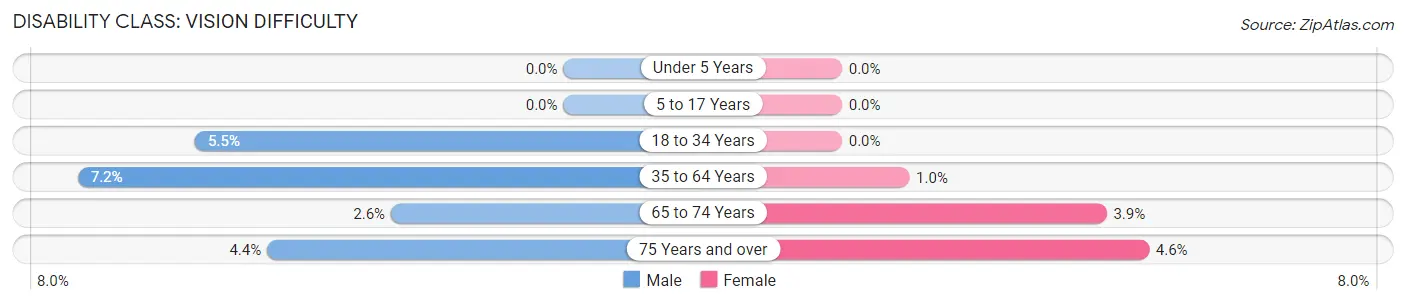
| Age Bracket | Male | Female |
| Under 5 Years | 0 (0.0%) | 0 (0.0%) |
| 5 to 17 Years | 0 (0.0%) | 0 (0.0%) |
| 18 to 34 Years | 63 (5.5%) | 0 (0.0%) |
| 35 to 64 Years | 135 (7.2%) | 21 (1.0%) |
| 65 to 74 Years | 26 (2.6%) | 34 (3.9%) |
| 75 Years and over | 20 (4.4%) | 28 (4.6%) |
Disability Class: Cognitive Difficulty
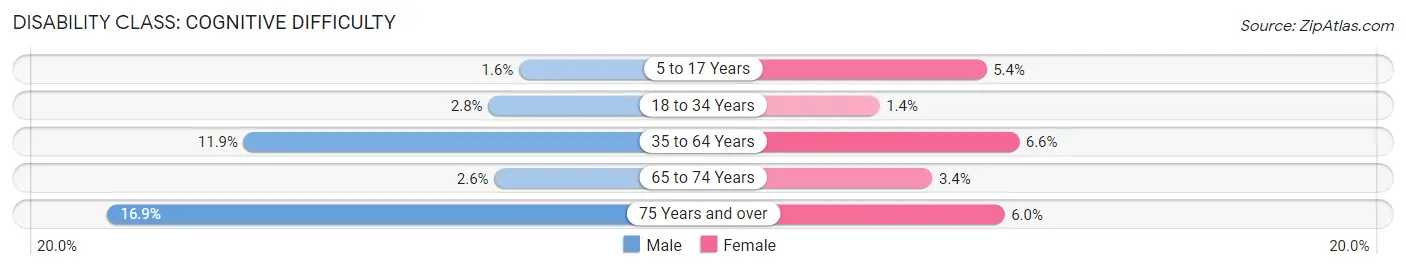
| Age Bracket | Male | Female |
| 5 to 17 Years | 9 (1.6%) | 25 (5.4%) |
| 18 to 34 Years | 32 (2.8%) | 16 (1.4%) |
| 35 to 64 Years | 222 (11.9%) | 138 (6.6%) |
| 65 to 74 Years | 26 (2.6%) | 29 (3.4%) |
| 75 Years and over | 77 (16.9%) | 37 (6.0%) |
Disability Class: Ambulatory Difficulty
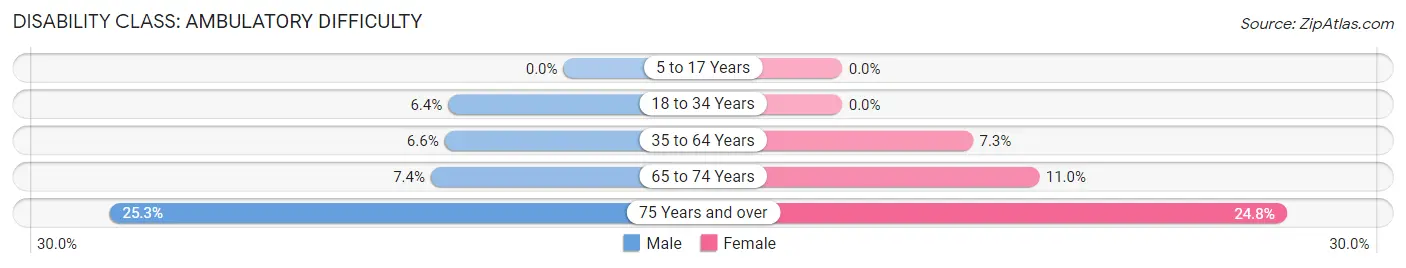
| Age Bracket | Male | Female |
| 5 to 17 Years | 0 (0.0%) | 0 (0.0%) |
| 18 to 34 Years | 74 (6.4%) | 0 (0.0%) |
| 35 to 64 Years | 124 (6.6%) | 153 (7.3%) |
| 65 to 74 Years | 75 (7.4%) | 95 (11.0%) |
| 75 Years and over | 115 (25.3%) | 152 (24.8%) |
Disability Class: Self-Care Difficulty
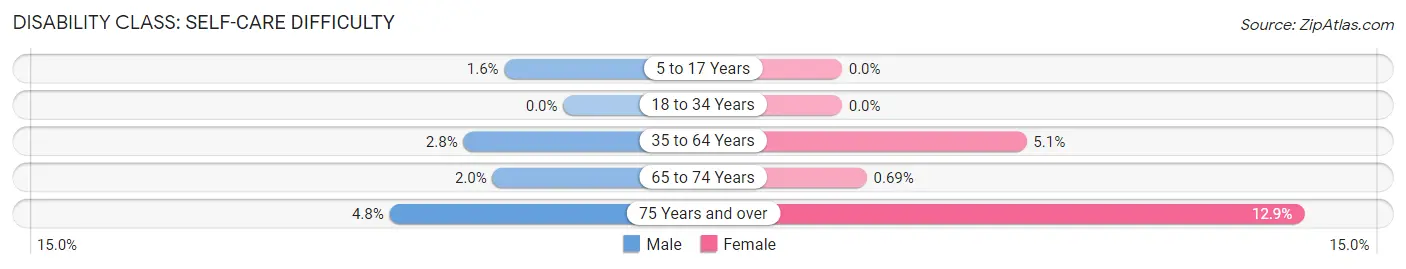
| Age Bracket | Male | Female |
| 5 to 17 Years | 9 (1.6%) | 0 (0.0%) |
| 18 to 34 Years | 0 (0.0%) | 0 (0.0%) |
| 35 to 64 Years | 52 (2.8%) | 108 (5.1%) |
| 65 to 74 Years | 20 (2.0%) | 6 (0.7%) |
| 75 Years and over | 22 (4.8%) | 79 (12.9%) |
Technology Access in Morro Bay
Computing Device Access in Morro Bay
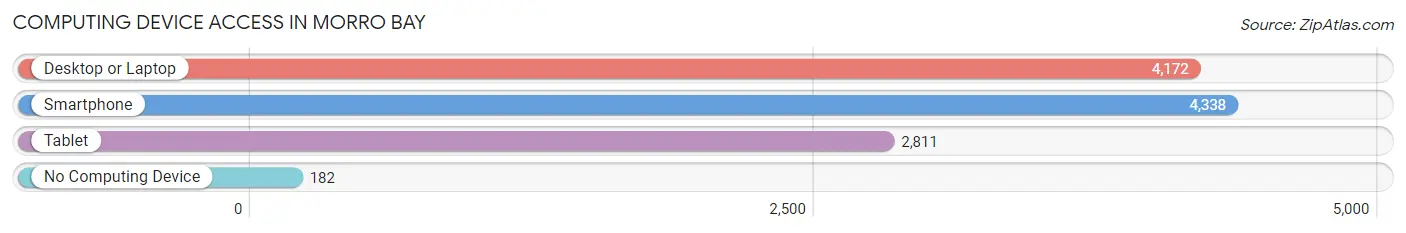
| Device Type | # Households | % Households |
| Desktop or Laptop | 4,172 | 86.0% |
| Smartphone | 4,338 | 89.4% |
| Tablet | 2,811 | 57.9% |
| No Computing Device | 182 | 3.7% |
| Total | 4,852 | 100.0% |
Internet Access in Morro Bay
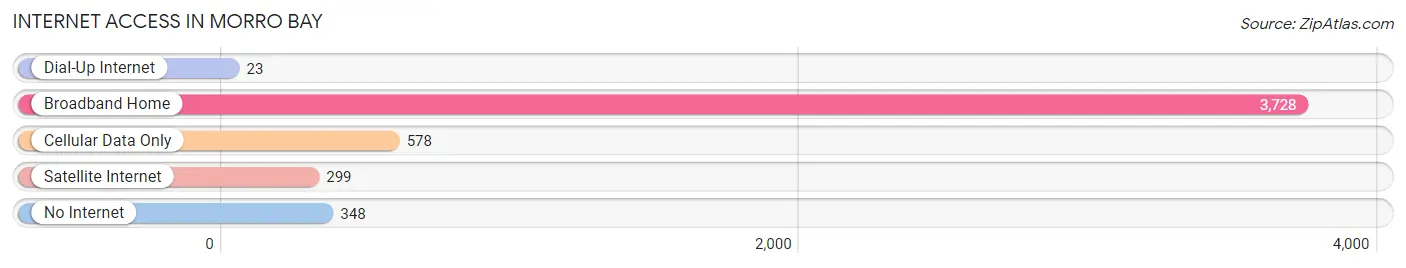
| Internet Type | # Households | % Households |
| Dial-Up Internet | 23 | 0.5% |
| Broadband Home | 3,728 | 76.8% |
| Cellular Data Only | 578 | 11.9% |
| Satellite Internet | 299 | 6.2% |
| No Internet | 348 | 7.2% |
| Total | 4,852 | 100.0% |
Morro Bay Summary
Morro Bay is a coastal city located in San Luis Obispo County, California. It is situated on the Pacific Ocean, just south of San Luis Obispo and north of Los Osos. The city is known for its iconic Morro Rock, a 581-foot volcanic plug that is visible from many points in the city. The population of Morro Bay was 10,350 at the 2010 census, up from 8,917 at the 2000 census.
History
The area around Morro Bay was first inhabited by the Chumash people, who lived in the area for thousands of years. The first European to explore the area was Juan Rodríguez Cabrillo, who sailed up the coast in 1542. The area was later explored by Spanish missionaries, who established a mission in nearby San Luis Obispo in 1772.
The town of Morro Bay was founded in 1870 by a group of settlers from San Luis Obispo. The town was named after the nearby Morro Rock, which was named by Spanish explorers in the late 1700s. The town quickly grew, and by the early 1900s it was a popular tourist destination.
Geography
Morro Bay is located at 35°22'25" North, 120°51'37" West (35.373611, -120.860278). It is situated on the Pacific Ocean, just south of San Luis Obispo and north of Los Osos. The city is bordered by the Los Osos Valley to the east and the Morro Bay Estuary to the west.
The city covers an area of 8.3 square miles, of which 7.9 square miles is land and 0.4 square miles is water. The city is located on a bay of the same name, which is part of the larger Morro Bay Estuary. The bay is home to a variety of wildlife, including sea otters, harbor seals, and sea lions.
Economy
The economy of Morro Bay is largely based on tourism. The city is home to a variety of attractions, including the iconic Morro Rock, the Morro Bay State Park, and the Morro Bay National Estuary. The city also has a thriving fishing industry, with a number of commercial fishing boats operating out of the harbor.
In addition to tourism and fishing, Morro Bay is home to a number of other businesses, including restaurants, retail stores, and art galleries. The city is also home to a number of manufacturing companies, including a boat building company and a company that produces surfboards.
Demographics
As of the 2010 census, there were 10,350 people, 4,541 households, and 2,541 families residing in the city. The population density was 1,269.2 people per square mile. The racial makeup of the city was 84.2% White, 0.7% African American, 0.7% Native American, 5.2% Asian, 0.2% Pacific Islander, 5.7% from other races, and 3.4% from two or more races. Hispanic or Latino of any race were 13.3% of the population.
The median income for a household in the city was $45,837, and the median income for a family was $54,844. Males had a median income of $41,945 versus $30,917 for females. The per capita income for the city was $25,945. About 8.2% of families and 11.2% of the population were below the poverty line, including 15.2% of those under age 18 and 6.2% of those age 65 or over.
Common Questions
What is Per Capita Income in Morro Bay?
Per Capita income in Morro Bay is $50,928.
What is the Median Family Income in Morro Bay?
Median Family Income in Morro Bay is $111,801.
What is the Median Household income in Morro Bay?
Median Household Income in Morro Bay is $88,547.
What is Income or Wage Gap in Morro Bay?
Income or Wage Gap in Morro Bay is 39.1%.
Women in Morro Bay earn 60.9 cents for every dollar earned by a man.
What is Inequality or Gini Index in Morro Bay?
Inequality or Gini Index in Morro Bay is 0.43.
What is the Total Population of Morro Bay?
Total Population of Morro Bay is 10,766.
What is the Total Male Population of Morro Bay?
Total Male Population of Morro Bay is 5,258.
What is the Total Female Population of Morro Bay?
Total Female Population of Morro Bay is 5,508.
What is the Ratio of Males per 100 Females in Morro Bay?
There are 95.46 Males per 100 Females in Morro Bay.
What is the Ratio of Females per 100 Males in Morro Bay?
There are 104.75 Females per 100 Males in Morro Bay.
What is the Median Population Age in Morro Bay?
Median Population Age in Morro Bay is 52.1 Years.
What is the Average Family Size in Morro Bay
Average Family Size in Morro Bay is 2.8 People.
What is the Average Household Size in Morro Bay
Average Household Size in Morro Bay is 2.2 People.
How Large is the Labor Force in Morro Bay?
There are 5,493 People in the Labor Forcein in Morro Bay.
What is the Percentage of People in the Labor Force in Morro Bay?
57.7% of People are in the Labor Force in Morro Bay.
What is the Unemployment Rate in Morro Bay?
Unemployment Rate in Morro Bay is 9.2%.