Rio Linda, CA Map & Demographics
Rio Linda Map
Rio Linda Overview
$32,777
PER CAPITA INCOME
$97,988
AVG FAMILY INCOME
$88,102
AVG HOUSEHOLD INCOME
12.5%
WAGE / INCOME GAP [ % ]
87.5¢/ $1
WAGE / INCOME GAP [ $ ]
0.40
INEQUALITY / GINI INDEX
16,596
TOTAL POPULATION
7,882
MALE POPULATION
8,714
FEMALE POPULATION
90.45
MALES / 100 FEMALES
110.56
FEMALES / 100 MALES
36.7
MEDIAN AGE
3.6
AVG FAMILY SIZE
3.2
AVG HOUSEHOLD SIZE
7,702
LABOR FORCE [ PEOPLE ]
59.4%
PERCENT IN LABOR FORCE
4.9%
UNEMPLOYMENT RATE
Rio Linda Zip Codes
Rio Linda Area Codes
Income in Rio Linda
Income Overview in Rio Linda
Per Capita Income in Rio Linda is $32,777, while median incomes of families and households are $97,988 and $88,102 respectively.
| Characteristic | Number | Measure |
| Per Capita Income | 16,596 | $32,777 |
| Median Family Income | 4,004 | $97,988 |
| Mean Family Income | 4,004 | $110,351 |
| Median Household Income | 5,134 | $88,102 |
| Mean Household Income | 5,134 | $102,693 |
| Income Deficit | 4,004 | $0 |
| Wage / Income Gap (%) | 16,596 | 12.54% |
| Wage / Income Gap ($) | 16,596 | 87.46¢ per $1 |
| Gini / Inequality Index | 16,596 | 0.40 |
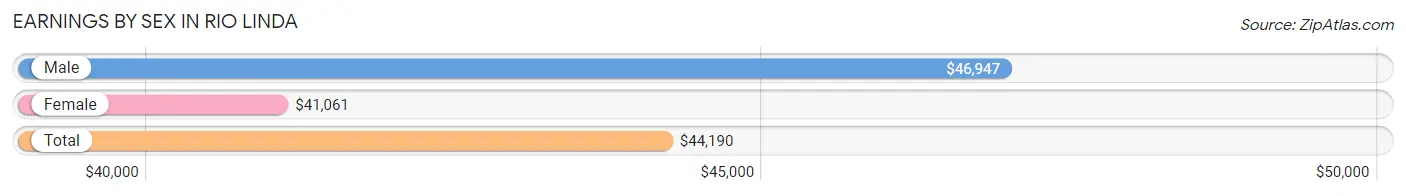
Earnings by Sex in Rio Linda
Average Earnings in Rio Linda are $44,190, $46,947 for men and $41,061 for women, a difference of 12.5%.
| Sex | Number | Average Earnings |
| Male | 4,047 (51.2%) | $46,947 |
| Female | 3,862 (48.8%) | $41,061 |
| Total | 7,909 (100.0%) | $44,190 |
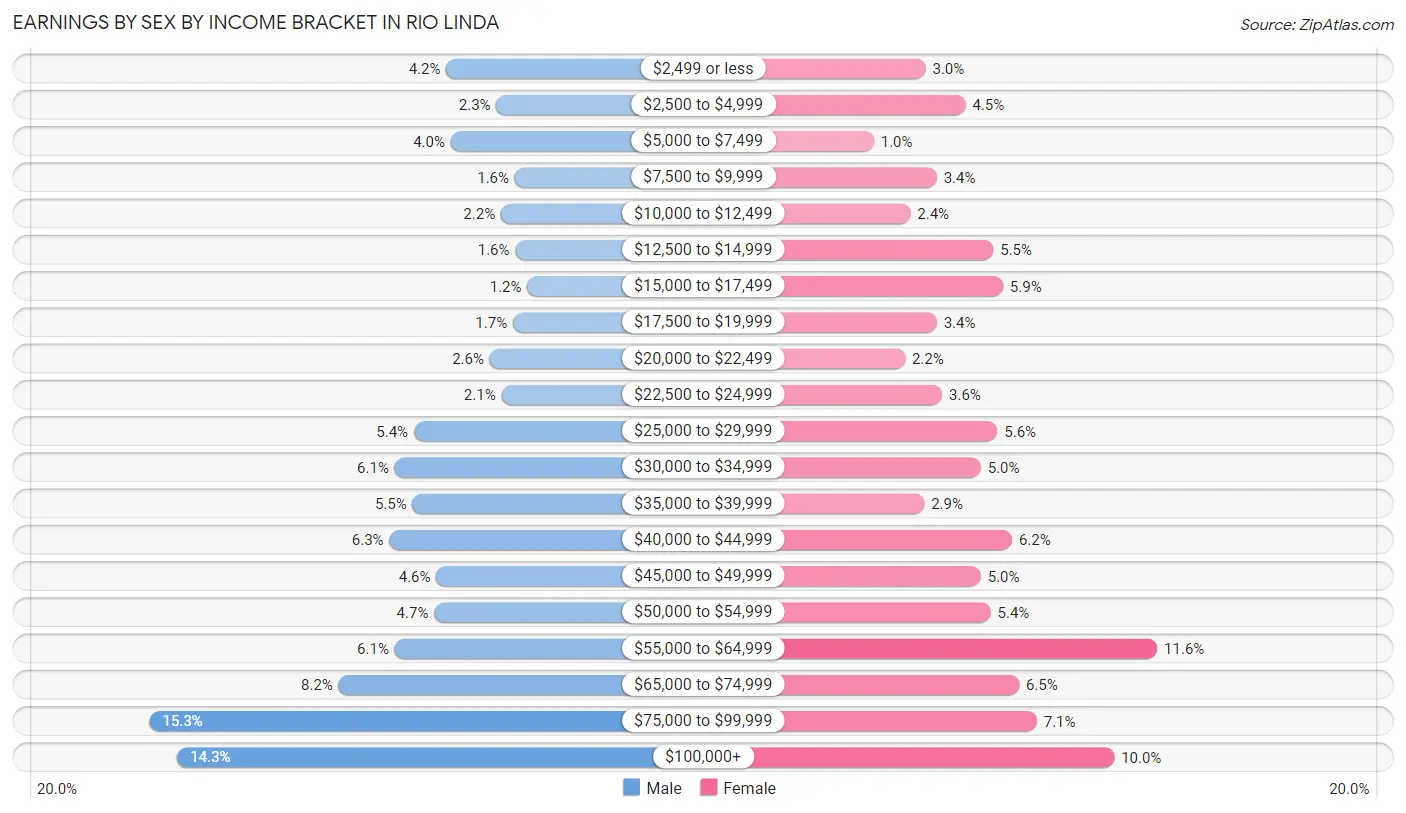
Earnings by Sex by Income Bracket in Rio Linda
The most common earnings brackets in Rio Linda are $75,000 to $99,999 for men (620 | 15.3%) and $55,000 to $64,999 for women (449 | 11.6%).
| Income | Male | Female |
| $2,499 or less | 170 (4.2%) | 114 (2.9%) |
| $2,500 to $4,999 | 94 (2.3%) | 172 (4.4%) |
| $5,000 to $7,499 | 163 (4.0%) | 39 (1.0%) |
| $7,500 to $9,999 | 66 (1.6%) | 130 (3.4%) |
| $10,000 to $12,499 | 87 (2.1%) | 92 (2.4%) |
| $12,500 to $14,999 | 65 (1.6%) | 212 (5.5%) |
| $15,000 to $17,499 | 47 (1.2%) | 226 (5.9%) |
| $17,500 to $19,999 | 69 (1.7%) | 130 (3.4%) |
| $20,000 to $22,499 | 104 (2.6%) | 84 (2.2%) |
| $22,500 to $24,999 | 86 (2.1%) | 138 (3.6%) |
| $25,000 to $29,999 | 219 (5.4%) | 218 (5.6%) |
| $30,000 to $34,999 | 248 (6.1%) | 194 (5.0%) |
| $35,000 to $39,999 | 221 (5.5%) | 112 (2.9%) |
| $40,000 to $44,999 | 256 (6.3%) | 239 (6.2%) |
| $45,000 to $49,999 | 185 (4.6%) | 194 (5.0%) |
| $50,000 to $54,999 | 188 (4.6%) | 208 (5.4%) |
| $55,000 to $64,999 | 248 (6.1%) | 449 (11.6%) |
| $65,000 to $74,999 | 333 (8.2%) | 249 (6.5%) |
| $75,000 to $99,999 | 620 (15.3%) | 275 (7.1%) |
| $100,000+ | 578 (14.3%) | 387 (10.0%) |
| Total | 4,047 (100.0%) | 3,862 (100.0%) |
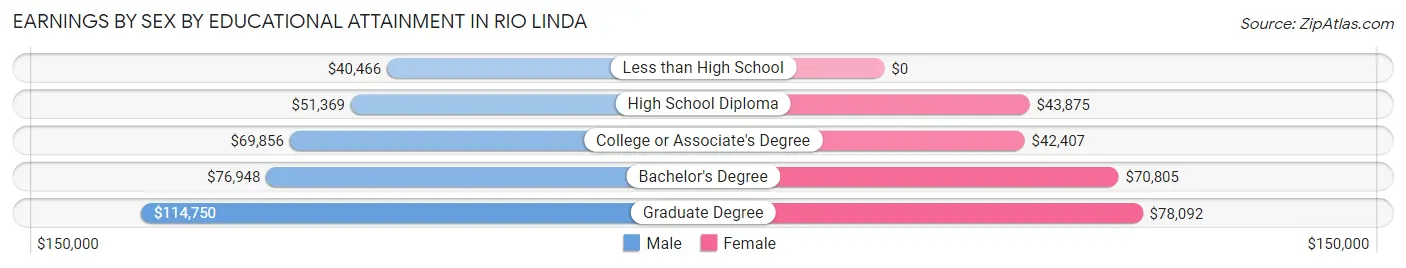
Earnings by Sex by Educational Attainment in Rio Linda
Average earnings in Rio Linda are $56,667 for men and $46,343 for women, a difference of 18.2%. Men with an educational attainment of graduate degree enjoy the highest average annual earnings of $114,750, while those with less than high school education earn the least with $40,466. Women with an educational attainment of graduate degree earn the most with the average annual earnings of $78,092, while those with college or associate's degree education have the smallest earnings of $42,407.
| Educational Attainment | Male Income | Female Income |
| Less than High School | $40,466 | $0 |
| High School Diploma | $51,369 | $43,875 |
| College or Associate's Degree | $69,856 | $42,407 |
| Bachelor's Degree | $76,948 | $70,805 |
| Graduate Degree | $114,750 | $78,092 |
| Total | $56,667 | $46,343 |
Family Income in Rio Linda
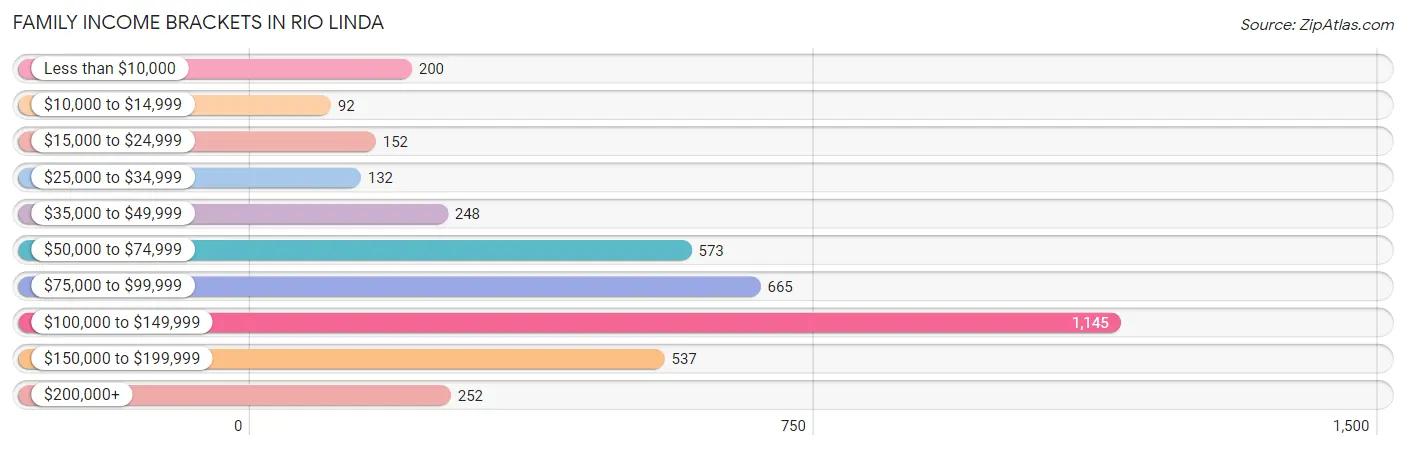
Family Income Brackets in Rio Linda
According to the Rio Linda family income data, there are 1,145 families falling into the $100,000 to $149,999 income range, which is the most common income bracket and makes up 28.6% of all families. Conversely, the $10,000 to $14,999 income bracket is the least frequent group with only 92 families (2.3%) belonging to this category.
| Income Bracket | # Families | % Families |
| Less than $10,000 | 200 | 5.0% |
| $10,000 to $14,999 | 92 | 2.3% |
| $15,000 to $24,999 | 152 | 3.8% |
| $25,000 to $34,999 | 132 | 3.3% |
| $35,000 to $49,999 | 248 | 6.2% |
| $50,000 to $74,999 | 573 | 14.3% |
| $75,000 to $99,999 | 665 | 16.6% |
| $100,000 to $149,999 | 1,145 | 28.6% |
| $150,000 to $199,999 | 537 | 13.4% |
| $200,000+ | 252 | 6.3% |
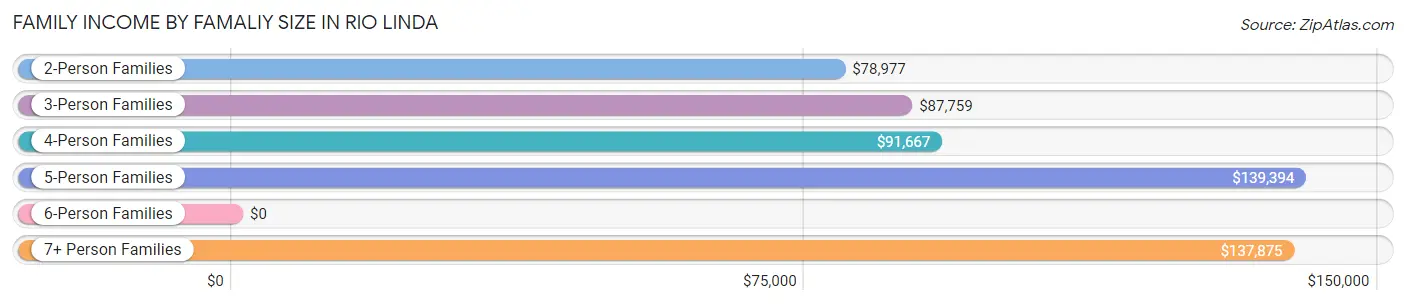
Family Income by Famaliy Size in Rio Linda
5-person families (372 | 9.3%) account for the highest median family income in Rio Linda with $139,394 per family, while 2-person families (1,369 | 34.2%) have the highest median income of $39,488 per family member.
| Income Bracket | # Families | Median Income |
| 2-Person Families | 1,369 (34.2%) | $78,977 |
| 3-Person Families | 1,108 (27.7%) | $87,759 |
| 4-Person Families | 624 (15.6%) | $91,667 |
| 5-Person Families | 372 (9.3%) | $139,394 |
| 6-Person Families | 268 (6.7%) | $0 |
| 7+ Person Families | 263 (6.6%) | $137,875 |
| Total | 4,004 (100.0%) | $97,988 |
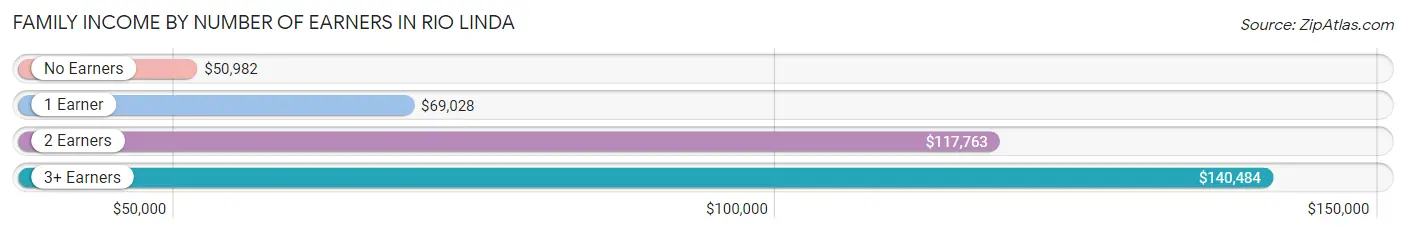
Family Income by Number of Earners in Rio Linda
The median family income in Rio Linda is $97,988, with families comprising 3+ earners (778) having the highest median family income of $140,484, while families with no earners (609) have the lowest median family income of $50,982, accounting for 19.4% and 15.2% of families, respectively.
| Number of Earners | # Families | Median Income |
| No Earners | 609 (15.2%) | $50,982 |
| 1 Earner | 1,199 (29.9%) | $69,028 |
| 2 Earners | 1,418 (35.4%) | $117,763 |
| 3+ Earners | 778 (19.4%) | $140,484 |
| Total | 4,004 (100.0%) | $97,988 |
Household Income in Rio Linda
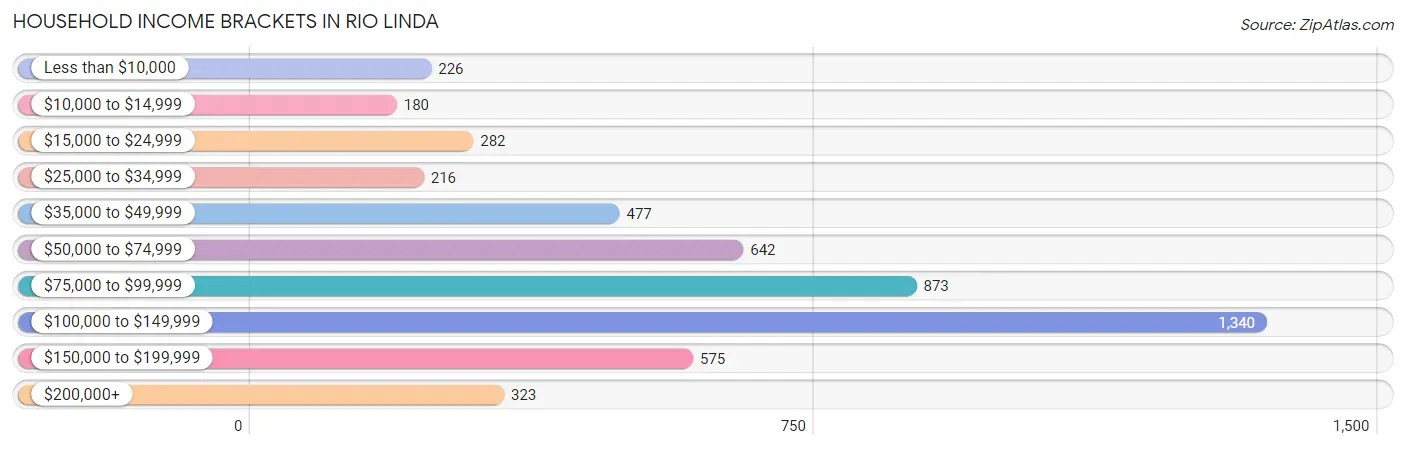
Household Income Brackets in Rio Linda
With 1,340 households falling in the category, the $100,000 to $149,999 income range is the most frequent in Rio Linda, accounting for 26.1% of all households. In contrast, only 180 households (3.5%) fall into the $10,000 to $14,999 income bracket, making it the least populous group.
| Income Bracket | # Households | % Households |
| Less than $10,000 | 226 | 4.4% |
| $10,000 to $14,999 | 180 | 3.5% |
| $15,000 to $24,999 | 282 | 5.5% |
| $25,000 to $34,999 | 216 | 4.2% |
| $35,000 to $49,999 | 477 | 9.3% |
| $50,000 to $74,999 | 642 | 12.5% |
| $75,000 to $99,999 | 873 | 17.0% |
| $100,000 to $149,999 | 1,340 | 26.1% |
| $150,000 to $199,999 | 575 | 11.2% |
| $200,000+ | 323 | 6.3% |
Household Income by Householder Age in Rio Linda
The median household income in Rio Linda is $88,102, with the highest median household income of $97,420 found in the 45 to 64 years age bracket for the primary householder. A total of 2,199 households (42.8%) fall into this category. Meanwhile, the 65+ years age bracket for the primary householder has the lowest median household income of $71,316, with 1,160 households (22.6%) in this group.
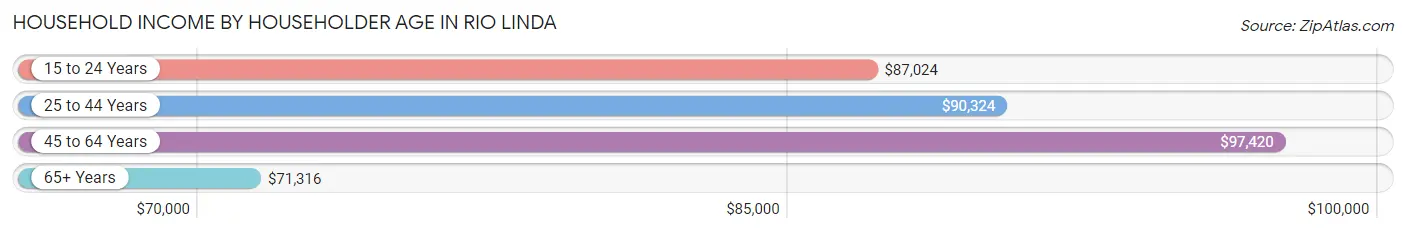
| Income Bracket | # Households | Median Income |
| 15 to 24 Years | 186 (3.6%) | $87,024 |
| 25 to 44 Years | 1,589 (30.9%) | $90,324 |
| 45 to 64 Years | 2,199 (42.8%) | $97,420 |
| 65+ Years | 1,160 (22.6%) | $71,316 |
| Total | 5,134 (100.0%) | $88,102 |
Poverty in Rio Linda
Income Below Poverty by Sex and Age in Rio Linda
With 11.2% poverty level for males and 15.1% for females among the residents of Rio Linda, 16 and 17 year old males and 16 and 17 year old females are the most vulnerable to poverty, with 52 males (26.5%) and 25 females (29.1%) in their respective age groups living below the poverty level.
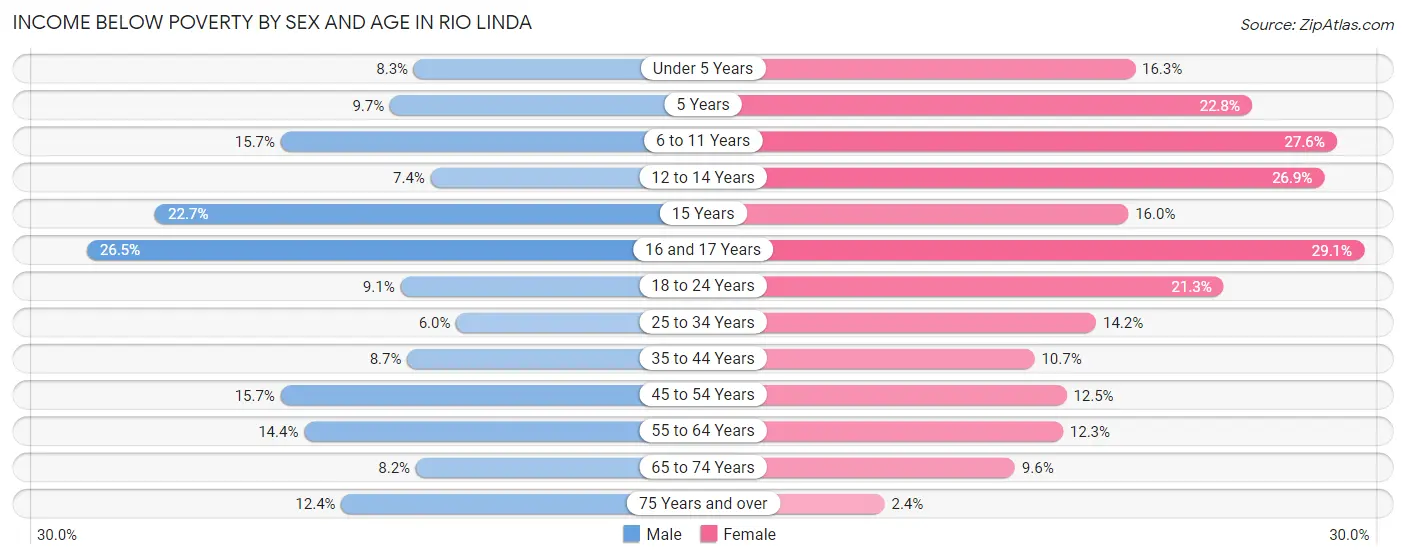
| Age Bracket | Male | Female |
| Under 5 Years | 43 (8.3%) | 114 (16.3%) |
| 5 Years | 11 (9.7%) | 21 (22.8%) |
| 6 to 11 Years | 95 (15.7%) | 238 (27.6%) |
| 12 to 14 Years | 13 (7.4%) | 76 (26.9%) |
| 15 Years | 15 (22.7%) | 26 (16.0%) |
| 16 and 17 Years | 52 (26.5%) | 25 (29.1%) |
| 18 to 24 Years | 85 (9.1%) | 185 (21.3%) |
| 25 to 34 Years | 65 (6.0%) | 143 (14.2%) |
| 35 to 44 Years | 89 (8.7%) | 126 (10.7%) |
| 45 to 54 Years | 150 (15.7%) | 106 (12.5%) |
| 55 to 64 Years | 172 (14.4%) | 179 (12.3%) |
| 65 to 74 Years | 59 (8.2%) | 62 (9.6%) |
| 75 Years and over | 33 (12.4%) | 12 (2.4%) |
| Total | 882 (11.2%) | 1,313 (15.1%) |
Income Above Poverty by Sex and Age in Rio Linda
According to the poverty statistics in Rio Linda, males aged 25 to 34 years and females aged 75 years and over are the age groups that are most secure financially, with 94.0% of males and 97.6% of females in these age groups living above the poverty line.
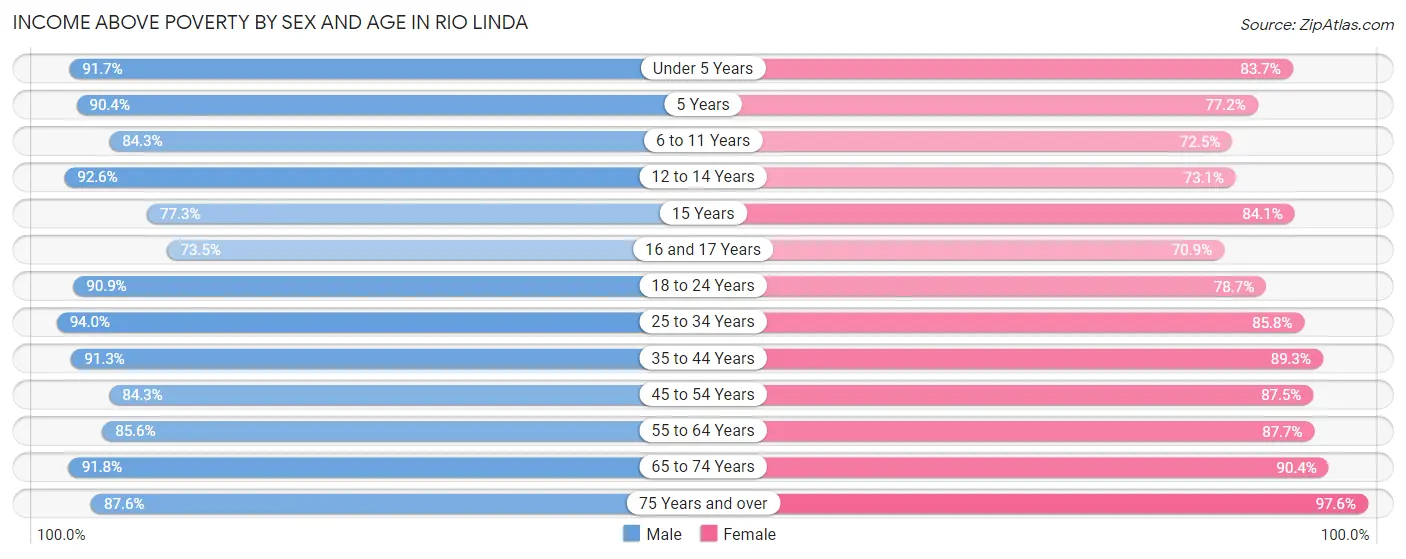
| Age Bracket | Male | Female |
| Under 5 Years | 474 (91.7%) | 584 (83.7%) |
| 5 Years | 103 (90.3%) | 71 (77.2%) |
| 6 to 11 Years | 509 (84.3%) | 626 (72.5%) |
| 12 to 14 Years | 163 (92.6%) | 207 (73.1%) |
| 15 Years | 51 (77.3%) | 137 (84.1%) |
| 16 and 17 Years | 144 (73.5%) | 61 (70.9%) |
| 18 to 24 Years | 852 (90.9%) | 685 (78.7%) |
| 25 to 34 Years | 1,026 (94.0%) | 867 (85.8%) |
| 35 to 44 Years | 935 (91.3%) | 1,048 (89.3%) |
| 45 to 54 Years | 803 (84.3%) | 741 (87.5%) |
| 55 to 64 Years | 1,020 (85.6%) | 1,275 (87.7%) |
| 65 to 74 Years | 660 (91.8%) | 581 (90.4%) |
| 75 Years and over | 234 (87.6%) | 492 (97.6%) |
| Total | 6,974 (88.8%) | 7,375 (84.9%) |
Income Below Poverty Among Married-Couple Families in Rio Linda
The poverty statistics for married-couple families in Rio Linda show that 4.7% or 136 of the total 2,906 families live below the poverty line. Families with 5 or more children have the highest poverty rate of 24.0%, comprising of 23 families. On the other hand, families with 1 or 2 children have the lowest poverty rate of 1.4%, which includes 14 families.
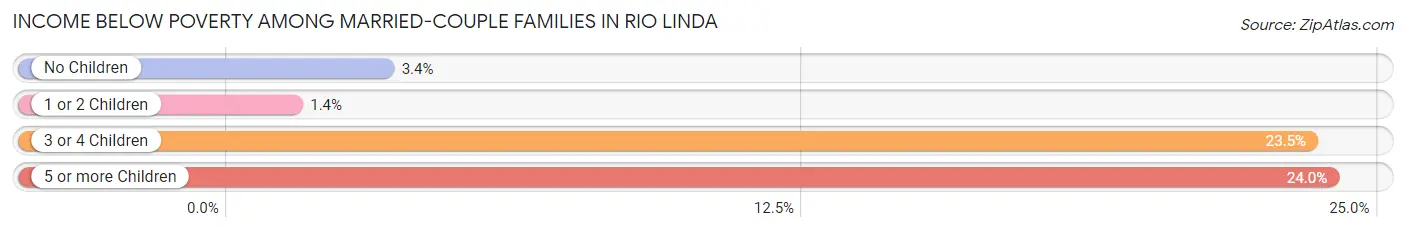
| Children | Above Poverty | Below Poverty |
| No Children | 1,585 (96.6%) | 56 (3.4%) |
| 1 or 2 Children | 972 (98.6%) | 14 (1.4%) |
| 3 or 4 Children | 140 (76.5%) | 43 (23.5%) |
| 5 or more Children | 73 (76.0%) | 23 (24.0%) |
| Total | 2,770 (95.3%) | 136 (4.7%) |
Income Below Poverty Among Single-Parent Households in Rio Linda
According to the poverty data in Rio Linda, 14.1% or 37 single-father households and 26.3% or 220 single-mother households are living below the poverty line. Among single-father households, those with no children have the highest poverty rate, with 37 households (24.7%) experiencing poverty. Likewise, among single-mother households, those with 1 or 2 children have the highest poverty rate, with 156 households (36.9%) falling below the poverty line.
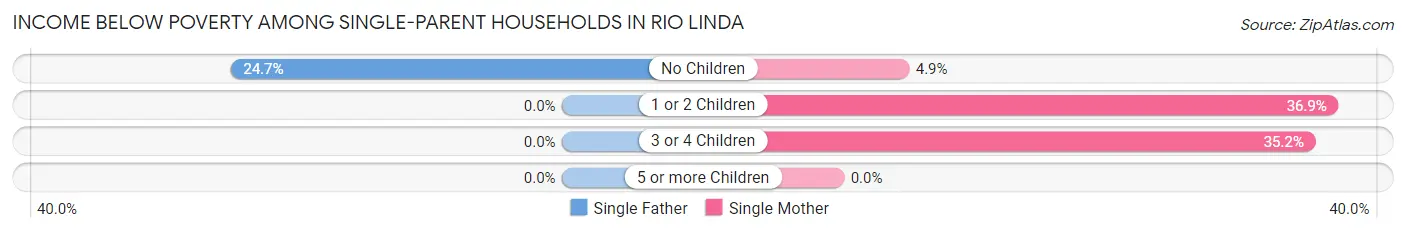
| Children | Single Father | Single Mother |
| No Children | 37 (24.7%) | 13 (4.9%) |
| 1 or 2 Children | 0 (0.0%) | 156 (36.9%) |
| 3 or 4 Children | 0 (0.0%) | 51 (35.2%) |
| 5 or more Children | 0 (0.0%) | 0 (0.0%) |
| Total | 37 (14.1%) | 220 (26.3%) |
Income Below Poverty Among Married-Couple vs Single-Parent Households in Rio Linda
The poverty data for Rio Linda shows that 136 of the married-couple family households (4.7%) and 257 of the single-parent households (23.4%) are living below the poverty level. Within the married-couple family households, those with 5 or more children have the highest poverty rate, with 23 households (24.0%) falling below the poverty line. Among the single-parent households, those with 3 or 4 children have the highest poverty rate, with 51 household (32.3%) living below poverty.
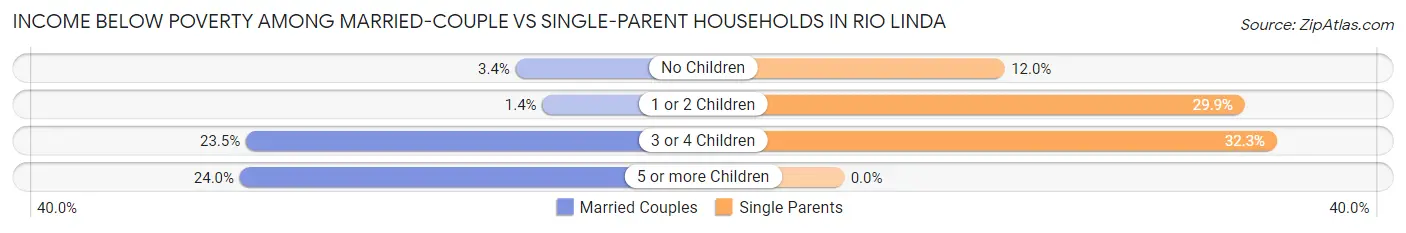
| Children | Married-Couple Families | Single-Parent Households |
| No Children | 56 (3.4%) | 50 (12.0%) |
| 1 or 2 Children | 14 (1.4%) | 156 (29.9%) |
| 3 or 4 Children | 43 (23.5%) | 51 (32.3%) |
| 5 or more Children | 23 (24.0%) | 0 (0.0%) |
| Total | 136 (4.7%) | 257 (23.4%) |
Race in Rio Linda
The most populous races in Rio Linda are White / Caucasian (11,887 | 71.6%), Hispanic or Latino (3,777 | 22.8%), and Some other Race (2,003 | 12.1%).
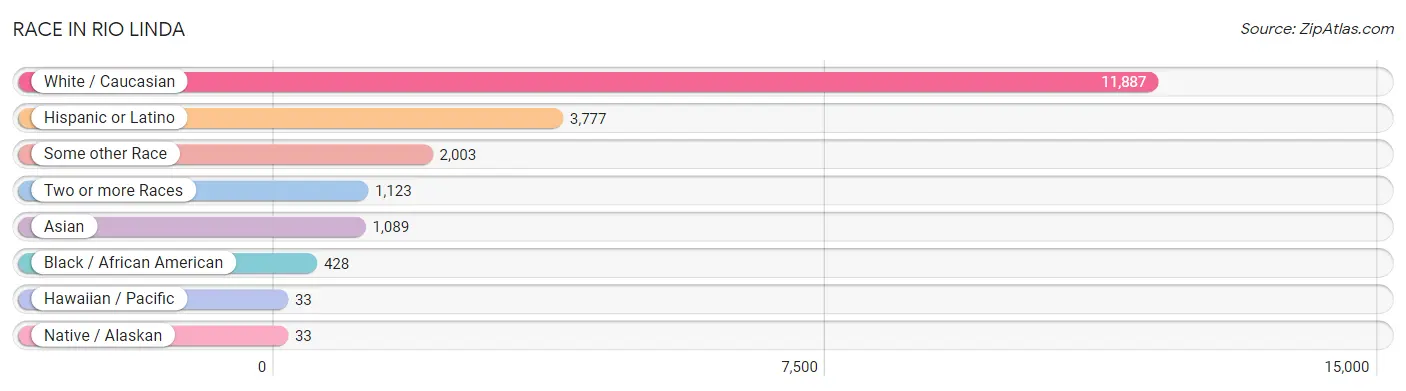
| Race | # Population | % Population |
| Asian | 1,089 | 6.6% |
| Black / African American | 428 | 2.6% |
| Hawaiian / Pacific | 33 | 0.2% |
| Hispanic or Latino | 3,777 | 22.8% |
| Native / Alaskan | 33 | 0.2% |
| White / Caucasian | 11,887 | 71.6% |
| Two or more Races | 1,123 | 6.8% |
| Some other Race | 2,003 | 12.1% |
| Total | 16,596 | 100.0% |
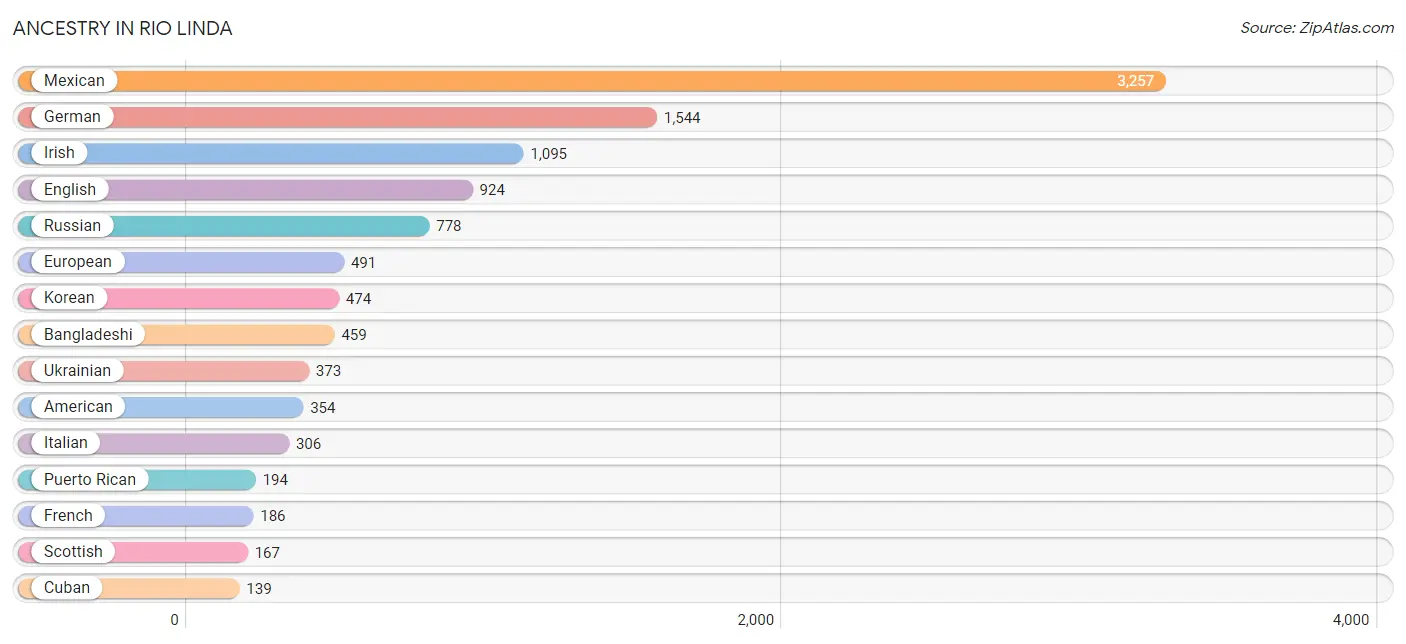
Ancestry in Rio Linda
The most populous ancestries reported in Rio Linda are Mexican (3,257 | 19.6%), German (1,544 | 9.3%), Irish (1,095 | 6.6%), English (924 | 5.6%), and Russian (778 | 4.7%), together accounting for 45.8% of all Rio Linda residents.
| Ancestry | # Population | % Population |
| Alaska Native | 5 | 0.0% |
| American | 354 | 2.1% |
| Arab | 97 | 0.6% |
| Argentinean | 10 | 0.1% |
| Armenian | 109 | 0.7% |
| Austrian | 11 | 0.1% |
| Bangladeshi | 459 | 2.8% |
| Basque | 19 | 0.1% |
| Bhutanese | 64 | 0.4% |
| British | 68 | 0.4% |
| Burmese | 85 | 0.5% |
| Canadian | 30 | 0.2% |
| Central American | 36 | 0.2% |
| Cherokee | 85 | 0.5% |
| Choctaw | 34 | 0.2% |
| Costa Rican | 20 | 0.1% |
| Cuban | 139 | 0.8% |
| Czech | 8 | 0.1% |
| Czechoslovakian | 9 | 0.1% |
| Danish | 40 | 0.2% |
| Dutch | 43 | 0.3% |
| Eastern European | 25 | 0.2% |
| English | 924 | 5.6% |
| European | 491 | 3.0% |
| Finnish | 19 | 0.1% |
| French | 186 | 1.1% |
| French Canadian | 26 | 0.2% |
| German | 1,544 | 9.3% |
| Greek | 7 | 0.0% |
| Guamanian / Chamorro | 13 | 0.1% |
| Indian (Asian) | 65 | 0.4% |
| Irish | 1,095 | 6.6% |
| Italian | 306 | 1.8% |
| Jamaican | 20 | 0.1% |
| Korean | 474 | 2.9% |
| Lithuanian | 49 | 0.3% |
| Mexican | 3,257 | 19.6% |
| Mexican American Indian | 13 | 0.1% |
| Mongolian | 7 | 0.0% |
| Native Hawaiian | 20 | 0.1% |
| New Zealander | 45 | 0.3% |
| Norwegian | 109 | 0.7% |
| Pakistani | 58 | 0.4% |
| Peruvian | 46 | 0.3% |
| Polish | 128 | 0.8% |
| Portuguese | 99 | 0.6% |
| Puerto Rican | 194 | 1.2% |
| Romanian | 73 | 0.4% |
| Russian | 778 | 4.7% |
| Salvadoran | 16 | 0.1% |
| Samoan | 31 | 0.2% |
| Scandinavian | 21 | 0.1% |
| Scotch-Irish | 77 | 0.5% |
| Scottish | 167 | 1.0% |
| Slovak | 8 | 0.1% |
| South American | 56 | 0.3% |
| South American Indian | 10 | 0.1% |
| Spaniard | 28 | 0.2% |
| Spanish | 61 | 0.4% |
| Spanish American | 6 | 0.0% |
| Sri Lankan | 51 | 0.3% |
| Swedish | 39 | 0.2% |
| Swiss | 9 | 0.1% |
| Thai | 40 | 0.2% |
| Tongan | 38 | 0.2% |
| Ukrainian | 373 | 2.2% |
| Welsh | 77 | 0.5% |
| Yugoslavian | 22 | 0.1% | View All 68 Rows |
Immigrants in Rio Linda
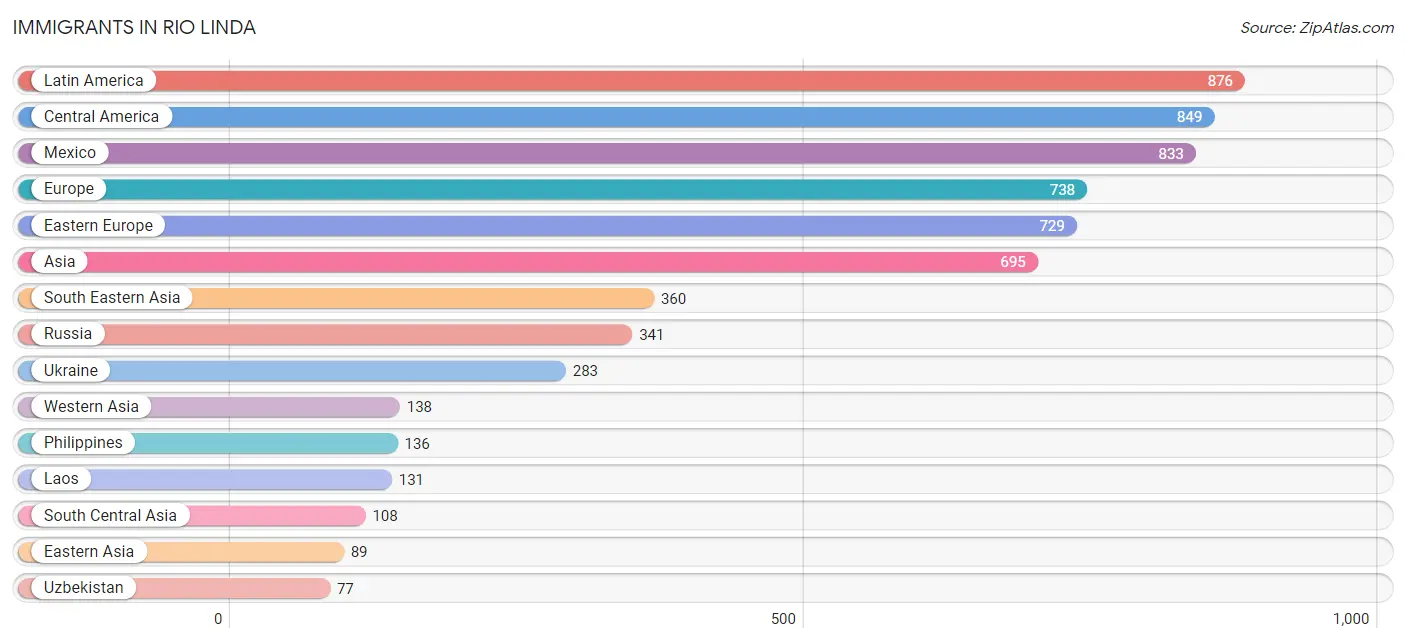
The most numerous immigrant groups reported in Rio Linda came from Latin America (876 | 5.3%), Central America (849 | 5.1%), Mexico (833 | 5.0%), Europe (738 | 4.4%), and Eastern Europe (729 | 4.4%), together accounting for 24.3% of all Rio Linda residents.
| Immigration Origin | # Population | % Population |
| Asia | 695 | 4.2% |
| Australia | 11 | 0.1% |
| Belarus | 32 | 0.2% |
| Central America | 849 | 5.1% |
| China | 9 | 0.1% |
| Eastern Asia | 89 | 0.5% |
| Eastern Europe | 729 | 4.4% |
| El Salvador | 16 | 0.1% |
| Europe | 738 | 4.4% |
| Germany | 9 | 0.1% |
| India | 20 | 0.1% |
| Iraq | 49 | 0.3% |
| Japan | 5 | 0.0% |
| Korea | 75 | 0.4% |
| Kuwait | 8 | 0.1% |
| Laos | 131 | 0.8% |
| Latin America | 876 | 5.3% |
| Mexico | 833 | 5.0% |
| Moldova | 38 | 0.2% |
| Oceania | 11 | 0.1% |
| Peru | 27 | 0.2% |
| Philippines | 136 | 0.8% |
| Romania | 35 | 0.2% |
| Russia | 341 | 2.1% |
| South America | 27 | 0.2% |
| South Central Asia | 108 | 0.6% |
| South Eastern Asia | 360 | 2.2% |
| Thailand | 40 | 0.2% |
| Ukraine | 283 | 1.7% |
| Uzbekistan | 77 | 0.5% |
| Vietnam | 53 | 0.3% |
| Western Asia | 138 | 0.8% |
| Western Europe | 9 | 0.1% | View All 33 Rows |
Sex and Age in Rio Linda
Sex and Age in Rio Linda
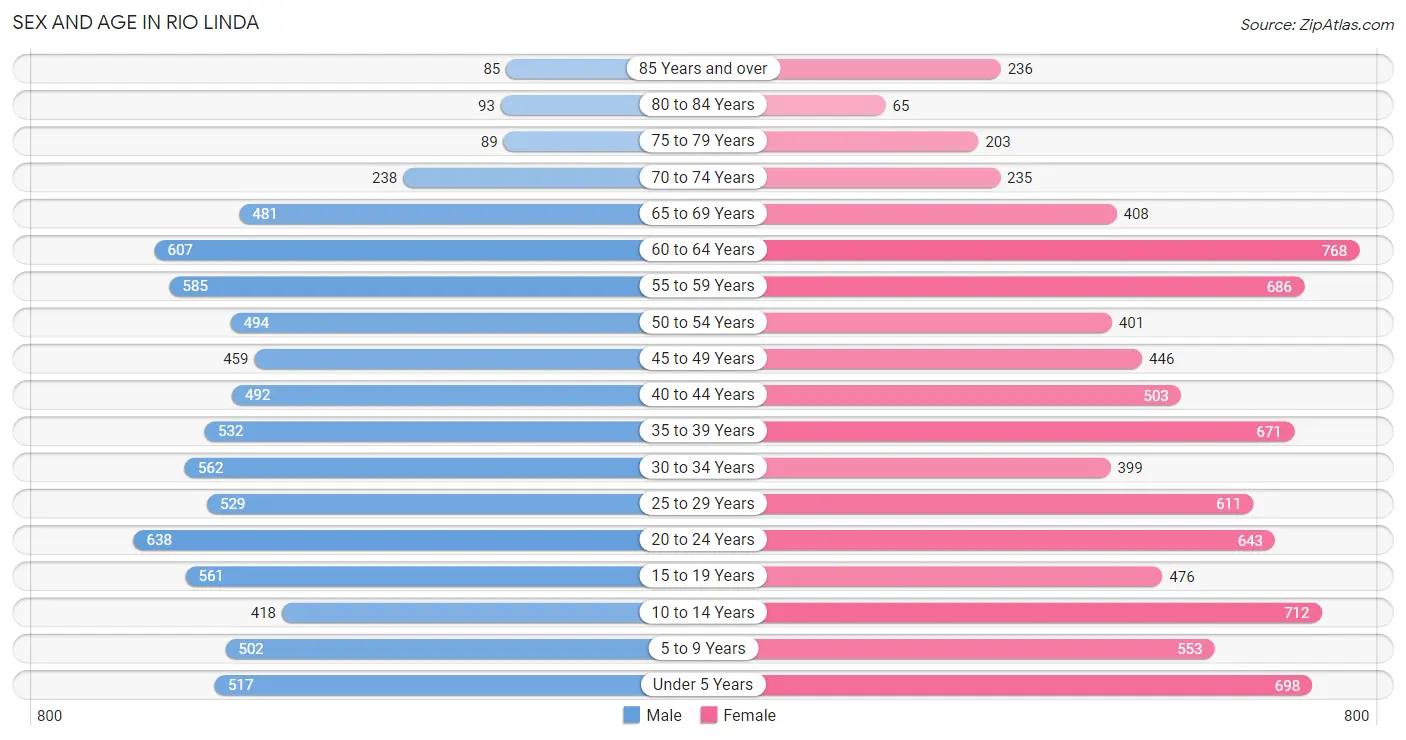
The most populous age groups in Rio Linda are 20 to 24 Years (638 | 8.1%) for men and 60 to 64 Years (768 | 8.8%) for women.
| Age Bracket | Male | Female |
| Under 5 Years | 517 (6.6%) | 698 (8.0%) |
| 5 to 9 Years | 502 (6.4%) | 553 (6.4%) |
| 10 to 14 Years | 418 (5.3%) | 712 (8.2%) |
| 15 to 19 Years | 561 (7.1%) | 476 (5.5%) |
| 20 to 24 Years | 638 (8.1%) | 643 (7.4%) |
| 25 to 29 Years | 529 (6.7%) | 611 (7.0%) |
| 30 to 34 Years | 562 (7.1%) | 399 (4.6%) |
| 35 to 39 Years | 532 (6.8%) | 671 (7.7%) |
| 40 to 44 Years | 492 (6.2%) | 503 (5.8%) |
| 45 to 49 Years | 459 (5.8%) | 446 (5.1%) |
| 50 to 54 Years | 494 (6.3%) | 401 (4.6%) |
| 55 to 59 Years | 585 (7.4%) | 686 (7.9%) |
| 60 to 64 Years | 607 (7.7%) | 768 (8.8%) |
| 65 to 69 Years | 481 (6.1%) | 408 (4.7%) |
| 70 to 74 Years | 238 (3.0%) | 235 (2.7%) |
| 75 to 79 Years | 89 (1.1%) | 203 (2.3%) |
| 80 to 84 Years | 93 (1.2%) | 65 (0.7%) |
| 85 Years and over | 85 (1.1%) | 236 (2.7%) |
| Total | 7,882 (100.0%) | 8,714 (100.0%) |
Families and Households in Rio Linda
Median Family Size in Rio Linda
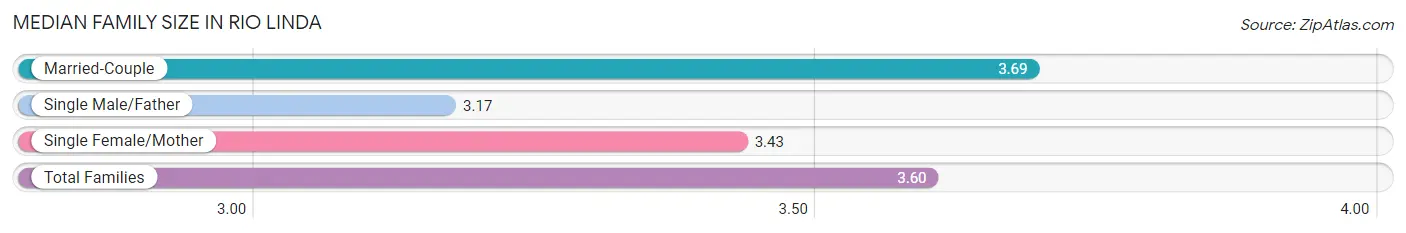
The median family size in Rio Linda is 3.60 persons per family, with married-couple families (2,906 | 72.6%) accounting for the largest median family size of 3.69 persons per family. On the other hand, single male/father families (262 | 6.5%) represent the smallest median family size with 3.17 persons per family.
| Family Type | # Families | Family Size |
| Married-Couple | 2,906 (72.6%) | 3.69 |
| Single Male/Father | 262 (6.5%) | 3.17 |
| Single Female/Mother | 836 (20.9%) | 3.43 |
| Total Families | 4,004 (100.0%) | 3.60 |
Median Household Size in Rio Linda
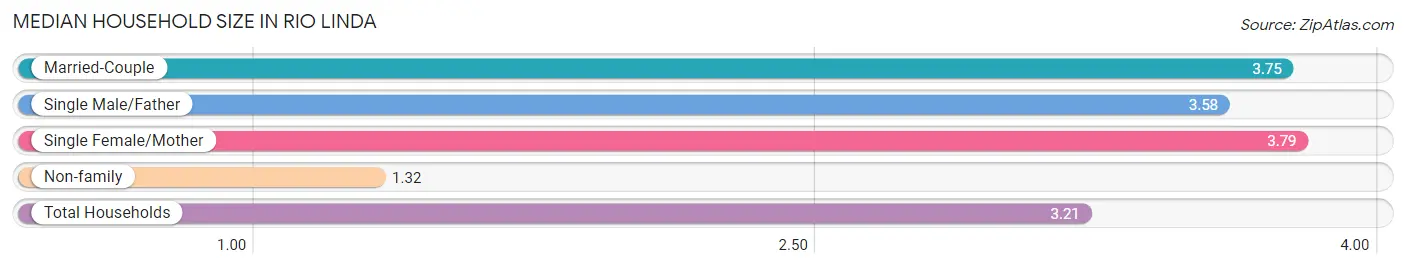
The median household size in Rio Linda is 3.21 persons per household, with single female/mother households (836 | 16.3%) accounting for the largest median household size of 3.79 persons per household. non-family households (1,130 | 22.0%) represent the smallest median household size with 1.32 persons per household.
| Household Type | # Households | Household Size |
| Married-Couple | 2,906 (56.6%) | 3.75 |
| Single Male/Father | 262 (5.1%) | 3.58 |
| Single Female/Mother | 836 (16.3%) | 3.79 |
| Non-family | 1,130 (22.0%) | 1.32 |
| Total Households | 5,134 (100.0%) | 3.21 |
Household Size by Marriage Status in Rio Linda
Out of a total of 5,134 households in Rio Linda, 4,004 (78.0%) are family households, while 1,130 (22.0%) are nonfamily households. The most numerous type of family households are 2-person households, comprising 1,201, and the most common type of nonfamily households are 1-person households, comprising 823.
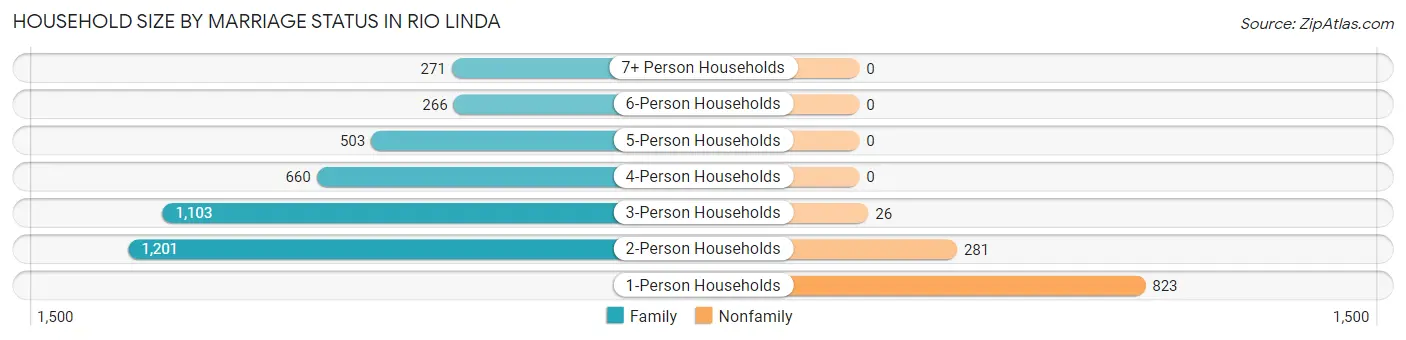
| Household Size | Family Households | Nonfamily Households |
| 1-Person Households | - | 823 (16.0%) |
| 2-Person Households | 1,201 (23.4%) | 281 (5.5%) |
| 3-Person Households | 1,103 (21.5%) | 26 (0.5%) |
| 4-Person Households | 660 (12.9%) | 0 (0.0%) |
| 5-Person Households | 503 (9.8%) | 0 (0.0%) |
| 6-Person Households | 266 (5.2%) | 0 (0.0%) |
| 7+ Person Households | 271 (5.3%) | 0 (0.0%) |
| Total | 4,004 (78.0%) | 1,130 (22.0%) |
Female Fertility in Rio Linda
Fertility by Age in Rio Linda
Average fertility rate in Rio Linda is 92.0 births per 1,000 women. Women in the age bracket of 20 to 34 years have the highest fertility rate with 142.0 births per 1,000 women. Women in the age bracket of 20 to 34 years acount for 66.8% of all women with births.
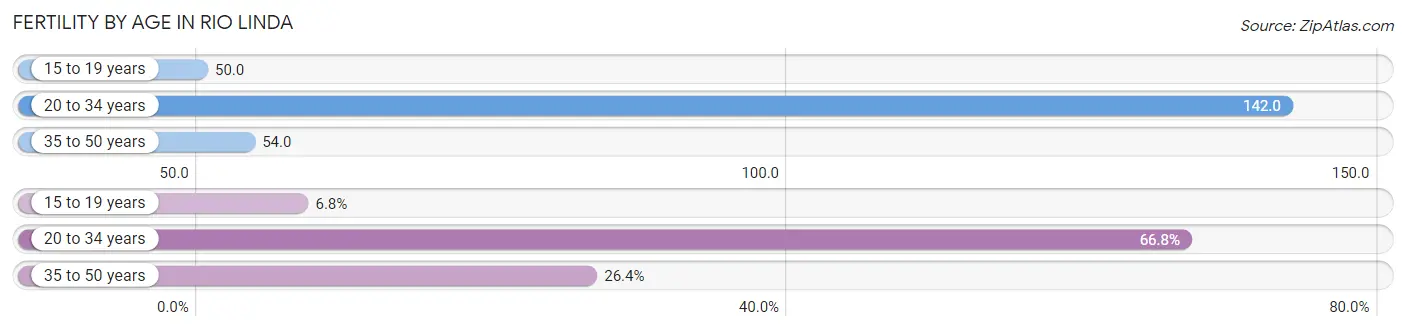
| Age Bracket | Women with Births | Births / 1,000 Women |
| 15 to 19 years | 24 (6.8%) | 50.0 |
| 20 to 34 years | 235 (66.8%) | 142.0 |
| 35 to 50 years | 93 (26.4%) | 54.0 |
| Total | 352 (100.0%) | 92.0 |
Fertility by Age by Marriage Status in Rio Linda
69.0% of women with births (352) in Rio Linda are married. The highest percentage of unmarried women with births falls into 15 to 19 years age bracket with 100.0% of them unmarried at the time of birth, while the lowest percentage of unmarried women with births belong to 35 to 50 years age bracket with 0.0% of them unmarried.
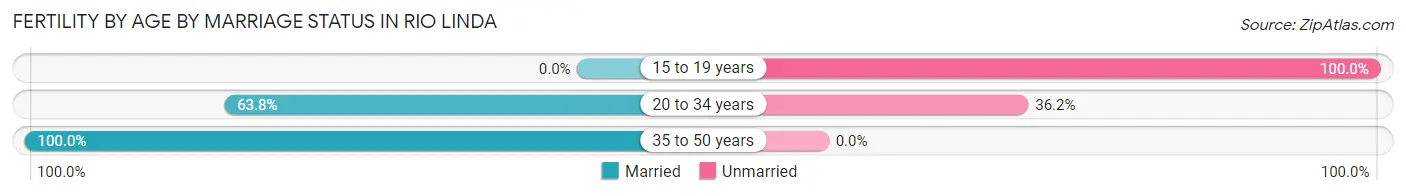
| Age Bracket | Married | Unmarried |
| 15 to 19 years | 0 (0.0%) | 24 (100.0%) |
| 20 to 34 years | 150 (63.8%) | 85 (36.2%) |
| 35 to 50 years | 93 (100.0%) | 0 (0.0%) |
| Total | 243 (69.0%) | 109 (31.0%) |
Fertility by Education in Rio Linda
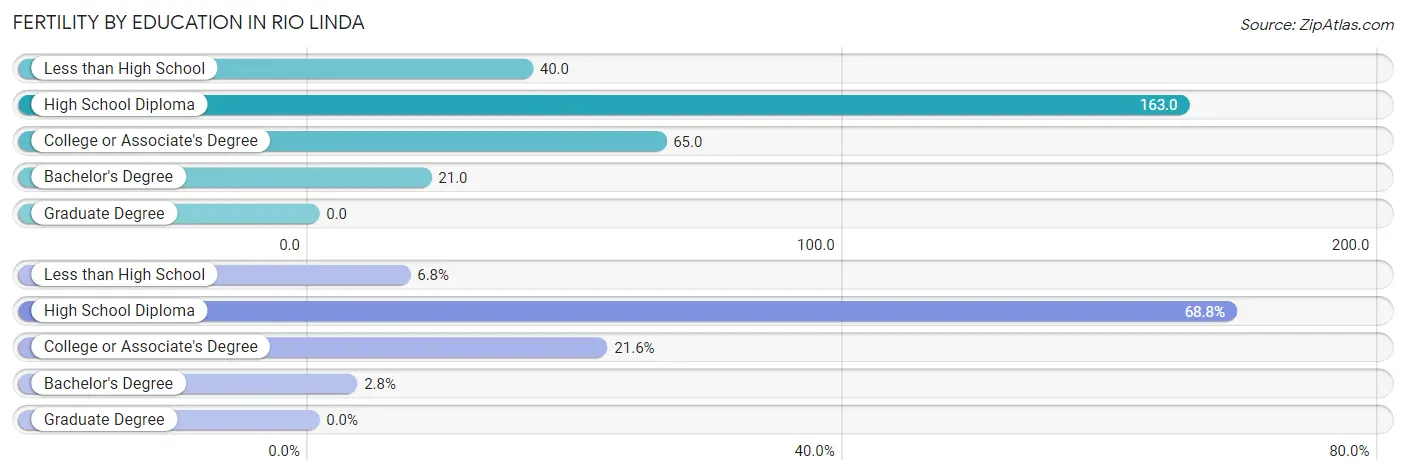
| Educational Attainment | Women with Births | Births / 1,000 Women |
| Less than High School | 24 (6.8%) | 40.0 |
| High School Diploma | 242 (68.8%) | 163.0 |
| College or Associate's Degree | 76 (21.6%) | 65.0 |
| Bachelor's Degree | 10 (2.8%) | 21.0 |
| Graduate Degree | 0 (0.0%) | 0.0 |
| Total | 352 (100.0%) | 92.0 |
Fertility by Education by Marriage Status in Rio Linda
31.0% of women with births in Rio Linda are unmarried. Women with the educational attainment of bachelor's degree are most likely to be married with 100.0% of them married at childbirth, while women with the educational attainment of less than high school are least likely to be married with 100.0% of them unmarried at childbirth.
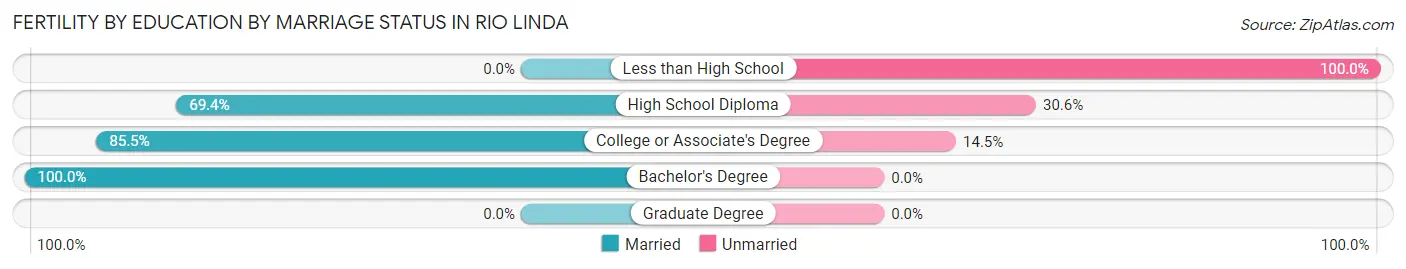
| Educational Attainment | Married | Unmarried |
| Less than High School | 0 (0.0%) | 24 (100.0%) |
| High School Diploma | 168 (69.4%) | 74 (30.6%) |
| College or Associate's Degree | 65 (85.5%) | 11 (14.5%) |
| Bachelor's Degree | 10 (100.0%) | 0 (0.0%) |
| Graduate Degree | 0 (0.0%) | 0 (0.0%) |
| Total | 243 (69.0%) | 109 (31.0%) |
Employment Characteristics in Rio Linda
Employment by Class of Employer in Rio Linda
Among the 7,106 employed individuals in Rio Linda, private company employees (4,659 | 65.6%), self-employed (not incorporated) (635 | 8.9%), and state government employees (540 | 7.6%) make up the most common classes of employment.
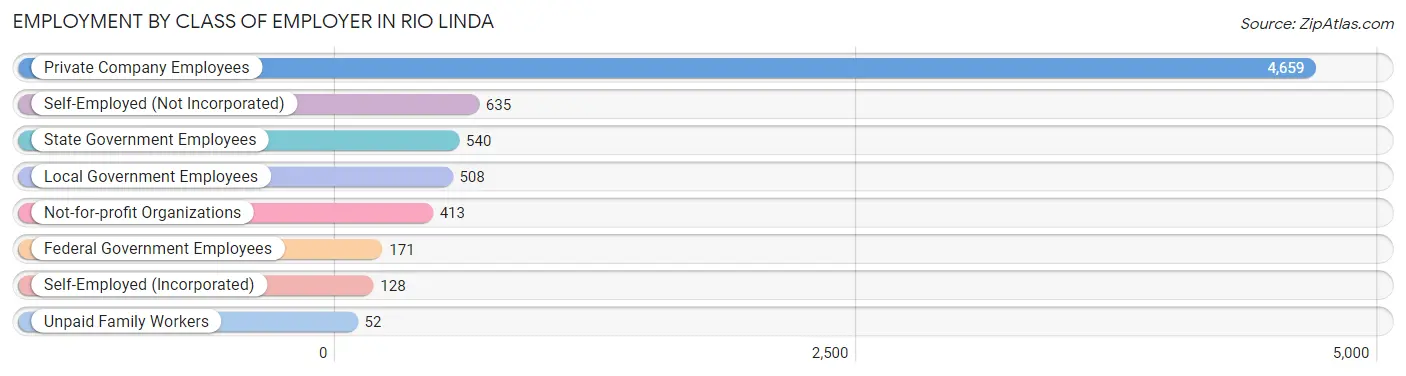
| Employer Class | # Employees | % Employees |
| Private Company Employees | 4,659 | 65.6% |
| Self-Employed (Incorporated) | 128 | 1.8% |
| Self-Employed (Not Incorporated) | 635 | 8.9% |
| Not-for-profit Organizations | 413 | 5.8% |
| Local Government Employees | 508 | 7.1% |
| State Government Employees | 540 | 7.6% |
| Federal Government Employees | 171 | 2.4% |
| Unpaid Family Workers | 52 | 0.7% |
| Total | 7,106 | 100.0% |
Employment Status by Age in Rio Linda
According to the labor force statistics for Rio Linda, out of the total population over 16 years of age (12,967), 59.4% or 7,702 individuals are in the labor force, with 4.9% or 377 of them unemployed. The age group with the highest labor force participation rate is 30 to 34 years, with 81.4% or 782 individuals in the labor force. Within the labor force, the 75 years and over age range has the highest percentage of unemployed individuals, with 28.6% or 4 of them being unemployed.
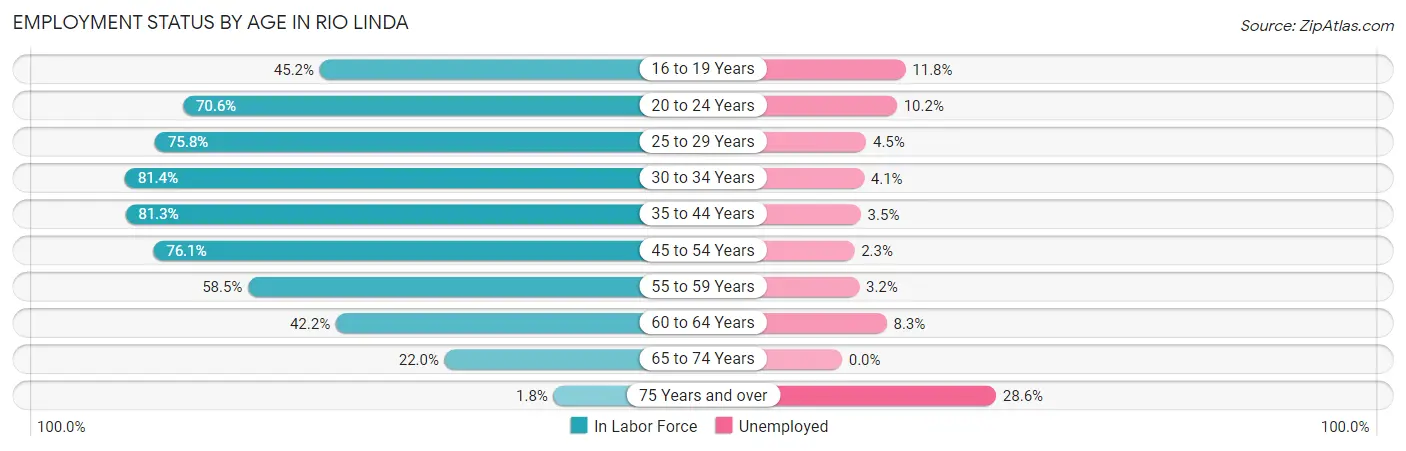
| Age Bracket | In Labor Force | Unemployed |
| 16 to 19 Years | 365 (45.2%) | 43 (11.8%) |
| 20 to 24 Years | 904 (70.6%) | 92 (10.2%) |
| 25 to 29 Years | 864 (75.8%) | 39 (4.5%) |
| 30 to 34 Years | 782 (81.4%) | 32 (4.1%) |
| 35 to 44 Years | 1,787 (81.3%) | 63 (3.5%) |
| 45 to 54 Years | 1,370 (76.1%) | 32 (2.3%) |
| 55 to 59 Years | 744 (58.5%) | 24 (3.2%) |
| 60 to 64 Years | 580 (42.2%) | 48 (8.3%) |
| 65 to 74 Years | 300 (22.0%) | 0 (0.0%) |
| 75 Years and over | 14 (1.8%) | 4 (28.6%) |
| Total | 7,702 (59.4%) | 377 (4.9%) |
Employment Status by Educational Attainment in Rio Linda
According to labor force statistics for Rio Linda, 70.0% of individuals (6,122) out of the total population between 25 and 64 years of age (8,745) are in the labor force, with 3.9% or 239 of them being unemployed. The group with the highest labor force participation rate are those with the educational attainment of bachelor's degree or higher, with 82.0% or 1,043 individuals in the labor force. Within the labor force, individuals with less than high school education have the highest percentage of unemployment, with 9.2% or 58 of them being unemployed.
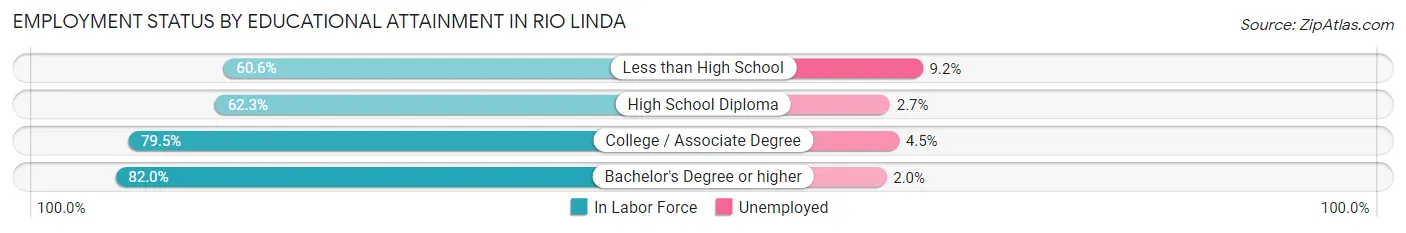
| Educational Attainment | In Labor Force | Unemployed |
| Less than High School | 630 (60.6%) | 96 (9.2%) |
| High School Diploma | 2,405 (62.3%) | 104 (2.7%) |
| College / Associate Degree | 2,045 (79.5%) | 116 (4.5%) |
| Bachelor's Degree or higher | 1,043 (82.0%) | 25 (2.0%) |
| Total | 6,122 (70.0%) | 341 (3.9%) |
Employment Occupations by Sex in Rio Linda
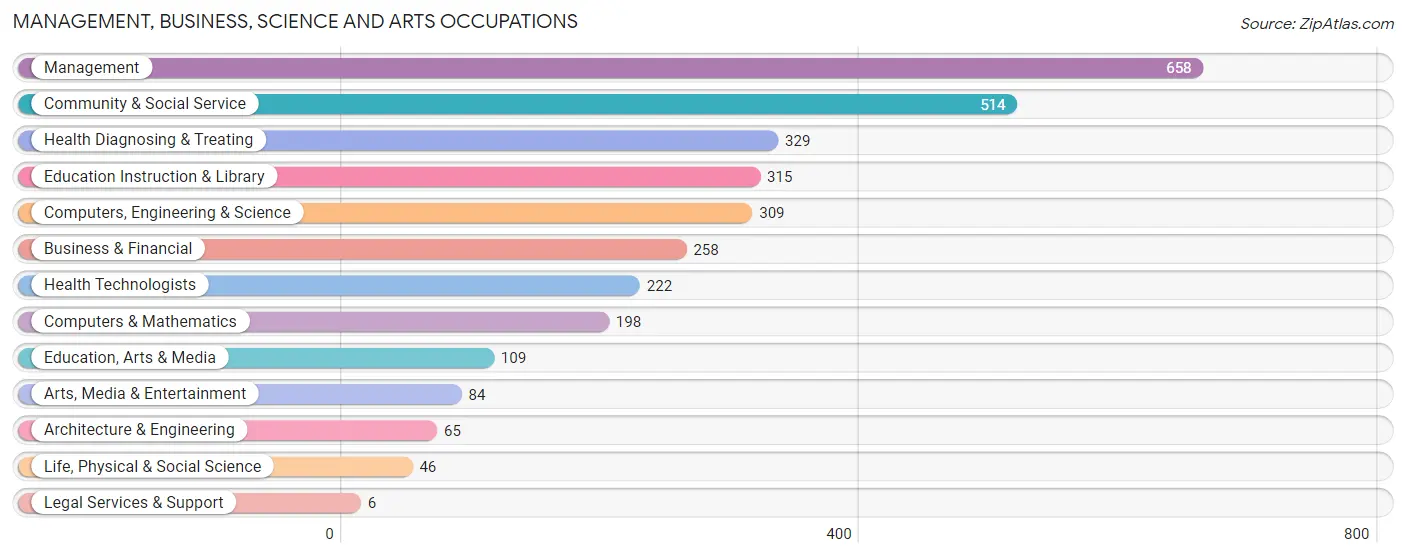
Management, Business, Science and Arts Occupations
The most common Management, Business, Science and Arts occupations in Rio Linda are Management (658 | 9.0%), Community & Social Service (514 | 7.0%), Health Diagnosing & Treating (329 | 4.5%), Education Instruction & Library (315 | 4.3%), and Computers, Engineering & Science (309 | 4.2%).
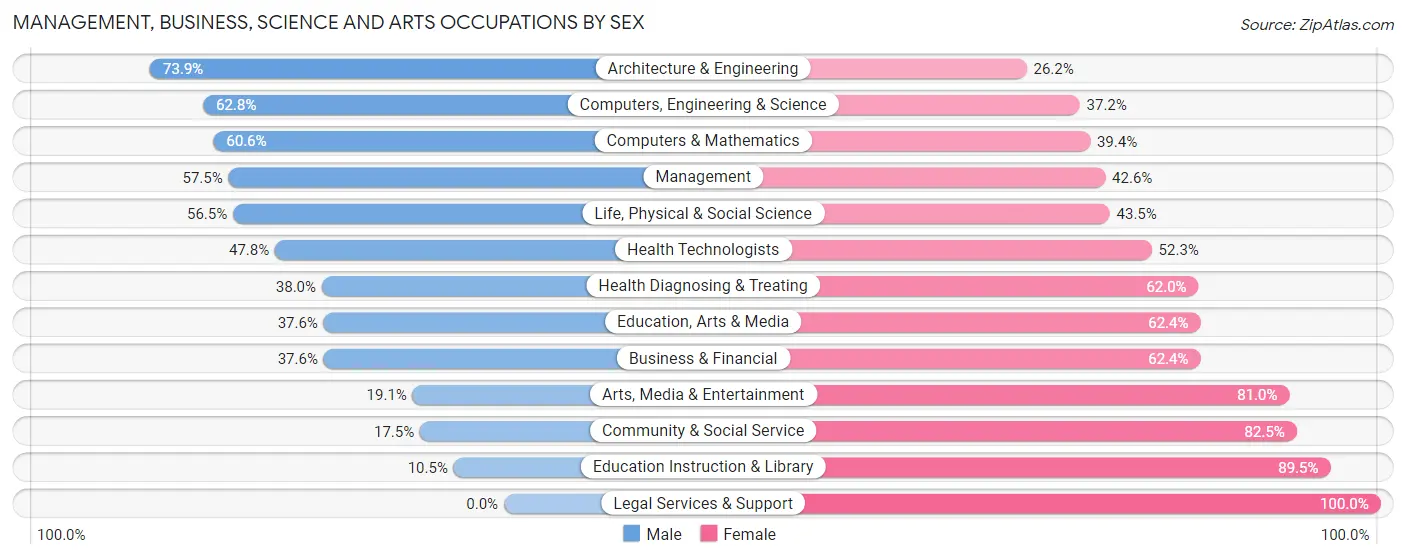
Management, Business, Science and Arts Occupations by Sex
Within the Management, Business, Science and Arts occupations in Rio Linda, the most male-oriented occupations are Architecture & Engineering (73.9%), Computers, Engineering & Science (62.8%), and Computers & Mathematics (60.6%), while the most female-oriented occupations are Legal Services & Support (100.0%), Education Instruction & Library (89.5%), and Community & Social Service (82.5%).
| Occupation | Male | Female |
| Management | 378 (57.5%) | 280 (42.5%) |
| Business & Financial | 97 (37.6%) | 161 (62.4%) |
| Computers, Engineering & Science | 194 (62.8%) | 115 (37.2%) |
| Computers & Mathematics | 120 (60.6%) | 78 (39.4%) |
| Architecture & Engineering | 48 (73.9%) | 17 (26.2%) |
| Life, Physical & Social Science | 26 (56.5%) | 20 (43.5%) |
| Community & Social Service | 90 (17.5%) | 424 (82.5%) |
| Education, Arts & Media | 41 (37.6%) | 68 (62.4%) |
| Legal Services & Support | 0 (0.0%) | 6 (100.0%) |
| Education Instruction & Library | 33 (10.5%) | 282 (89.5%) |
| Arts, Media & Entertainment | 16 (19.1%) | 68 (80.9%) |
| Health Diagnosing & Treating | 125 (38.0%) | 204 (62.0%) |
| Health Technologists | 106 (47.7%) | 116 (52.2%) |
| Total (Category) | 884 (42.7%) | 1,184 (57.3%) |
| Total (Overall) | 3,780 (51.6%) | 3,549 (48.4%) |
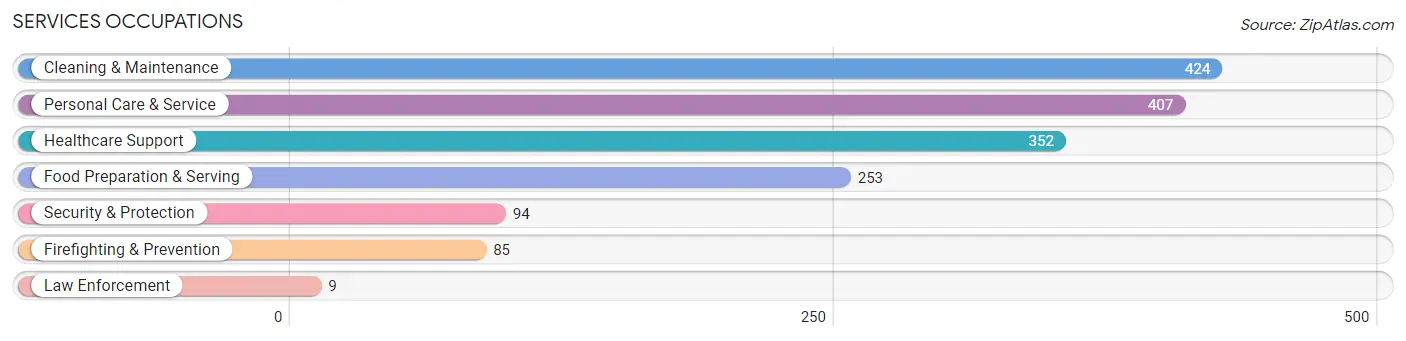
Services Occupations
The most common Services occupations in Rio Linda are Cleaning & Maintenance (424 | 5.8%), Personal Care & Service (407 | 5.6%), Healthcare Support (352 | 4.8%), Food Preparation & Serving (253 | 3.5%), and Security & Protection (94 | 1.3%).
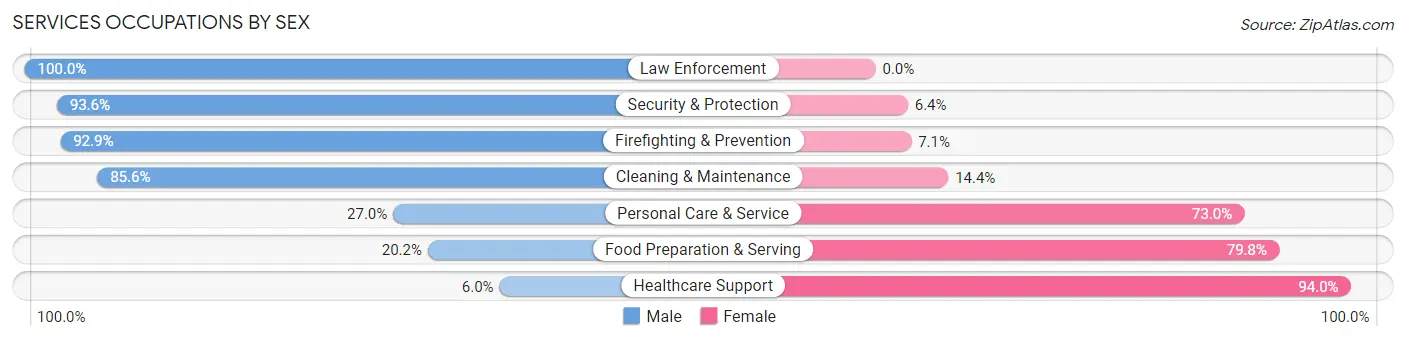
Services Occupations by Sex
Within the Services occupations in Rio Linda, the most male-oriented occupations are Law Enforcement (100.0%), Security & Protection (93.6%), and Firefighting & Prevention (92.9%), while the most female-oriented occupations are Healthcare Support (94.0%), Food Preparation & Serving (79.8%), and Personal Care & Service (73.0%).
| Occupation | Male | Female |
| Healthcare Support | 21 (6.0%) | 331 (94.0%) |
| Security & Protection | 88 (93.6%) | 6 (6.4%) |
| Firefighting & Prevention | 79 (92.9%) | 6 (7.1%) |
| Law Enforcement | 9 (100.0%) | 0 (0.0%) |
| Food Preparation & Serving | 51 (20.2%) | 202 (79.8%) |
| Cleaning & Maintenance | 363 (85.6%) | 61 (14.4%) |
| Personal Care & Service | 110 (27.0%) | 297 (73.0%) |
| Total (Category) | 633 (41.4%) | 897 (58.6%) |
| Total (Overall) | 3,780 (51.6%) | 3,549 (48.4%) |
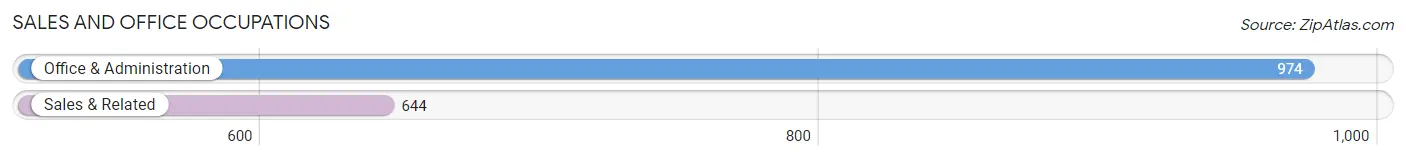
Sales and Office Occupations
The most common Sales and Office occupations in Rio Linda are Office & Administration (974 | 13.3%), and Sales & Related (644 | 8.8%).
Sales and Office Occupations by Sex
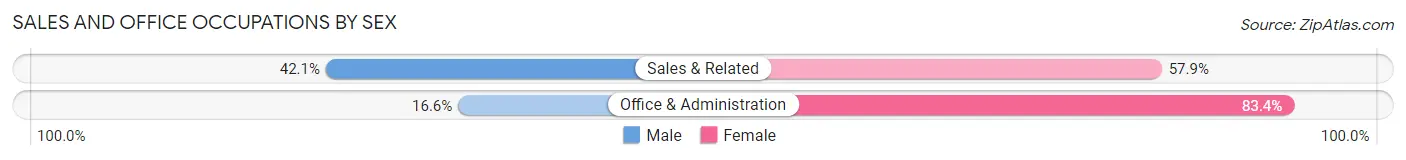
| Occupation | Male | Female |
| Sales & Related | 271 (42.1%) | 373 (57.9%) |
| Office & Administration | 162 (16.6%) | 812 (83.4%) |
| Total (Category) | 433 (26.8%) | 1,185 (73.2%) |
| Total (Overall) | 3,780 (51.6%) | 3,549 (48.4%) |
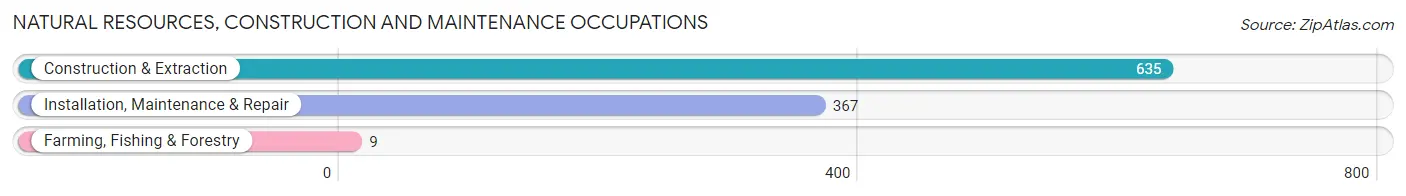
Natural Resources, Construction and Maintenance Occupations
The most common Natural Resources, Construction and Maintenance occupations in Rio Linda are Construction & Extraction (635 | 8.7%), Installation, Maintenance & Repair (367 | 5.0%), and Farming, Fishing & Forestry (9 | 0.1%).
Natural Resources, Construction and Maintenance Occupations by Sex
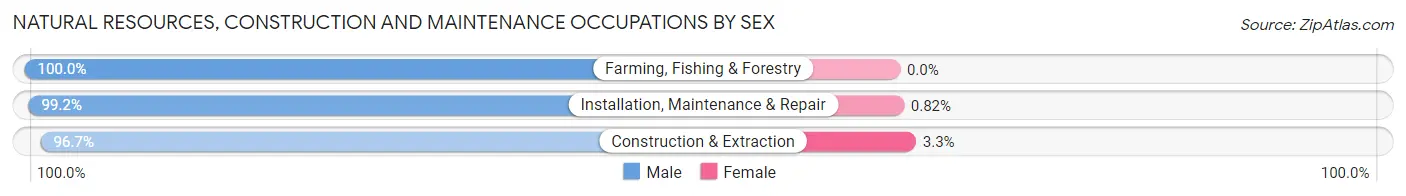
| Occupation | Male | Female |
| Farming, Fishing & Forestry | 9 (100.0%) | 0 (0.0%) |
| Construction & Extraction | 614 (96.7%) | 21 (3.3%) |
| Installation, Maintenance & Repair | 364 (99.2%) | 3 (0.8%) |
| Total (Category) | 987 (97.6%) | 24 (2.4%) |
| Total (Overall) | 3,780 (51.6%) | 3,549 (48.4%) |
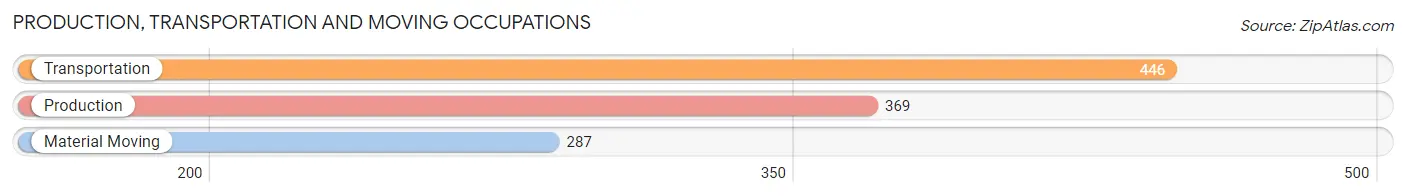
Production, Transportation and Moving Occupations
The most common Production, Transportation and Moving occupations in Rio Linda are Transportation (446 | 6.1%), Production (369 | 5.0%), and Material Moving (287 | 3.9%).
Production, Transportation and Moving Occupations by Sex
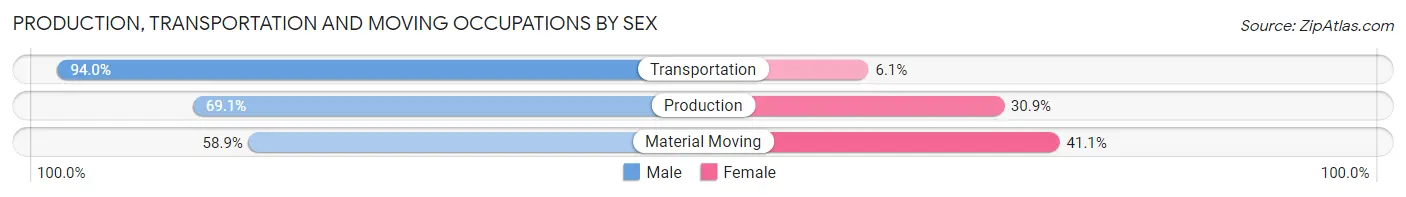
| Occupation | Male | Female |
| Production | 255 (69.1%) | 114 (30.9%) |
| Transportation | 419 (94.0%) | 27 (6.0%) |
| Material Moving | 169 (58.9%) | 118 (41.1%) |
| Total (Category) | 843 (76.5%) | 259 (23.5%) |
| Total (Overall) | 3,780 (51.6%) | 3,549 (48.4%) |
Employment Industries by Sex in Rio Linda
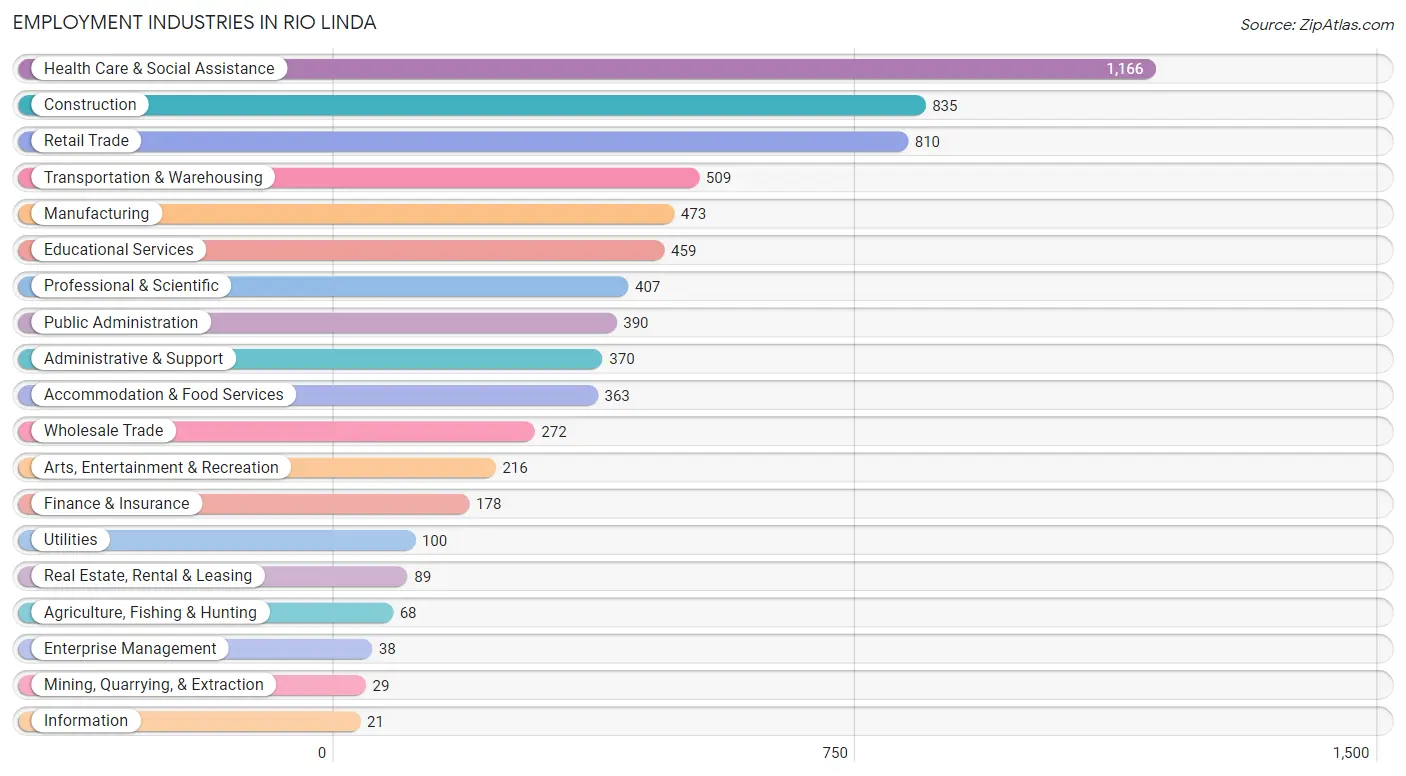
Employment Industries in Rio Linda
The major employment industries in Rio Linda include Health Care & Social Assistance (1,166 | 15.9%), Construction (835 | 11.4%), Retail Trade (810 | 11.1%), Transportation & Warehousing (509 | 7.0%), and Manufacturing (473 | 6.5%).
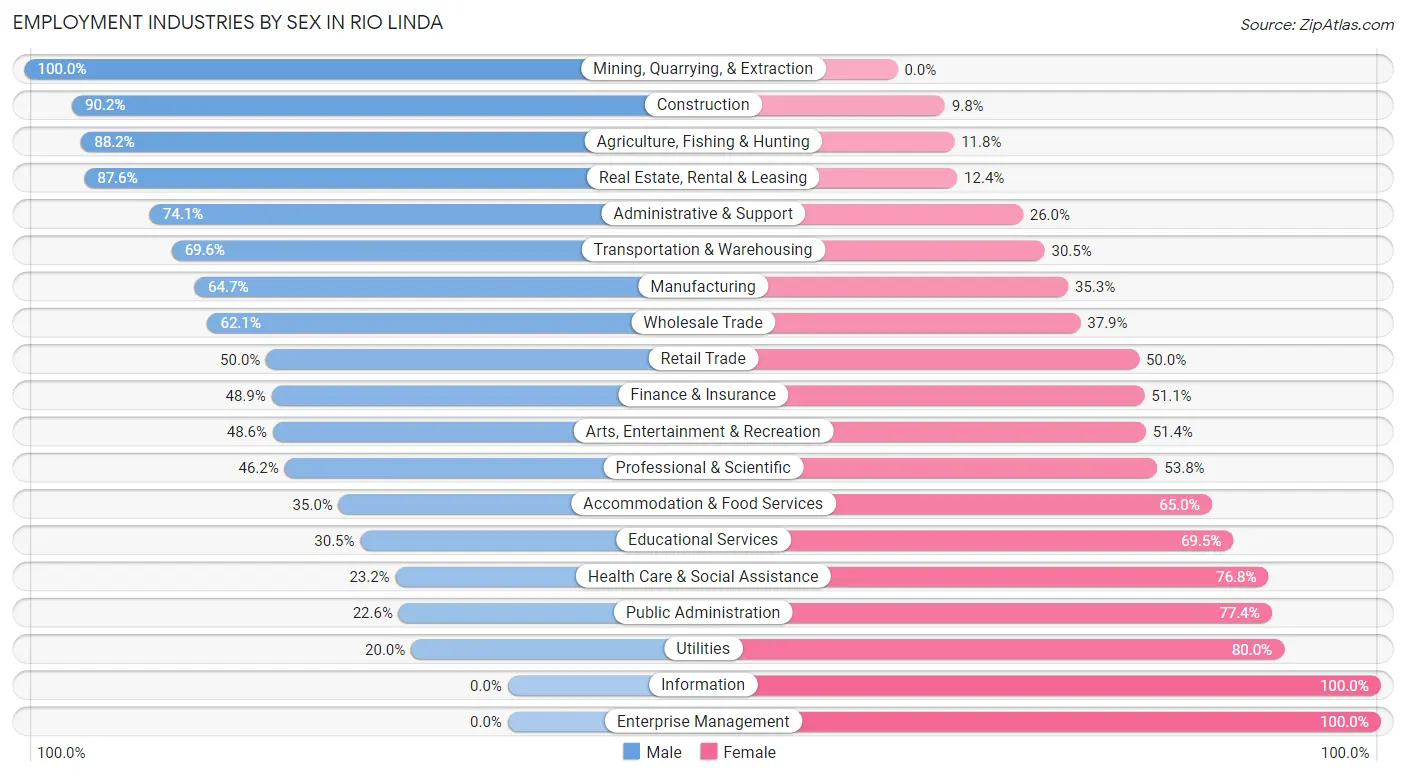
Employment Industries by Sex in Rio Linda
The Rio Linda industries that see more men than women are Mining, Quarrying, & Extraction (100.0%), Construction (90.2%), and Agriculture, Fishing & Hunting (88.2%), whereas the industries that tend to have a higher number of women are Information (100.0%), Enterprise Management (100.0%), and Utilities (80.0%).
| Industry | Male | Female |
| Agriculture, Fishing & Hunting | 60 (88.2%) | 8 (11.8%) |
| Mining, Quarrying, & Extraction | 29 (100.0%) | 0 (0.0%) |
| Construction | 753 (90.2%) | 82 (9.8%) |
| Manufacturing | 306 (64.7%) | 167 (35.3%) |
| Wholesale Trade | 169 (62.1%) | 103 (37.9%) |
| Retail Trade | 405 (50.0%) | 405 (50.0%) |
| Transportation & Warehousing | 354 (69.6%) | 155 (30.4%) |
| Utilities | 20 (20.0%) | 80 (80.0%) |
| Information | 0 (0.0%) | 21 (100.0%) |
| Finance & Insurance | 87 (48.9%) | 91 (51.1%) |
| Real Estate, Rental & Leasing | 78 (87.6%) | 11 (12.4%) |
| Professional & Scientific | 188 (46.2%) | 219 (53.8%) |
| Enterprise Management | 0 (0.0%) | 38 (100.0%) |
| Administrative & Support | 274 (74.1%) | 96 (26.0%) |
| Educational Services | 140 (30.5%) | 319 (69.5%) |
| Health Care & Social Assistance | 271 (23.2%) | 895 (76.8%) |
| Arts, Entertainment & Recreation | 105 (48.6%) | 111 (51.4%) |
| Accommodation & Food Services | 127 (35.0%) | 236 (65.0%) |
| Public Administration | 88 (22.6%) | 302 (77.4%) |
| Total | 3,780 (51.6%) | 3,549 (48.4%) |
Education in Rio Linda
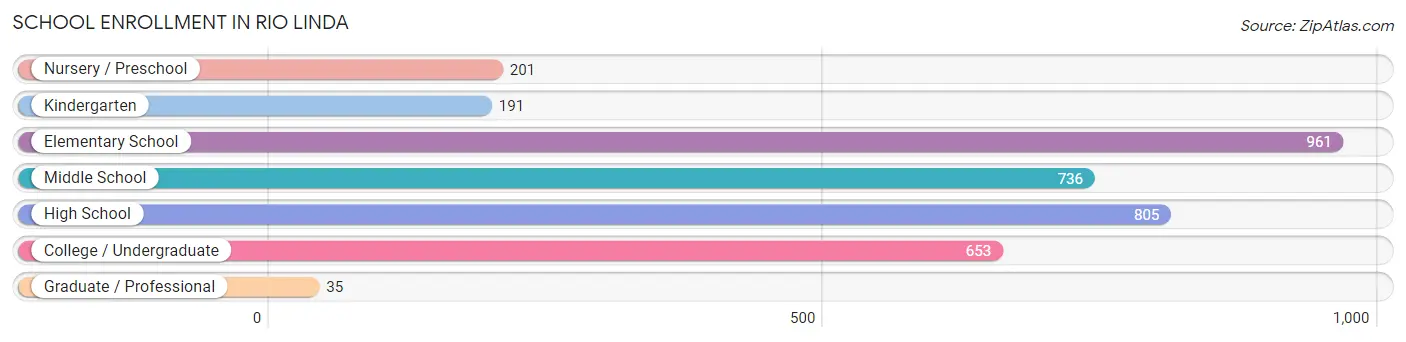
School Enrollment in Rio Linda
The most common levels of schooling among the 3,582 students in Rio Linda are elementary school (961 | 26.8%), high school (805 | 22.5%), and middle school (736 | 20.5%).
| School Level | # Students | % Students |
| Nursery / Preschool | 201 | 5.6% |
| Kindergarten | 191 | 5.3% |
| Elementary School | 961 | 26.8% |
| Middle School | 736 | 20.5% |
| High School | 805 | 22.5% |
| College / Undergraduate | 653 | 18.2% |
| Graduate / Professional | 35 | 1.0% |
| Total | 3,582 | 100.0% |
School Enrollment by Age by Funding Source in Rio Linda
Out of a total of 3,582 students who are enrolled in schools in Rio Linda, 437 (12.2%) attend a private institution, while the remaining 3,145 (87.8%) are enrolled in public schools. The age group of 3 to 4 year olds has the highest likelihood of being enrolled in private schools, with 84 (40.4% in the age bracket) enrolled. Conversely, the age group of 10 to 14 year olds has the lowest likelihood of being enrolled in a private school, with 1,049 (94.5% in the age bracket) attending a public institution.

| Age Bracket | Public School | Private School |
| 3 to 4 Year Olds | 124 (59.6%) | 84 (40.4%) |
| 5 to 9 Year Old | 825 (88.4%) | 108 (11.6%) |
| 10 to 14 Year Olds | 1,049 (94.5%) | 61 (5.5%) |
| 15 to 17 Year Olds | 450 (88.1%) | 61 (11.9%) |
| 18 to 19 Year Olds | 205 (84.7%) | 37 (15.3%) |
| 20 to 24 Year Olds | 223 (90.6%) | 23 (9.3%) |
| 25 to 34 Year Olds | 188 (87.0%) | 28 (13.0%) |
| 35 Years and over | 82 (70.7%) | 34 (29.3%) |
| Total | 3,145 (87.8%) | 437 (12.2%) |
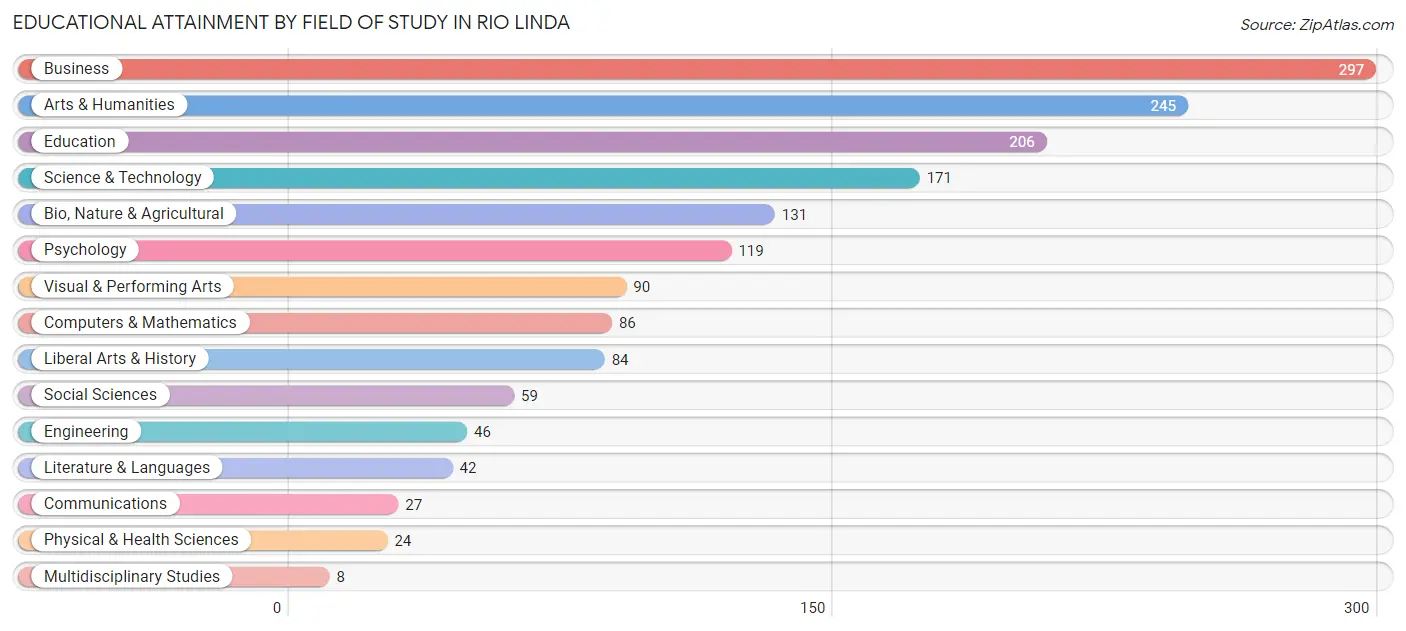
Educational Attainment by Field of Study in Rio Linda
Business (297 | 18.2%), arts & humanities (245 | 15.0%), education (206 | 12.6%), science & technology (171 | 10.5%), and bio, nature & agricultural (131 | 8.0%) are the most common fields of study among 1,635 individuals in Rio Linda who have obtained a bachelor's degree or higher.
| Field of Study | # Graduates | % Graduates |
| Computers & Mathematics | 86 | 5.3% |
| Bio, Nature & Agricultural | 131 | 8.0% |
| Physical & Health Sciences | 24 | 1.5% |
| Psychology | 119 | 7.3% |
| Social Sciences | 59 | 3.6% |
| Engineering | 46 | 2.8% |
| Multidisciplinary Studies | 8 | 0.5% |
| Science & Technology | 171 | 10.5% |
| Business | 297 | 18.2% |
| Education | 206 | 12.6% |
| Literature & Languages | 42 | 2.6% |
| Liberal Arts & History | 84 | 5.1% |
| Visual & Performing Arts | 90 | 5.5% |
| Communications | 27 | 1.7% |
| Arts & Humanities | 245 | 15.0% |
| Total | 1,635 | 100.0% |
Transportation & Commute in Rio Linda
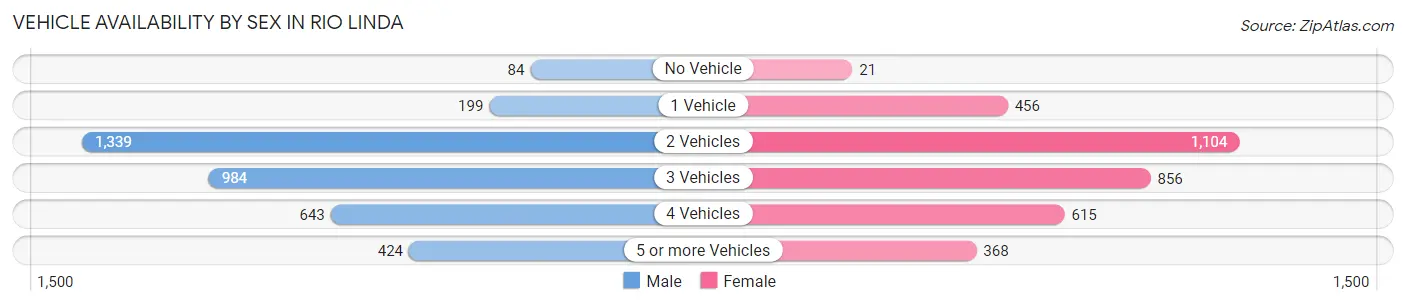
Vehicle Availability by Sex in Rio Linda
The most prevalent vehicle ownership categories in Rio Linda are males with 2 vehicles (1,339, accounting for 36.5%) and females with 2 vehicles (1,104, making up 39.2%).
| Vehicles Available | Male | Female |
| No Vehicle | 84 (2.3%) | 21 (0.6%) |
| 1 Vehicle | 199 (5.4%) | 456 (13.3%) |
| 2 Vehicles | 1,339 (36.5%) | 1,104 (32.3%) |
| 3 Vehicles | 984 (26.8%) | 856 (25.0%) |
| 4 Vehicles | 643 (17.5%) | 615 (18.0%) |
| 5 or more Vehicles | 424 (11.5%) | 368 (10.8%) |
| Total | 3,673 (100.0%) | 3,420 (100.0%) |
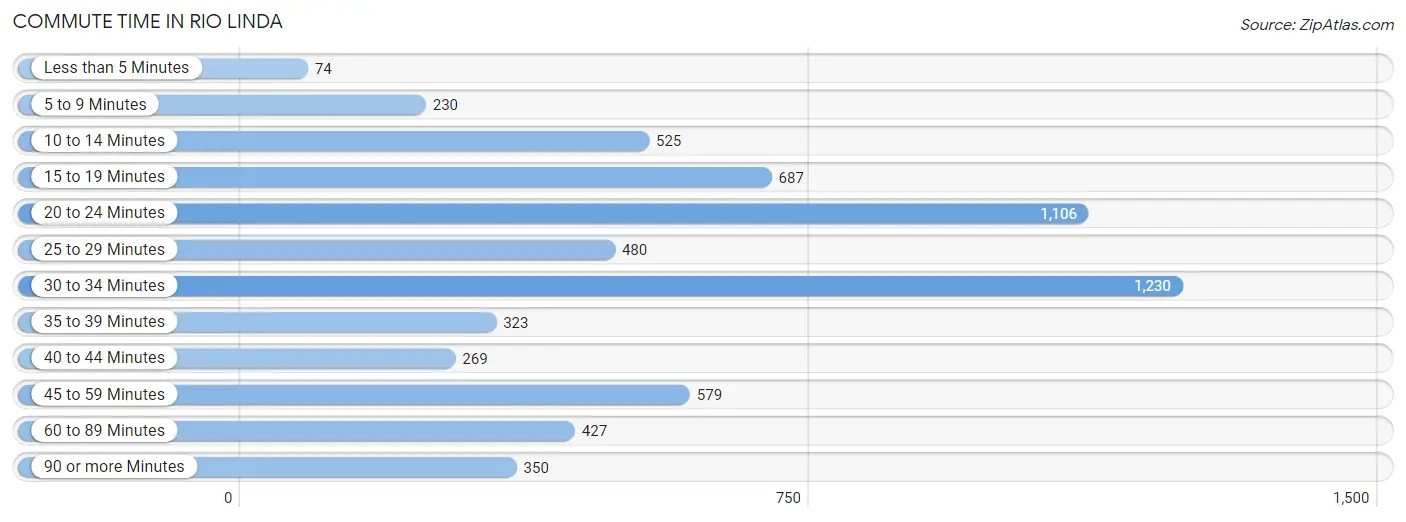
Commute Time in Rio Linda
The most frequently occuring commute durations in Rio Linda are 30 to 34 minutes (1,230 commuters, 19.6%), 20 to 24 minutes (1,106 commuters, 17.6%), and 15 to 19 minutes (687 commuters, 10.9%).
| Commute Time | # Commuters | % Commuters |
| Less than 5 Minutes | 74 | 1.2% |
| 5 to 9 Minutes | 230 | 3.7% |
| 10 to 14 Minutes | 525 | 8.4% |
| 15 to 19 Minutes | 687 | 10.9% |
| 20 to 24 Minutes | 1,106 | 17.6% |
| 25 to 29 Minutes | 480 | 7.6% |
| 30 to 34 Minutes | 1,230 | 19.6% |
| 35 to 39 Minutes | 323 | 5.1% |
| 40 to 44 Minutes | 269 | 4.3% |
| 45 to 59 Minutes | 579 | 9.2% |
| 60 to 89 Minutes | 427 | 6.8% |
| 90 or more Minutes | 350 | 5.6% |
Commute Time by Sex in Rio Linda
The most common commute times in Rio Linda are 30 to 34 minutes (620 commuters, 18.3%) for males and 30 to 34 minutes (610 commuters, 21.1%) for females.
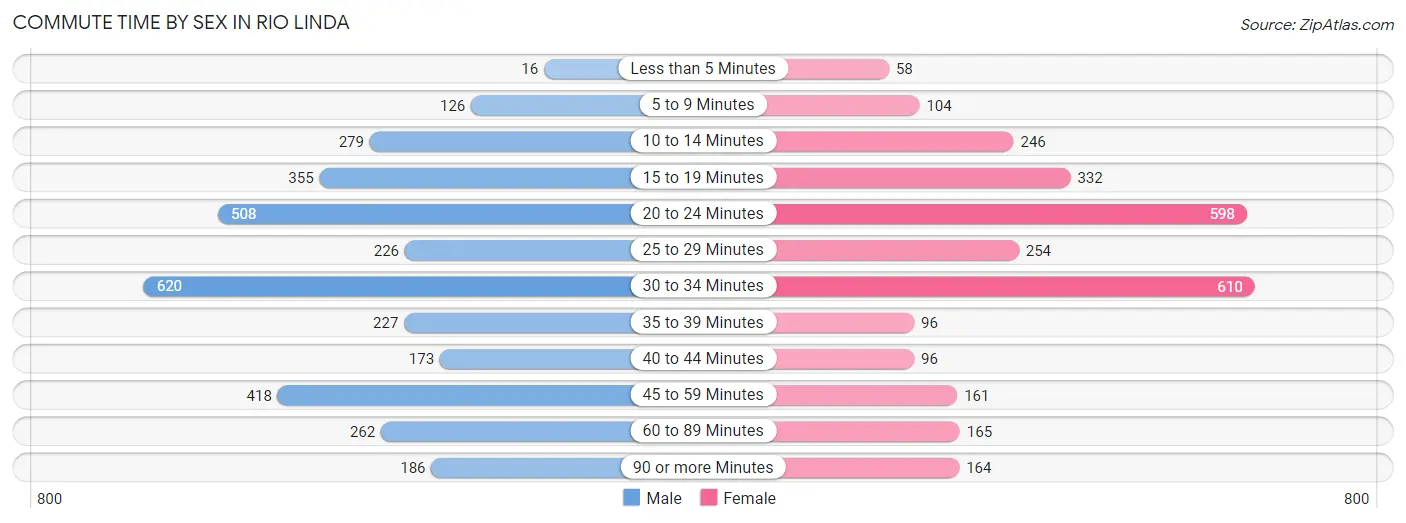
| Commute Time | Male | Female |
| Less than 5 Minutes | 16 (0.5%) | 58 (2.0%) |
| 5 to 9 Minutes | 126 (3.7%) | 104 (3.6%) |
| 10 to 14 Minutes | 279 (8.2%) | 246 (8.5%) |
| 15 to 19 Minutes | 355 (10.4%) | 332 (11.5%) |
| 20 to 24 Minutes | 508 (15.0%) | 598 (20.7%) |
| 25 to 29 Minutes | 226 (6.7%) | 254 (8.8%) |
| 30 to 34 Minutes | 620 (18.3%) | 610 (21.1%) |
| 35 to 39 Minutes | 227 (6.7%) | 96 (3.3%) |
| 40 to 44 Minutes | 173 (5.1%) | 96 (3.3%) |
| 45 to 59 Minutes | 418 (12.3%) | 161 (5.6%) |
| 60 to 89 Minutes | 262 (7.7%) | 165 (5.7%) |
| 90 or more Minutes | 186 (5.5%) | 164 (5.7%) |
Time of Departure to Work by Sex in Rio Linda
The most frequent times of departure to work in Rio Linda are 5:00 AM to 5:29 AM (549, 16.2%) for males and 8:00 AM to 8:29 AM (460, 16.0%) for females.
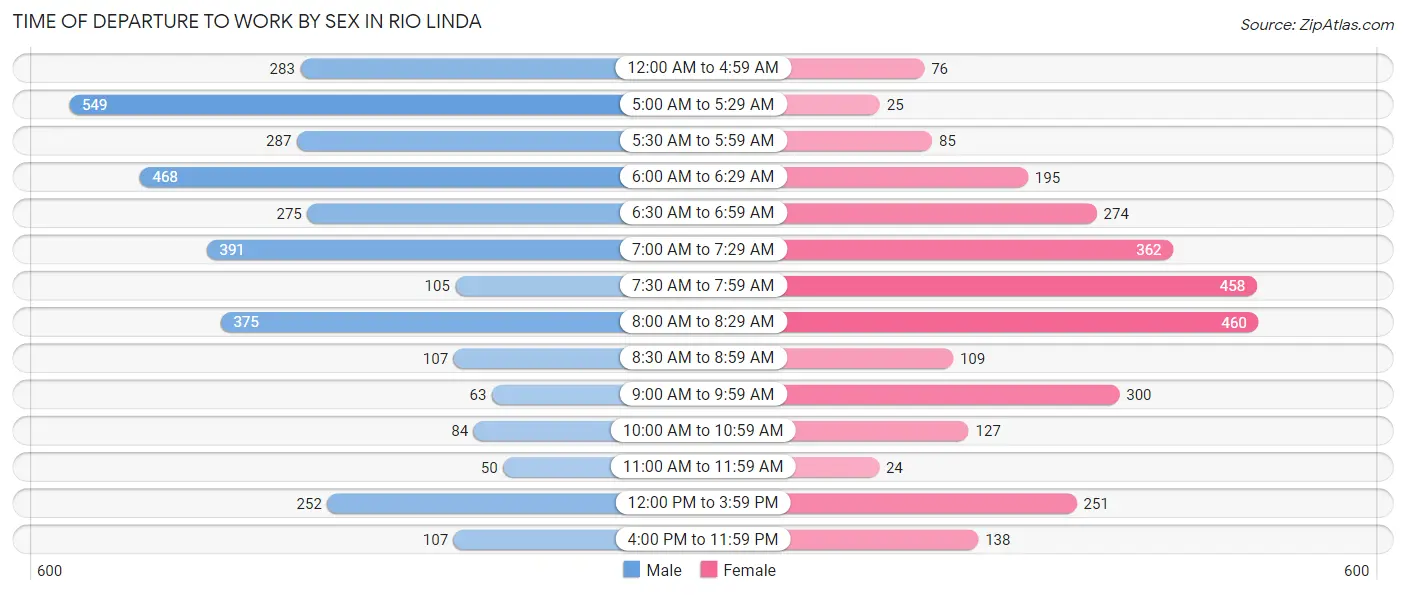
| Time of Departure | Male | Female |
| 12:00 AM to 4:59 AM | 283 (8.3%) | 76 (2.6%) |
| 5:00 AM to 5:29 AM | 549 (16.2%) | 25 (0.9%) |
| 5:30 AM to 5:59 AM | 287 (8.5%) | 85 (2.9%) |
| 6:00 AM to 6:29 AM | 468 (13.8%) | 195 (6.8%) |
| 6:30 AM to 6:59 AM | 275 (8.1%) | 274 (9.5%) |
| 7:00 AM to 7:29 AM | 391 (11.5%) | 362 (12.6%) |
| 7:30 AM to 7:59 AM | 105 (3.1%) | 458 (15.9%) |
| 8:00 AM to 8:29 AM | 375 (11.0%) | 460 (16.0%) |
| 8:30 AM to 8:59 AM | 107 (3.2%) | 109 (3.8%) |
| 9:00 AM to 9:59 AM | 63 (1.9%) | 300 (10.4%) |
| 10:00 AM to 10:59 AM | 84 (2.5%) | 127 (4.4%) |
| 11:00 AM to 11:59 AM | 50 (1.5%) | 24 (0.8%) |
| 12:00 PM to 3:59 PM | 252 (7.4%) | 251 (8.7%) |
| 4:00 PM to 11:59 PM | 107 (3.2%) | 138 (4.8%) |
| Total | 3,396 (100.0%) | 2,884 (100.0%) |
Housing Occupancy in Rio Linda
Occupancy by Ownership in Rio Linda
Of the total 5,134 dwellings in Rio Linda, owner-occupied units account for 3,563 (69.4%), while renter-occupied units make up 1,571 (30.6%).
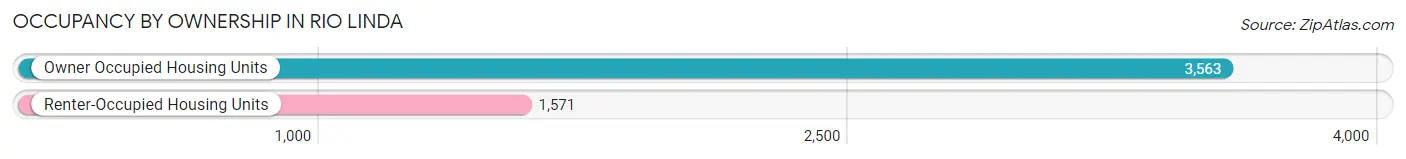
| Occupancy | # Housing Units | % Housing Units |
| Owner Occupied Housing Units | 3,563 | 69.4% |
| Renter-Occupied Housing Units | 1,571 | 30.6% |
| Total Occupied Housing Units | 5,134 | 100.0% |
Occupancy by Household Size in Rio Linda
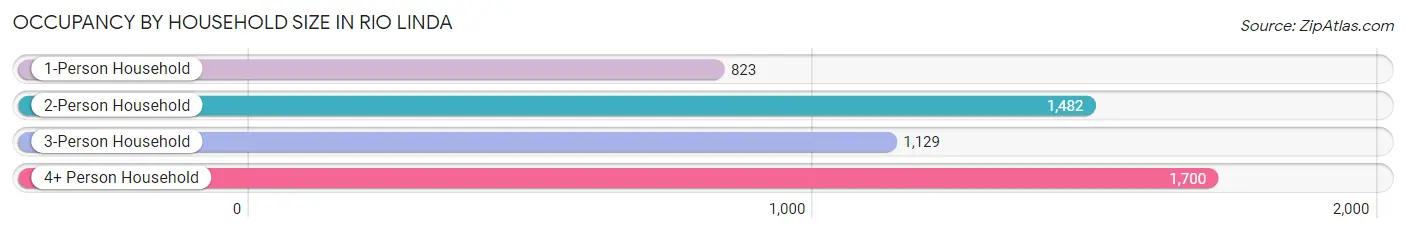
| Household Size | # Housing Units | % Housing Units |
| 1-Person Household | 823 | 16.0% |
| 2-Person Household | 1,482 | 28.9% |
| 3-Person Household | 1,129 | 22.0% |
| 4+ Person Household | 1,700 | 33.1% |
| Total Housing Units | 5,134 | 100.0% |
Occupancy by Ownership by Household Size in Rio Linda
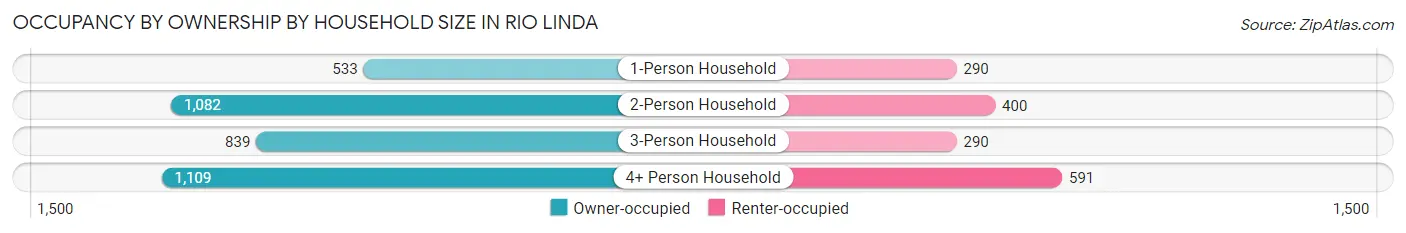
| Household Size | Owner-occupied | Renter-occupied |
| 1-Person Household | 533 (64.8%) | 290 (35.2%) |
| 2-Person Household | 1,082 (73.0%) | 400 (27.0%) |
| 3-Person Household | 839 (74.3%) | 290 (25.7%) |
| 4+ Person Household | 1,109 (65.2%) | 591 (34.8%) |
| Total Housing Units | 3,563 (69.4%) | 1,571 (30.6%) |
Occupancy by Educational Attainment in Rio Linda
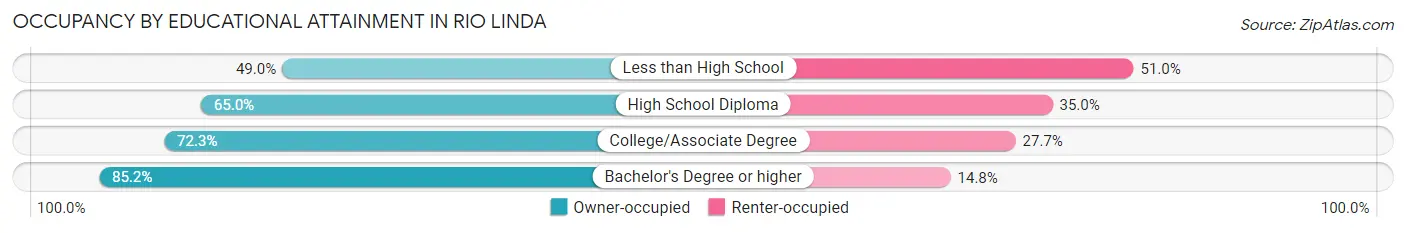
| Household Size | Owner-occupied | Renter-occupied |
| Less than High School | 262 (49.0%) | 273 (51.0%) |
| High School Diploma | 1,174 (65.0%) | 631 (35.0%) |
| College/Associate Degree | 1,428 (72.3%) | 546 (27.7%) |
| Bachelor's Degree or higher | 699 (85.2%) | 121 (14.8%) |
Occupancy by Age of Householder in Rio Linda
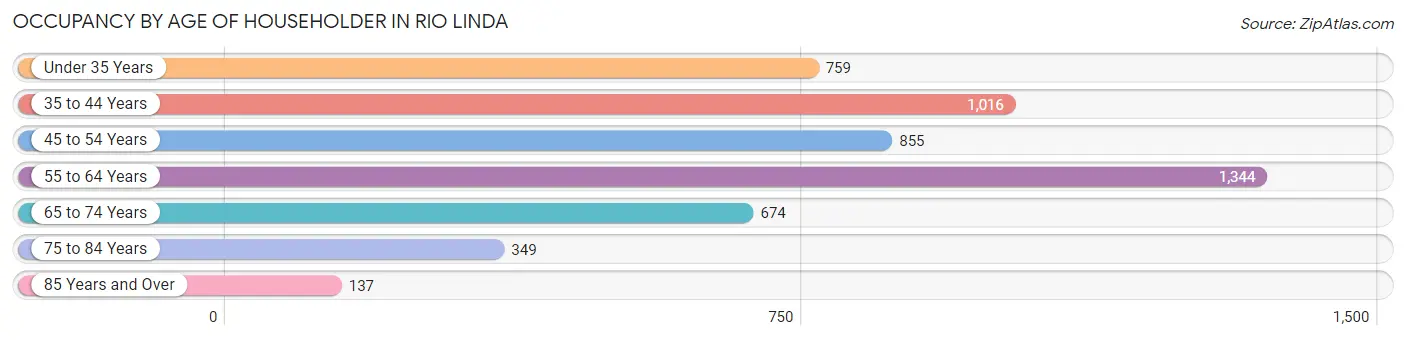
| Age Bracket | # Households | % Households |
| Under 35 Years | 759 | 14.8% |
| 35 to 44 Years | 1,016 | 19.8% |
| 45 to 54 Years | 855 | 16.7% |
| 55 to 64 Years | 1,344 | 26.2% |
| 65 to 74 Years | 674 | 13.1% |
| 75 to 84 Years | 349 | 6.8% |
| 85 Years and Over | 137 | 2.7% |
| Total | 5,134 | 100.0% |
Housing Finances in Rio Linda
Median Income by Occupancy in Rio Linda
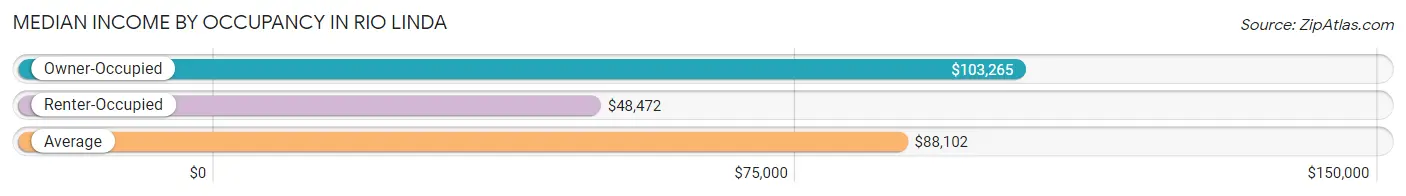
| Occupancy Type | # Households | Median Income |
| Owner-Occupied | 3,563 (69.4%) | $103,265 |
| Renter-Occupied | 1,571 (30.6%) | $48,472 |
| Average | 5,134 (100.0%) | $88,102 |
Occupancy by Householder Income Bracket in Rio Linda
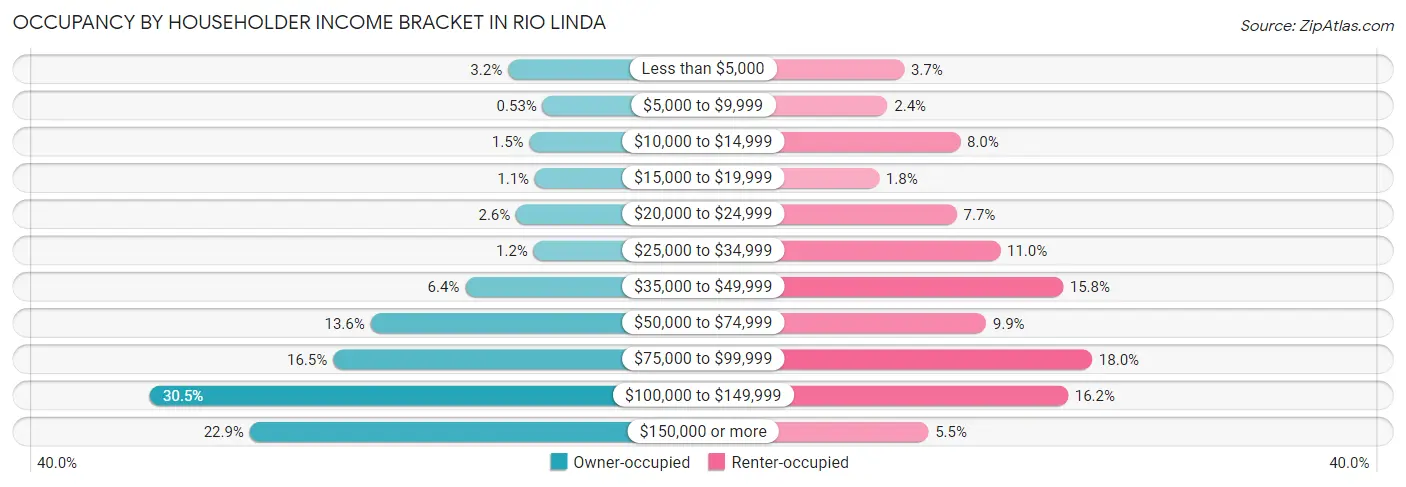
| Income Bracket | Owner-occupied | Renter-occupied |
| Less than $5,000 | 113 (3.2%) | 58 (3.7%) |
| $5,000 to $9,999 | 19 (0.5%) | 38 (2.4%) |
| $10,000 to $14,999 | 55 (1.5%) | 125 (8.0%) |
| $15,000 to $19,999 | 40 (1.1%) | 28 (1.8%) |
| $20,000 to $24,999 | 91 (2.5%) | 121 (7.7%) |
| $25,000 to $34,999 | 43 (1.2%) | 173 (11.0%) |
| $35,000 to $49,999 | 229 (6.4%) | 248 (15.8%) |
| $50,000 to $74,999 | 486 (13.6%) | 156 (9.9%) |
| $75,000 to $99,999 | 588 (16.5%) | 283 (18.0%) |
| $100,000 to $149,999 | 1,085 (30.4%) | 254 (16.2%) |
| $150,000 or more | 814 (22.9%) | 87 (5.5%) |
| Total | 3,563 (100.0%) | 1,571 (100.0%) |
Monthly Housing Cost Tiers in Rio Linda
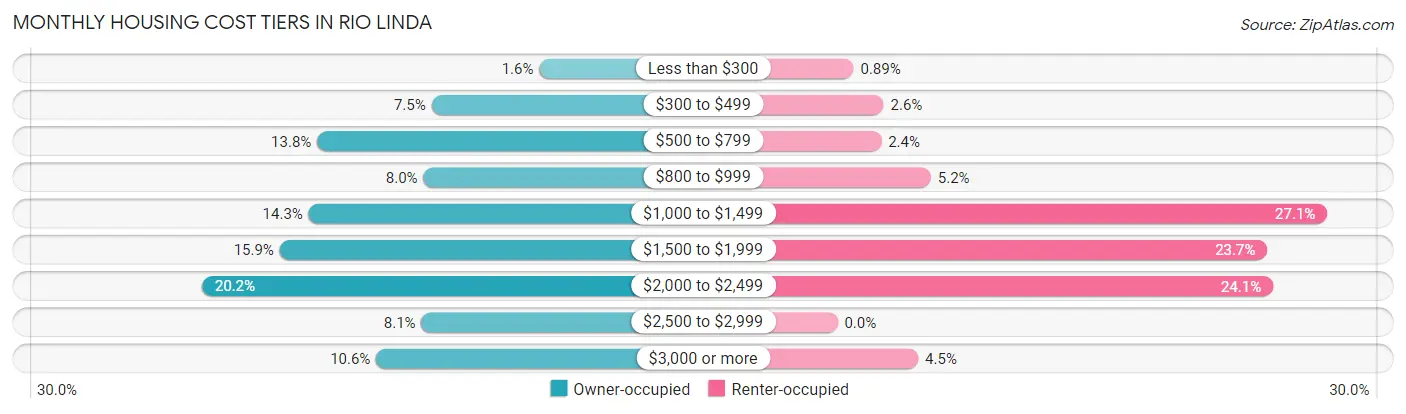
| Monthly Cost | Owner-occupied | Renter-occupied |
| Less than $300 | 56 (1.6%) | 14 (0.9%) |
| $300 to $499 | 268 (7.5%) | 40 (2.5%) |
| $500 to $799 | 493 (13.8%) | 38 (2.4%) |
| $800 to $999 | 284 (8.0%) | 81 (5.2%) |
| $1,000 to $1,499 | 510 (14.3%) | 425 (27.1%) |
| $1,500 to $1,999 | 567 (15.9%) | 373 (23.7%) |
| $2,000 to $2,499 | 720 (20.2%) | 378 (24.1%) |
| $2,500 to $2,999 | 288 (8.1%) | 0 (0.0%) |
| $3,000 or more | 377 (10.6%) | 70 (4.5%) |
| Total | 3,563 (100.0%) | 1,571 (100.0%) |
Physical Housing Characteristics in Rio Linda
Housing Structures in Rio Linda
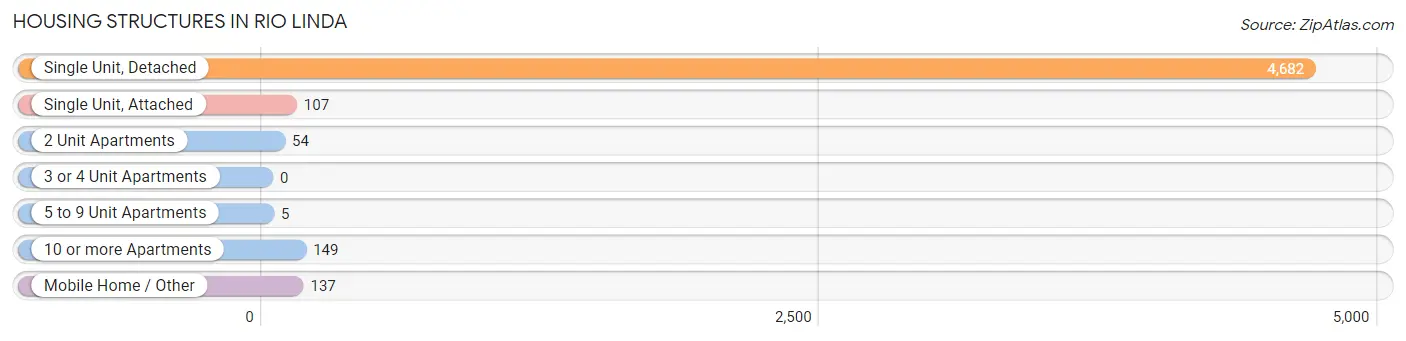
| Structure Type | # Housing Units | % Housing Units |
| Single Unit, Detached | 4,682 | 91.2% |
| Single Unit, Attached | 107 | 2.1% |
| 2 Unit Apartments | 54 | 1.1% |
| 3 or 4 Unit Apartments | 0 | 0.0% |
| 5 to 9 Unit Apartments | 5 | 0.1% |
| 10 or more Apartments | 149 | 2.9% |
| Mobile Home / Other | 137 | 2.7% |
| Total | 5,134 | 100.0% |
Housing Structures by Occupancy in Rio Linda
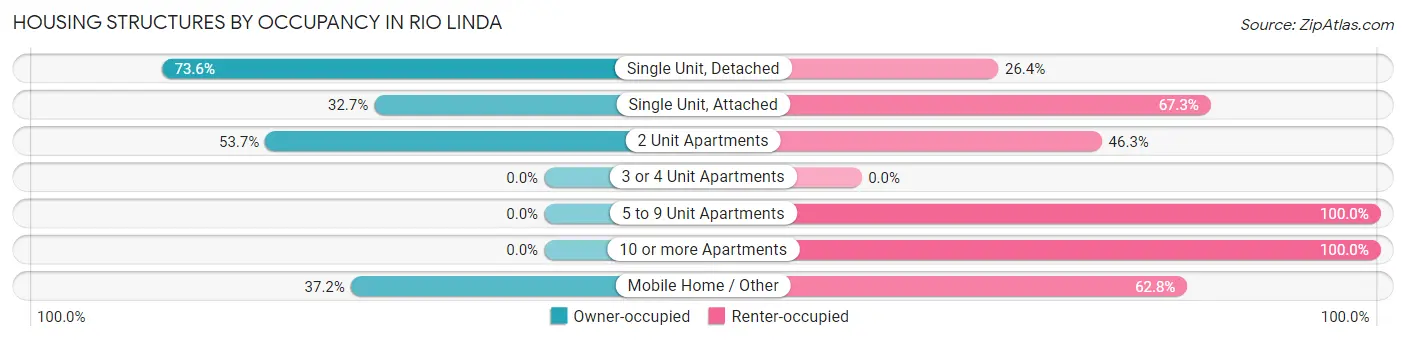
| Structure Type | Owner-occupied | Renter-occupied |
| Single Unit, Detached | 3,448 (73.6%) | 1,234 (26.4%) |
| Single Unit, Attached | 35 (32.7%) | 72 (67.3%) |
| 2 Unit Apartments | 29 (53.7%) | 25 (46.3%) |
| 3 or 4 Unit Apartments | 0 (0.0%) | 0 (0.0%) |
| 5 to 9 Unit Apartments | 0 (0.0%) | 5 (100.0%) |
| 10 or more Apartments | 0 (0.0%) | 149 (100.0%) |
| Mobile Home / Other | 51 (37.2%) | 86 (62.8%) |
| Total | 3,563 (69.4%) | 1,571 (30.6%) |
Housing Structures by Number of Rooms in Rio Linda
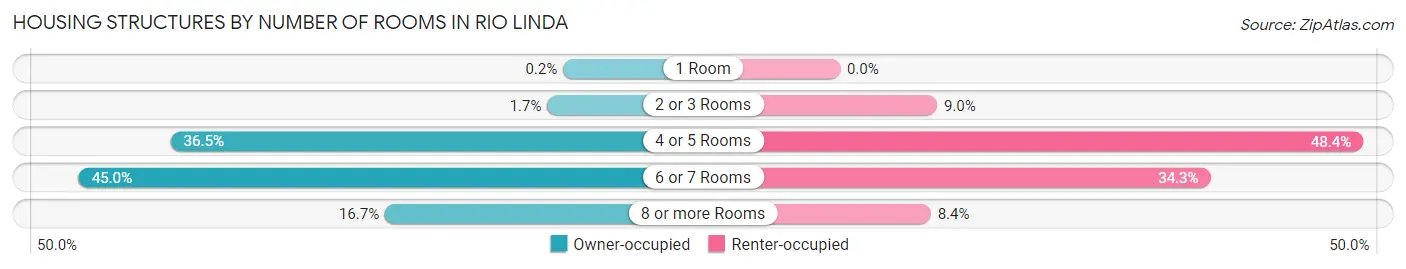
| Number of Rooms | Owner-occupied | Renter-occupied |
| 1 Room | 7 (0.2%) | 0 (0.0%) |
| 2 or 3 Rooms | 59 (1.7%) | 141 (9.0%) |
| 4 or 5 Rooms | 1,300 (36.5%) | 760 (48.4%) |
| 6 or 7 Rooms | 1,603 (45.0%) | 538 (34.3%) |
| 8 or more Rooms | 594 (16.7%) | 132 (8.4%) |
| Total | 3,563 (100.0%) | 1,571 (100.0%) |
Housing Structure by Heating Type in Rio Linda
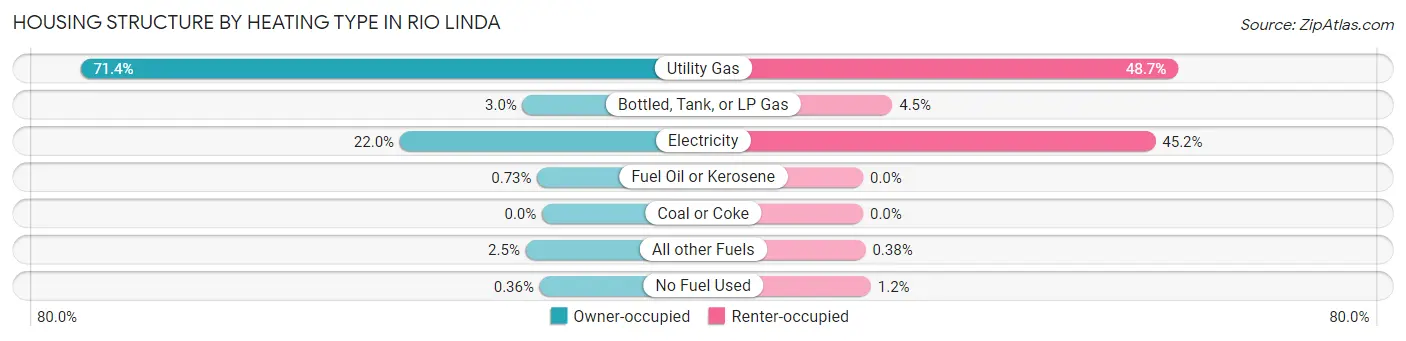
| Heating Type | Owner-occupied | Renter-occupied |
| Utility Gas | 2,544 (71.4%) | 765 (48.7%) |
| Bottled, Tank, or LP Gas | 107 (3.0%) | 71 (4.5%) |
| Electricity | 783 (22.0%) | 710 (45.2%) |
| Fuel Oil or Kerosene | 26 (0.7%) | 0 (0.0%) |
| Coal or Coke | 0 (0.0%) | 0 (0.0%) |
| All other Fuels | 90 (2.5%) | 6 (0.4%) |
| No Fuel Used | 13 (0.4%) | 19 (1.2%) |
| Total | 3,563 (100.0%) | 1,571 (100.0%) |
Household Vehicle Usage in Rio Linda
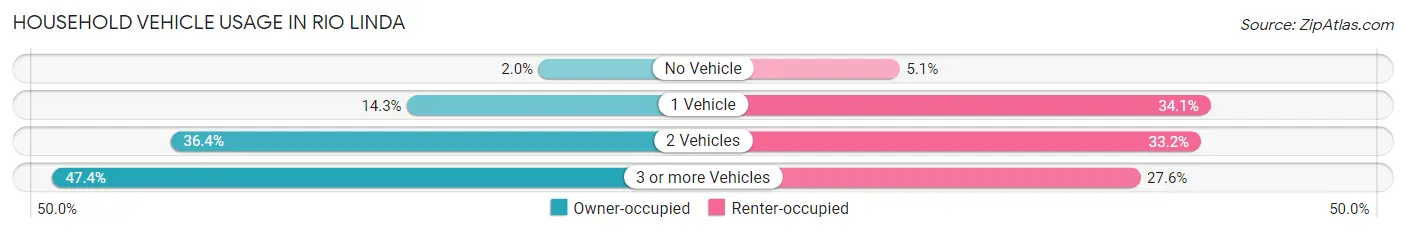
| Vehicles per Household | Owner-occupied | Renter-occupied |
| No Vehicle | 71 (2.0%) | 80 (5.1%) |
| 1 Vehicle | 508 (14.3%) | 536 (34.1%) |
| 2 Vehicles | 1,296 (36.4%) | 522 (33.2%) |
| 3 or more Vehicles | 1,688 (47.4%) | 433 (27.6%) |
| Total | 3,563 (100.0%) | 1,571 (100.0%) |
Real Estate & Mortgages in Rio Linda
Real Estate and Mortgage Overview in Rio Linda
| Characteristic | Without Mortgage | With Mortgage |
| Housing Units | 996 | 2,567 |
| Median Property Value | $359,600 | $407,500 |
| Median Household Income | $64,861 | $689 |
| Monthly Housing Costs | $581 | $366 |
| Real Estate Taxes | $2,029 | $19 |
Property Value by Mortgage Status in Rio Linda
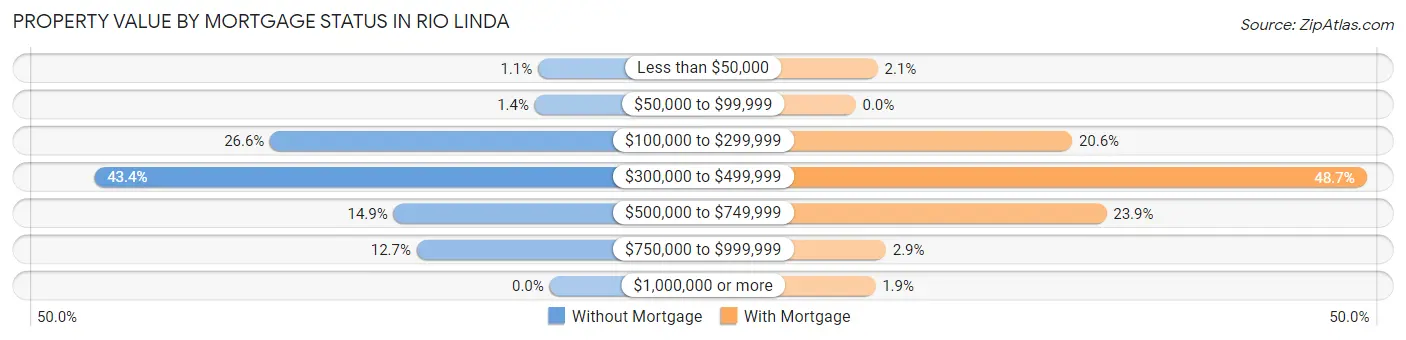
| Property Value | Without Mortgage | With Mortgage |
| Less than $50,000 | 11 (1.1%) | 54 (2.1%) |
| $50,000 to $99,999 | 14 (1.4%) | 0 (0.0%) |
| $100,000 to $299,999 | 265 (26.6%) | 529 (20.6%) |
| $300,000 to $499,999 | 432 (43.4%) | 1,249 (48.7%) |
| $500,000 to $749,999 | 148 (14.9%) | 613 (23.9%) |
| $750,000 to $999,999 | 126 (12.7%) | 74 (2.9%) |
| $1,000,000 or more | 0 (0.0%) | 48 (1.9%) |
| Total | 996 (100.0%) | 2,567 (100.0%) |
Household Income by Mortgage Status in Rio Linda
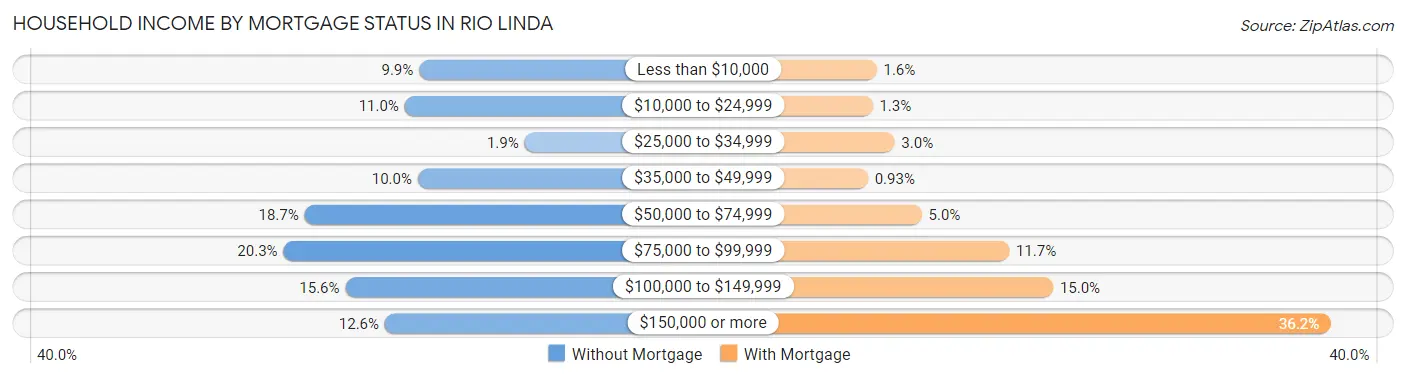
| Household Income | Without Mortgage | With Mortgage |
| Less than $10,000 | 99 (9.9%) | 41 (1.6%) |
| $10,000 to $24,999 | 110 (11.0%) | 33 (1.3%) |
| $25,000 to $34,999 | 19 (1.9%) | 76 (3.0%) |
| $35,000 to $49,999 | 100 (10.0%) | 24 (0.9%) |
| $50,000 to $74,999 | 186 (18.7%) | 129 (5.0%) |
| $75,000 to $99,999 | 202 (20.3%) | 300 (11.7%) |
| $100,000 to $149,999 | 155 (15.6%) | 386 (15.0%) |
| $150,000 or more | 125 (12.6%) | 930 (36.2%) |
| Total | 996 (100.0%) | 2,567 (100.0%) |
Property Value to Household Income Ratio in Rio Linda
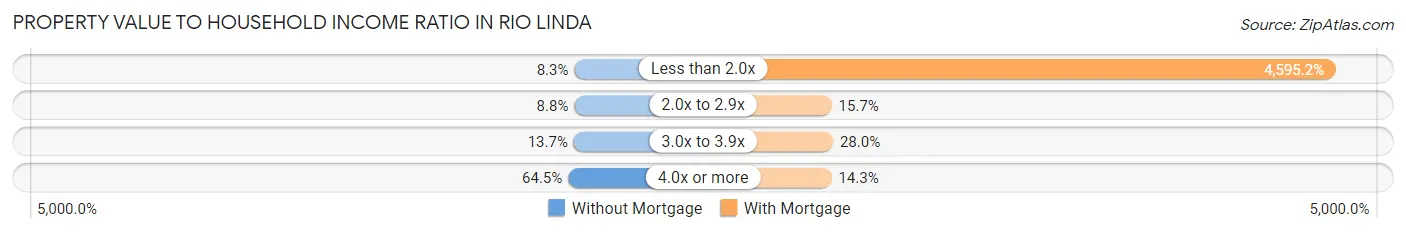
| Value-to-Income Ratio | Without Mortgage | With Mortgage |
| Less than 2.0x | 83 (8.3%) | 117,958 (4,595.2%) |
| 2.0x to 2.9x | 88 (8.8%) | 402 (15.7%) |
| 3.0x to 3.9x | 136 (13.7%) | 718 (28.0%) |
| 4.0x or more | 642 (64.5%) | 366 (14.3%) |
| Total | 996 (100.0%) | 2,567 (100.0%) |
Real Estate Taxes by Mortgage Status in Rio Linda
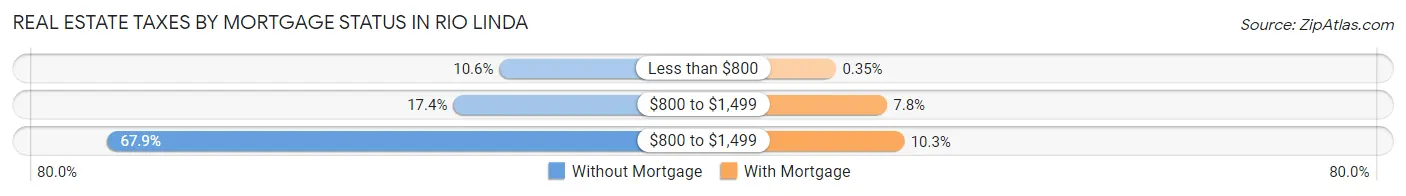
| Property Taxes | Without Mortgage | With Mortgage |
| Less than $800 | 106 (10.6%) | 9 (0.4%) |
| $800 to $1,499 | 173 (17.4%) | 200 (7.8%) |
| $800 to $1,499 | 676 (67.9%) | 265 (10.3%) |
| Total | 996 (100.0%) | 2,567 (100.0%) |
Health & Disability in Rio Linda
Health Insurance Coverage by Age in Rio Linda
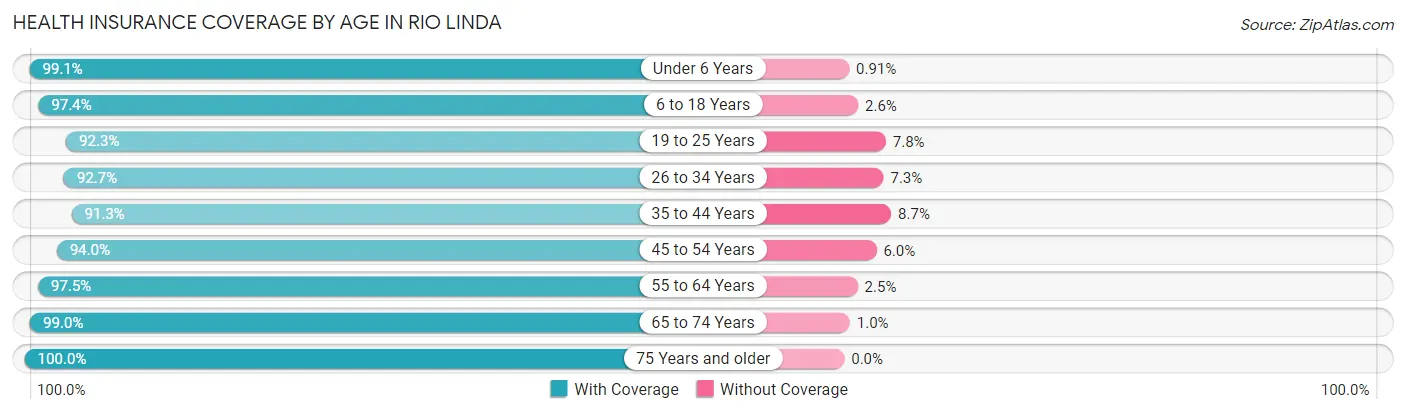
| Age Bracket | With Coverage | Without Coverage |
| Under 6 Years | 1,408 (99.1%) | 13 (0.9%) |
| 6 to 18 Years | 2,727 (97.4%) | 72 (2.6%) |
| 19 to 25 Years | 1,642 (92.2%) | 138 (7.7%) |
| 26 to 34 Years | 1,684 (92.7%) | 133 (7.3%) |
| 35 to 44 Years | 2,006 (91.3%) | 192 (8.7%) |
| 45 to 54 Years | 1,692 (94.0%) | 108 (6.0%) |
| 55 to 64 Years | 2,580 (97.5%) | 66 (2.5%) |
| 65 to 74 Years | 1,348 (99.0%) | 14 (1.0%) |
| 75 Years and older | 771 (100.0%) | 0 (0.0%) |
| Total | 15,858 (95.6%) | 736 (4.4%) |
Health Insurance Coverage by Citizenship Status in Rio Linda
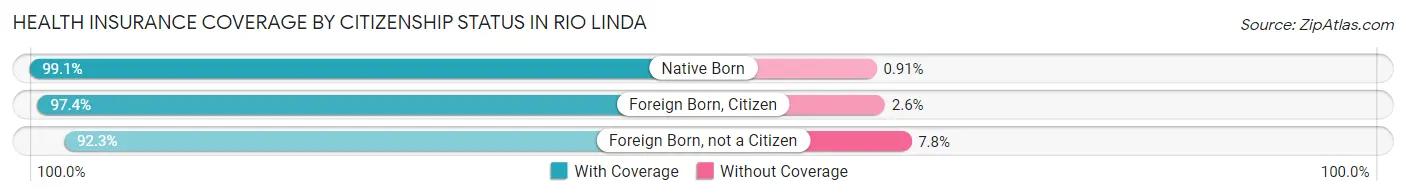
| Citizenship Status | With Coverage | Without Coverage |
| Native Born | 1,408 (99.1%) | 13 (0.9%) |
| Foreign Born, Citizen | 2,727 (97.4%) | 72 (2.6%) |
| Foreign Born, not a Citizen | 1,642 (92.2%) | 138 (7.7%) |
Health Insurance Coverage by Household Income in Rio Linda
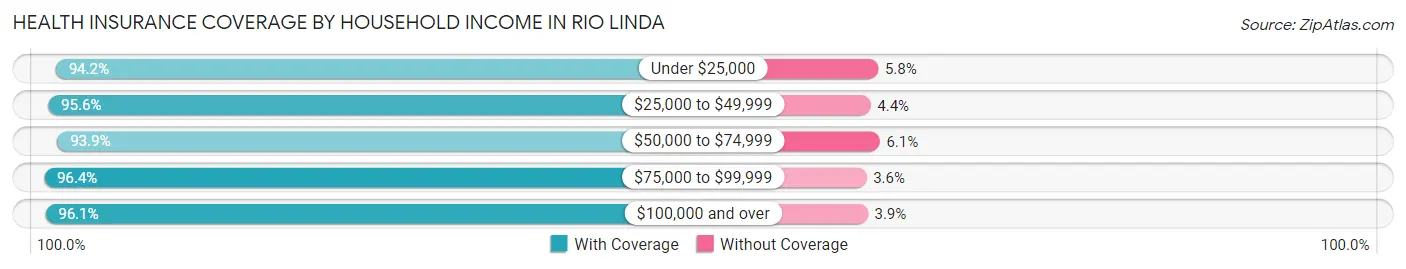
| Household Income | With Coverage | Without Coverage |
| Under $25,000 | 1,420 (94.2%) | 88 (5.8%) |
| $25,000 to $49,999 | 1,448 (95.6%) | 67 (4.4%) |
| $50,000 to $74,999 | 2,225 (93.9%) | 145 (6.1%) |
| $75,000 to $99,999 | 2,387 (96.4%) | 90 (3.6%) |
| $100,000 and over | 8,285 (96.1%) | 334 (3.9%) |
Public vs Private Health Insurance Coverage by Age in Rio Linda
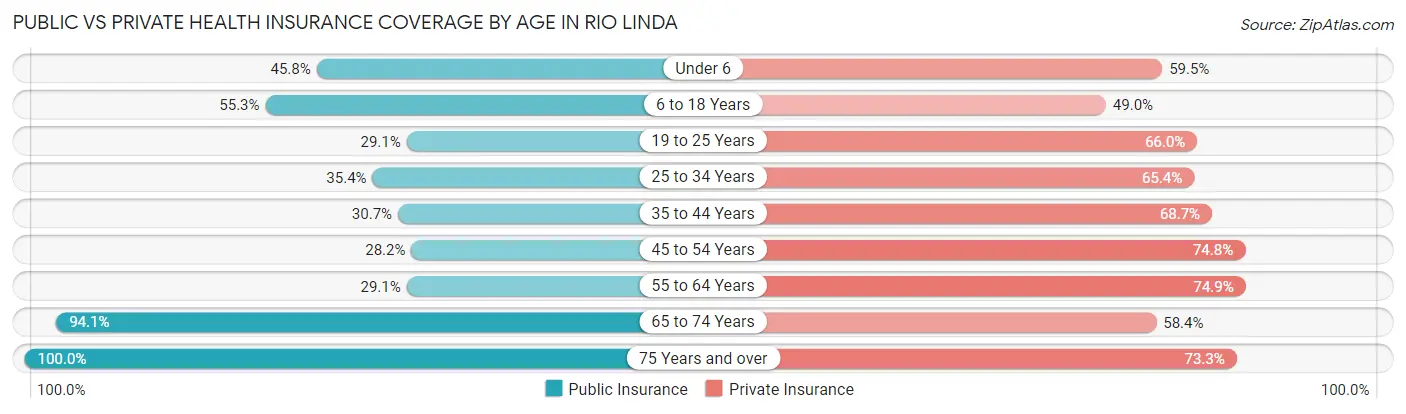
| Age Bracket | Public Insurance | Private Insurance |
| Under 6 | 651 (45.8%) | 845 (59.5%) |
| 6 to 18 Years | 1,548 (55.3%) | 1,372 (49.0%) |
| 19 to 25 Years | 518 (29.1%) | 1,174 (66.0%) |
| 25 to 34 Years | 644 (35.4%) | 1,188 (65.4%) |
| 35 to 44 Years | 675 (30.7%) | 1,510 (68.7%) |
| 45 to 54 Years | 508 (28.2%) | 1,347 (74.8%) |
| 55 to 64 Years | 770 (29.1%) | 1,983 (74.9%) |
| 65 to 74 Years | 1,282 (94.1%) | 795 (58.4%) |
| 75 Years and over | 771 (100.0%) | 565 (73.3%) |
| Total | 7,367 (44.4%) | 10,779 (65.0%) |
Disability Status by Sex by Age in Rio Linda
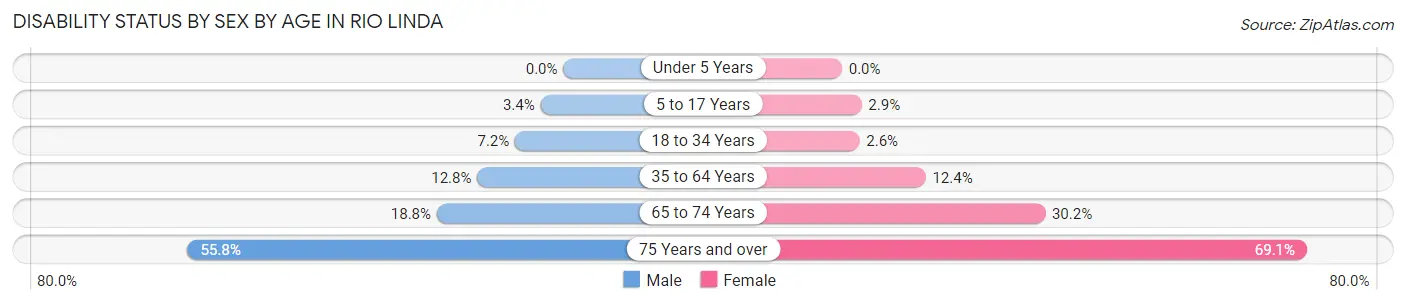
| Age Bracket | Male | Female |
| Under 5 Years | 0 (0.0%) | 0 (0.0%) |
| 5 to 17 Years | 40 (3.4%) | 44 (2.9%) |
| 18 to 34 Years | 145 (7.2%) | 49 (2.6%) |
| 35 to 64 Years | 405 (12.8%) | 432 (12.4%) |
| 65 to 74 Years | 135 (18.8%) | 194 (30.2%) |
| 75 Years and over | 149 (55.8%) | 348 (69.1%) |
Disability Class by Sex by Age in Rio Linda
Disability Class: Hearing Difficulty
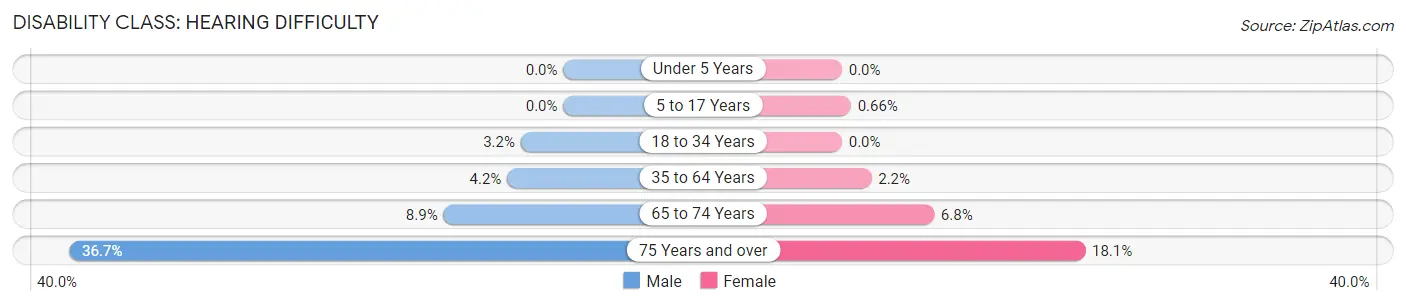
| Age Bracket | Male | Female |
| Under 5 Years | 0 (0.0%) | 0 (0.0%) |
| 5 to 17 Years | 0 (0.0%) | 10 (0.7%) |
| 18 to 34 Years | 64 (3.2%) | 0 (0.0%) |
| 35 to 64 Years | 132 (4.2%) | 76 (2.2%) |
| 65 to 74 Years | 64 (8.9%) | 44 (6.8%) |
| 75 Years and over | 98 (36.7%) | 91 (18.1%) |
Disability Class: Vision Difficulty
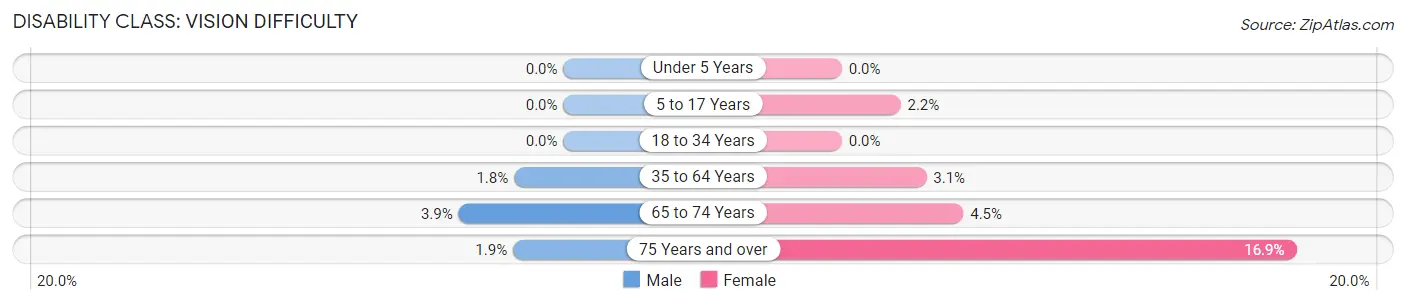
| Age Bracket | Male | Female |
| Under 5 Years | 0 (0.0%) | 0 (0.0%) |
| 5 to 17 Years | 0 (0.0%) | 33 (2.2%) |
| 18 to 34 Years | 0 (0.0%) | 0 (0.0%) |
| 35 to 64 Years | 58 (1.8%) | 109 (3.1%) |
| 65 to 74 Years | 28 (3.9%) | 29 (4.5%) |
| 75 Years and over | 5 (1.9%) | 85 (16.9%) |
Disability Class: Cognitive Difficulty
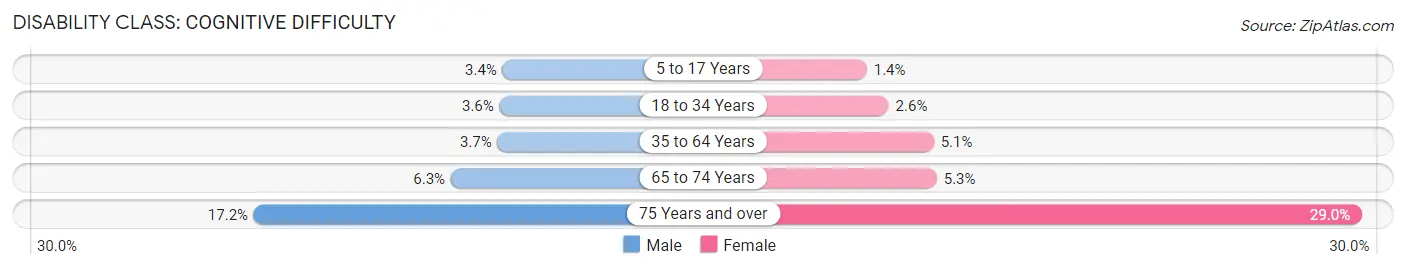
| Age Bracket | Male | Female |
| 5 to 17 Years | 40 (3.4%) | 21 (1.4%) |
| 18 to 34 Years | 72 (3.5%) | 49 (2.6%) |
| 35 to 64 Years | 116 (3.7%) | 178 (5.1%) |
| 65 to 74 Years | 45 (6.3%) | 34 (5.3%) |
| 75 Years and over | 46 (17.2%) | 146 (29.0%) |
Disability Class: Ambulatory Difficulty
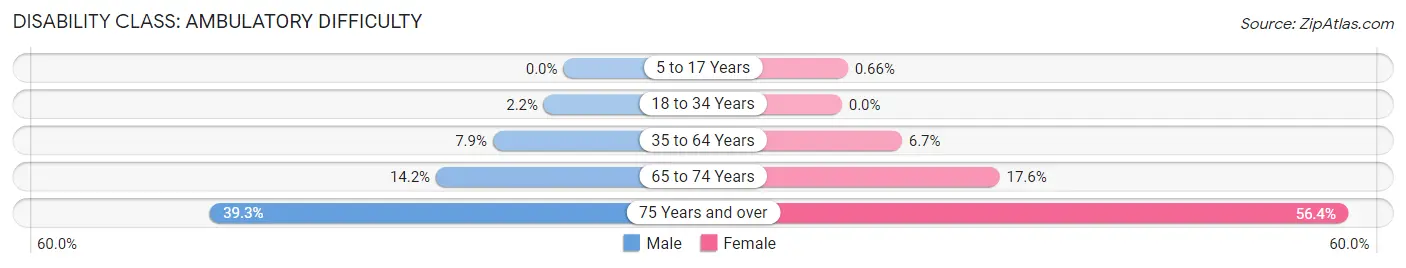
| Age Bracket | Male | Female |
| 5 to 17 Years | 0 (0.0%) | 10 (0.7%) |
| 18 to 34 Years | 44 (2.2%) | 0 (0.0%) |
| 35 to 64 Years | 249 (7.9%) | 232 (6.7%) |
| 65 to 74 Years | 102 (14.2%) | 113 (17.6%) |
| 75 Years and over | 105 (39.3%) | 284 (56.4%) |
Disability Class: Self-Care Difficulty
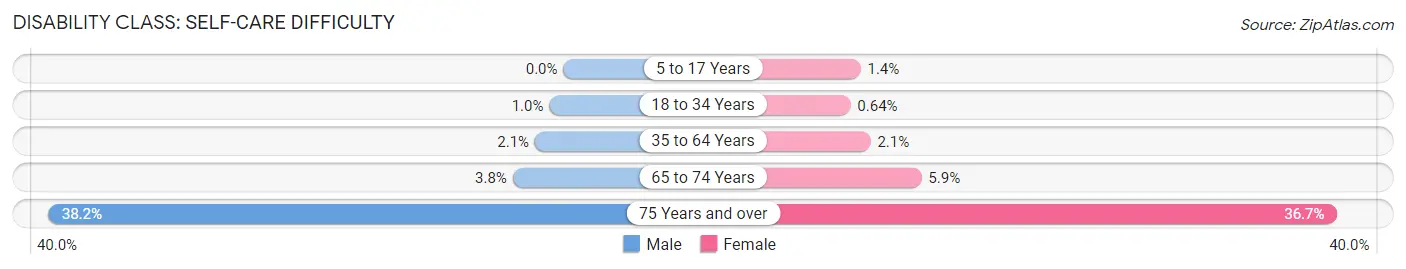
| Age Bracket | Male | Female |
| 5 to 17 Years | 0 (0.0%) | 21 (1.4%) |
| 18 to 34 Years | 21 (1.0%) | 12 (0.6%) |
| 35 to 64 Years | 67 (2.1%) | 74 (2.1%) |
| 65 to 74 Years | 27 (3.8%) | 38 (5.9%) |
| 75 Years and over | 102 (38.2%) | 185 (36.7%) |
Technology Access in Rio Linda
Computing Device Access in Rio Linda
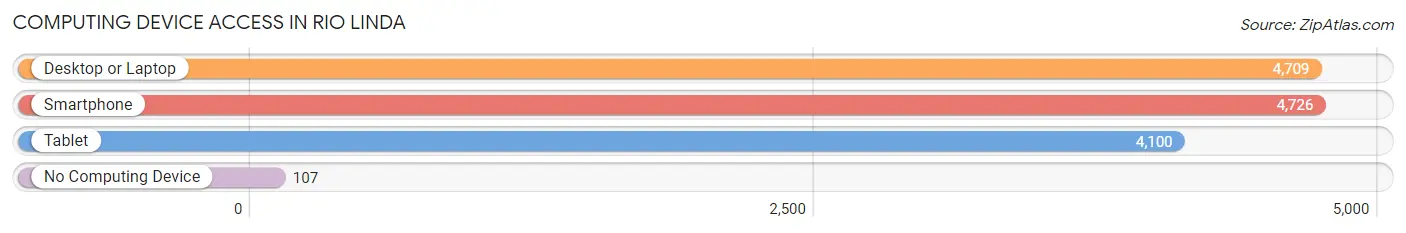
| Device Type | # Households | % Households |
| Desktop or Laptop | 4,709 | 91.7% |
| Smartphone | 4,726 | 92.0% |
| Tablet | 4,100 | 79.9% |
| No Computing Device | 107 | 2.1% |
| Total | 5,134 | 100.0% |
Internet Access in Rio Linda
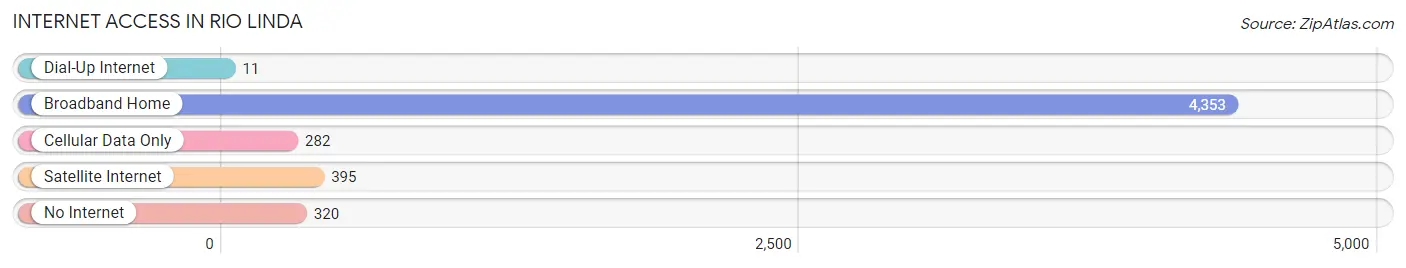
| Internet Type | # Households | % Households |
| Dial-Up Internet | 11 | 0.2% |
| Broadband Home | 4,353 | 84.8% |
| Cellular Data Only | 282 | 5.5% |
| Satellite Internet | 395 | 7.7% |
| No Internet | 320 | 6.2% |
| Total | 5,134 | 100.0% |
Rio Linda Summary
Rio Linda is a census-designated place located in Sacramento County, California. It is situated in the northern part of the county, about 10 miles northeast of the city of Sacramento. The population of Rio Linda was 15,106 at the 2010 census.
History
Rio Linda was originally part of the Rancho Del Paso Mexican land grant, which was granted to John Sutter in 1844. The area was first settled by European-Americans in the 1850s, and the town was officially founded in 1910. The name Rio Linda is derived from the Spanish words for “beautiful river”.
Geography
Rio Linda is located at 38°41'25"N 121°27'17"W (38.690278, -121.454722). According to the United States Census Bureau, the CDP has a total area of 4.2 square miles, all of it land.
Economy
Rio Linda is primarily a residential community, with most of its residents commuting to nearby cities for work. The town does have some small businesses, including a few restaurants, a grocery store, and a few auto repair shops.
Demographics
As of the 2010 census, there were 15,106 people, 5,093 households, and 3,845 families residing in Rio Linda. The population density was 3,569.2 people per square mile. The racial makeup of the CDP was 68.2% White, 8.2% African American, 1.2% Native American, 5.2% Asian, 0.4% Pacific Islander, 11.7% from other races, and 5.1% from two or more races. Hispanic or Latino of any race were 24.2% of the population.
The median income for a household in Rio Linda was $50,945, and the median income for a family was $58,945. About 17.2% of families and 20.2% of the population were below the poverty line, including 28.2% of those under age 18 and 8.2% of those age 65 or over.
Common Questions
What is Per Capita Income in Rio Linda?
Per Capita income in Rio Linda is $32,777.
What is the Median Family Income in Rio Linda?
Median Family Income in Rio Linda is $97,988.
What is the Median Household income in Rio Linda?
Median Household Income in Rio Linda is $88,102.
What is Income or Wage Gap in Rio Linda?
Income or Wage Gap in Rio Linda is 12.5%.
Women in Rio Linda earn 87.5 cents for every dollar earned by a man.
What is Inequality or Gini Index in Rio Linda?
Inequality or Gini Index in Rio Linda is 0.40.
What is the Total Population of Rio Linda?
Total Population of Rio Linda is 16,596.
What is the Total Male Population of Rio Linda?
Total Male Population of Rio Linda is 7,882.
What is the Total Female Population of Rio Linda?
Total Female Population of Rio Linda is 8,714.
What is the Ratio of Males per 100 Females in Rio Linda?
There are 90.45 Males per 100 Females in Rio Linda.
What is the Ratio of Females per 100 Males in Rio Linda?
There are 110.56 Females per 100 Males in Rio Linda.
What is the Median Population Age in Rio Linda?
Median Population Age in Rio Linda is 36.7 Years.
What is the Average Family Size in Rio Linda
Average Family Size in Rio Linda is 3.6 People.
What is the Average Household Size in Rio Linda
Average Household Size in Rio Linda is 3.2 People.
How Large is the Labor Force in Rio Linda?
There are 7,702 People in the Labor Forcein in Rio Linda.
What is the Percentage of People in the Labor Force in Rio Linda?
59.4% of People are in the Labor Force in Rio Linda.
What is the Unemployment Rate in Rio Linda?
Unemployment Rate in Rio Linda is 4.9%.