Aptos, CA Map & Demographics
Aptos Map
Aptos Overview
$62,960
PER CAPITA INCOME
$130,663
AVG FAMILY INCOME
$126,364
AVG HOUSEHOLD INCOME
11.3%
WAGE / INCOME GAP [ % ]
88.7¢/ $1
WAGE / INCOME GAP [ $ ]
$11,387
FAMILY INCOME DEFICIT
0.40
INEQUALITY / GINI INDEX
6,614
TOTAL POPULATION
3,005
MALE POPULATION
3,609
FEMALE POPULATION
83.26
MALES / 100 FEMALES
120.10
FEMALES / 100 MALES
50.6
MEDIAN AGE
3.0
AVG FAMILY SIZE
2.6
AVG HOUSEHOLD SIZE
3,407
LABOR FORCE [ PEOPLE ]
59.1%
PERCENT IN LABOR FORCE
5.5%
UNEMPLOYMENT RATE
Aptos Zip Codes
Aptos Area Codes
Income in Aptos
Income Overview in Aptos
Per Capita Income in Aptos is $62,960, while median incomes of families and households are $130,663 and $126,364 respectively.
| Characteristic | Number | Measure |
| Per Capita Income | 6,614 | $62,960 |
| Median Family Income | 1,838 | $130,663 |
| Mean Family Income | 1,838 | $176,969 |
| Median Household Income | 2,560 | $126,364 |
| Mean Household Income | 2,560 | $158,467 |
| Income Deficit | 1,838 | $11,387 |
| Wage / Income Gap (%) | 6,614 | 11.25% |
| Wage / Income Gap ($) | 6,614 | 88.75¢ per $1 |
| Gini / Inequality Index | 6,614 | 0.40 |
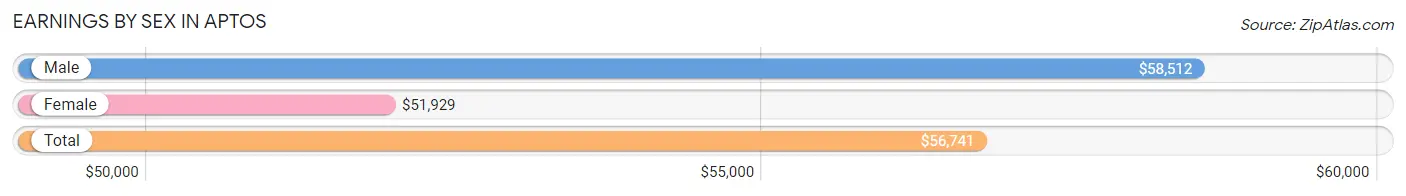
Earnings by Sex in Aptos
Average Earnings in Aptos are $56,741, $58,512 for men and $51,929 for women, a difference of 11.3%.
| Sex | Number | Average Earnings |
| Male | 1,920 (53.8%) | $58,512 |
| Female | 1,651 (46.2%) | $51,929 |
| Total | 3,571 (100.0%) | $56,741 |
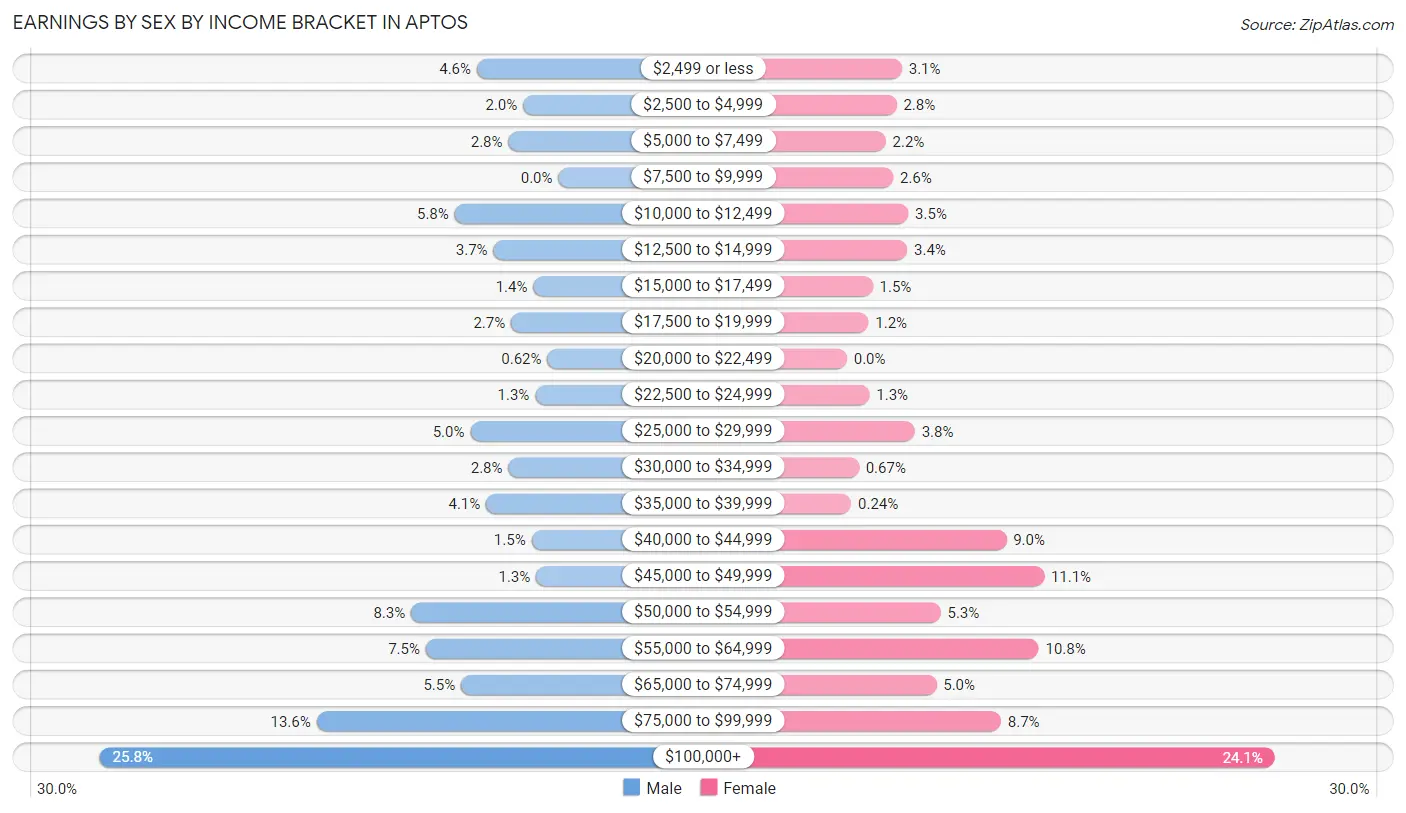
Earnings by Sex by Income Bracket in Aptos
The most common earnings brackets in Aptos are $100,000+ for men (495 | 25.8%) and $100,000+ for women (397 | 24.0%).
| Income | Male | Female |
| $2,499 or less | 88 (4.6%) | 51 (3.1%) |
| $2,500 to $4,999 | 38 (2.0%) | 46 (2.8%) |
| $5,000 to $7,499 | 54 (2.8%) | 36 (2.2%) |
| $7,500 to $9,999 | 0 (0.0%) | 43 (2.6%) |
| $10,000 to $12,499 | 112 (5.8%) | 57 (3.5%) |
| $12,500 to $14,999 | 70 (3.6%) | 56 (3.4%) |
| $15,000 to $17,499 | 27 (1.4%) | 24 (1.5%) |
| $17,500 to $19,999 | 51 (2.7%) | 20 (1.2%) |
| $20,000 to $22,499 | 12 (0.6%) | 0 (0.0%) |
| $22,500 to $24,999 | 25 (1.3%) | 21 (1.3%) |
| $25,000 to $29,999 | 95 (5.0%) | 63 (3.8%) |
| $30,000 to $34,999 | 54 (2.8%) | 11 (0.7%) |
| $35,000 to $39,999 | 78 (4.1%) | 4 (0.2%) |
| $40,000 to $44,999 | 29 (1.5%) | 148 (9.0%) |
| $45,000 to $49,999 | 24 (1.3%) | 183 (11.1%) |
| $50,000 to $54,999 | 159 (8.3%) | 87 (5.3%) |
| $55,000 to $64,999 | 143 (7.4%) | 178 (10.8%) |
| $65,000 to $74,999 | 105 (5.5%) | 83 (5.0%) |
| $75,000 to $99,999 | 261 (13.6%) | 143 (8.7%) |
| $100,000+ | 495 (25.8%) | 397 (24.0%) |
| Total | 1,920 (100.0%) | 1,651 (100.0%) |
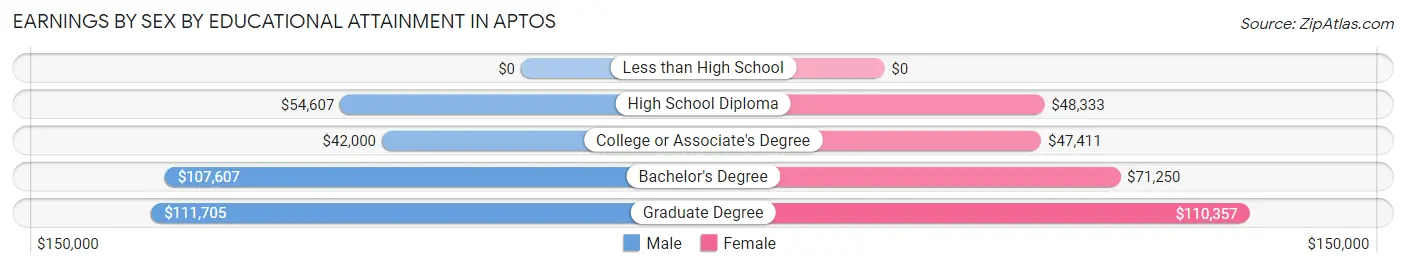
Earnings by Sex by Educational Attainment in Aptos
Average earnings in Aptos are $70,321 for men and $59,490 for women, a difference of 15.4%. Men with an educational attainment of graduate degree enjoy the highest average annual earnings of $111,705, while those with college or associate's degree education earn the least with $42,000. Women with an educational attainment of graduate degree earn the most with the average annual earnings of $110,357, while those with college or associate's degree education have the smallest earnings of $47,411.
| Educational Attainment | Male Income | Female Income |
| Less than High School | - | - |
| High School Diploma | $54,607 | $48,333 |
| College or Associate's Degree | $42,000 | $47,411 |
| Bachelor's Degree | $107,607 | $71,250 |
| Graduate Degree | $111,705 | $110,357 |
| Total | $70,321 | $59,490 |
Family Income in Aptos
Family Income Brackets in Aptos
According to the Aptos family income data, there are 531 families falling into the $200,000+ income range, which is the most common income bracket and makes up 28.9% of all families.
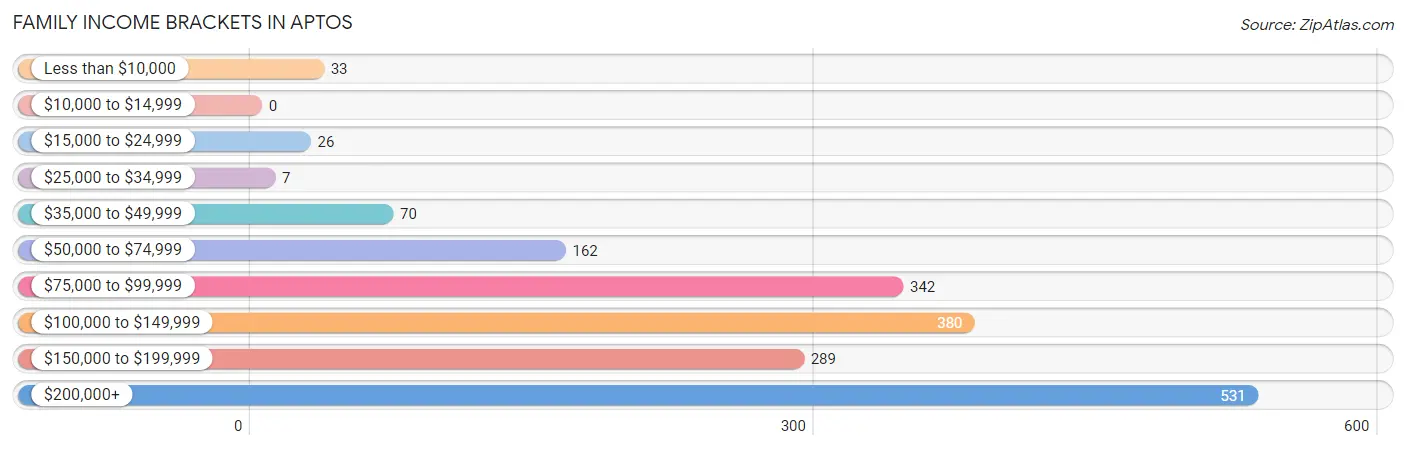
| Income Bracket | # Families | % Families |
| Less than $10,000 | 33 | 1.8% |
| $10,000 to $14,999 | 0 | 0.0% |
| $15,000 to $24,999 | 26 | 1.4% |
| $25,000 to $34,999 | 7 | 0.4% |
| $35,000 to $49,999 | 70 | 3.8% |
| $50,000 to $74,999 | 162 | 8.8% |
| $75,000 to $99,999 | 342 | 18.6% |
| $100,000 to $149,999 | 380 | 20.7% |
| $150,000 to $199,999 | 289 | 15.7% |
| $200,000+ | 531 | 28.9% |
Family Income by Famaliy Size in Aptos
5-person families (23 | 1.3%) account for the highest median family income in Aptos with $237,054 per family, while 3-person families (323 | 17.6%) have the highest median income of $76,917 per family member.
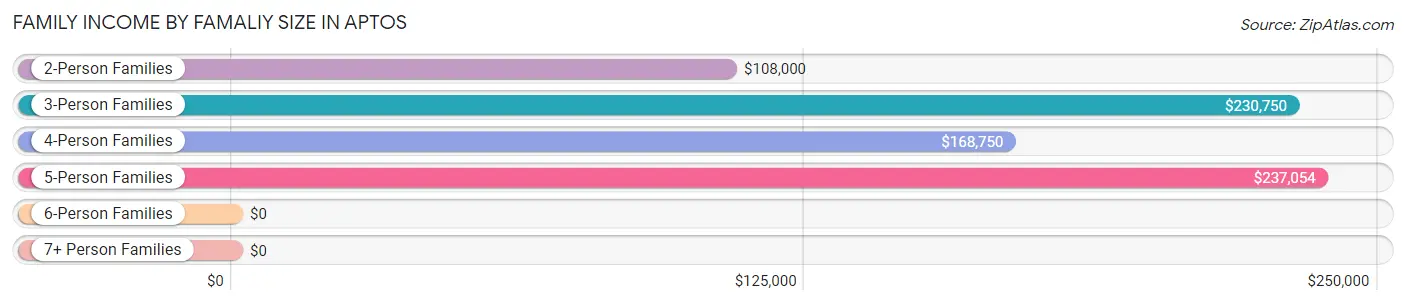
| Income Bracket | # Families | Median Income |
| 2-Person Families | 1,044 (56.8%) | $108,000 |
| 3-Person Families | 323 (17.6%) | $230,750 |
| 4-Person Families | 349 (19.0%) | $168,750 |
| 5-Person Families | 23 (1.3%) | $237,054 |
| 6-Person Families | 99 (5.4%) | $0 |
| 7+ Person Families | 0 (0.0%) | $0 |
| Total | 1,838 (100.0%) | $130,663 |
Family Income by Number of Earners in Aptos
The median family income in Aptos is $130,663, with families comprising 3+ earners (221) having the highest median family income of $235,982, while families with 1 earner (743) have the lowest median family income of $99,629, accounting for 12.0% and 40.4% of families, respectively.
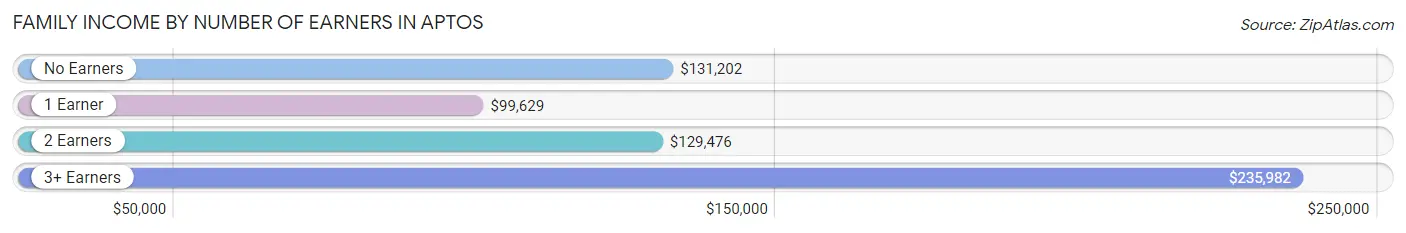
| Number of Earners | # Families | Median Income |
| No Earners | 297 (16.2%) | $131,202 |
| 1 Earner | 743 (40.4%) | $99,629 |
| 2 Earners | 577 (31.4%) | $129,476 |
| 3+ Earners | 221 (12.0%) | $235,982 |
| Total | 1,838 (100.0%) | $130,663 |
Household Income in Aptos
Household Income Brackets in Aptos
With 612 households falling in the category, the $200,000+ income range is the most frequent in Aptos, accounting for 23.9% of all households. In contrast, only 8 households (0.3%) fall into the $10,000 to $14,999 income bracket, making it the least populous group.
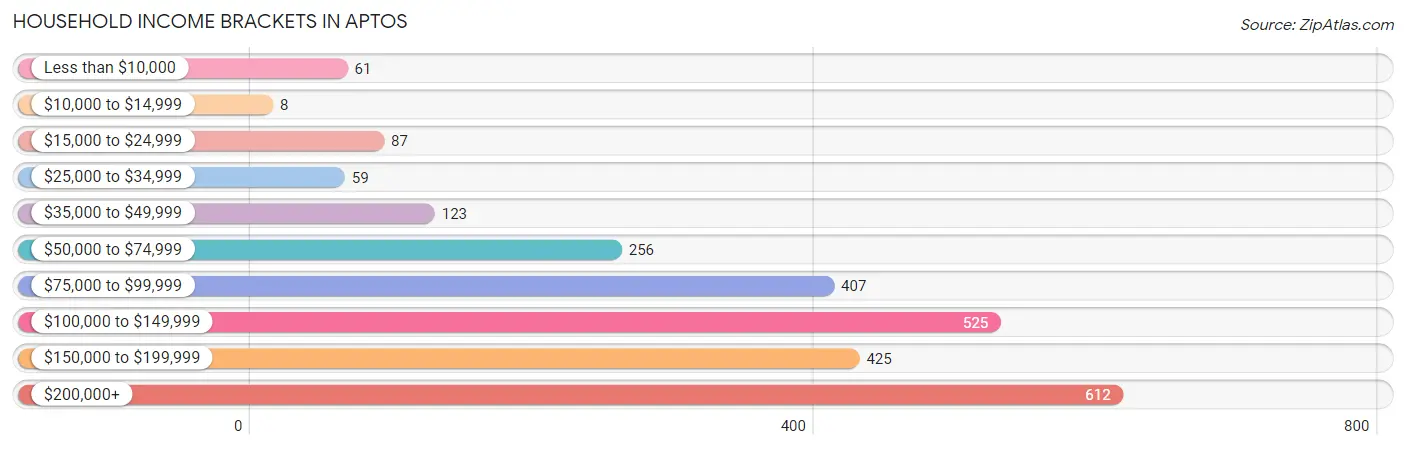
| Income Bracket | # Households | % Households |
| Less than $10,000 | 61 | 2.4% |
| $10,000 to $14,999 | 8 | 0.3% |
| $15,000 to $24,999 | 87 | 3.4% |
| $25,000 to $34,999 | 59 | 2.3% |
| $35,000 to $49,999 | 123 | 4.8% |
| $50,000 to $74,999 | 256 | 10.0% |
| $75,000 to $99,999 | 407 | 15.9% |
| $100,000 to $149,999 | 525 | 20.5% |
| $150,000 to $199,999 | 425 | 16.6% |
| $200,000+ | 612 | 23.9% |
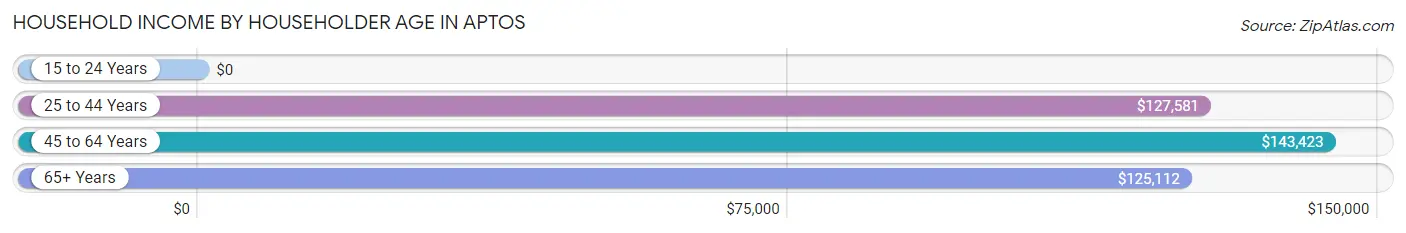
Household Income by Householder Age in Aptos
The median household income in Aptos is $126,364, with the highest median household income of $143,423 found in the 45 to 64 years age bracket for the primary householder. A total of 1,029 households (40.2%) fall into this category.
| Income Bracket | # Households | Median Income |
| 15 to 24 Years | 0 (0.0%) | $0 |
| 25 to 44 Years | 516 (20.2%) | $127,581 |
| 45 to 64 Years | 1,029 (40.2%) | $143,423 |
| 65+ Years | 1,015 (39.7%) | $125,112 |
| Total | 2,560 (100.0%) | $126,364 |
Poverty in Aptos
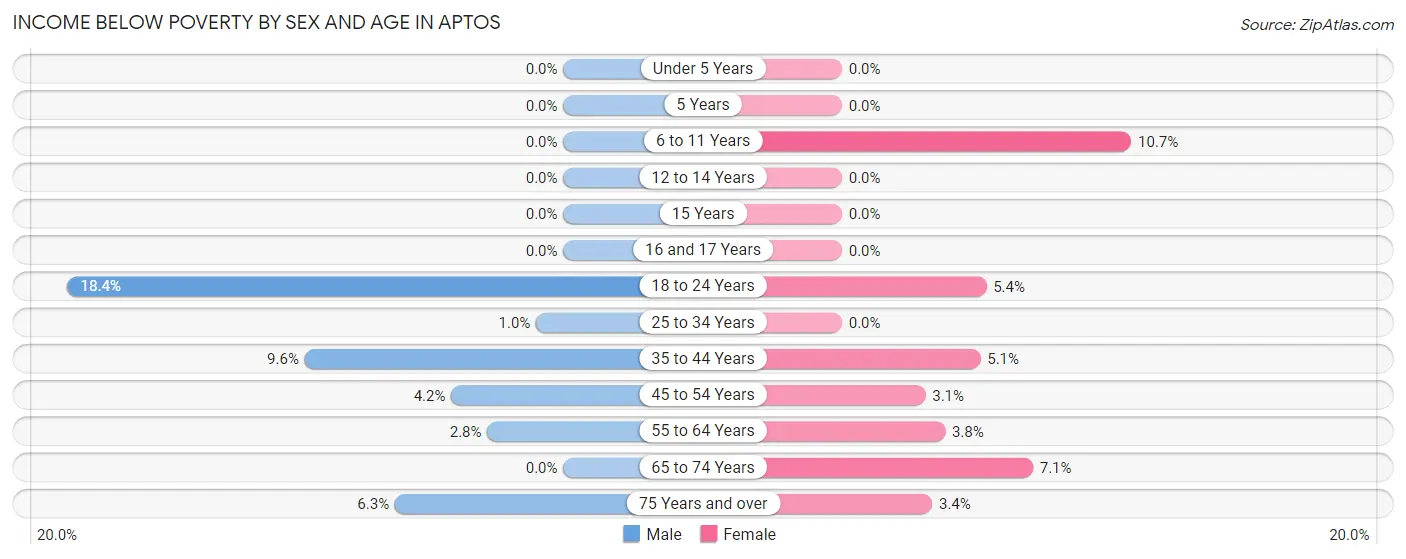
Income Below Poverty by Sex and Age in Aptos
With 4.4% poverty level for males and 4.2% for females among the residents of Aptos, 18 to 24 year old males and 6 to 11 year old females are the most vulnerable to poverty, with 60 males (18.4%) and 26 females (10.7%) in their respective age groups living below the poverty level.
| Age Bracket | Male | Female |
| Under 5 Years | 0 (0.0%) | 0 (0.0%) |
| 5 Years | 0 (0.0%) | 0 (0.0%) |
| 6 to 11 Years | 0 (0.0%) | 26 (10.7%) |
| 12 to 14 Years | 0 (0.0%) | 0 (0.0%) |
| 15 Years | 0 (0.0%) | 0 (0.0%) |
| 16 and 17 Years | 0 (0.0%) | 0 (0.0%) |
| 18 to 24 Years | 60 (18.4%) | 28 (5.4%) |
| 25 to 34 Years | 3 (1.0%) | 0 (0.0%) |
| 35 to 44 Years | 19 (9.6%) | 11 (5.1%) |
| 45 to 54 Years | 16 (4.2%) | 11 (3.1%) |
| 55 to 64 Years | 19 (2.8%) | 23 (3.8%) |
| 65 to 74 Years | 0 (0.0%) | 36 (7.1%) |
| 75 Years and over | 15 (6.2%) | 16 (3.4%) |
| Total | 132 (4.4%) | 151 (4.2%) |
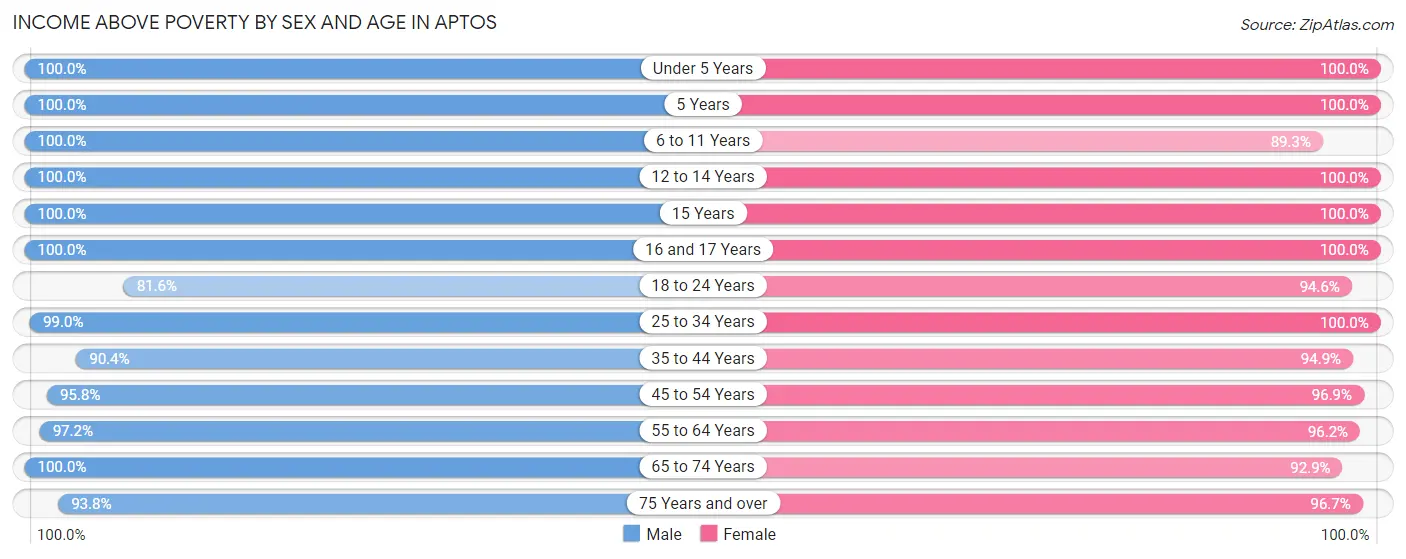
Income Above Poverty by Sex and Age in Aptos
According to the poverty statistics in Aptos, males aged under 5 years and females aged under 5 years are the age groups that are most secure financially, with 100.0% of males and 100.0% of females in these age groups living above the poverty line.
| Age Bracket | Male | Female |
| Under 5 Years | 157 (100.0%) | 79 (100.0%) |
| 5 Years | 9 (100.0%) | 40 (100.0%) |
| 6 to 11 Years | 222 (100.0%) | 216 (89.3%) |
| 12 to 14 Years | 16 (100.0%) | 36 (100.0%) |
| 15 Years | 32 (100.0%) | 16 (100.0%) |
| 16 and 17 Years | 22 (100.0%) | 50 (100.0%) |
| 18 to 24 Years | 266 (81.6%) | 494 (94.6%) |
| 25 to 34 Years | 293 (99.0%) | 468 (100.0%) |
| 35 to 44 Years | 179 (90.4%) | 203 (94.9%) |
| 45 to 54 Years | 369 (95.8%) | 344 (96.9%) |
| 55 to 64 Years | 654 (97.2%) | 578 (96.2%) |
| 65 to 74 Years | 429 (100.0%) | 472 (92.9%) |
| 75 Years and over | 225 (93.8%) | 462 (96.7%) |
| Total | 2,873 (95.6%) | 3,458 (95.8%) |
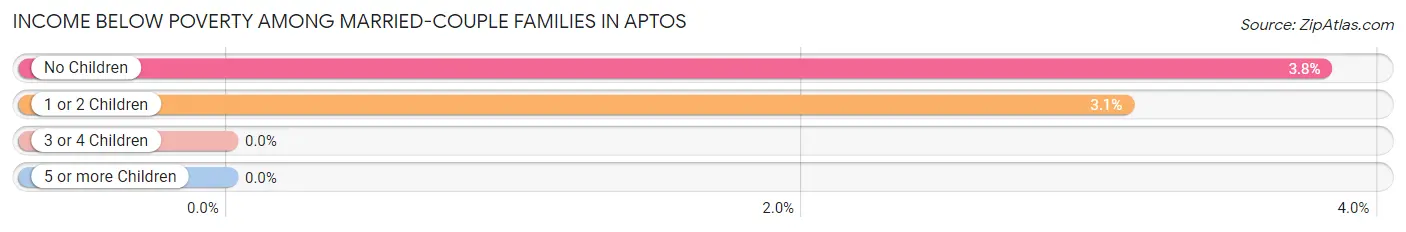
Income Below Poverty Among Married-Couple Families in Aptos
The poverty statistics for married-couple families in Aptos show that 3.6% or 46 of the total 1,278 families live below the poverty line. Families with no children have the highest poverty rate of 3.8%, comprising of 34 families. On the other hand, families with 1 or 2 children have the lowest poverty rate of 3.1%, which includes 12 families.
| Children | Above Poverty | Below Poverty |
| No Children | 859 (96.2%) | 34 (3.8%) |
| 1 or 2 Children | 373 (96.9%) | 12 (3.1%) |
| 3 or 4 Children | 0 (0.0%) | 0 (0.0%) |
| 5 or more Children | 0 (0.0%) | 0 (0.0%) |
| Total | 1,232 (96.4%) | 46 (3.6%) |
Income Below Poverty Among Single-Parent Households in Aptos
| Children | Single Father | Single Mother |
| No Children | 0 (0.0%) | 0 (0.0%) |
| 1 or 2 Children | 0 (0.0%) | 0 (0.0%) |
| 3 or 4 Children | 0 (0.0%) | 0 (0.0%) |
| 5 or more Children | 0 (0.0%) | 0 (0.0%) |
| Total | 0 (0.0%) | 0 (0.0%) |
Income Below Poverty Among Married-Couple vs Single-Parent Households in Aptos
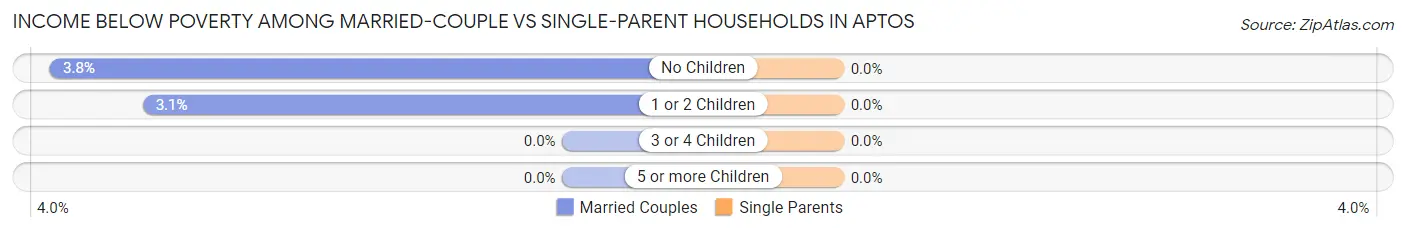
| Children | Married-Couple Families | Single-Parent Households |
| No Children | 34 (3.8%) | 0 (0.0%) |
| 1 or 2 Children | 12 (3.1%) | 0 (0.0%) |
| 3 or 4 Children | 0 (0.0%) | 0 (0.0%) |
| 5 or more Children | 0 (0.0%) | 0 (0.0%) |
| Total | 46 (3.6%) | 0 (0.0%) |
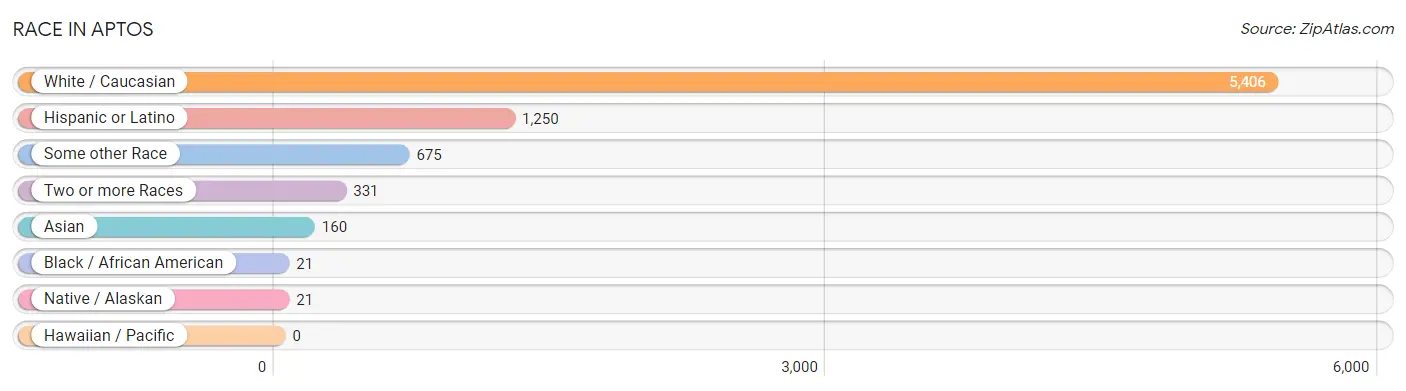
Race in Aptos
The most populous races in Aptos are White / Caucasian (5,406 | 81.7%), Hispanic or Latino (1,250 | 18.9%), and Some other Race (675 | 10.2%).
| Race | # Population | % Population |
| Asian | 160 | 2.4% |
| Black / African American | 21 | 0.3% |
| Hawaiian / Pacific | 0 | 0.0% |
| Hispanic or Latino | 1,250 | 18.9% |
| Native / Alaskan | 21 | 0.3% |
| White / Caucasian | 5,406 | 81.7% |
| Two or more Races | 331 | 5.0% |
| Some other Race | 675 | 10.2% |
| Total | 6,614 | 100.0% |
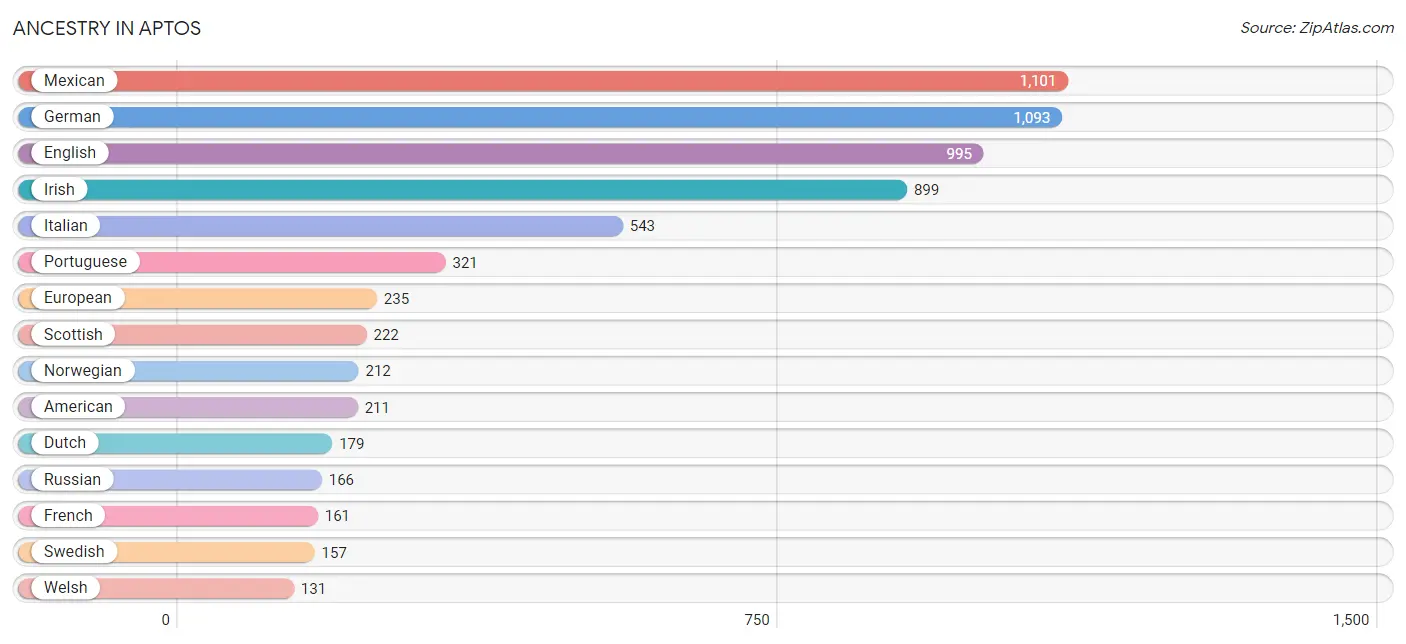
Ancestry in Aptos
The most populous ancestries reported in Aptos are Mexican (1,101 | 16.7%), German (1,093 | 16.5%), English (995 | 15.0%), Irish (899 | 13.6%), and Italian (543 | 8.2%), together accounting for 70.0% of all Aptos residents.
| Ancestry | # Population | % Population |
| American | 211 | 3.2% |
| Apache | 13 | 0.2% |
| Argentinean | 32 | 0.5% |
| Armenian | 21 | 0.3% |
| Austrian | 14 | 0.2% |
| Belgian | 27 | 0.4% |
| Bhutanese | 19 | 0.3% |
| British | 87 | 1.3% |
| Burmese | 101 | 1.5% |
| Canadian | 7 | 0.1% |
| Cherokee | 30 | 0.4% |
| Choctaw | 22 | 0.3% |
| Croatian | 5 | 0.1% |
| Czech | 29 | 0.4% |
| Danish | 47 | 0.7% |
| Dutch | 179 | 2.7% |
| English | 995 | 15.0% |
| European | 235 | 3.5% |
| French | 161 | 2.4% |
| German | 1,093 | 16.5% |
| Greek | 15 | 0.2% |
| Indian (Asian) | 29 | 0.4% |
| Iranian | 57 | 0.9% |
| Irish | 899 | 13.6% |
| Italian | 543 | 8.2% |
| Japanese | 29 | 0.4% |
| Korean | 10 | 0.2% |
| Lithuanian | 62 | 0.9% |
| Luxembourger | 7 | 0.1% |
| Mexican | 1,101 | 16.7% |
| Navajo | 2 | 0.0% |
| Northern European | 8 | 0.1% |
| Norwegian | 212 | 3.2% |
| Polish | 121 | 1.8% |
| Portuguese | 321 | 4.9% |
| Romanian | 30 | 0.4% |
| Russian | 166 | 2.5% |
| Samoan | 86 | 1.3% |
| Scandinavian | 15 | 0.2% |
| Scotch-Irish | 86 | 1.3% |
| Scottish | 222 | 3.4% |
| South American | 32 | 0.5% |
| Spaniard | 80 | 1.2% |
| Spanish | 18 | 0.3% |
| Sri Lankan | 58 | 0.9% |
| Swedish | 157 | 2.4% |
| Swiss | 39 | 0.6% |
| Ukrainian | 6 | 0.1% |
| Welsh | 131 | 2.0% | View All 49 Rows |
Immigrants in Aptos
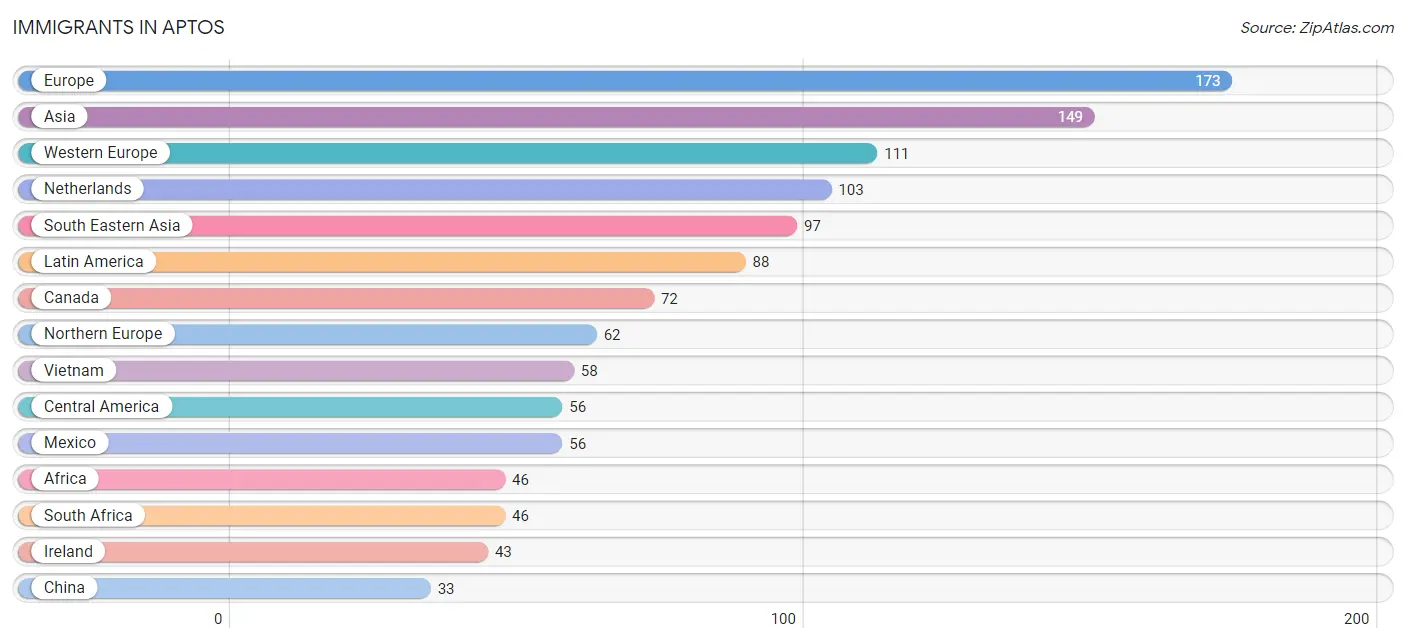
The most numerous immigrant groups reported in Aptos came from Europe (173 | 2.6%), Asia (149 | 2.2%), Western Europe (111 | 1.7%), Netherlands (103 | 1.6%), and South Eastern Asia (97 | 1.5%), together accounting for 9.6% of all Aptos residents.
| Immigration Origin | # Population | % Population |
| Africa | 46 | 0.7% |
| Argentina | 32 | 0.5% |
| Asia | 149 | 2.2% |
| Cambodia | 29 | 0.4% |
| Canada | 72 | 1.1% |
| Central America | 56 | 0.9% |
| China | 33 | 0.5% |
| Eastern Asia | 33 | 0.5% |
| Europe | 173 | 2.6% |
| Germany | 8 | 0.1% |
| Iran | 19 | 0.3% |
| Ireland | 43 | 0.6% |
| Latin America | 88 | 1.3% |
| Mexico | 56 | 0.9% |
| Netherlands | 103 | 1.6% |
| Northern Europe | 62 | 0.9% |
| Philippines | 10 | 0.2% |
| Scotland | 11 | 0.2% |
| South Africa | 46 | 0.7% |
| South America | 32 | 0.5% |
| South Central Asia | 19 | 0.3% |
| South Eastern Asia | 97 | 1.5% |
| Vietnam | 58 | 0.9% |
| Western Europe | 111 | 1.7% | View All 24 Rows |
Sex and Age in Aptos
Sex and Age in Aptos
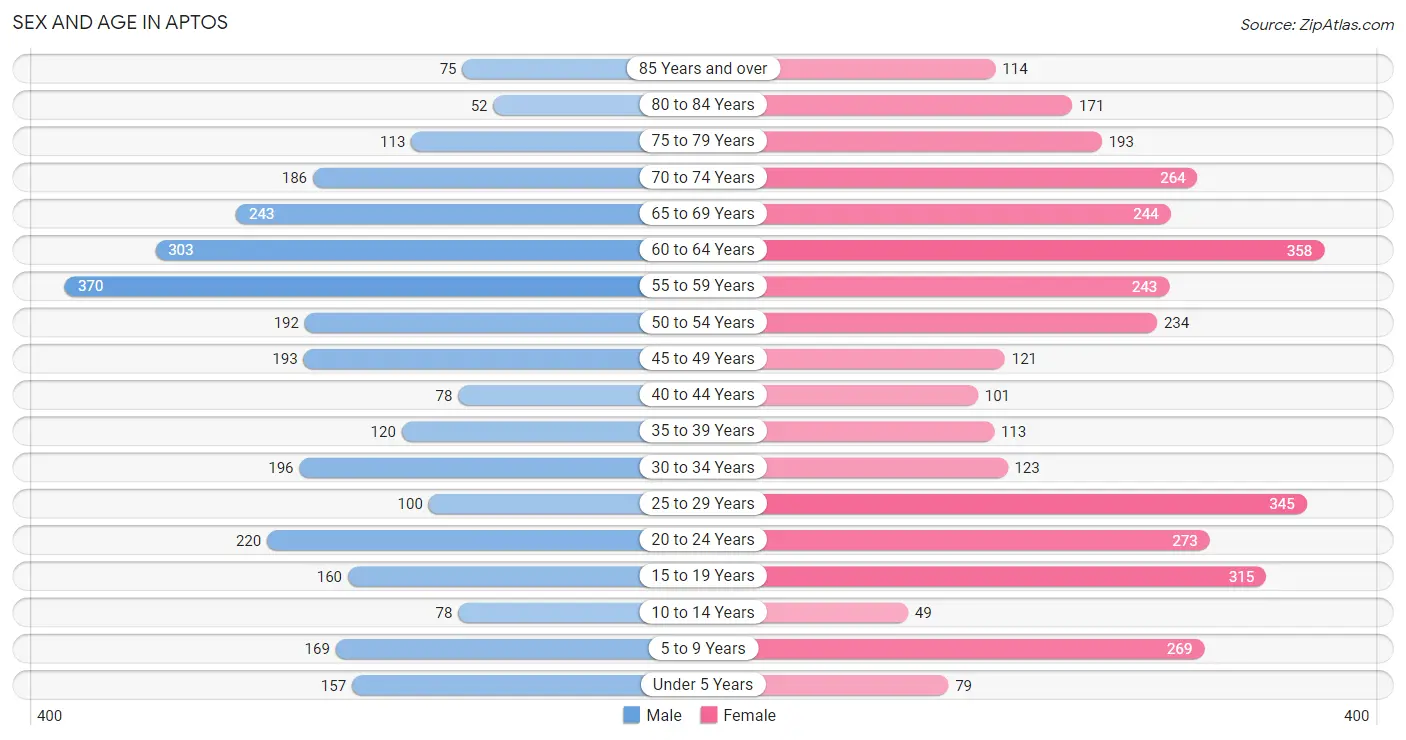
The most populous age groups in Aptos are 55 to 59 Years (370 | 12.3%) for men and 60 to 64 Years (358 | 9.9%) for women.
| Age Bracket | Male | Female |
| Under 5 Years | 157 (5.2%) | 79 (2.2%) |
| 5 to 9 Years | 169 (5.6%) | 269 (7.4%) |
| 10 to 14 Years | 78 (2.6%) | 49 (1.4%) |
| 15 to 19 Years | 160 (5.3%) | 315 (8.7%) |
| 20 to 24 Years | 220 (7.3%) | 273 (7.6%) |
| 25 to 29 Years | 100 (3.3%) | 345 (9.6%) |
| 30 to 34 Years | 196 (6.5%) | 123 (3.4%) |
| 35 to 39 Years | 120 (4.0%) | 113 (3.1%) |
| 40 to 44 Years | 78 (2.6%) | 101 (2.8%) |
| 45 to 49 Years | 193 (6.4%) | 121 (3.4%) |
| 50 to 54 Years | 192 (6.4%) | 234 (6.5%) |
| 55 to 59 Years | 370 (12.3%) | 243 (6.7%) |
| 60 to 64 Years | 303 (10.1%) | 358 (9.9%) |
| 65 to 69 Years | 243 (8.1%) | 244 (6.8%) |
| 70 to 74 Years | 186 (6.2%) | 264 (7.3%) |
| 75 to 79 Years | 113 (3.8%) | 193 (5.3%) |
| 80 to 84 Years | 52 (1.7%) | 171 (4.7%) |
| 85 Years and over | 75 (2.5%) | 114 (3.2%) |
| Total | 3,005 (100.0%) | 3,609 (100.0%) |
Families and Households in Aptos
Median Family Size in Aptos
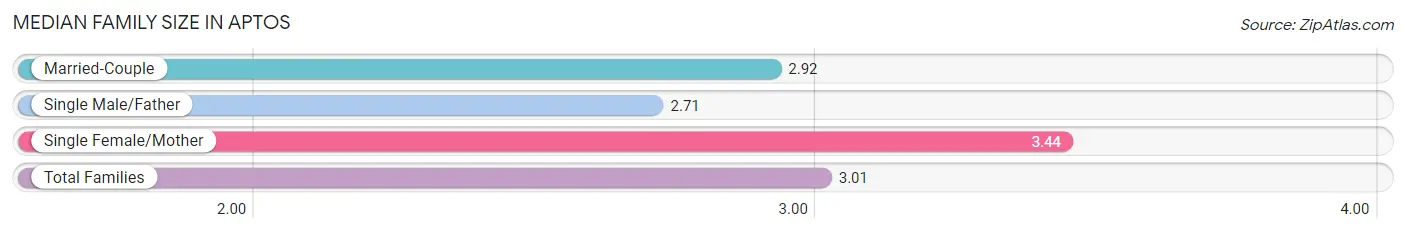
The median family size in Aptos is 3.01 persons per family, with single female/mother families (381 | 20.7%) accounting for the largest median family size of 3.44 persons per family. On the other hand, single male/father families (179 | 9.7%) represent the smallest median family size with 2.71 persons per family.
| Family Type | # Families | Family Size |
| Married-Couple | 1,278 (69.5%) | 2.92 |
| Single Male/Father | 179 (9.7%) | 2.71 |
| Single Female/Mother | 381 (20.7%) | 3.44 |
| Total Families | 1,838 (100.0%) | 3.01 |
Median Household Size in Aptos
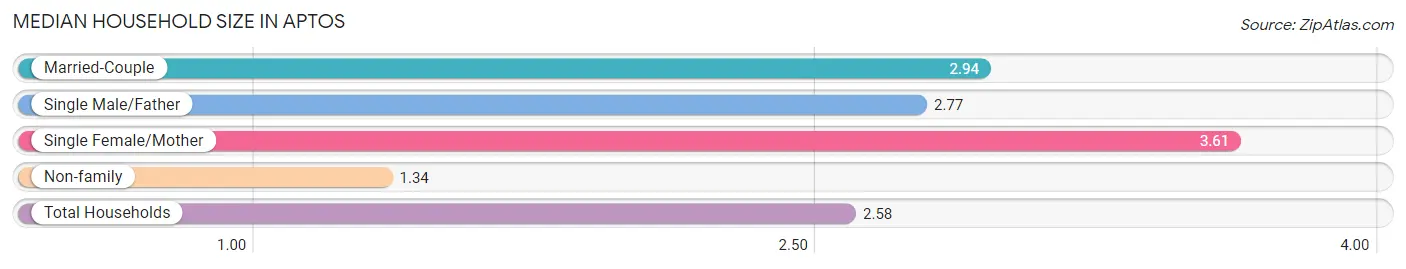
The median household size in Aptos is 2.58 persons per household, with single female/mother households (381 | 14.9%) accounting for the largest median household size of 3.61 persons per household. non-family households (722 | 28.2%) represent the smallest median household size with 1.34 persons per household.
| Household Type | # Households | Household Size |
| Married-Couple | 1,278 (49.9%) | 2.94 |
| Single Male/Father | 179 (7.0%) | 2.77 |
| Single Female/Mother | 381 (14.9%) | 3.61 |
| Non-family | 722 (28.2%) | 1.34 |
| Total Households | 2,560 (100.0%) | 2.58 |
Household Size by Marriage Status in Aptos
Out of a total of 2,560 households in Aptos, 1,838 (71.8%) are family households, while 722 (28.2%) are nonfamily households. The most numerous type of family households are 2-person households, comprising 1,002, and the most common type of nonfamily households are 1-person households, comprising 540.
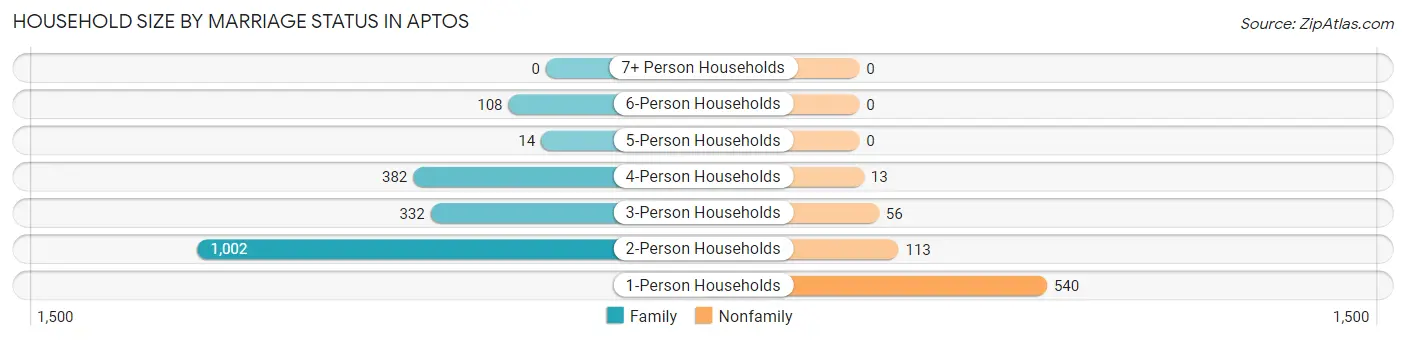
| Household Size | Family Households | Nonfamily Households |
| 1-Person Households | - | 540 (21.1%) |
| 2-Person Households | 1,002 (39.1%) | 113 (4.4%) |
| 3-Person Households | 332 (13.0%) | 56 (2.2%) |
| 4-Person Households | 382 (14.9%) | 13 (0.5%) |
| 5-Person Households | 14 (0.5%) | 0 (0.0%) |
| 6-Person Households | 108 (4.2%) | 0 (0.0%) |
| 7+ Person Households | 0 (0.0%) | 0 (0.0%) |
| Total | 1,838 (71.8%) | 722 (28.2%) |
Female Fertility in Aptos
Fertility by Age in Aptos
Average fertility rate in Aptos is 16.0 births per 1,000 women. Women in the age bracket of 20 to 34 years have the highest fertility rate with 31.0 births per 1,000 women. Women in the age bracket of 20 to 34 years acount for 100.0% of all women with births.
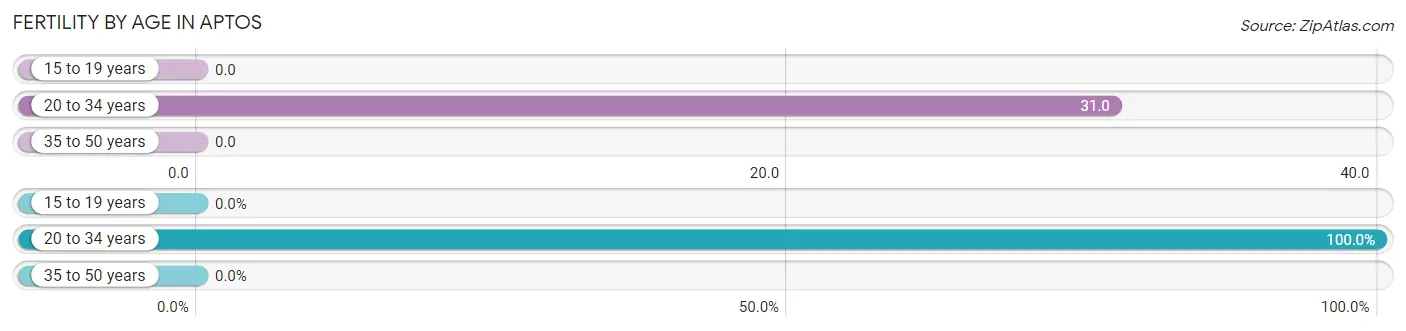
| Age Bracket | Women with Births | Births / 1,000 Women |
| 15 to 19 years | 0 (0.0%) | 0.0 |
| 20 to 34 years | 23 (100.0%) | 31.0 |
| 35 to 50 years | 0 (0.0%) | 0.0 |
| Total | 23 (100.0%) | 16.0 |
Fertility by Age by Marriage Status in Aptos
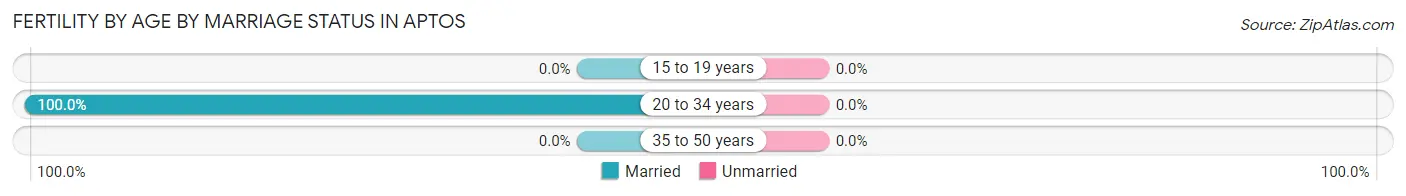
| Age Bracket | Married | Unmarried |
| 15 to 19 years | 0 (0.0%) | 0 (0.0%) |
| 20 to 34 years | 23 (100.0%) | 0 (0.0%) |
| 35 to 50 years | 0 (0.0%) | 0 (0.0%) |
| Total | 23 (100.0%) | 0 (0.0%) |
Fertility by Education in Aptos
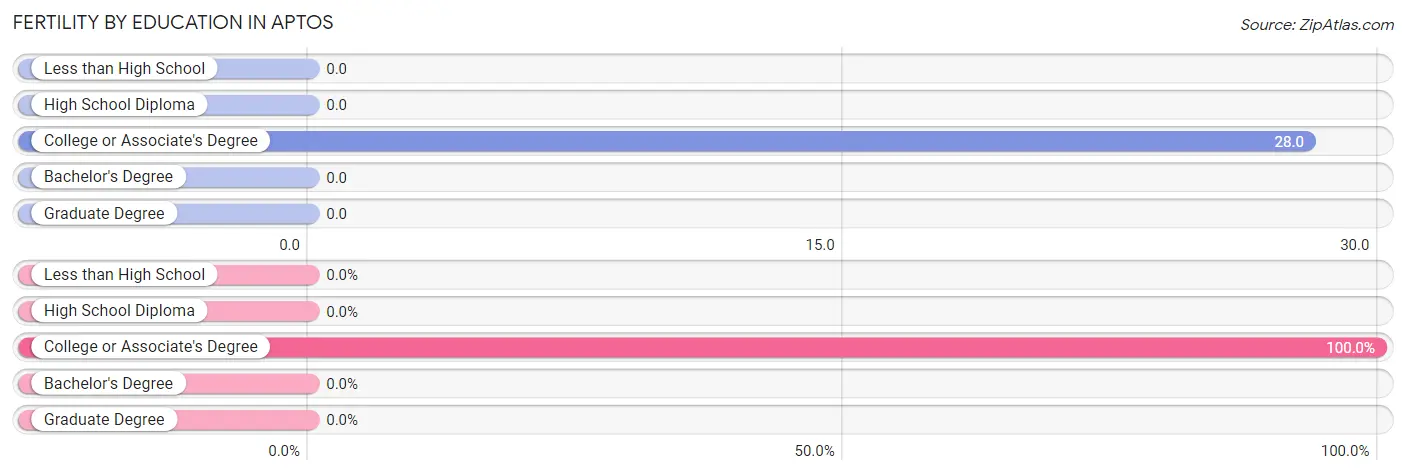
| Educational Attainment | Women with Births | Births / 1,000 Women |
| Less than High School | 0 (0.0%) | 0.0 |
| High School Diploma | 0 (0.0%) | 0.0 |
| College or Associate's Degree | 23 (100.0%) | 28.0 |
| Bachelor's Degree | 0 (0.0%) | 0.0 |
| Graduate Degree | 0 (0.0%) | 0.0 |
| Total | 23 (100.0%) | 16.0 |
Fertility by Education by Marriage Status in Aptos
| Educational Attainment | Married | Unmarried |
| Less than High School | 0 (0.0%) | 0 (0.0%) |
| High School Diploma | 0 (0.0%) | 0 (0.0%) |
| College or Associate's Degree | 23 (100.0%) | 0 (0.0%) |
| Bachelor's Degree | 0 (0.0%) | 0 (0.0%) |
| Graduate Degree | 0 (0.0%) | 0 (0.0%) |
| Total | 23 (100.0%) | 0 (0.0%) |
Employment Characteristics in Aptos
Employment by Class of Employer in Aptos
Among the 3,137 employed individuals in Aptos, private company employees (1,881 | 60.0%), not-for-profit organizations (398 | 12.7%), and self-employed (not incorporated) (322 | 10.3%) make up the most common classes of employment.
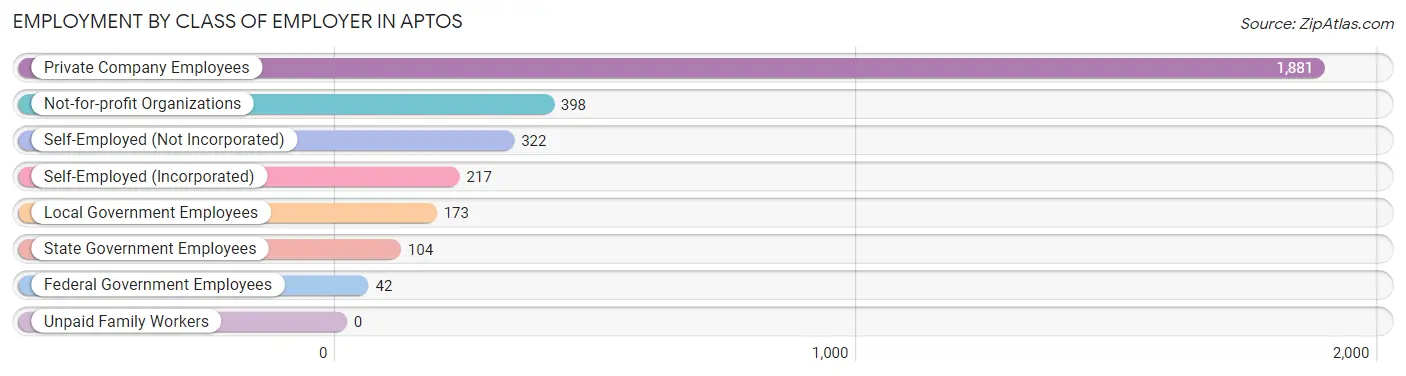
| Employer Class | # Employees | % Employees |
| Private Company Employees | 1,881 | 60.0% |
| Self-Employed (Incorporated) | 217 | 6.9% |
| Self-Employed (Not Incorporated) | 322 | 10.3% |
| Not-for-profit Organizations | 398 | 12.7% |
| Local Government Employees | 173 | 5.5% |
| State Government Employees | 104 | 3.3% |
| Federal Government Employees | 42 | 1.3% |
| Unpaid Family Workers | 0 | 0.0% |
| Total | 3,137 | 100.0% |
Employment Status by Age in Aptos
According to the labor force statistics for Aptos, out of the total population over 16 years of age (5,765), 59.1% or 3,407 individuals are in the labor force, with 5.5% or 187 of them unemployed. The age group with the highest labor force participation rate is 25 to 29 years, with 98.4% or 438 individuals in the labor force. Within the labor force, the 16 to 19 years age range has the highest percentage of unemployed individuals, with 17.2% or 10 of them being unemployed.
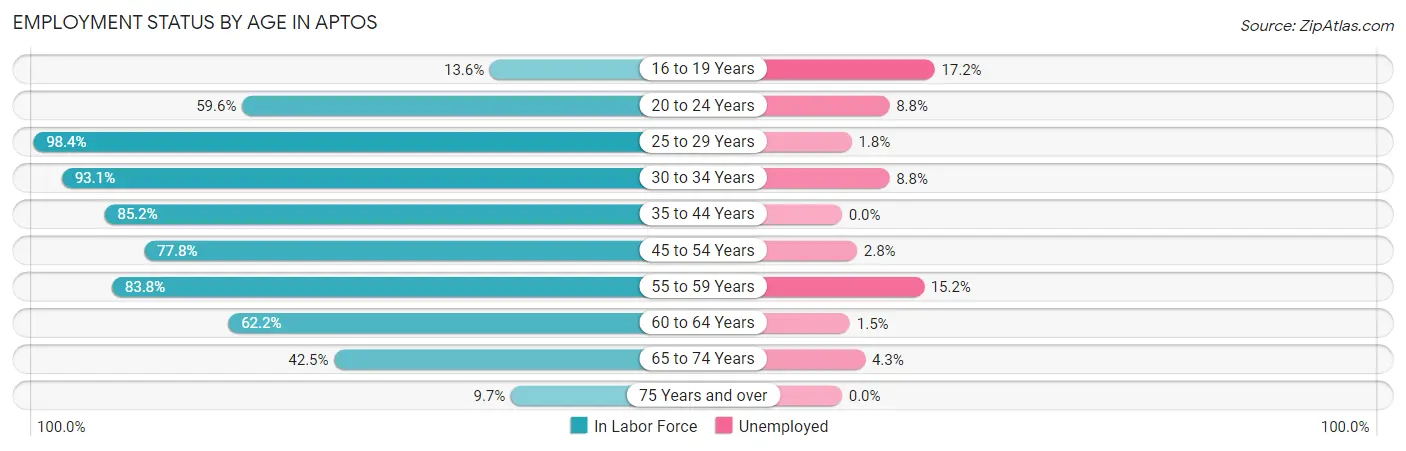
| Age Bracket | In Labor Force | Unemployed |
| 16 to 19 Years | 58 (13.6%) | 10 (17.2%) |
| 20 to 24 Years | 294 (59.6%) | 26 (8.8%) |
| 25 to 29 Years | 438 (98.4%) | 8 (1.8%) |
| 30 to 34 Years | 297 (93.1%) | 26 (8.8%) |
| 35 to 44 Years | 351 (85.2%) | 0 (0.0%) |
| 45 to 54 Years | 576 (77.8%) | 16 (2.8%) |
| 55 to 59 Years | 514 (83.8%) | 78 (15.2%) |
| 60 to 64 Years | 411 (62.2%) | 6 (1.5%) |
| 65 to 74 Years | 398 (42.5%) | 17 (4.3%) |
| 75 Years and over | 70 (9.7%) | 0 (0.0%) |
| Total | 3,407 (59.1%) | 187 (5.5%) |
Employment Status by Educational Attainment in Aptos
According to labor force statistics for Aptos, 81.1% of individuals (2,587) out of the total population between 25 and 64 years of age (3,190) are in the labor force, with 5.2% or 135 of them being unemployed. The group with the highest labor force participation rate are those with the educational attainment of college / associate degree, with 85.1% or 940 individuals in the labor force. Within the labor force, individuals with college / associate degree education have the highest percentage of unemployment, with 8.3% or 78 of them being unemployed.
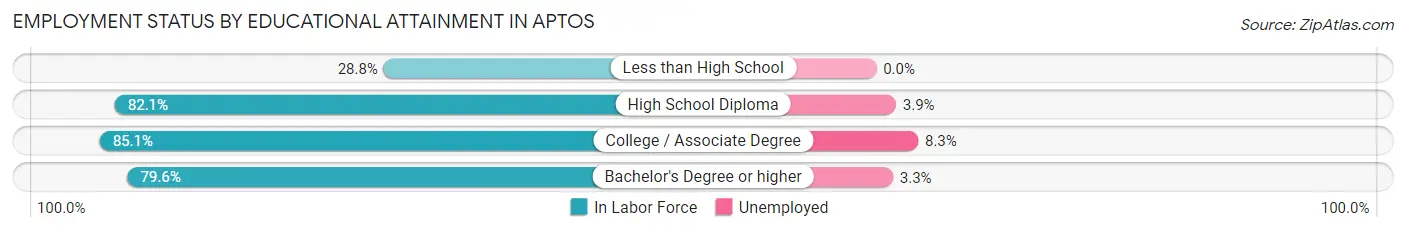
| Educational Attainment | In Labor Force | Unemployed |
| Less than High School | 15 (28.8%) | 0 (0.0%) |
| High School Diploma | 414 (82.1%) | 20 (3.9%) |
| College / Associate Degree | 940 (85.1%) | 92 (8.3%) |
| Bachelor's Degree or higher | 1,218 (79.6%) | 50 (3.3%) |
| Total | 2,587 (81.1%) | 166 (5.2%) |
Employment Occupations by Sex in Aptos
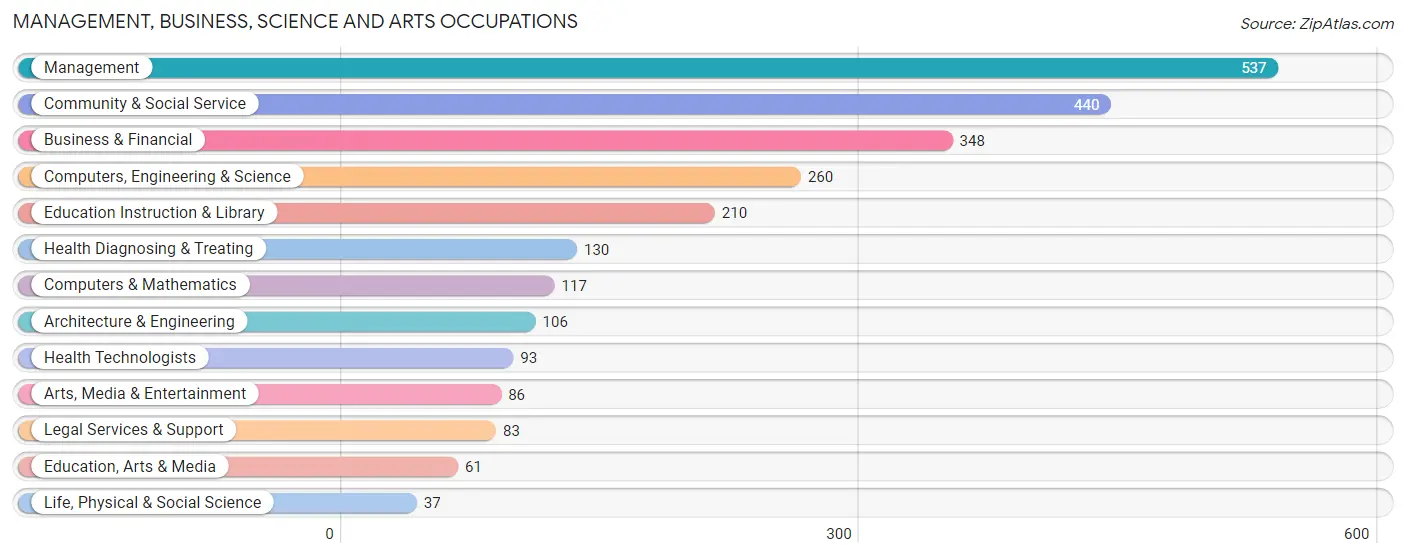
Management, Business, Science and Arts Occupations
The most common Management, Business, Science and Arts occupations in Aptos are Management (537 | 16.7%), Community & Social Service (440 | 13.7%), Business & Financial (348 | 10.8%), Computers, Engineering & Science (260 | 8.1%), and Education Instruction & Library (210 | 6.5%).
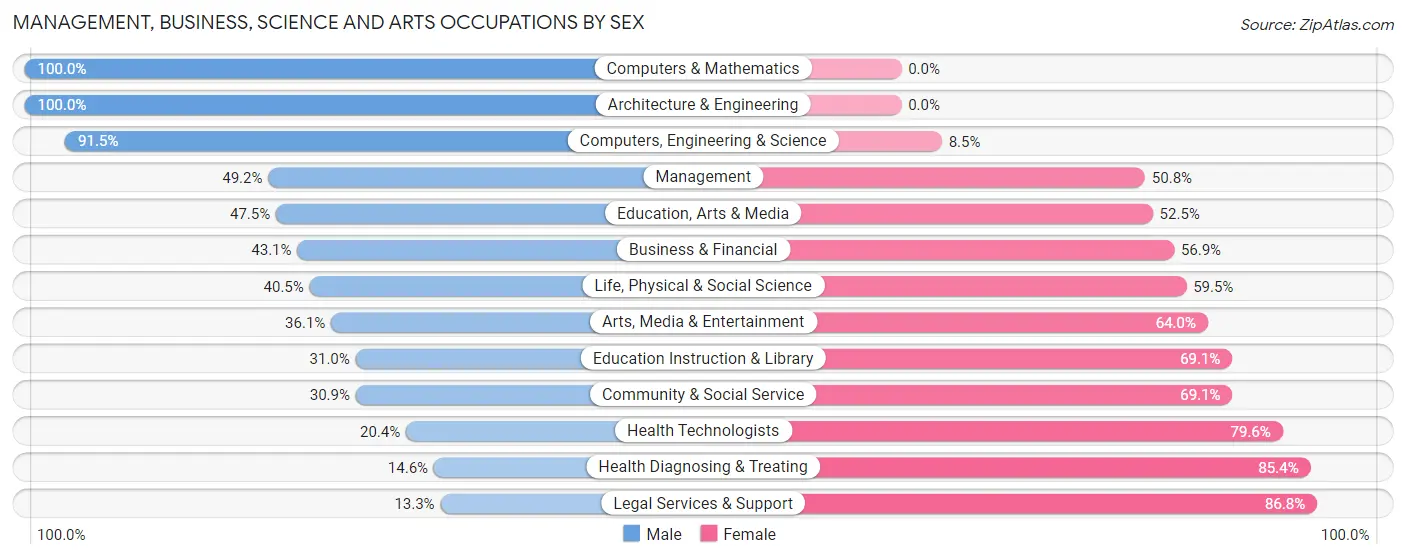
Management, Business, Science and Arts Occupations by Sex
Within the Management, Business, Science and Arts occupations in Aptos, the most male-oriented occupations are Computers & Mathematics (100.0%), Architecture & Engineering (100.0%), and Computers, Engineering & Science (91.5%), while the most female-oriented occupations are Legal Services & Support (86.8%), Health Diagnosing & Treating (85.4%), and Health Technologists (79.6%).
| Occupation | Male | Female |
| Management | 264 (49.2%) | 273 (50.8%) |
| Business & Financial | 150 (43.1%) | 198 (56.9%) |
| Computers, Engineering & Science | 238 (91.5%) | 22 (8.5%) |
| Computers & Mathematics | 117 (100.0%) | 0 (0.0%) |
| Architecture & Engineering | 106 (100.0%) | 0 (0.0%) |
| Life, Physical & Social Science | 15 (40.5%) | 22 (59.5%) |
| Community & Social Service | 136 (30.9%) | 304 (69.1%) |
| Education, Arts & Media | 29 (47.5%) | 32 (52.5%) |
| Legal Services & Support | 11 (13.3%) | 72 (86.8%) |
| Education Instruction & Library | 65 (30.9%) | 145 (69.1%) |
| Arts, Media & Entertainment | 31 (36.0%) | 55 (63.9%) |
| Health Diagnosing & Treating | 19 (14.6%) | 111 (85.4%) |
| Health Technologists | 19 (20.4%) | 74 (79.6%) |
| Total (Category) | 807 (47.1%) | 908 (52.9%) |
| Total (Overall) | 1,653 (51.3%) | 1,567 (48.7%) |
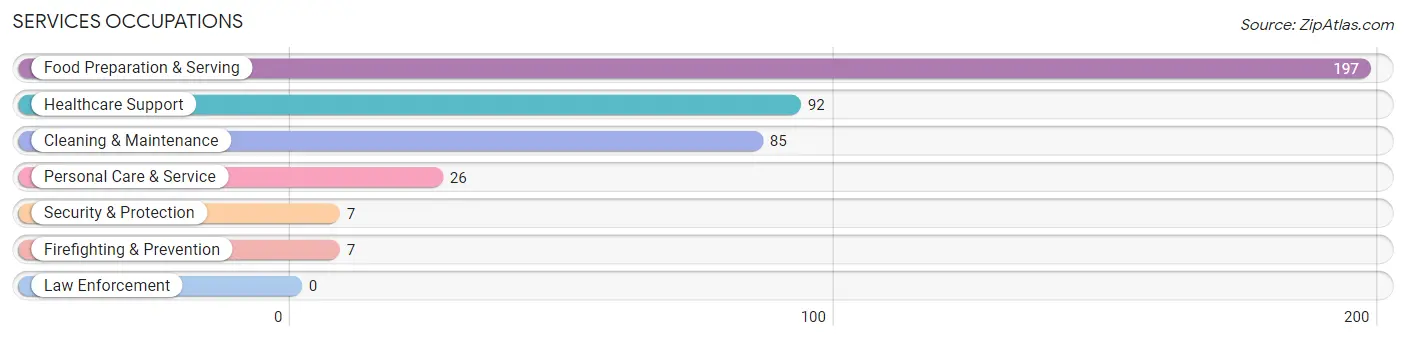
Services Occupations
The most common Services occupations in Aptos are Food Preparation & Serving (197 | 6.1%), Healthcare Support (92 | 2.9%), Cleaning & Maintenance (85 | 2.6%), Personal Care & Service (26 | 0.8%), and Security & Protection (7 | 0.2%).
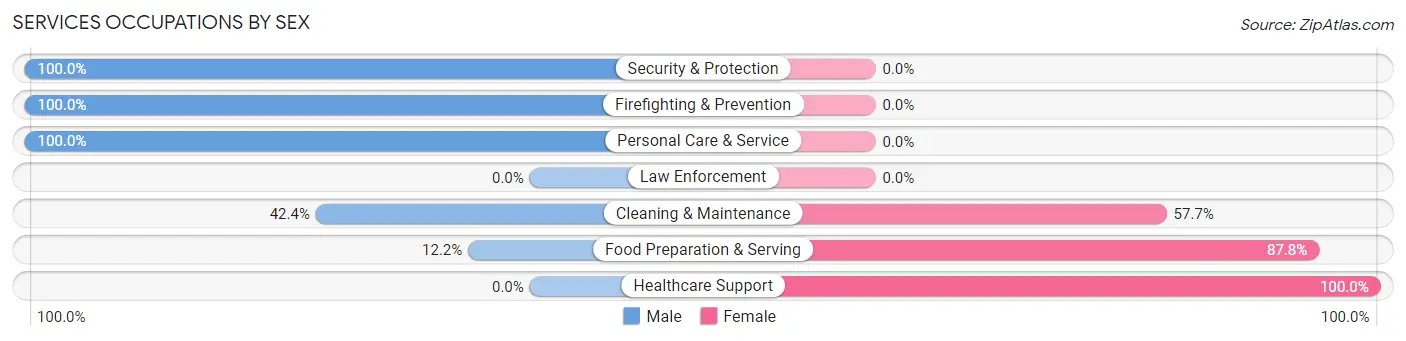
Services Occupations by Sex
Within the Services occupations in Aptos, the most male-oriented occupations are Security & Protection (100.0%), Firefighting & Prevention (100.0%), and Personal Care & Service (100.0%), while the most female-oriented occupations are Healthcare Support (100.0%), Food Preparation & Serving (87.8%), and Cleaning & Maintenance (57.7%).
| Occupation | Male | Female |
| Healthcare Support | 0 (0.0%) | 92 (100.0%) |
| Security & Protection | 7 (100.0%) | 0 (0.0%) |
| Firefighting & Prevention | 7 (100.0%) | 0 (0.0%) |
| Law Enforcement | 0 (0.0%) | 0 (0.0%) |
| Food Preparation & Serving | 24 (12.2%) | 173 (87.8%) |
| Cleaning & Maintenance | 36 (42.3%) | 49 (57.7%) |
| Personal Care & Service | 26 (100.0%) | 0 (0.0%) |
| Total (Category) | 93 (22.9%) | 314 (77.1%) |
| Total (Overall) | 1,653 (51.3%) | 1,567 (48.7%) |
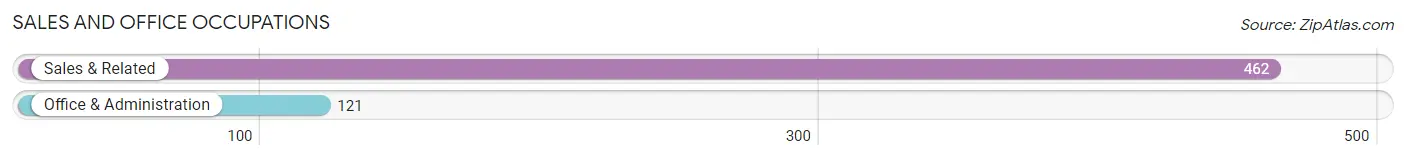
Sales and Office Occupations
The most common Sales and Office occupations in Aptos are Sales & Related (462 | 14.3%), and Office & Administration (121 | 3.8%).
Sales and Office Occupations by Sex
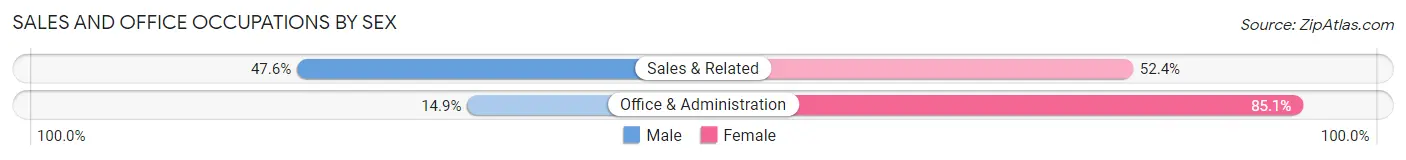
| Occupation | Male | Female |
| Sales & Related | 220 (47.6%) | 242 (52.4%) |
| Office & Administration | 18 (14.9%) | 103 (85.1%) |
| Total (Category) | 238 (40.8%) | 345 (59.2%) |
| Total (Overall) | 1,653 (51.3%) | 1,567 (48.7%) |
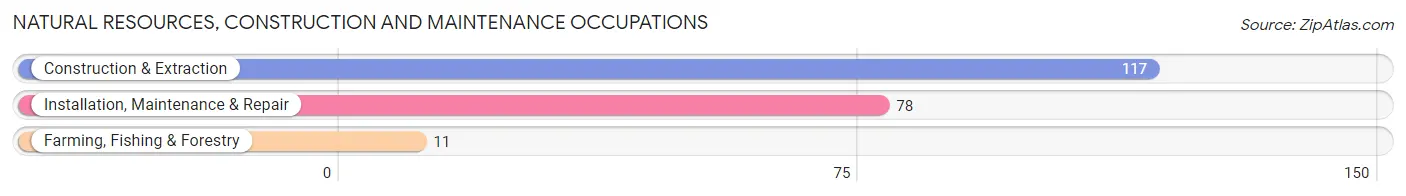
Natural Resources, Construction and Maintenance Occupations
The most common Natural Resources, Construction and Maintenance occupations in Aptos are Construction & Extraction (117 | 3.6%), Installation, Maintenance & Repair (78 | 2.4%), and Farming, Fishing & Forestry (11 | 0.3%).
Natural Resources, Construction and Maintenance Occupations by Sex
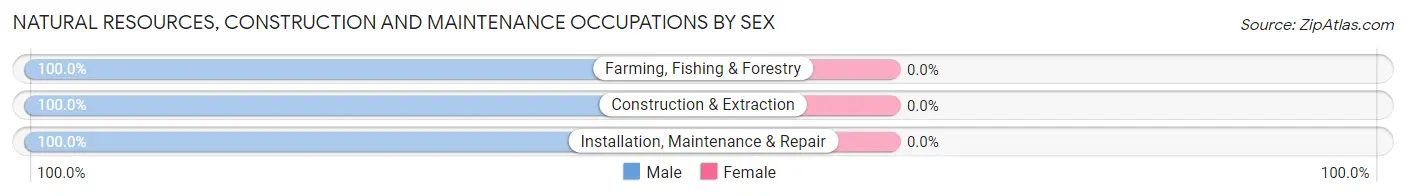
| Occupation | Male | Female |
| Farming, Fishing & Forestry | 11 (100.0%) | 0 (0.0%) |
| Construction & Extraction | 117 (100.0%) | 0 (0.0%) |
| Installation, Maintenance & Repair | 78 (100.0%) | 0 (0.0%) |
| Total (Category) | 206 (100.0%) | 0 (0.0%) |
| Total (Overall) | 1,653 (51.3%) | 1,567 (48.7%) |
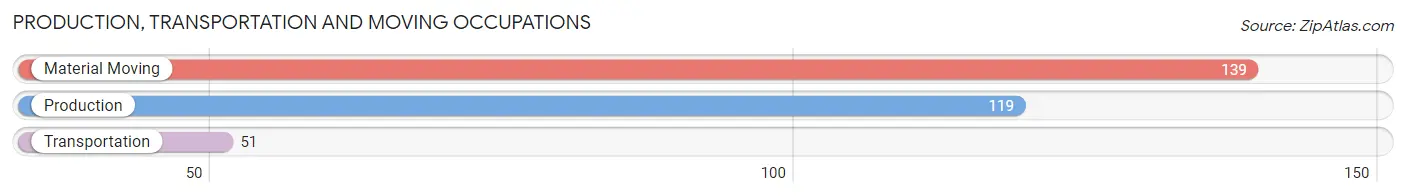
Production, Transportation and Moving Occupations
The most common Production, Transportation and Moving occupations in Aptos are Material Moving (139 | 4.3%), Production (119 | 3.7%), and Transportation (51 | 1.6%).
Production, Transportation and Moving Occupations by Sex
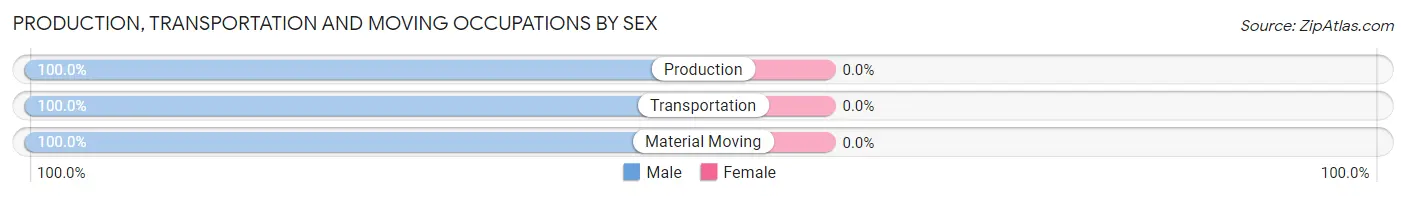
| Occupation | Male | Female |
| Production | 119 (100.0%) | 0 (0.0%) |
| Transportation | 51 (100.0%) | 0 (0.0%) |
| Material Moving | 139 (100.0%) | 0 (0.0%) |
| Total (Category) | 309 (100.0%) | 0 (0.0%) |
| Total (Overall) | 1,653 (51.3%) | 1,567 (48.7%) |
Employment Industries by Sex in Aptos
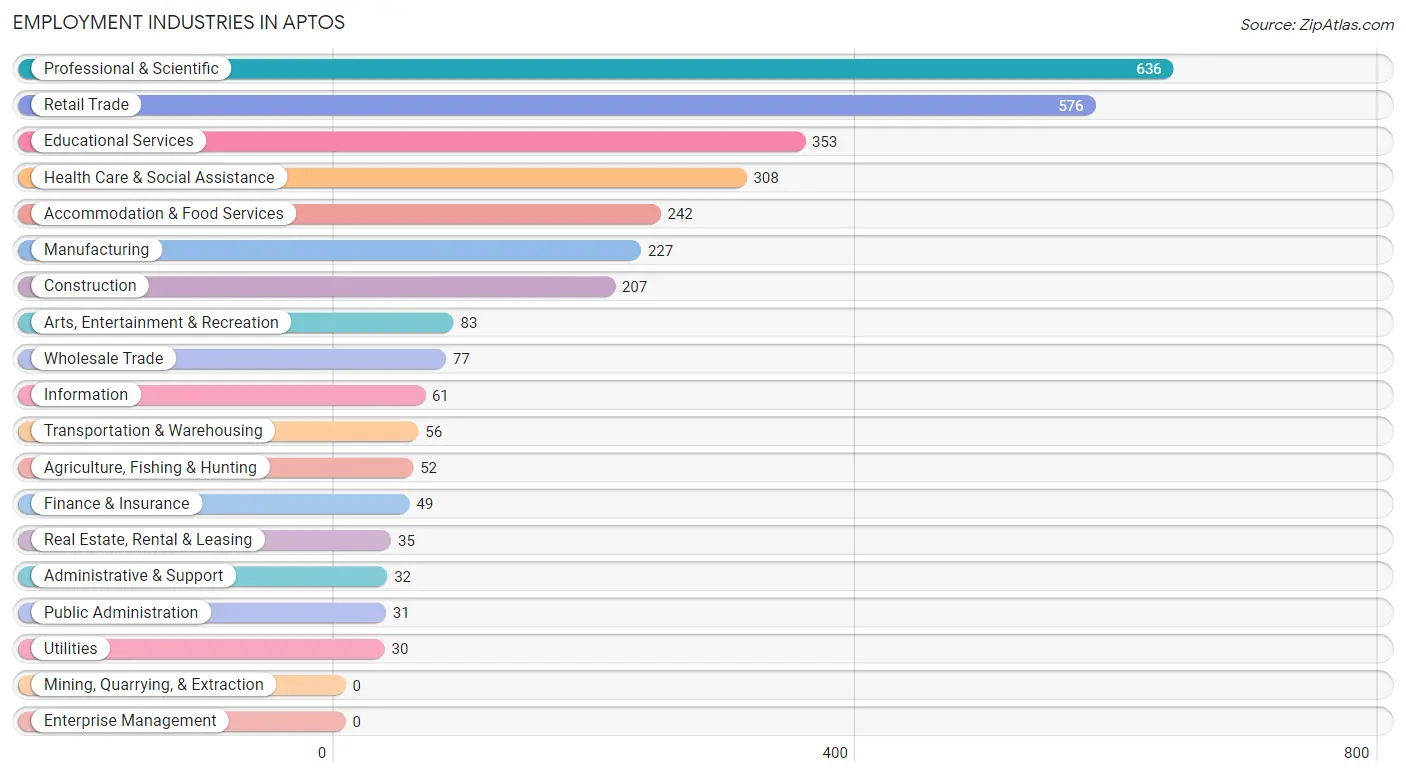
Employment Industries in Aptos
The major employment industries in Aptos include Professional & Scientific (636 | 19.8%), Retail Trade (576 | 17.9%), Educational Services (353 | 11.0%), Health Care & Social Assistance (308 | 9.6%), and Accommodation & Food Services (242 | 7.5%).
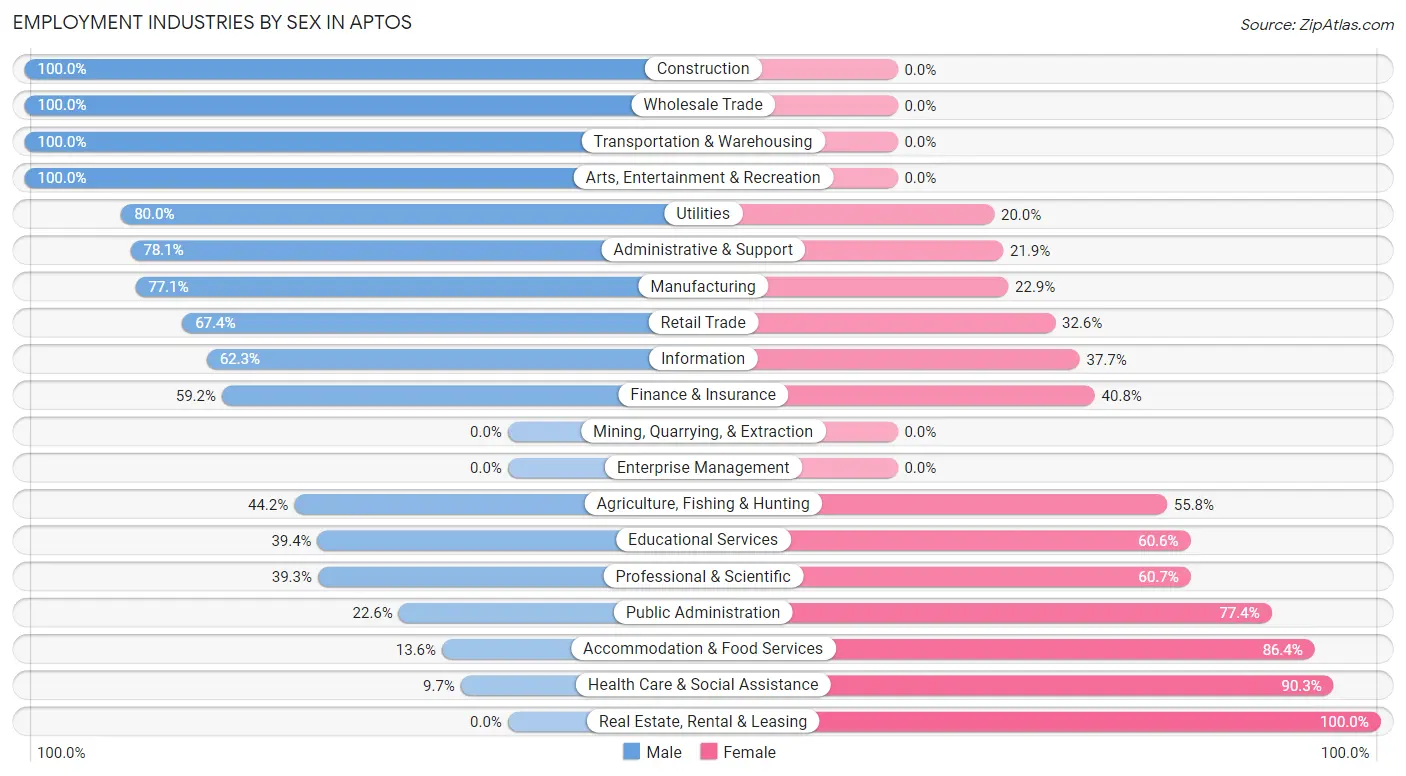
Employment Industries by Sex in Aptos
The Aptos industries that see more men than women are Construction (100.0%), Wholesale Trade (100.0%), and Transportation & Warehousing (100.0%), whereas the industries that tend to have a higher number of women are Real Estate, Rental & Leasing (100.0%), Health Care & Social Assistance (90.3%), and Accommodation & Food Services (86.4%).
| Industry | Male | Female |
| Agriculture, Fishing & Hunting | 23 (44.2%) | 29 (55.8%) |
| Mining, Quarrying, & Extraction | 0 (0.0%) | 0 (0.0%) |
| Construction | 207 (100.0%) | 0 (0.0%) |
| Manufacturing | 175 (77.1%) | 52 (22.9%) |
| Wholesale Trade | 77 (100.0%) | 0 (0.0%) |
| Retail Trade | 388 (67.4%) | 188 (32.6%) |
| Transportation & Warehousing | 56 (100.0%) | 0 (0.0%) |
| Utilities | 24 (80.0%) | 6 (20.0%) |
| Information | 38 (62.3%) | 23 (37.7%) |
| Finance & Insurance | 29 (59.2%) | 20 (40.8%) |
| Real Estate, Rental & Leasing | 0 (0.0%) | 35 (100.0%) |
| Professional & Scientific | 250 (39.3%) | 386 (60.7%) |
| Enterprise Management | 0 (0.0%) | 0 (0.0%) |
| Administrative & Support | 25 (78.1%) | 7 (21.9%) |
| Educational Services | 139 (39.4%) | 214 (60.6%) |
| Health Care & Social Assistance | 30 (9.7%) | 278 (90.3%) |
| Arts, Entertainment & Recreation | 83 (100.0%) | 0 (0.0%) |
| Accommodation & Food Services | 33 (13.6%) | 209 (86.4%) |
| Public Administration | 7 (22.6%) | 24 (77.4%) |
| Total | 1,653 (51.3%) | 1,567 (48.7%) |
Education in Aptos
School Enrollment in Aptos
The most common levels of schooling among the 1,666 students in Aptos are college / undergraduate (675 | 40.5%), elementary school (386 | 23.2%), and high school (340 | 20.4%).
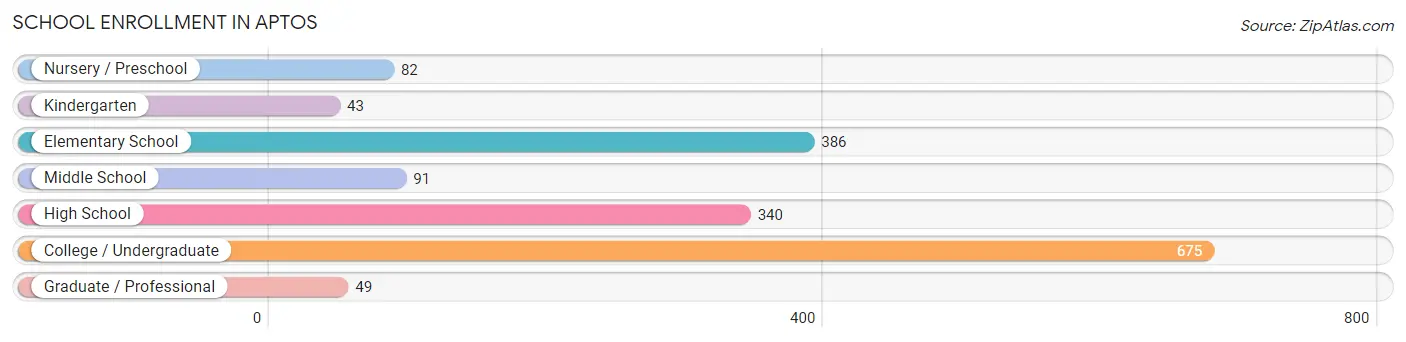
| School Level | # Students | % Students |
| Nursery / Preschool | 82 | 4.9% |
| Kindergarten | 43 | 2.6% |
| Elementary School | 386 | 23.2% |
| Middle School | 91 | 5.5% |
| High School | 340 | 20.4% |
| College / Undergraduate | 675 | 40.5% |
| Graduate / Professional | 49 | 2.9% |
| Total | 1,666 | 100.0% |
School Enrollment by Age by Funding Source in Aptos
Out of a total of 1,666 students who are enrolled in schools in Aptos, 440 (26.4%) attend a private institution, while the remaining 1,226 (73.6%) are enrolled in public schools. The age group of 3 to 4 year olds has the highest likelihood of being enrolled in private schools, with 61 (83.6% in the age bracket) enrolled. Conversely, the age group of 18 to 19 year olds has the lowest likelihood of being enrolled in a private school, with 355 (100.0% in the age bracket) attending a public institution.
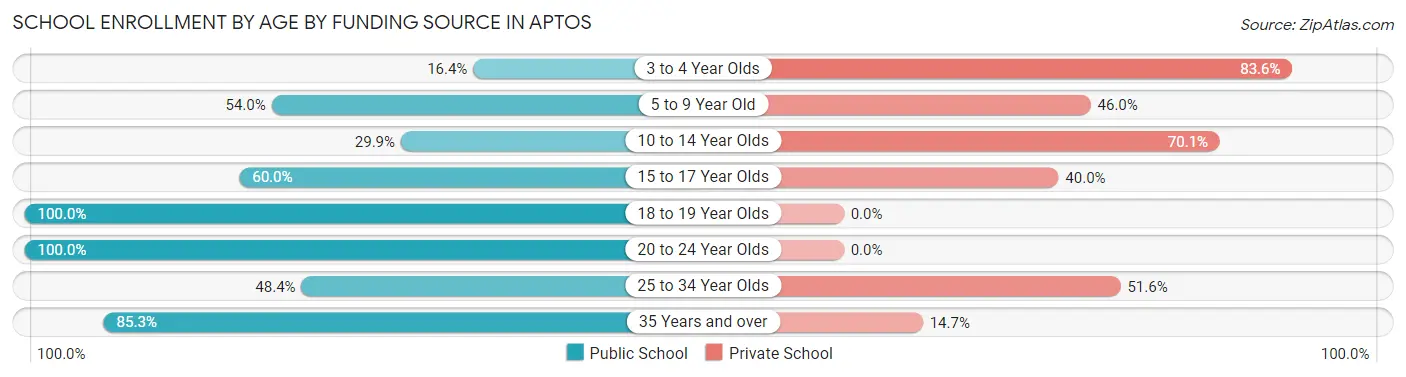
| Age Bracket | Public School | Private School |
| 3 to 4 Year Olds | 12 (16.4%) | 61 (83.6%) |
| 5 to 9 Year Old | 223 (54.0%) | 190 (46.0%) |
| 10 to 14 Year Olds | 38 (29.9%) | 89 (70.1%) |
| 15 to 17 Year Olds | 72 (60.0%) | 48 (40.0%) |
| 18 to 19 Year Olds | 355 (100.0%) | 0 (0.0%) |
| 20 to 24 Year Olds | 385 (100.0%) | 0 (0.0%) |
| 25 to 34 Year Olds | 31 (48.4%) | 33 (51.6%) |
| 35 Years and over | 110 (85.3%) | 19 (14.7%) |
| Total | 1,226 (73.6%) | 440 (26.4%) |
Educational Attainment by Field of Study in Aptos
Social sciences (415 | 15.3%), bio, nature & agricultural (290 | 10.7%), business (265 | 9.8%), visual & performing arts (249 | 9.2%), and liberal arts & history (244 | 9.0%) are the most common fields of study among 2,710 individuals in Aptos who have obtained a bachelor's degree or higher.
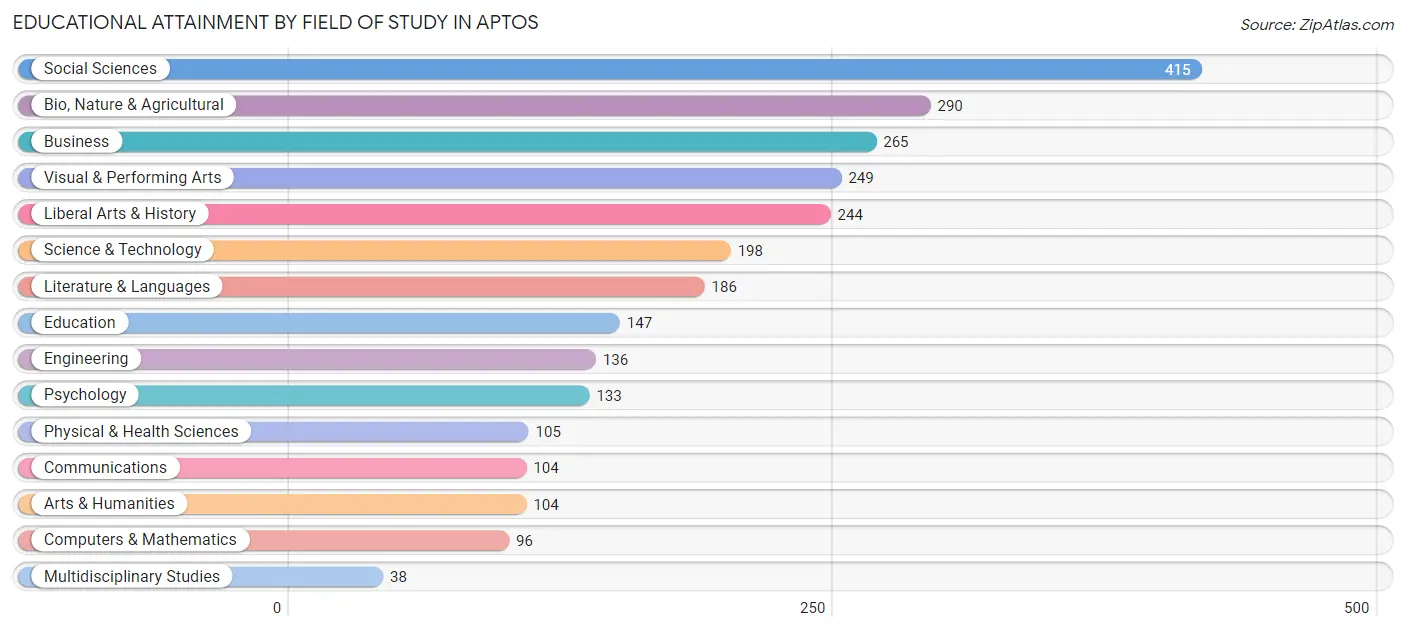
| Field of Study | # Graduates | % Graduates |
| Computers & Mathematics | 96 | 3.5% |
| Bio, Nature & Agricultural | 290 | 10.7% |
| Physical & Health Sciences | 105 | 3.9% |
| Psychology | 133 | 4.9% |
| Social Sciences | 415 | 15.3% |
| Engineering | 136 | 5.0% |
| Multidisciplinary Studies | 38 | 1.4% |
| Science & Technology | 198 | 7.3% |
| Business | 265 | 9.8% |
| Education | 147 | 5.4% |
| Literature & Languages | 186 | 6.9% |
| Liberal Arts & History | 244 | 9.0% |
| Visual & Performing Arts | 249 | 9.2% |
| Communications | 104 | 3.8% |
| Arts & Humanities | 104 | 3.8% |
| Total | 2,710 | 100.0% |
Transportation & Commute in Aptos
Vehicle Availability by Sex in Aptos
The most prevalent vehicle ownership categories in Aptos are males with 2 vehicles (655, accounting for 40.6%) and females with 2 vehicles (597, making up 43.5%).
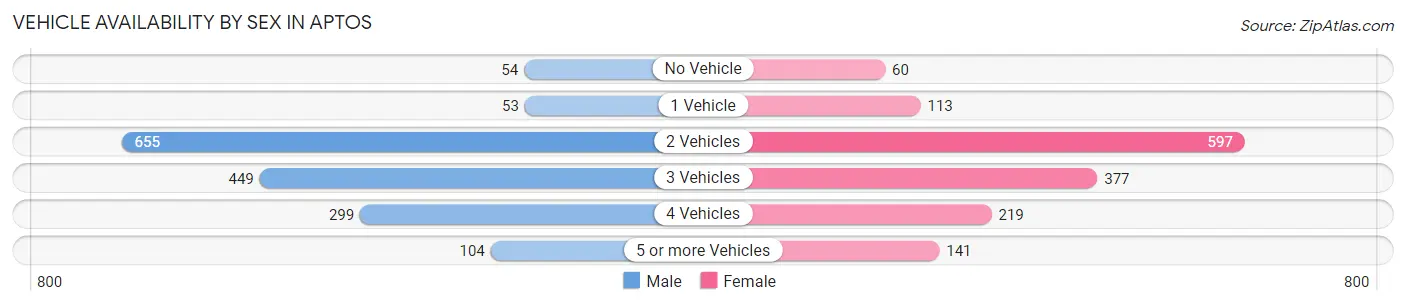
| Vehicles Available | Male | Female |
| No Vehicle | 54 (3.4%) | 60 (4.0%) |
| 1 Vehicle | 53 (3.3%) | 113 (7.5%) |
| 2 Vehicles | 655 (40.6%) | 597 (39.6%) |
| 3 Vehicles | 449 (27.8%) | 377 (25.0%) |
| 4 Vehicles | 299 (18.5%) | 219 (14.5%) |
| 5 or more Vehicles | 104 (6.4%) | 141 (9.4%) |
| Total | 1,614 (100.0%) | 1,507 (100.0%) |
Commute Time in Aptos
The most frequently occuring commute durations in Aptos are 30 to 34 minutes (456 commuters, 17.5%), 20 to 24 minutes (397 commuters, 15.2%), and 5 to 9 minutes (373 commuters, 14.3%).
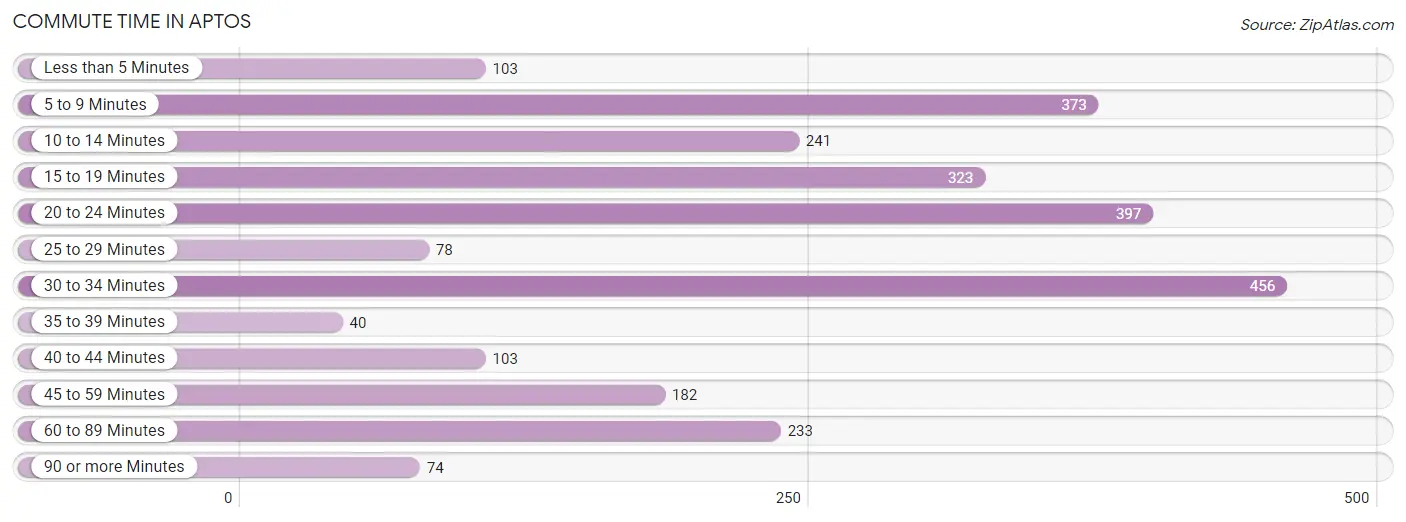
| Commute Time | # Commuters | % Commuters |
| Less than 5 Minutes | 103 | 4.0% |
| 5 to 9 Minutes | 373 | 14.3% |
| 10 to 14 Minutes | 241 | 9.3% |
| 15 to 19 Minutes | 323 | 12.4% |
| 20 to 24 Minutes | 397 | 15.2% |
| 25 to 29 Minutes | 78 | 3.0% |
| 30 to 34 Minutes | 456 | 17.5% |
| 35 to 39 Minutes | 40 | 1.5% |
| 40 to 44 Minutes | 103 | 4.0% |
| 45 to 59 Minutes | 182 | 7.0% |
| 60 to 89 Minutes | 233 | 8.9% |
| 90 or more Minutes | 74 | 2.8% |
Commute Time by Sex in Aptos
The most common commute times in Aptos are 20 to 24 minutes (265 commuters, 19.7%) for males and 5 to 9 minutes (283 commuters, 22.5%) for females.
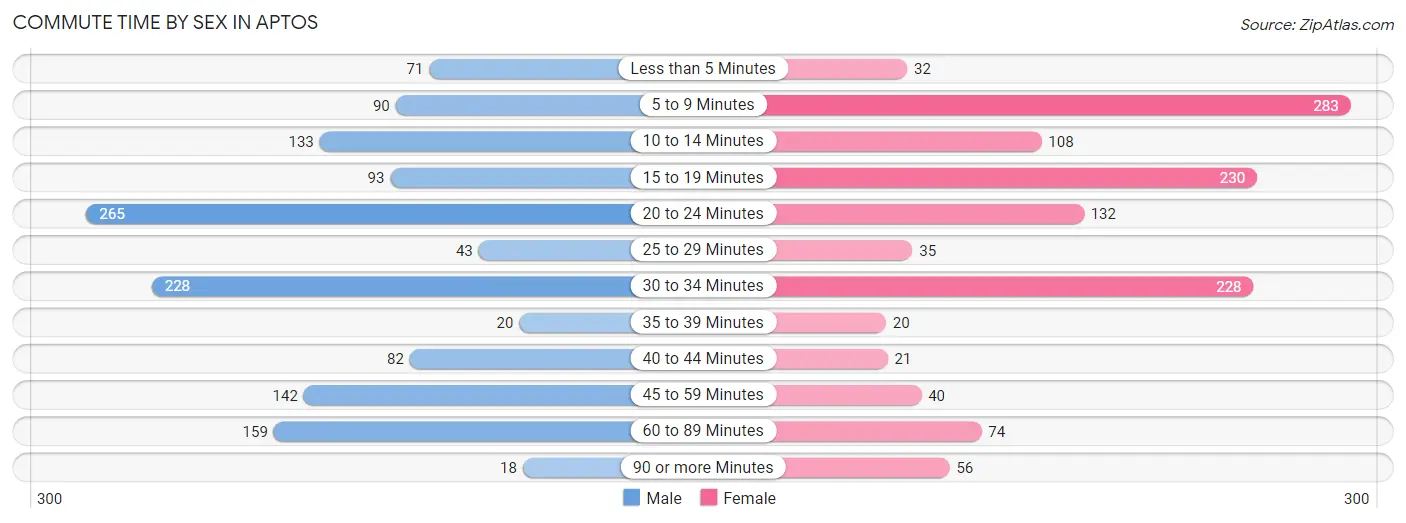
| Commute Time | Male | Female |
| Less than 5 Minutes | 71 (5.3%) | 32 (2.5%) |
| 5 to 9 Minutes | 90 (6.7%) | 283 (22.5%) |
| 10 to 14 Minutes | 133 (9.9%) | 108 (8.6%) |
| 15 to 19 Minutes | 93 (6.9%) | 230 (18.3%) |
| 20 to 24 Minutes | 265 (19.7%) | 132 (10.5%) |
| 25 to 29 Minutes | 43 (3.2%) | 35 (2.8%) |
| 30 to 34 Minutes | 228 (17.0%) | 228 (18.1%) |
| 35 to 39 Minutes | 20 (1.5%) | 20 (1.6%) |
| 40 to 44 Minutes | 82 (6.1%) | 21 (1.7%) |
| 45 to 59 Minutes | 142 (10.6%) | 40 (3.2%) |
| 60 to 89 Minutes | 159 (11.8%) | 74 (5.9%) |
| 90 or more Minutes | 18 (1.3%) | 56 (4.4%) |
Time of Departure to Work by Sex in Aptos
The most frequent times of departure to work in Aptos are 7:00 AM to 7:29 AM (302, 22.5%) for males and 7:30 AM to 7:59 AM (286, 22.7%) for females.
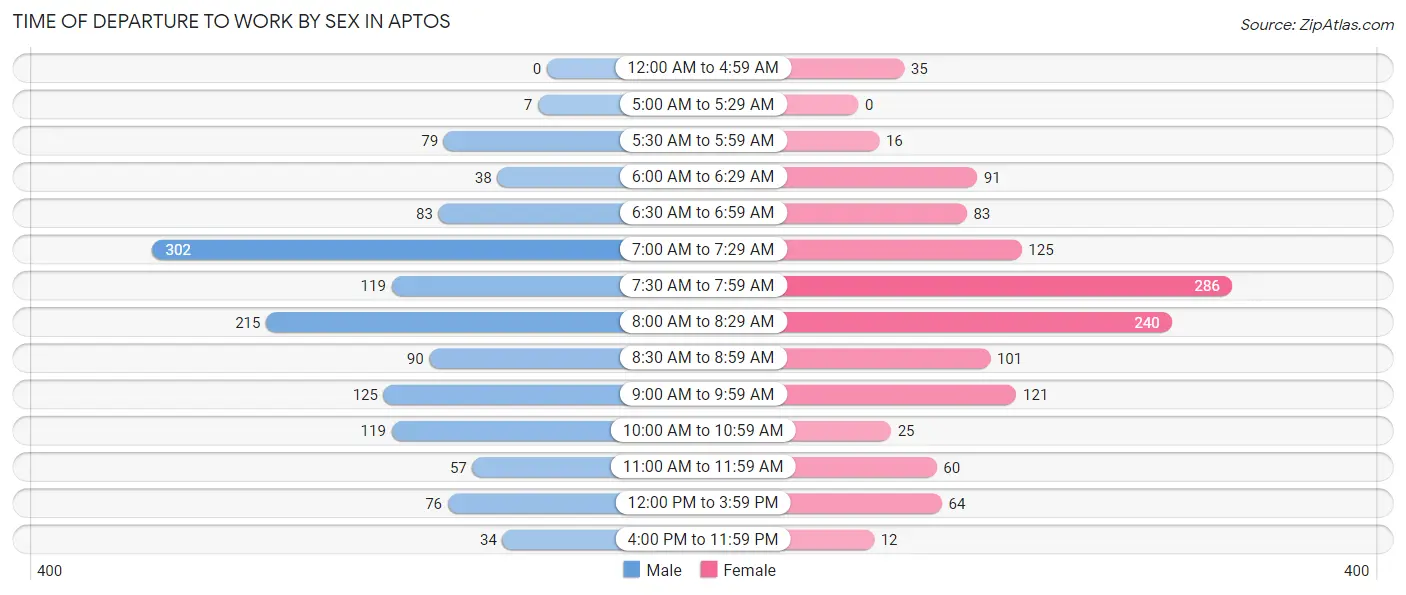
| Time of Departure | Male | Female |
| 12:00 AM to 4:59 AM | 0 (0.0%) | 35 (2.8%) |
| 5:00 AM to 5:29 AM | 7 (0.5%) | 0 (0.0%) |
| 5:30 AM to 5:59 AM | 79 (5.9%) | 16 (1.3%) |
| 6:00 AM to 6:29 AM | 38 (2.8%) | 91 (7.2%) |
| 6:30 AM to 6:59 AM | 83 (6.2%) | 83 (6.6%) |
| 7:00 AM to 7:29 AM | 302 (22.5%) | 125 (9.9%) |
| 7:30 AM to 7:59 AM | 119 (8.8%) | 286 (22.7%) |
| 8:00 AM to 8:29 AM | 215 (16.0%) | 240 (19.1%) |
| 8:30 AM to 8:59 AM | 90 (6.7%) | 101 (8.0%) |
| 9:00 AM to 9:59 AM | 125 (9.3%) | 121 (9.6%) |
| 10:00 AM to 10:59 AM | 119 (8.8%) | 25 (2.0%) |
| 11:00 AM to 11:59 AM | 57 (4.2%) | 60 (4.8%) |
| 12:00 PM to 3:59 PM | 76 (5.7%) | 64 (5.1%) |
| 4:00 PM to 11:59 PM | 34 (2.5%) | 12 (0.9%) |
| Total | 1,344 (100.0%) | 1,259 (100.0%) |
Housing Occupancy in Aptos
Occupancy by Ownership in Aptos
Of the total 2,560 dwellings in Aptos, owner-occupied units account for 1,867 (72.9%), while renter-occupied units make up 693 (27.1%).
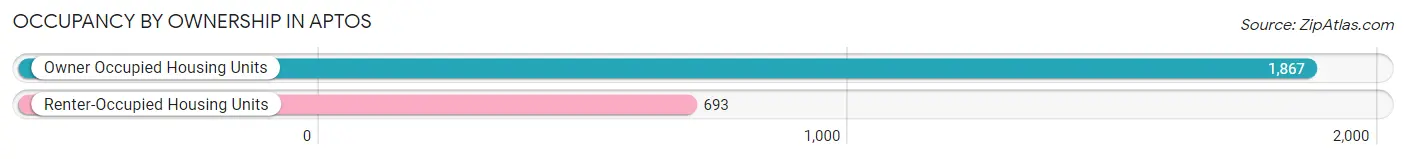
| Occupancy | # Housing Units | % Housing Units |
| Owner Occupied Housing Units | 1,867 | 72.9% |
| Renter-Occupied Housing Units | 693 | 27.1% |
| Total Occupied Housing Units | 2,560 | 100.0% |
Occupancy by Household Size in Aptos
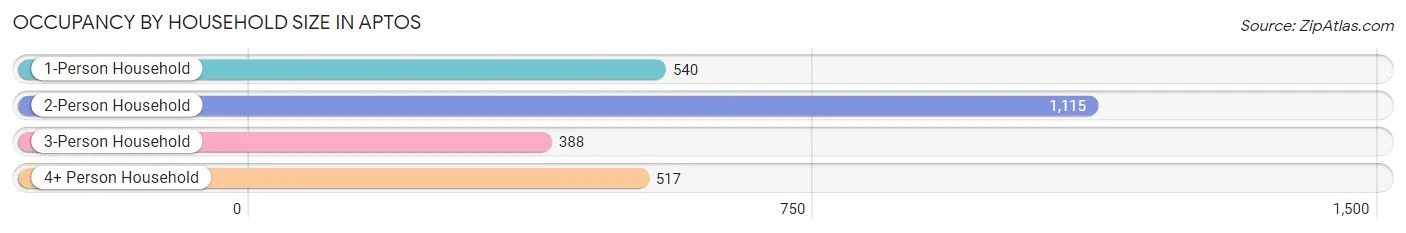
| Household Size | # Housing Units | % Housing Units |
| 1-Person Household | 540 | 21.1% |
| 2-Person Household | 1,115 | 43.5% |
| 3-Person Household | 388 | 15.2% |
| 4+ Person Household | 517 | 20.2% |
| Total Housing Units | 2,560 | 100.0% |
Occupancy by Ownership by Household Size in Aptos
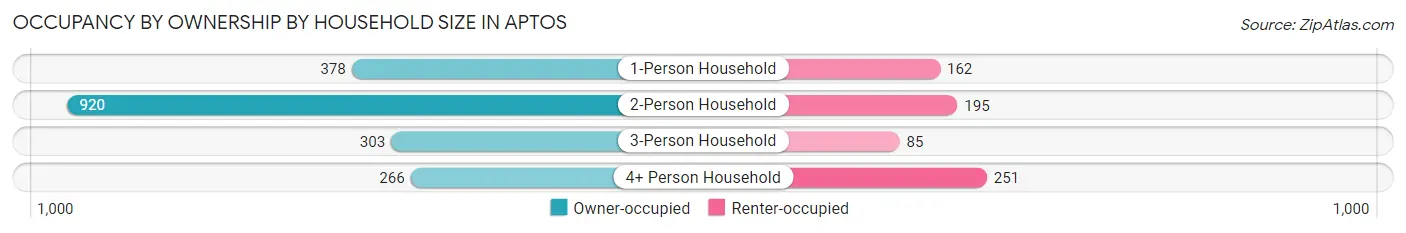
| Household Size | Owner-occupied | Renter-occupied |
| 1-Person Household | 378 (70.0%) | 162 (30.0%) |
| 2-Person Household | 920 (82.5%) | 195 (17.5%) |
| 3-Person Household | 303 (78.1%) | 85 (21.9%) |
| 4+ Person Household | 266 (51.4%) | 251 (48.5%) |
| Total Housing Units | 1,867 (72.9%) | 693 (27.1%) |
Occupancy by Educational Attainment in Aptos
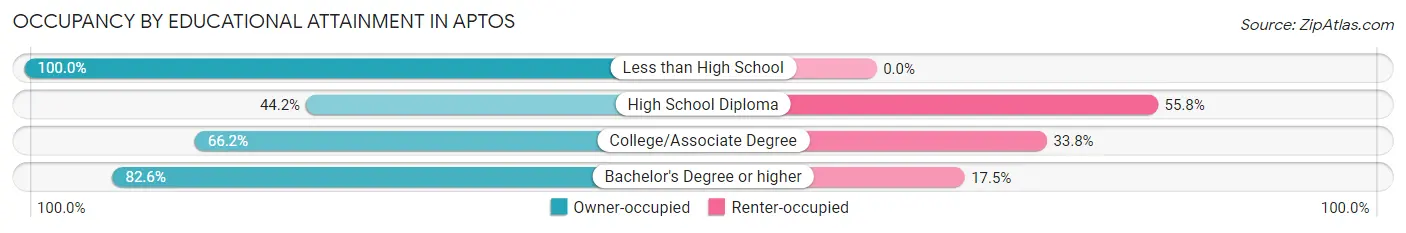
| Household Size | Owner-occupied | Renter-occupied |
| Less than High School | 15 (100.0%) | 0 (0.0%) |
| High School Diploma | 111 (44.2%) | 140 (55.8%) |
| College/Associate Degree | 620 (66.2%) | 316 (33.8%) |
| Bachelor's Degree or higher | 1,121 (82.6%) | 237 (17.4%) |
Occupancy by Age of Householder in Aptos
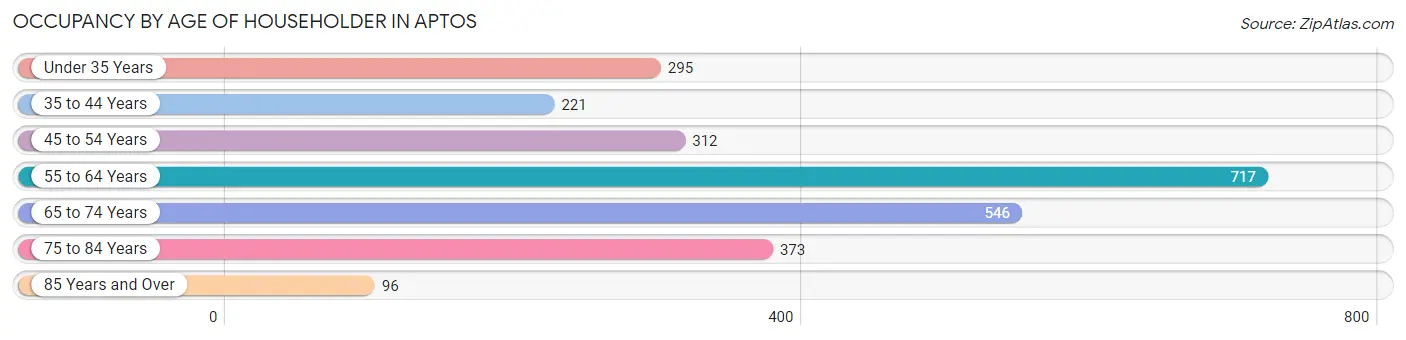
| Age Bracket | # Households | % Households |
| Under 35 Years | 295 | 11.5% |
| 35 to 44 Years | 221 | 8.6% |
| 45 to 54 Years | 312 | 12.2% |
| 55 to 64 Years | 717 | 28.0% |
| 65 to 74 Years | 546 | 21.3% |
| 75 to 84 Years | 373 | 14.6% |
| 85 Years and Over | 96 | 3.7% |
| Total | 2,560 | 100.0% |
Housing Finances in Aptos
Median Income by Occupancy in Aptos
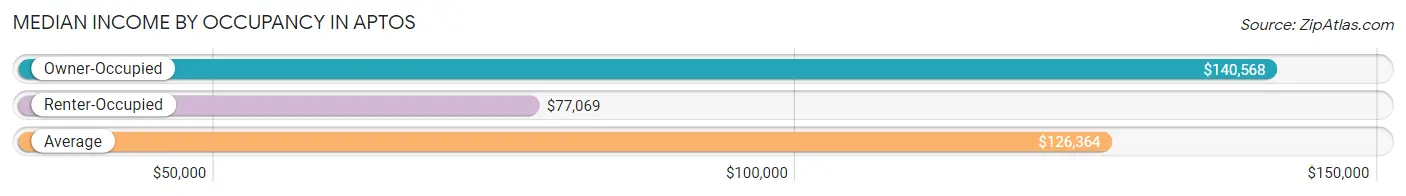
| Occupancy Type | # Households | Median Income |
| Owner-Occupied | 1,867 (72.9%) | $140,568 |
| Renter-Occupied | 693 (27.1%) | $77,069 |
| Average | 2,560 (100.0%) | $126,364 |
Occupancy by Householder Income Bracket in Aptos
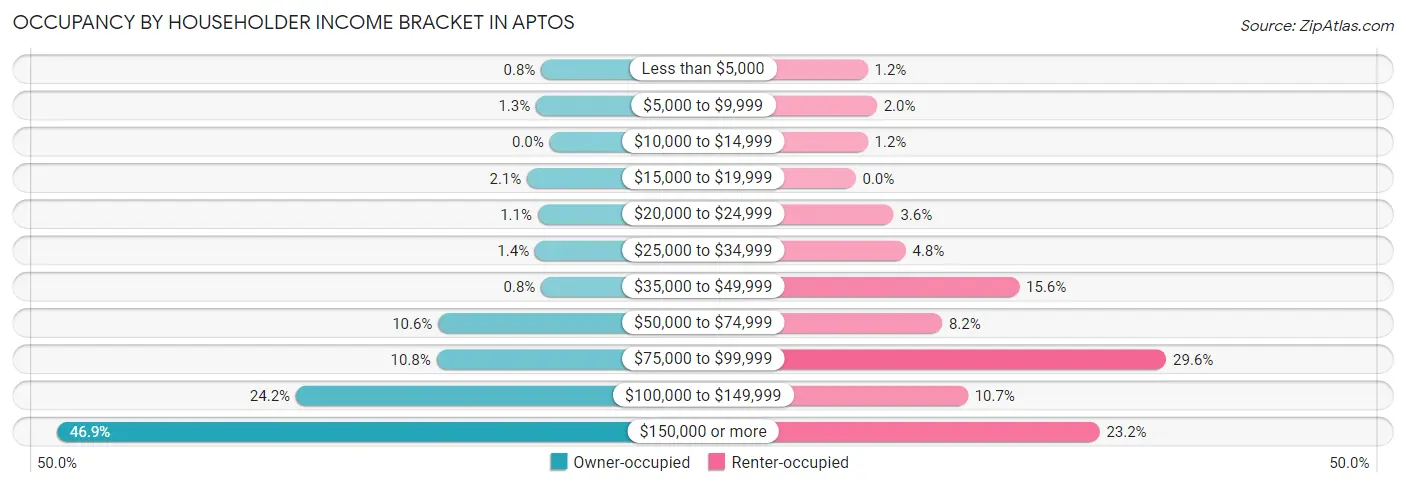
| Income Bracket | Owner-occupied | Renter-occupied |
| Less than $5,000 | 15 (0.8%) | 8 (1.1%) |
| $5,000 to $9,999 | 24 (1.3%) | 14 (2.0%) |
| $10,000 to $14,999 | 0 (0.0%) | 8 (1.1%) |
| $15,000 to $19,999 | 40 (2.1%) | 0 (0.0%) |
| $20,000 to $24,999 | 21 (1.1%) | 25 (3.6%) |
| $25,000 to $34,999 | 26 (1.4%) | 33 (4.8%) |
| $35,000 to $49,999 | 15 (0.8%) | 108 (15.6%) |
| $50,000 to $74,999 | 198 (10.6%) | 57 (8.2%) |
| $75,000 to $99,999 | 201 (10.8%) | 205 (29.6%) |
| $100,000 to $149,999 | 451 (24.2%) | 74 (10.7%) |
| $150,000 or more | 876 (46.9%) | 161 (23.2%) |
| Total | 1,867 (100.0%) | 693 (100.0%) |
Monthly Housing Cost Tiers in Aptos
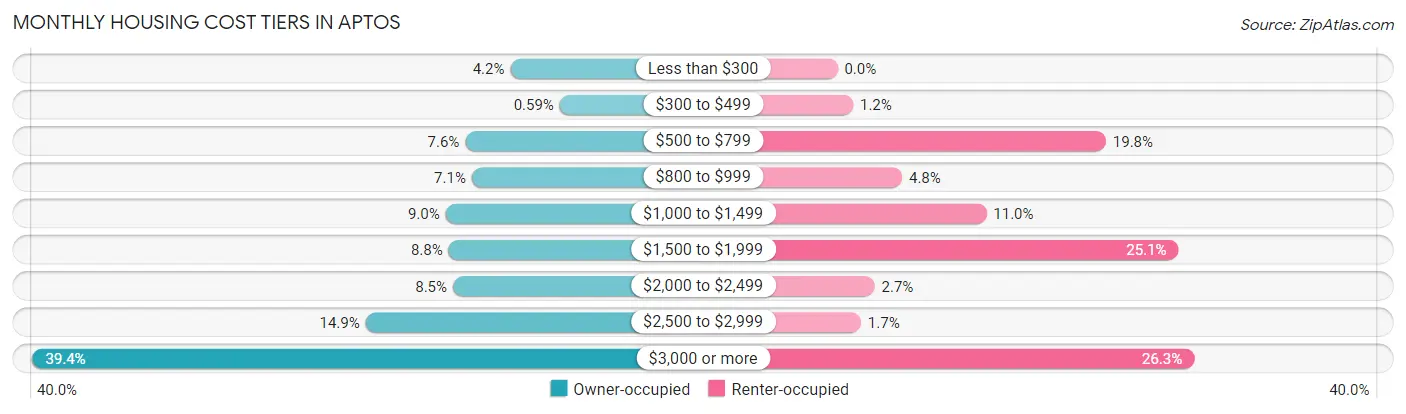
| Monthly Cost | Owner-occupied | Renter-occupied |
| Less than $300 | 79 (4.2%) | 0 (0.0%) |
| $300 to $499 | 11 (0.6%) | 8 (1.1%) |
| $500 to $799 | 141 (7.5%) | 137 (19.8%) |
| $800 to $999 | 132 (7.1%) | 33 (4.8%) |
| $1,000 to $1,499 | 168 (9.0%) | 76 (11.0%) |
| $1,500 to $1,999 | 164 (8.8%) | 174 (25.1%) |
| $2,000 to $2,499 | 158 (8.5%) | 19 (2.7%) |
| $2,500 to $2,999 | 278 (14.9%) | 12 (1.7%) |
| $3,000 or more | 736 (39.4%) | 182 (26.3%) |
| Total | 1,867 (100.0%) | 693 (100.0%) |
Physical Housing Characteristics in Aptos
Housing Structures in Aptos
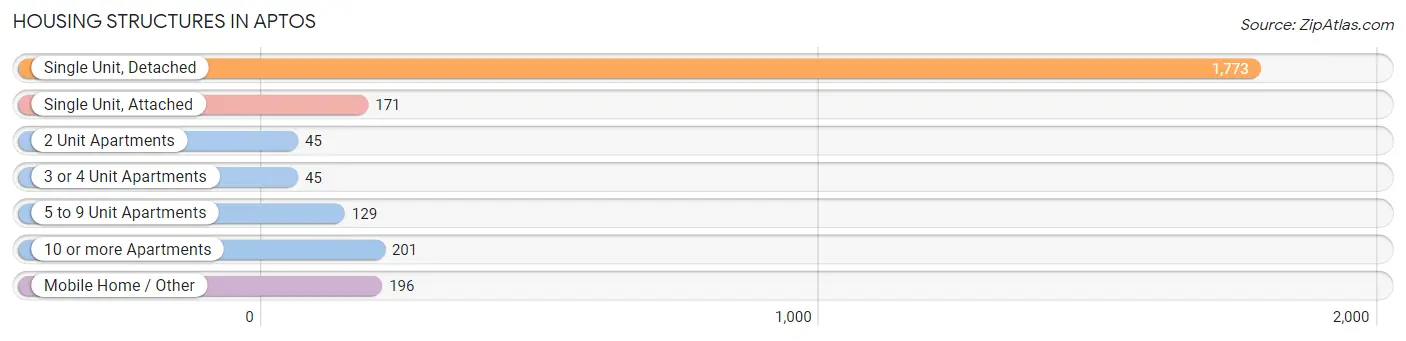
| Structure Type | # Housing Units | % Housing Units |
| Single Unit, Detached | 1,773 | 69.3% |
| Single Unit, Attached | 171 | 6.7% |
| 2 Unit Apartments | 45 | 1.8% |
| 3 or 4 Unit Apartments | 45 | 1.8% |
| 5 to 9 Unit Apartments | 129 | 5.0% |
| 10 or more Apartments | 201 | 7.9% |
| Mobile Home / Other | 196 | 7.7% |
| Total | 2,560 | 100.0% |
Housing Structures by Occupancy in Aptos
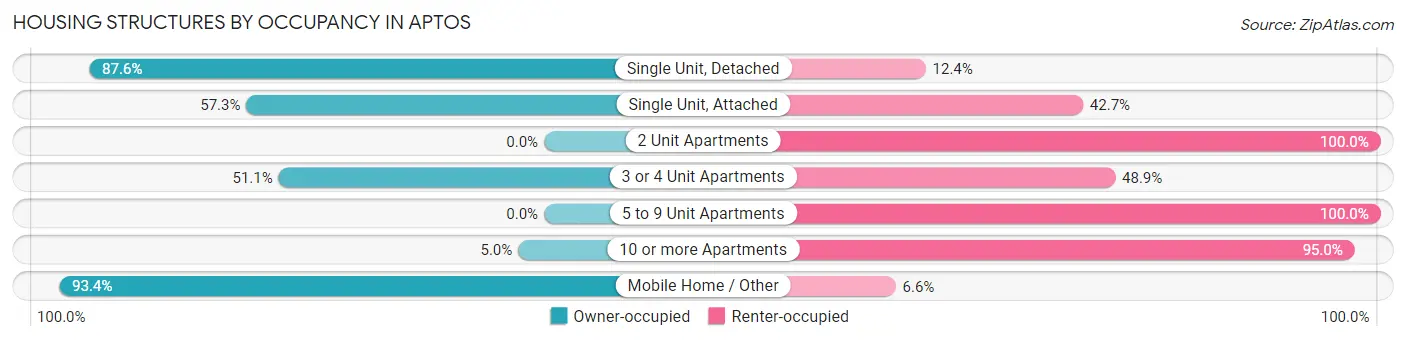
| Structure Type | Owner-occupied | Renter-occupied |
| Single Unit, Detached | 1,553 (87.6%) | 220 (12.4%) |
| Single Unit, Attached | 98 (57.3%) | 73 (42.7%) |
| 2 Unit Apartments | 0 (0.0%) | 45 (100.0%) |
| 3 or 4 Unit Apartments | 23 (51.1%) | 22 (48.9%) |
| 5 to 9 Unit Apartments | 0 (0.0%) | 129 (100.0%) |
| 10 or more Apartments | 10 (5.0%) | 191 (95.0%) |
| Mobile Home / Other | 183 (93.4%) | 13 (6.6%) |
| Total | 1,867 (72.9%) | 693 (27.1%) |
Housing Structures by Number of Rooms in Aptos
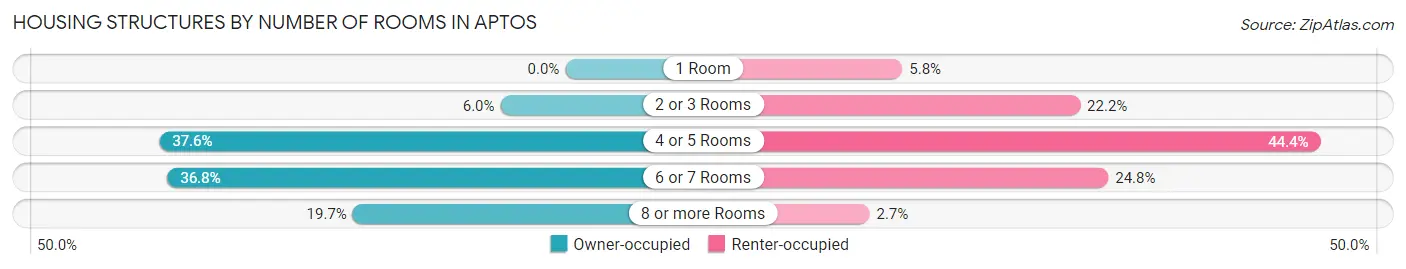
| Number of Rooms | Owner-occupied | Renter-occupied |
| 1 Room | 0 (0.0%) | 40 (5.8%) |
| 2 or 3 Rooms | 112 (6.0%) | 154 (22.2%) |
| 4 or 5 Rooms | 701 (37.6%) | 308 (44.4%) |
| 6 or 7 Rooms | 687 (36.8%) | 172 (24.8%) |
| 8 or more Rooms | 367 (19.7%) | 19 (2.7%) |
| Total | 1,867 (100.0%) | 693 (100.0%) |
Housing Structure by Heating Type in Aptos
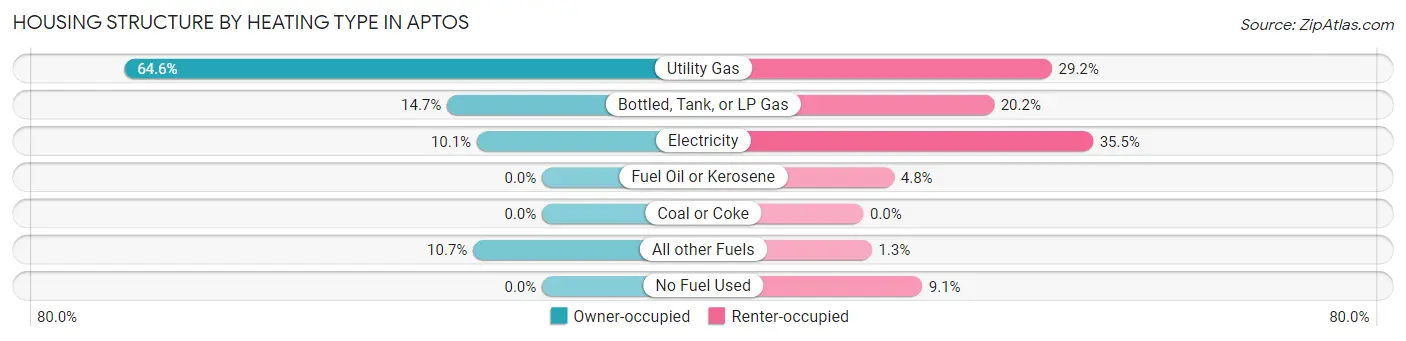
| Heating Type | Owner-occupied | Renter-occupied |
| Utility Gas | 1,206 (64.6%) | 202 (29.1%) |
| Bottled, Tank, or LP Gas | 274 (14.7%) | 140 (20.2%) |
| Electricity | 188 (10.1%) | 246 (35.5%) |
| Fuel Oil or Kerosene | 0 (0.0%) | 33 (4.8%) |
| Coal or Coke | 0 (0.0%) | 0 (0.0%) |
| All other Fuels | 199 (10.7%) | 9 (1.3%) |
| No Fuel Used | 0 (0.0%) | 63 (9.1%) |
| Total | 1,867 (100.0%) | 693 (100.0%) |
Household Vehicle Usage in Aptos
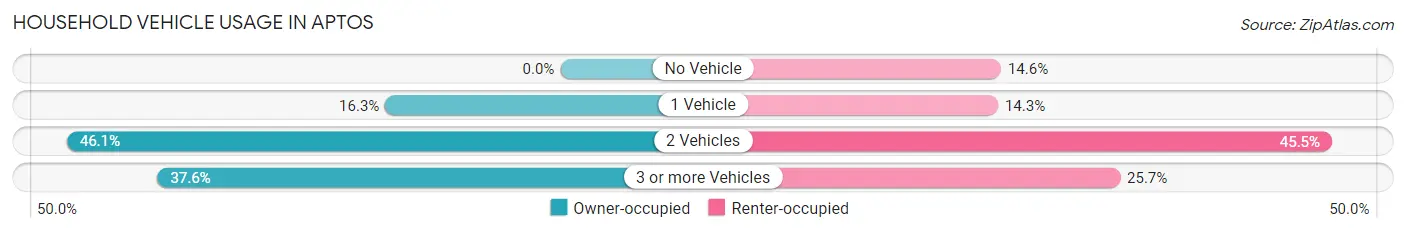
| Vehicles per Household | Owner-occupied | Renter-occupied |
| No Vehicle | 0 (0.0%) | 101 (14.6%) |
| 1 Vehicle | 305 (16.3%) | 99 (14.3%) |
| 2 Vehicles | 860 (46.1%) | 315 (45.5%) |
| 3 or more Vehicles | 702 (37.6%) | 178 (25.7%) |
| Total | 1,867 (100.0%) | 693 (100.0%) |
Real Estate & Mortgages in Aptos
Real Estate and Mortgage Overview in Aptos
| Characteristic | Without Mortgage | With Mortgage |
| Housing Units | 552 | 1,315 |
| Median Property Value | $972,600 | $1,061,000 |
| Median Household Income | $107,206 | $697 |
| Monthly Housing Costs | $921 | $736 |
| Real Estate Taxes | $3,829 | $0 |
Property Value by Mortgage Status in Aptos
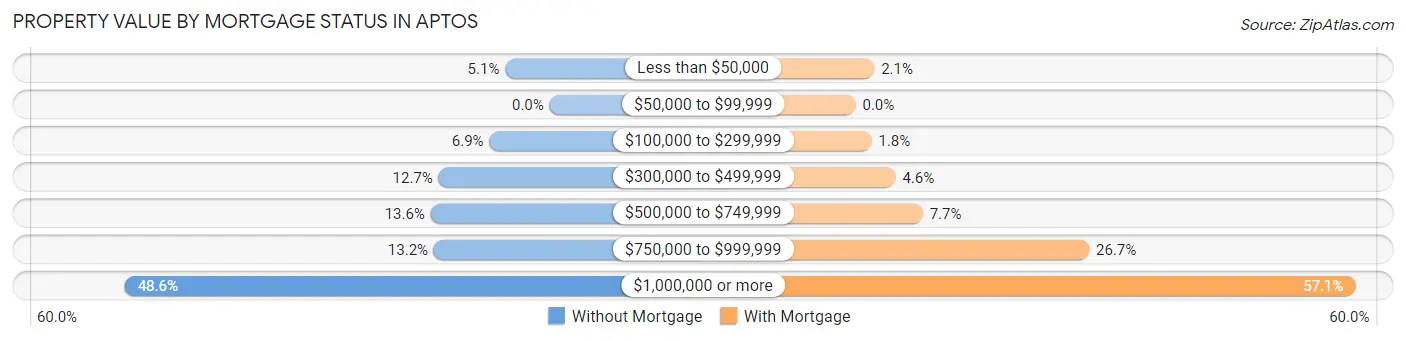
| Property Value | Without Mortgage | With Mortgage |
| Less than $50,000 | 28 (5.1%) | 28 (2.1%) |
| $50,000 to $99,999 | 0 (0.0%) | 0 (0.0%) |
| $100,000 to $299,999 | 38 (6.9%) | 24 (1.8%) |
| $300,000 to $499,999 | 70 (12.7%) | 60 (4.6%) |
| $500,000 to $749,999 | 75 (13.6%) | 101 (7.7%) |
| $750,000 to $999,999 | 73 (13.2%) | 351 (26.7%) |
| $1,000,000 or more | 268 (48.5%) | 751 (57.1%) |
| Total | 552 (100.0%) | 1,315 (100.0%) |
Household Income by Mortgage Status in Aptos
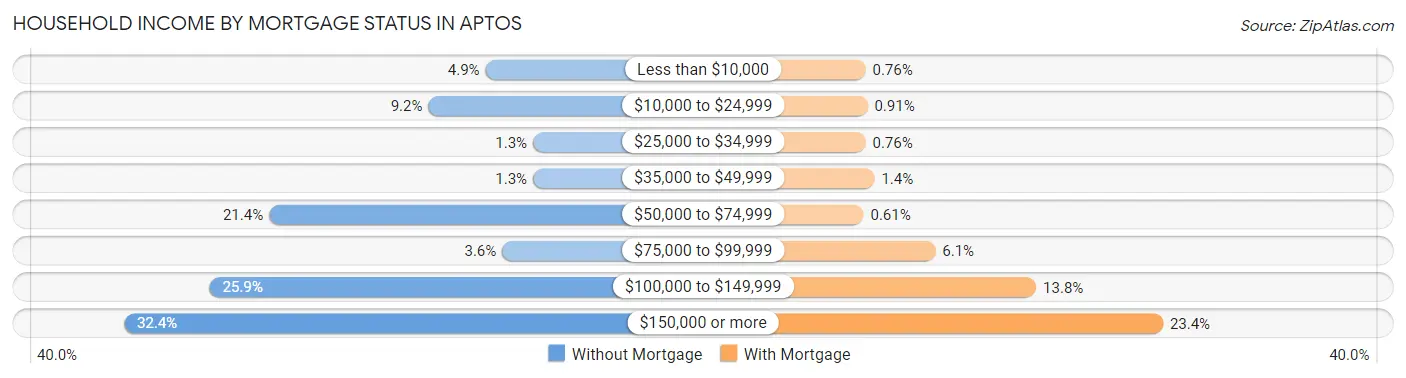
| Household Income | Without Mortgage | With Mortgage |
| Less than $10,000 | 27 (4.9%) | 10 (0.8%) |
| $10,000 to $24,999 | 51 (9.2%) | 12 (0.9%) |
| $25,000 to $34,999 | 7 (1.3%) | 10 (0.8%) |
| $35,000 to $49,999 | 7 (1.3%) | 19 (1.4%) |
| $50,000 to $74,999 | 118 (21.4%) | 8 (0.6%) |
| $75,000 to $99,999 | 20 (3.6%) | 80 (6.1%) |
| $100,000 to $149,999 | 143 (25.9%) | 181 (13.8%) |
| $150,000 or more | 179 (32.4%) | 308 (23.4%) |
| Total | 552 (100.0%) | 1,315 (100.0%) |
Property Value to Household Income Ratio in Aptos
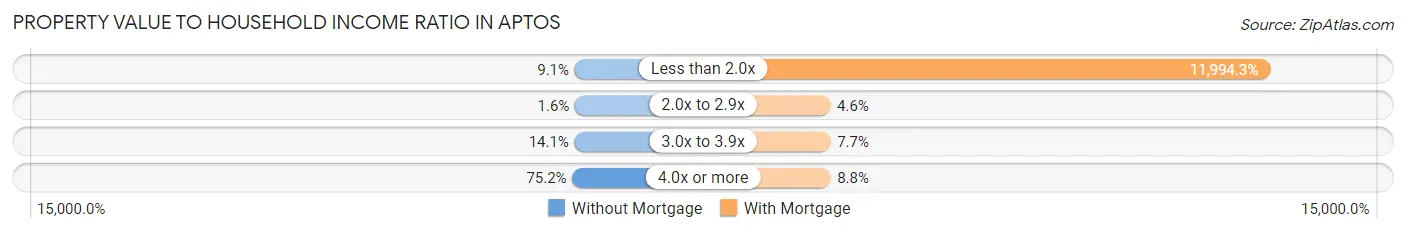
| Value-to-Income Ratio | Without Mortgage | With Mortgage |
| Less than 2.0x | 50 (9.1%) | 157,725 (11,994.3%) |
| 2.0x to 2.9x | 9 (1.6%) | 61 (4.6%) |
| 3.0x to 3.9x | 78 (14.1%) | 101 (7.7%) |
| 4.0x or more | 415 (75.2%) | 115 (8.7%) |
| Total | 552 (100.0%) | 1,315 (100.0%) |
Real Estate Taxes by Mortgage Status in Aptos
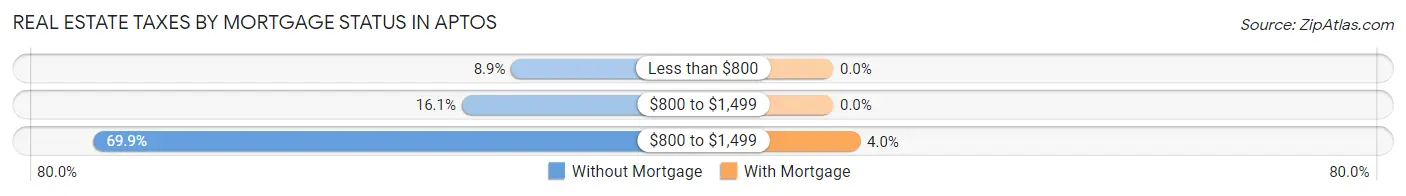
| Property Taxes | Without Mortgage | With Mortgage |
| Less than $800 | 49 (8.9%) | 0 (0.0%) |
| $800 to $1,499 | 89 (16.1%) | 0 (0.0%) |
| $800 to $1,499 | 386 (69.9%) | 52 (4.0%) |
| Total | 552 (100.0%) | 1,315 (100.0%) |
Health & Disability in Aptos
Health Insurance Coverage by Age in Aptos
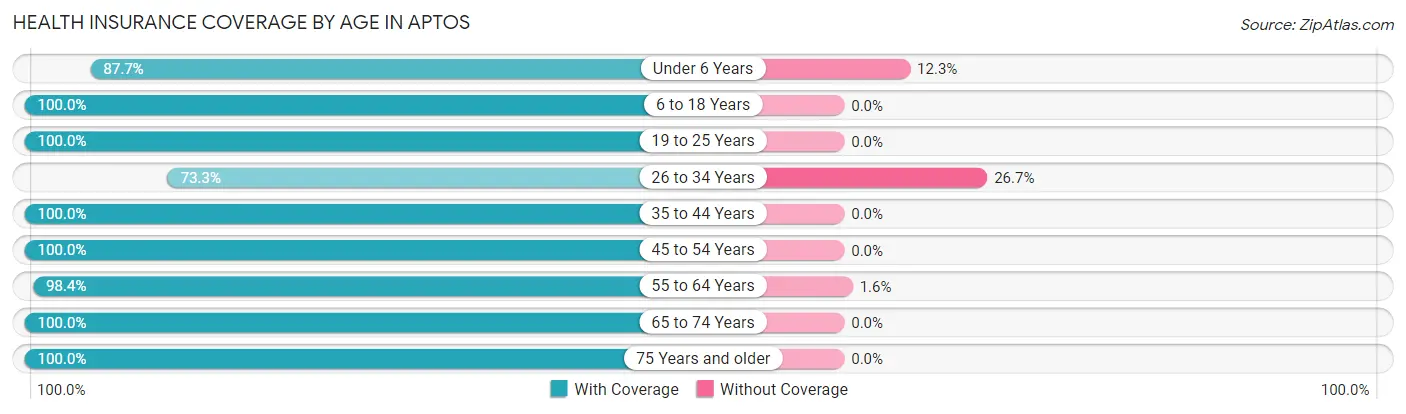
| Age Bracket | With Coverage | Without Coverage |
| Under 6 Years | 250 (87.7%) | 35 (12.3%) |
| 6 to 18 Years | 857 (100.0%) | 0 (0.0%) |
| 19 to 25 Years | 757 (100.0%) | 0 (0.0%) |
| 26 to 34 Years | 465 (73.3%) | 169 (26.7%) |
| 35 to 44 Years | 412 (100.0%) | 0 (0.0%) |
| 45 to 54 Years | 740 (100.0%) | 0 (0.0%) |
| 55 to 64 Years | 1,254 (98.4%) | 20 (1.6%) |
| 65 to 74 Years | 937 (100.0%) | 0 (0.0%) |
| 75 Years and older | 718 (100.0%) | 0 (0.0%) |
| Total | 6,390 (96.6%) | 224 (3.4%) |
Health Insurance Coverage by Citizenship Status in Aptos
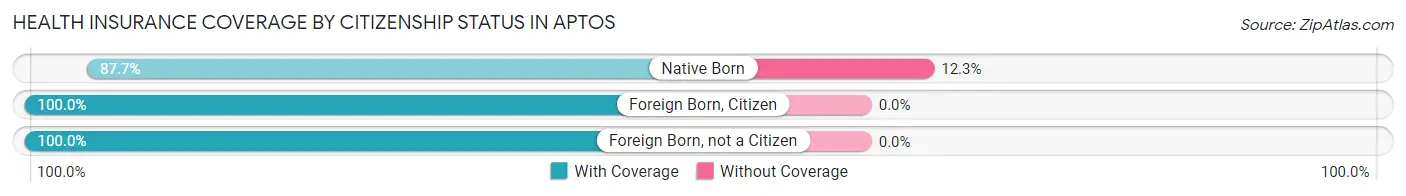
| Citizenship Status | With Coverage | Without Coverage |
| Native Born | 250 (87.7%) | 35 (12.3%) |
| Foreign Born, Citizen | 857 (100.0%) | 0 (0.0%) |
| Foreign Born, not a Citizen | 757 (100.0%) | 0 (0.0%) |
Health Insurance Coverage by Household Income in Aptos
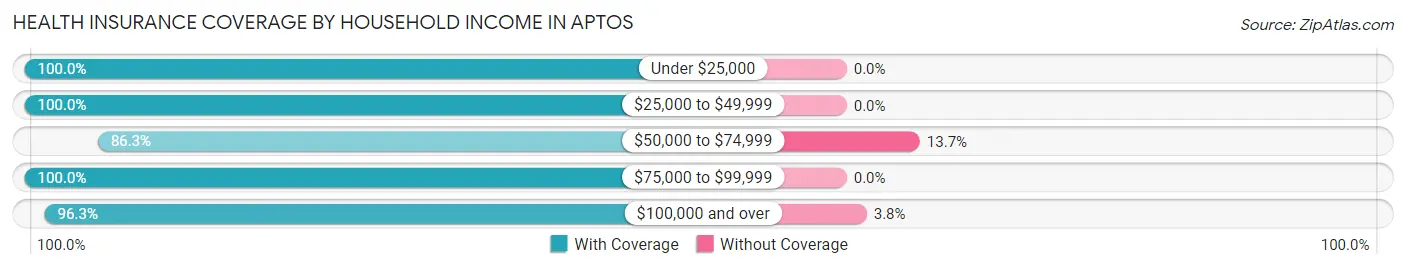
| Household Income | With Coverage | Without Coverage |
| Under $25,000 | 252 (100.0%) | 0 (0.0%) |
| $25,000 to $49,999 | 356 (100.0%) | 0 (0.0%) |
| $50,000 to $74,999 | 403 (86.3%) | 64 (13.7%) |
| $75,000 to $99,999 | 1,255 (100.0%) | 0 (0.0%) |
| $100,000 and over | 4,105 (96.3%) | 160 (3.7%) |
Public vs Private Health Insurance Coverage by Age in Aptos
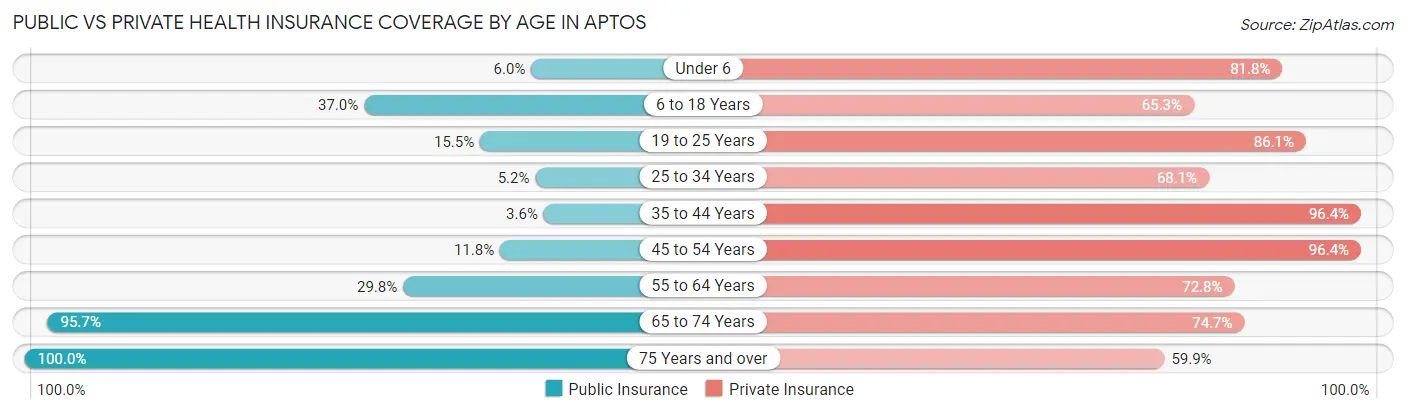
| Age Bracket | Public Insurance | Private Insurance |
| Under 6 | 17 (6.0%) | 233 (81.8%) |
| 6 to 18 Years | 317 (37.0%) | 560 (65.3%) |
| 19 to 25 Years | 117 (15.5%) | 652 (86.1%) |
| 25 to 34 Years | 33 (5.2%) | 432 (68.1%) |
| 35 to 44 Years | 15 (3.6%) | 397 (96.4%) |
| 45 to 54 Years | 87 (11.8%) | 713 (96.4%) |
| 55 to 64 Years | 379 (29.7%) | 928 (72.8%) |
| 65 to 74 Years | 897 (95.7%) | 700 (74.7%) |
| 75 Years and over | 718 (100.0%) | 430 (59.9%) |
| Total | 2,580 (39.0%) | 5,045 (76.3%) |
Disability Status by Sex by Age in Aptos
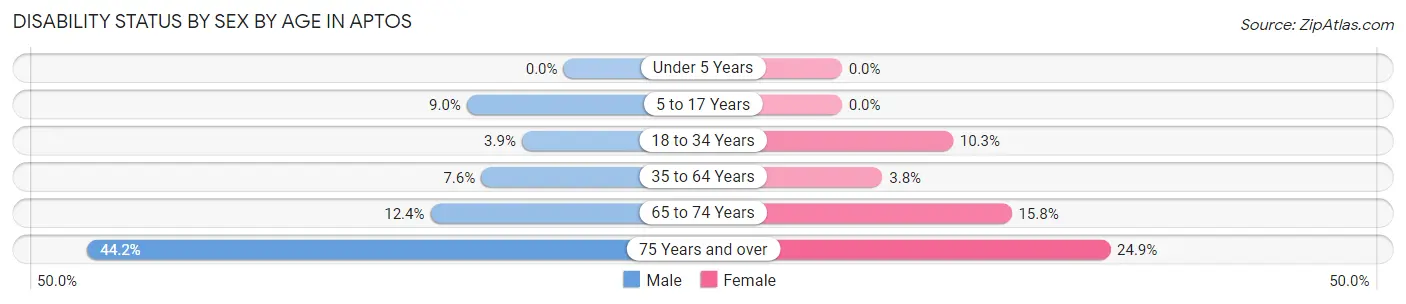
| Age Bracket | Male | Female |
| Under 5 Years | 0 (0.0%) | 0 (0.0%) |
| 5 to 17 Years | 27 (9.0%) | 0 (0.0%) |
| 18 to 34 Years | 24 (3.9%) | 102 (10.3%) |
| 35 to 64 Years | 96 (7.6%) | 44 (3.8%) |
| 65 to 74 Years | 53 (12.3%) | 80 (15.8%) |
| 75 Years and over | 106 (44.2%) | 119 (24.9%) |
Disability Class by Sex by Age in Aptos
Disability Class: Hearing Difficulty
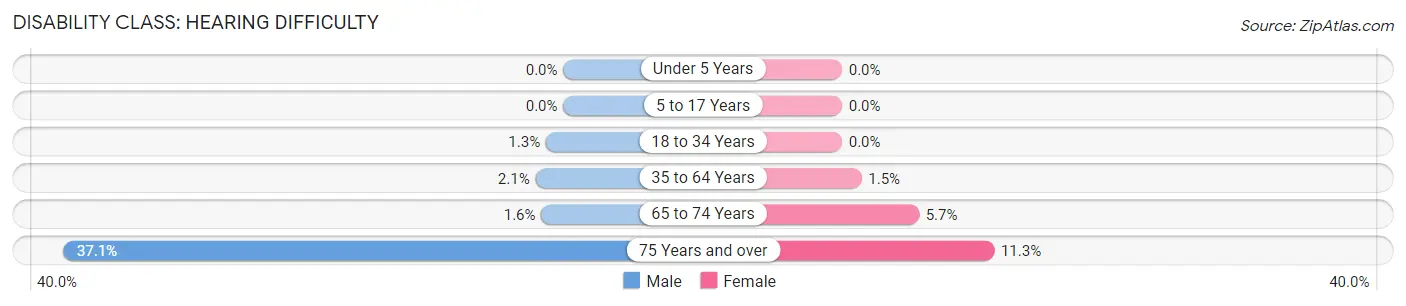
| Age Bracket | Male | Female |
| Under 5 Years | 0 (0.0%) | 0 (0.0%) |
| 5 to 17 Years | 0 (0.0%) | 0 (0.0%) |
| 18 to 34 Years | 8 (1.3%) | 0 (0.0%) |
| 35 to 64 Years | 26 (2.1%) | 17 (1.5%) |
| 65 to 74 Years | 7 (1.6%) | 29 (5.7%) |
| 75 Years and over | 89 (37.1%) | 54 (11.3%) |
Disability Class: Vision Difficulty
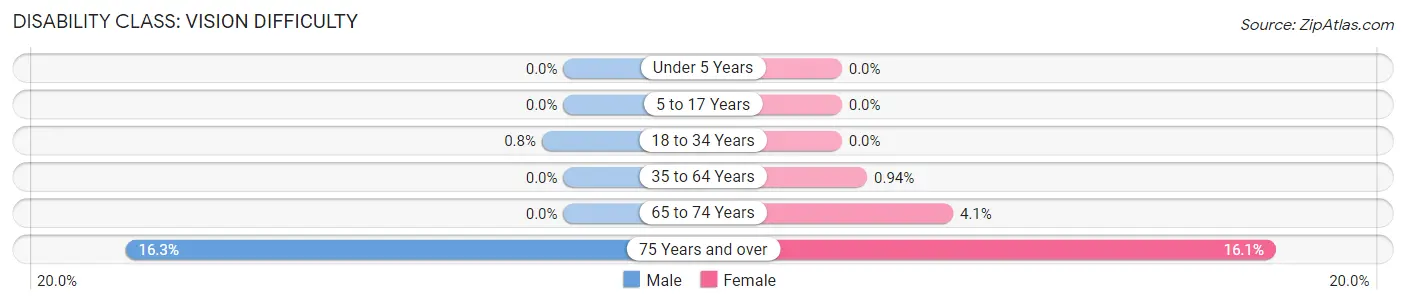
| Age Bracket | Male | Female |
| Under 5 Years | 0 (0.0%) | 0 (0.0%) |
| 5 to 17 Years | 0 (0.0%) | 0 (0.0%) |
| 18 to 34 Years | 5 (0.8%) | 0 (0.0%) |
| 35 to 64 Years | 0 (0.0%) | 11 (0.9%) |
| 65 to 74 Years | 0 (0.0%) | 21 (4.1%) |
| 75 Years and over | 39 (16.3%) | 77 (16.1%) |
Disability Class: Cognitive Difficulty
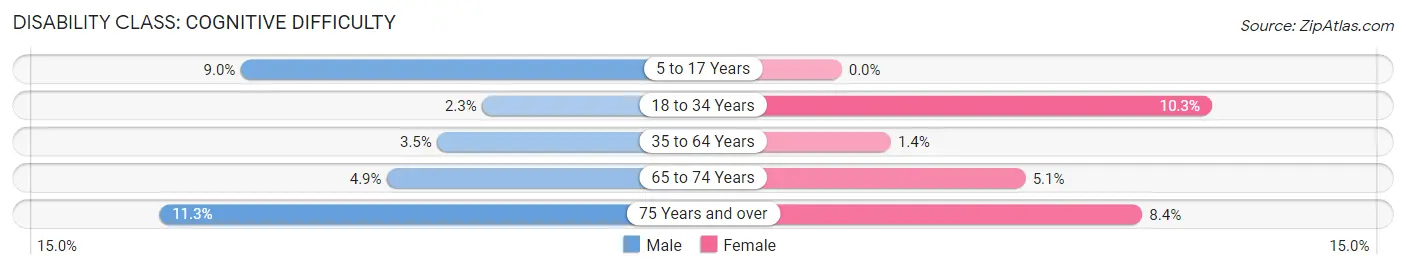
| Age Bracket | Male | Female |
| 5 to 17 Years | 27 (9.0%) | 0 (0.0%) |
| 18 to 34 Years | 14 (2.2%) | 102 (10.3%) |
| 35 to 64 Years | 44 (3.5%) | 16 (1.4%) |
| 65 to 74 Years | 21 (4.9%) | 26 (5.1%) |
| 75 Years and over | 27 (11.3%) | 40 (8.4%) |
Disability Class: Ambulatory Difficulty
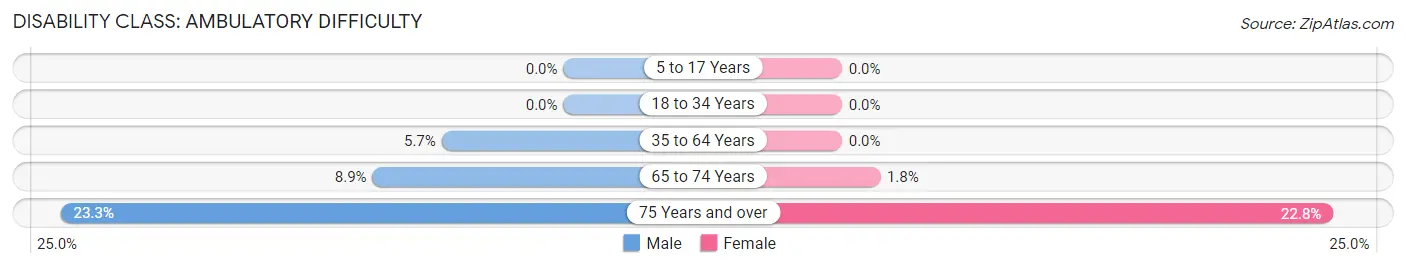
| Age Bracket | Male | Female |
| 5 to 17 Years | 0 (0.0%) | 0 (0.0%) |
| 18 to 34 Years | 0 (0.0%) | 0 (0.0%) |
| 35 to 64 Years | 71 (5.7%) | 0 (0.0%) |
| 65 to 74 Years | 38 (8.9%) | 9 (1.8%) |
| 75 Years and over | 56 (23.3%) | 109 (22.8%) |
Disability Class: Self-Care Difficulty
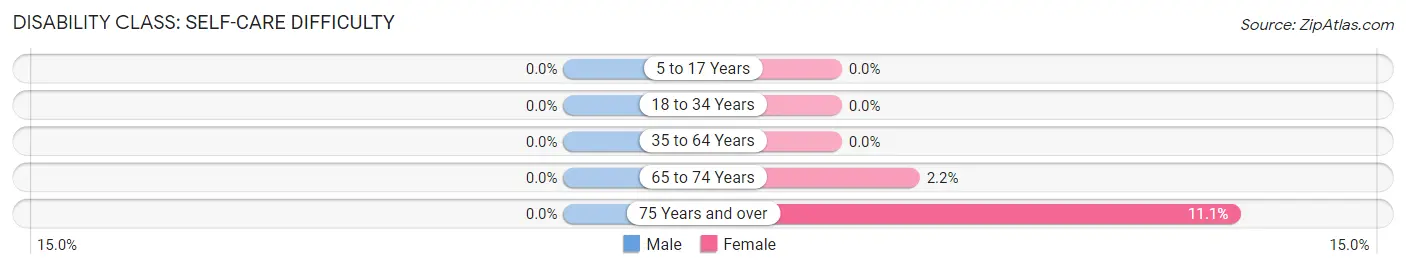
| Age Bracket | Male | Female |
| 5 to 17 Years | 0 (0.0%) | 0 (0.0%) |
| 18 to 34 Years | 0 (0.0%) | 0 (0.0%) |
| 35 to 64 Years | 0 (0.0%) | 0 (0.0%) |
| 65 to 74 Years | 0 (0.0%) | 11 (2.2%) |
| 75 Years and over | 0 (0.0%) | 53 (11.1%) |
Technology Access in Aptos
Computing Device Access in Aptos
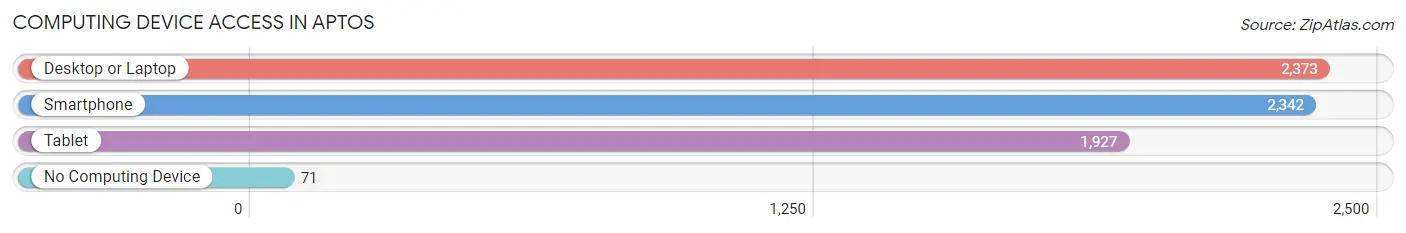
| Device Type | # Households | % Households |
| Desktop or Laptop | 2,373 | 92.7% |
| Smartphone | 2,342 | 91.5% |
| Tablet | 1,927 | 75.3% |
| No Computing Device | 71 | 2.8% |
| Total | 2,560 | 100.0% |
Internet Access in Aptos
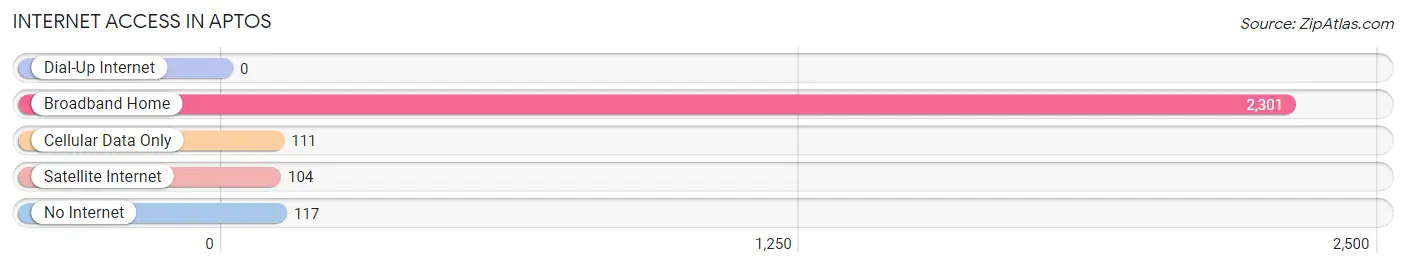
| Internet Type | # Households | % Households |
| Dial-Up Internet | 0 | 0.0% |
| Broadband Home | 2,301 | 89.9% |
| Cellular Data Only | 111 | 4.3% |
| Satellite Internet | 104 | 4.1% |
| No Internet | 117 | 4.6% |
| Total | 2,560 | 100.0% |
Aptos Summary
Aptos is a census-designated place (CDP) located in Santa Cruz County, California, United States. The population was 6,220 at the 2000 census. Aptos is located along the northern coast of Monterey Bay, south of the city of Santa Cruz and north of the town of Capitola.
History
The area now known as Aptos was originally inhabited by the Ohlone people, who lived in the area for thousands of years. The first European settlers arrived in the area in the late 1700s, and the area was eventually incorporated into the Rancho Aptos land grant in 1833. The area was named after the Spanish word for “harbor”, and the area was used for cattle ranching and farming.
In the late 1800s, the area began to develop as a resort destination, and the first hotel was built in 1875. The area was also home to a number of lumber mills, and the lumber industry was a major part of the local economy.
In the early 1900s, the area began to develop as a residential community, and the first post office was established in 1921. The area was officially incorporated as the town of Aptos in 1963.
Geography
Aptos is located at 36°58'17" North, 121°55'17" West (36.9714, -121.9214). According to the United States Census Bureau, the CDP has a total area of 8.3 square miles (21.5 km2), of which 8.2 square miles (21.3 km2) is land and 0.1 square miles (0.2 km2) (1.17%) is water.
Aptos is located along the northern coast of Monterey Bay, south of the city of Santa Cruz and north of the town of Capitola. The area is characterized by rolling hills and valleys, with the Santa Cruz Mountains to the east and the Monterey Bay to the west.
Economy
The economy of Aptos is largely based on tourism and retail. The area is home to a number of hotels, restaurants, and shops, as well as a number of art galleries and museums. The area is also home to a number of technology companies, including the headquarters of the software company Adobe Systems.
Demographics
As of the census of 2000, there were 6,220 people, 2,541 households, and 1,637 families residing in the CDP. The population density was 754.3 people per square mile (291.2/km2). There were 2,637 housing units at an average density of 321.3 per square mile (123.8/km2). The racial makeup of the CDP was 87.2% White, 0.9% African American, 0.7% Native American, 5.2% Asian, 0.2% Pacific Islander, 2.7% from other races, and 3.1% from two or more races. Hispanic or Latino of any race were 8.2% of the population.
There were 2,541 households, out of which 28.2% had children under the age of 18 living with them, 48.2% were married couples living together, 10.2% had a female householder with no husband present, and 37.2% were non-families. 28.7% of all households were made up of individuals, and 8.2% had someone living alone who was 65 years of age or older. The average household size was 2.44 and the average family size was 3.03.
In the CDP, the population was spread out, with 22.7% under the age of 18, 7.2% from 18 to 24, 32.2% from 25 to 44, 25.3% from 45 to 64, and 12.6% who were 65 years of age or older. The median age was 38 years. For every 100 females, there were 95.2 males. For every 100 females age 18 and over, there were 92.3 males.
The median income for a household in the CDP was $54,846, and the median income for a family was $63,906. Males had a median income of $45,938 versus $35,938 for females. The per capita income for the CDP was $27,945. About 4.2% of families and 6.3% of the population were below the poverty line, including 7.2% of those under age 18 and 4.2% of those age 65 or over.
Common Questions
What is Per Capita Income in Aptos?
Per Capita income in Aptos is $62,960.
What is the Median Family Income in Aptos?
Median Family Income in Aptos is $130,663.
What is the Median Household income in Aptos?
Median Household Income in Aptos is $126,364.
What is Income or Wage Gap in Aptos?
Income or Wage Gap in Aptos is 11.3%.
Women in Aptos earn 88.7 cents for every dollar earned by a man.
What is Family Income Deficit in Aptos?
Family Income Deficit in Aptos is $11,387.
Families that are below poverty line in Aptos earn $11,387 less on average than the poverty threshold level.
What is Inequality or Gini Index in Aptos?
Inequality or Gini Index in Aptos is 0.40.
What is the Total Population of Aptos?
Total Population of Aptos is 6,614.
What is the Total Male Population of Aptos?
Total Male Population of Aptos is 3,005.
What is the Total Female Population of Aptos?
Total Female Population of Aptos is 3,609.
What is the Ratio of Males per 100 Females in Aptos?
There are 83.26 Males per 100 Females in Aptos.
What is the Ratio of Females per 100 Males in Aptos?
There are 120.10 Females per 100 Males in Aptos.
What is the Median Population Age in Aptos?
Median Population Age in Aptos is 50.6 Years.
What is the Average Family Size in Aptos
Average Family Size in Aptos is 3.0 People.
What is the Average Household Size in Aptos
Average Household Size in Aptos is 2.6 People.
How Large is the Labor Force in Aptos?
There are 3,407 People in the Labor Forcein in Aptos.
What is the Percentage of People in the Labor Force in Aptos?
59.1% of People are in the Labor Force in Aptos.
What is the Unemployment Rate in Aptos?
Unemployment Rate in Aptos is 5.5%.