Cities with the Highest Percentage of Population Walking to Work in Michigan
RELATED REPORTS & OPTIONS
Walk to Work
Michigan
Compare Cities
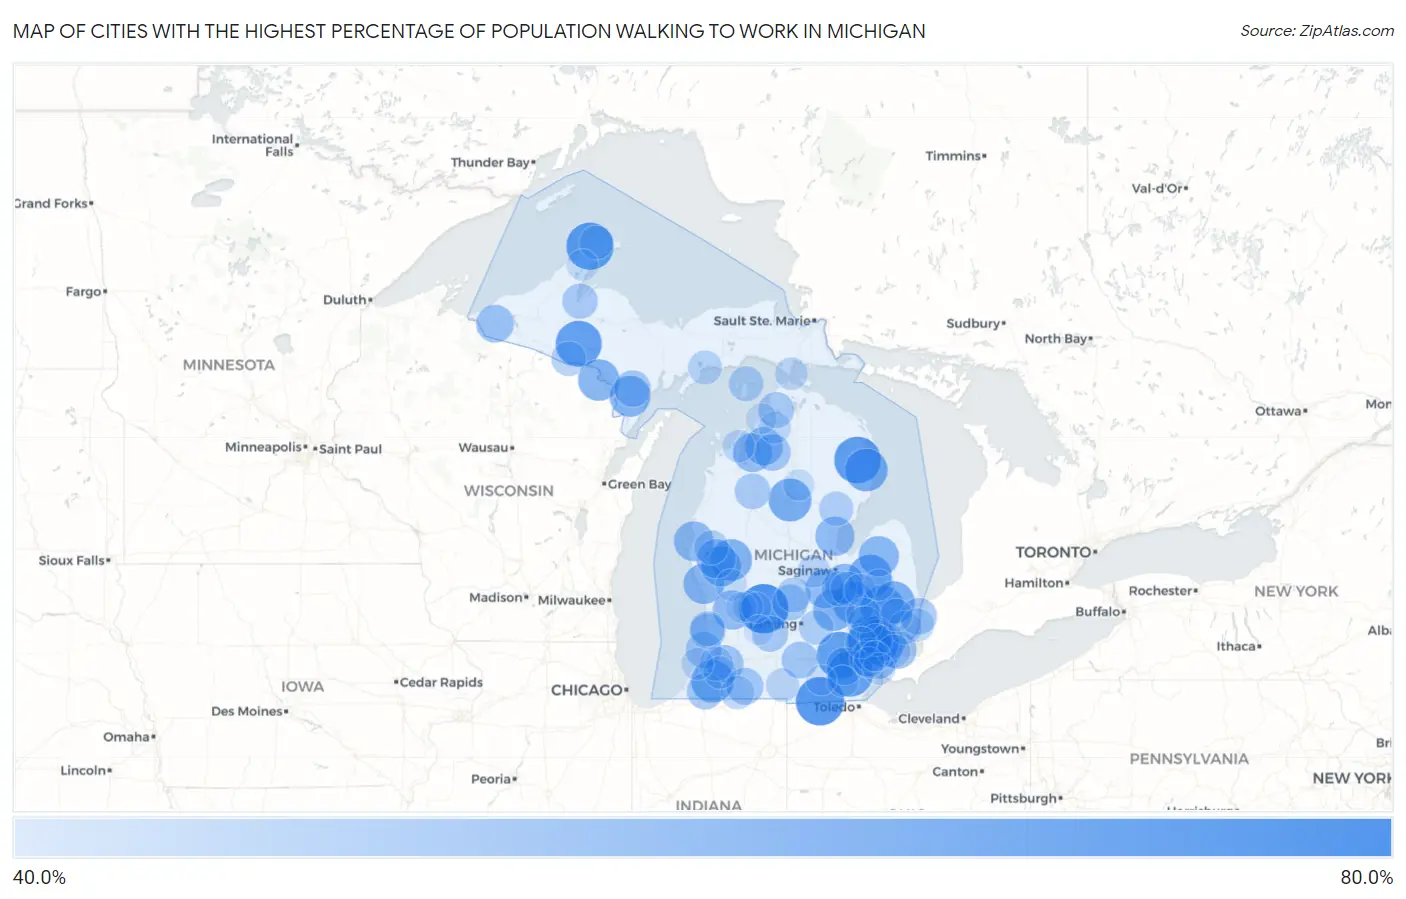
Map of Cities with the Highest Percentage of Population Walking to Work in Michigan
0.0%
80.0%
Cities with the Highest Percentage of Population Walking to Work in Michigan
| City | % Walk to Work | vs State | vs National | |
| 1. | Saranac | 77.1% | 29.4%(+47.7)#1 | 33.4%(+43.7)#25 |
| 2. | Franklin | 76.0% | 29.4%(+46.6)#2 | 33.4%(+42.6)#37 |
| 3. | Morenci | 75.2% | 29.4%(+45.8)#3 | 33.4%(+41.8)#44 |
| 4. | Eagle River | 73.5% | 29.4%(+44.1)#4 | 33.4%(+40.1)#55 |
| 5. | Hubbard Lake | 72.3% | 29.4%(+42.9)#5 | 33.4%(+38.9)#68 |
| 6. | Dexter | 72.1% | 29.4%(+42.7)#6 | 33.4%(+38.7)#71 |
| 7. | Amasa | 71.4% | 29.4%(+42.0)#7 | 33.4%(+38.0)#85 |
| 8. | Milan | 71.3% | 29.4%(+41.9)#8 | 33.4%(+37.9)#87 |
| 9. | Dryden | 67.4% | 29.4%(+38.0)#9 | 33.4%(+34.0)#212 |
| 10. | Mayville | 67.2% | 29.4%(+37.8)#10 | 33.4%(+33.8)#229 |
| 11. | Houghton Lake | 66.4% | 29.4%(+37.0)#11 | 33.4%(+33.0)#258 |
| 12. | Lincoln | 66.4% | 29.4%(+37.0)#12 | 33.4%(+33.0)#262 |
| 13. | Dowagiac | 66.0% | 29.4%(+36.6)#13 | 33.4%(+32.6)#291 |
| 14. | Burton | 65.3% | 29.4%(+35.9)#14 | 33.4%(+31.9)#322 |
| 15. | Capac | 65.3% | 29.4%(+35.9)#15 | 33.4%(+31.9)#328 |
| 16. | White Cloud | 64.5% | 29.4%(+35.1)#16 | 33.4%(+31.1)#376 |
| 17. | Durand | 64.2% | 29.4%(+34.8)#17 | 33.4%(+30.8)#407 |
| 18. | Kingsford | 64.1% | 29.4%(+34.7)#18 | 33.4%(+30.7)#412 |
| 19. | Carney | 63.3% | 29.4%(+33.9)#19 | 33.4%(+29.9)#481 |
| 20. | North Muskegon | 62.6% | 29.4%(+33.2)#20 | 33.4%(+29.2)#536 |
| 21. | Cass City | 62.2% | 29.4%(+32.8)#21 | 33.4%(+28.8)#588 |
| 22. | Fremont | 62.1% | 29.4%(+32.7)#22 | 33.4%(+28.7)#603 |
| 23. | Birch Run | 61.6% | 29.4%(+32.2)#23 | 33.4%(+28.2)#642 |
| 24. | Pentwater | 61.3% | 29.4%(+31.9)#24 | 33.4%(+27.9)#691 |
| 25. | Grandville | 60.7% | 29.4%(+31.3)#25 | 33.4%(+27.3)#745 |
| 26. | Chesaning | 60.7% | 29.4%(+31.3)#26 | 33.4%(+27.3)#748 |
| 27. | Pinconning | 60.6% | 29.4%(+31.2)#27 | 33.4%(+27.2)#765 |
| 28. | Elk Rapids | 60.2% | 29.4%(+30.8)#28 | 33.4%(+26.8)#846 |
| 29. | Hesperia | 60.2% | 29.4%(+30.8)#29 | 33.4%(+26.8)#848 |
| 30. | Allen Park | 59.1% | 29.4%(+29.7)#30 | 33.4%(+25.7)#990 |
| 31. | Bellaire | 59.1% | 29.4%(+29.7)#31 | 33.4%(+25.7)#1,006 |
| 32. | Grosse Pointe Farms | 58.4% | 29.4%(+29.0)#32 | 33.4%(+25.0)#1,100 |
| 33. | Highland Park | 58.2% | 29.4%(+28.8)#33 | 33.4%(+24.8)#1,137 |
| 34. | Saline | 58.2% | 29.4%(+28.8)#34 | 33.4%(+24.8)#1,138 |
| 35. | Wakefield | 58.1% | 29.4%(+28.7)#35 | 33.4%(+24.7)#1,155 |
| 36. | Bloomfield Hills | 57.2% | 29.4%(+27.8)#36 | 33.4%(+23.8)#1,287 |
| 37. | Paw Paw | 57.2% | 29.4%(+27.8)#37 | 33.4%(+23.8)#1,289 |
| 38. | Centreville | 56.8% | 29.4%(+27.4)#38 | 33.4%(+23.4)#1,339 |
| 39. | Center Line | 56.5% | 29.4%(+27.1)#39 | 33.4%(+23.1)#1,382 |
| 40. | Mancelona | 56.5% | 29.4%(+27.1)#40 | 33.4%(+23.1)#1,394 |
| 41. | Parma | 56.5% | 29.4%(+27.1)#41 | 33.4%(+23.1)#1,402 |
| 42. | Powers | 56.3% | 29.4%(+26.9)#42 | 33.4%(+22.9)#1,461 |
| 43. | St Clair | 56.2% | 29.4%(+26.8)#43 | 33.4%(+22.8)#1,469 |
| 44. | Birmingham | 56.0% | 29.4%(+26.6)#44 | 33.4%(+22.6)#1,491 |
| 45. | Niles | 55.8% | 29.4%(+26.4)#45 | 33.4%(+22.4)#1,510 |
| 46. | South Haven | 55.6% | 29.4%(+26.2)#46 | 33.4%(+22.2)#1,541 |
| 47. | Nashville | 55.4% | 29.4%(+26.0)#47 | 33.4%(+22.0)#1,600 |
| 48. | Pleasant Ridge | 55.3% | 29.4%(+25.9)#48 | 33.4%(+21.9)#1,621 |
| 49. | Fowler | 55.1% | 29.4%(+25.7)#49 | 33.4%(+21.7)#1,669 |
| 50. | Harbor Springs | 55.1% | 29.4%(+25.7)#50 | 33.4%(+21.7)#1,670 |
| 51. | Douglas | 55.0% | 29.4%(+25.6)#51 | 33.4%(+21.6)#1,686 |
| 52. | Wayne | 54.9% | 29.4%(+25.5)#52 | 33.4%(+21.5)#1,691 |
| 53. | Manton | 54.7% | 29.4%(+25.3)#53 | 33.4%(+21.3)#1,718 |
| 54. | L Anse | 54.3% | 29.4%(+24.9)#54 | 33.4%(+20.9)#1,790 |
| 55. | Saugatuck | 53.9% | 29.4%(+24.5)#55 | 33.4%(+20.5)#1,858 |
| 56. | Village Of Clarkston | 53.8% | 29.4%(+24.4)#56 | 33.4%(+20.4)#1,874 |
| 57. | Montrose | 53.5% | 29.4%(+24.1)#57 | 33.4%(+20.1)#1,925 |
| 58. | Ortonville | 53.5% | 29.4%(+24.1)#58 | 33.4%(+20.1)#1,927 |
| 59. | Maple Rapids | 53.5% | 29.4%(+24.1)#59 | 33.4%(+20.1)#1,934 |
| 60. | St James | 53.5% | 29.4%(+24.1)#60 | 33.4%(+20.1)#1,946 |
| 61. | Caspian | 53.3% | 29.4%(+23.9)#61 | 33.4%(+19.9)#1,978 |
| 62. | Williamston | 53.2% | 29.4%(+23.8)#62 | 33.4%(+19.8)#1,991 |
| 63. | Ewen | 53.1% | 29.4%(+23.7)#63 | 33.4%(+19.7)#2,020 |
| 64. | Prescott | 52.9% | 29.4%(+23.5)#64 | 33.4%(+19.5)#2,053 |
| 65. | Walkerville | 52.8% | 29.4%(+23.4)#65 | 33.4%(+19.4)#2,071 |
| 66. | Clio | 52.5% | 29.4%(+23.1)#66 | 33.4%(+19.1)#2,115 |
| 67. | Lawrence | 52.5% | 29.4%(+23.1)#67 | 33.4%(+19.1)#2,126 |
| 68. | Manistique | 52.2% | 29.4%(+22.8)#68 | 33.4%(+18.8)#2,199 |
| 69. | Eagle Harbor | 52.0% | 29.4%(+22.6)#69 | 33.4%(+18.6)#2,242 |
| 70. | Palo | 51.7% | 29.4%(+22.3)#70 | 33.4%(+18.3)#2,272 |
| 71. | Constantine | 51.6% | 29.4%(+22.2)#71 | 33.4%(+18.2)#2,286 |
| 72. | New Baltimore | 51.4% | 29.4%(+22.0)#72 | 33.4%(+18.0)#2,327 |
| 73. | Garden City | 51.3% | 29.4%(+21.9)#73 | 33.4%(+17.9)#2,337 |
| 74. | Marine City | 51.3% | 29.4%(+21.9)#74 | 33.4%(+17.9)#2,349 |
| 75. | Grosse Pointe Park | 51.1% | 29.4%(+21.7)#75 | 33.4%(+17.7)#2,380 |
| 76. | Quincy | 51.1% | 29.4%(+21.7)#76 | 33.4%(+17.7)#2,390 |
| 77. | Merrill | 50.5% | 29.4%(+21.1)#77 | 33.4%(+17.1)#2,500 |
| 78. | Armada | 50.4% | 29.4%(+21.0)#78 | 33.4%(+17.0)#2,528 |
| 79. | St Ignace | 50.2% | 29.4%(+20.8)#79 | 33.4%(+16.8)#2,570 |
| 80. | Suttons Bay | 50.1% | 29.4%(+20.7)#80 | 33.4%(+16.7)#2,596 |
| 81. | Decatur | 50.0% | 29.4%(+20.6)#81 | 33.4%(+16.6)#2,609 |
| 82. | Lake Michigan Beach | 49.6% | 29.4%(+20.2)#82 | 33.4%(+16.2)#2,675 |
| 83. | Beverly Hills | 49.3% | 29.4%(+19.9)#83 | 33.4%(+15.9)#2,742 |
| 84. | Boyne City | 49.3% | 29.4%(+19.9)#84 | 33.4%(+15.9)#2,748 |
| 85. | Trenton | 49.2% | 29.4%(+19.8)#85 | 33.4%(+15.8)#2,765 |
| 86. | Otisville | 49.1% | 29.4%(+19.7)#86 | 33.4%(+15.7)#2,795 |
| 87. | Novi | 48.8% | 29.4%(+19.4)#87 | 33.4%(+15.4)#2,829 |
| 88. | Lake Linden | 48.5% | 29.4%(+19.1)#88 | 33.4%(+15.1)#2,887 |
| 89. | Britton | 48.5% | 29.4%(+19.1)#89 | 33.4%(+15.1)#2,892 |
| 90. | Casnovia | 48.5% | 29.4%(+19.1)#90 | 33.4%(+15.1)#2,900 |
| 91. | North Branch | 48.2% | 29.4%(+18.8)#91 | 33.4%(+14.8)#2,969 |
| 92. | Roscommon | 48.1% | 29.4%(+18.7)#92 | 33.4%(+14.7)#2,987 |
| 93. | Forest Hills | 47.8% | 29.4%(+18.4)#93 | 33.4%(+14.4)#3,025 |
| 94. | East Grand Rapids | 47.3% | 29.4%(+17.9)#94 | 33.4%(+13.9)#3,125 |
| 95. | Charlevoix | 47.2% | 29.4%(+17.8)#95 | 33.4%(+13.8)#3,157 |
| 96. | Romulus | 47.1% | 29.4%(+17.7)#96 | 33.4%(+13.7)#3,171 |
| 97. | Onsted | 47.0% | 29.4%(+17.6)#97 | 33.4%(+13.6)#3,196 |
| 98. | Dearborn Heights | 46.8% | 29.4%(+17.4)#98 | 33.4%(+13.4)#3,210 |
| 99. | Lowell | 46.6% | 29.4%(+17.2)#99 | 33.4%(+13.2)#3,240 |
| 100. | Hastings | 46.3% | 29.4%(+16.9)#100 | 33.4%(+12.9)#3,306 |
Common Questions
What are the Top 10 Cities with the Highest Percentage of Population Walking to Work in Michigan?
Top 10 Cities with the Highest Percentage of Population Walking to Work in Michigan are:
#1
77.1%
#2
76.0%
#3
75.2%
#4
73.5%
#5
72.3%
#6
72.1%
#7
71.4%
#8
71.3%
#9
67.4%
#10
67.2%
What city has the Highest Percentage of Population Walking to Work in Michigan?
Saranac has the Highest Percentage of Population Walking to Work in Michigan with 77.1%.
What is the Percentage of Population Walking to Work in the State of Michigan?
Percentage of Population Walking to Work in Michigan is 29.4%.
What is the Percentage of Population Walking to Work in the United States?
Percentage of Population Walking to Work in the United States is 33.4%.