Palm Desert, CA Map & Demographics
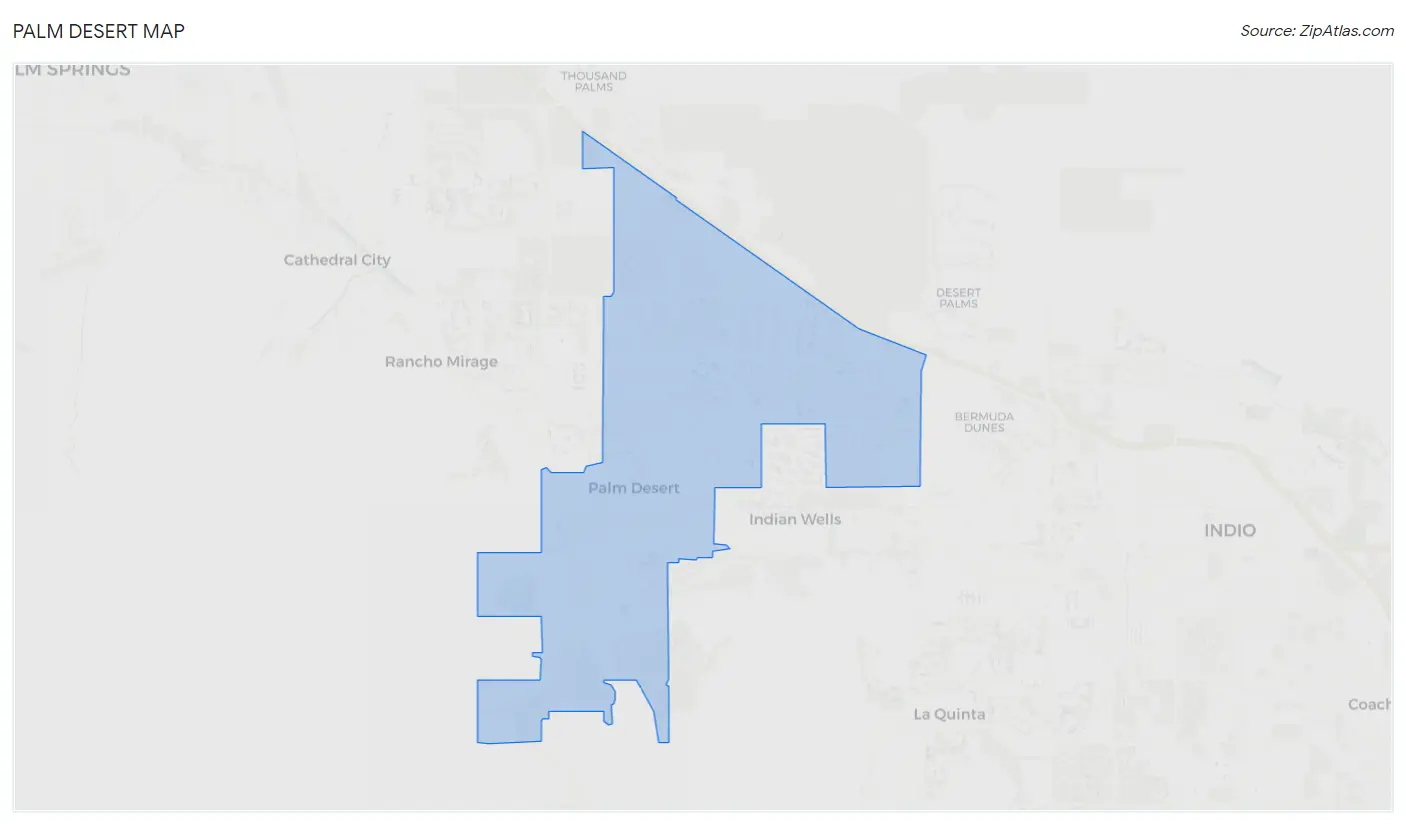
Palm Desert Map
Palm Desert Overview
$55,369
PER CAPITA INCOME
$95,332
AVG FAMILY INCOME
$75,691
AVG HOUSEHOLD INCOME
20.9%
WAGE / INCOME GAP [ % ]
79.1¢/ $1
WAGE / INCOME GAP [ $ ]
$10,526
FAMILY INCOME DEFICIT
0.53
INEQUALITY / GINI INDEX
51,290
TOTAL POPULATION
24,064
MALE POPULATION
27,226
FEMALE POPULATION
88.39
MALES / 100 FEMALES
113.14
FEMALES / 100 MALES
55.2
MEDIAN AGE
2.7
AVG FAMILY SIZE
2.1
AVG HOUSEHOLD SIZE
21,963
LABOR FORCE [ PEOPLE ]
49.1%
PERCENT IN LABOR FORCE
6.5%
UNEMPLOYMENT RATE
Palm Desert Area Codes
Income in Palm Desert
Income Overview in Palm Desert
Per Capita Income in Palm Desert is $55,369, while median incomes of families and households are $95,332 and $75,691 respectively.
| Characteristic | Number | Measure |
| Per Capita Income | 51,290 | $55,369 |
| Median Family Income | 13,639 | $95,332 |
| Mean Family Income | 13,639 | $142,975 |
| Median Household Income | 24,129 | $75,691 |
| Mean Household Income | 24,129 | $115,908 |
| Income Deficit | 13,639 | $10,526 |
| Wage / Income Gap (%) | 51,290 | 20.85% |
| Wage / Income Gap ($) | 51,290 | 79.15¢ per $1 |
| Gini / Inequality Index | 51,290 | 0.53 |
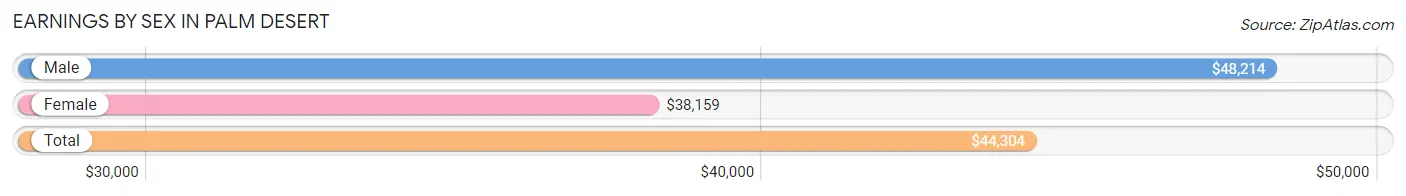
Earnings by Sex in Palm Desert
Average Earnings in Palm Desert are $44,304, $48,214 for men and $38,159 for women, a difference of 20.8%.
| Sex | Number | Average Earnings |
| Male | 12,156 (52.9%) | $48,214 |
| Female | 10,818 (47.1%) | $38,159 |
| Total | 22,974 (100.0%) | $44,304 |
Earnings by Sex by Income Bracket in Palm Desert
The most common earnings brackets in Palm Desert are $100,000+ for men (2,607 | 21.4%) and $100,000+ for women (1,797 | 16.6%).
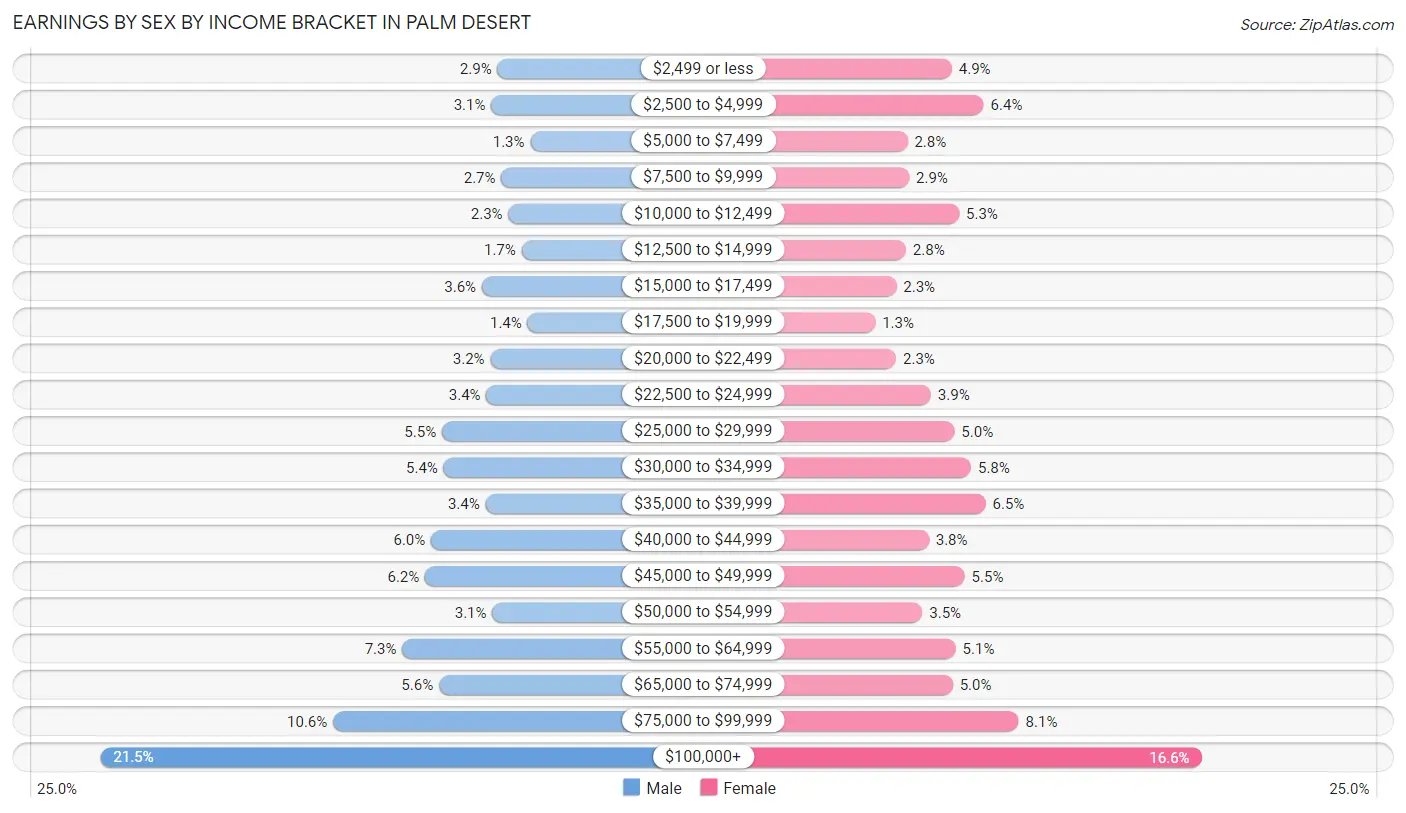
| Income | Male | Female |
| $2,499 or less | 346 (2.9%) | 532 (4.9%) |
| $2,500 to $4,999 | 382 (3.1%) | 693 (6.4%) |
| $5,000 to $7,499 | 159 (1.3%) | 307 (2.8%) |
| $7,500 to $9,999 | 325 (2.7%) | 316 (2.9%) |
| $10,000 to $12,499 | 284 (2.3%) | 569 (5.3%) |
| $12,500 to $14,999 | 209 (1.7%) | 300 (2.8%) |
| $15,000 to $17,499 | 435 (3.6%) | 251 (2.3%) |
| $17,500 to $19,999 | 175 (1.4%) | 144 (1.3%) |
| $20,000 to $22,499 | 387 (3.2%) | 250 (2.3%) |
| $22,500 to $24,999 | 410 (3.4%) | 426 (3.9%) |
| $25,000 to $29,999 | 662 (5.4%) | 545 (5.0%) |
| $30,000 to $34,999 | 653 (5.4%) | 630 (5.8%) |
| $35,000 to $39,999 | 414 (3.4%) | 703 (6.5%) |
| $40,000 to $44,999 | 724 (6.0%) | 415 (3.8%) |
| $45,000 to $49,999 | 758 (6.2%) | 597 (5.5%) |
| $50,000 to $54,999 | 376 (3.1%) | 383 (3.5%) |
| $55,000 to $64,999 | 888 (7.3%) | 552 (5.1%) |
| $65,000 to $74,999 | 680 (5.6%) | 537 (5.0%) |
| $75,000 to $99,999 | 1,282 (10.5%) | 871 (8.1%) |
| $100,000+ | 2,607 (21.4%) | 1,797 (16.6%) |
| Total | 12,156 (100.0%) | 10,818 (100.0%) |
Earnings by Sex by Educational Attainment in Palm Desert
Average earnings in Palm Desert are $53,337 for men and $43,503 for women, a difference of 18.4%. Men with an educational attainment of graduate degree enjoy the highest average annual earnings of $108,664, while those with high school diploma education earn the least with $42,755. Women with an educational attainment of graduate degree earn the most with the average annual earnings of $94,441, while those with less than high school education have the smallest earnings of $24,844.
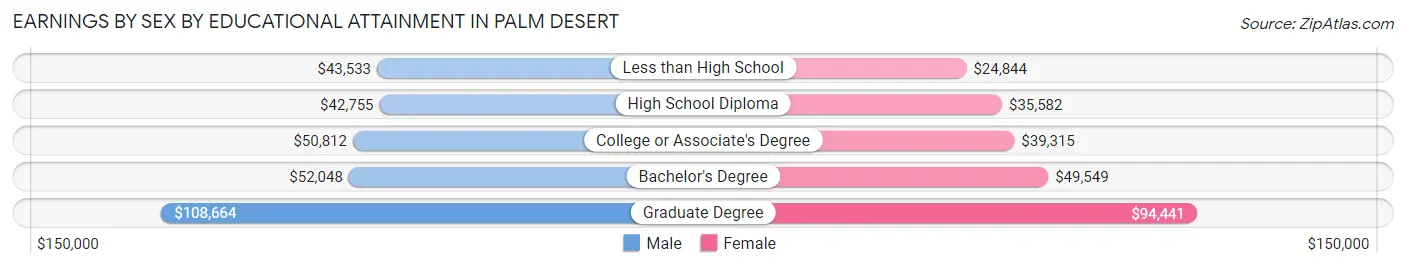
| Educational Attainment | Male Income | Female Income |
| Less than High School | $43,533 | $24,844 |
| High School Diploma | $42,755 | $35,582 |
| College or Associate's Degree | $50,812 | $39,315 |
| Bachelor's Degree | $52,048 | $49,549 |
| Graduate Degree | $108,664 | $94,441 |
| Total | $53,337 | $43,503 |
Family Income in Palm Desert
Family Income Brackets in Palm Desert
According to the Palm Desert family income data, there are 2,660 families falling into the $200,000+ income range, which is the most common income bracket and makes up 19.5% of all families. Conversely, the $10,000 to $14,999 income bracket is the least frequent group with only 218 families (1.6%) belonging to this category.
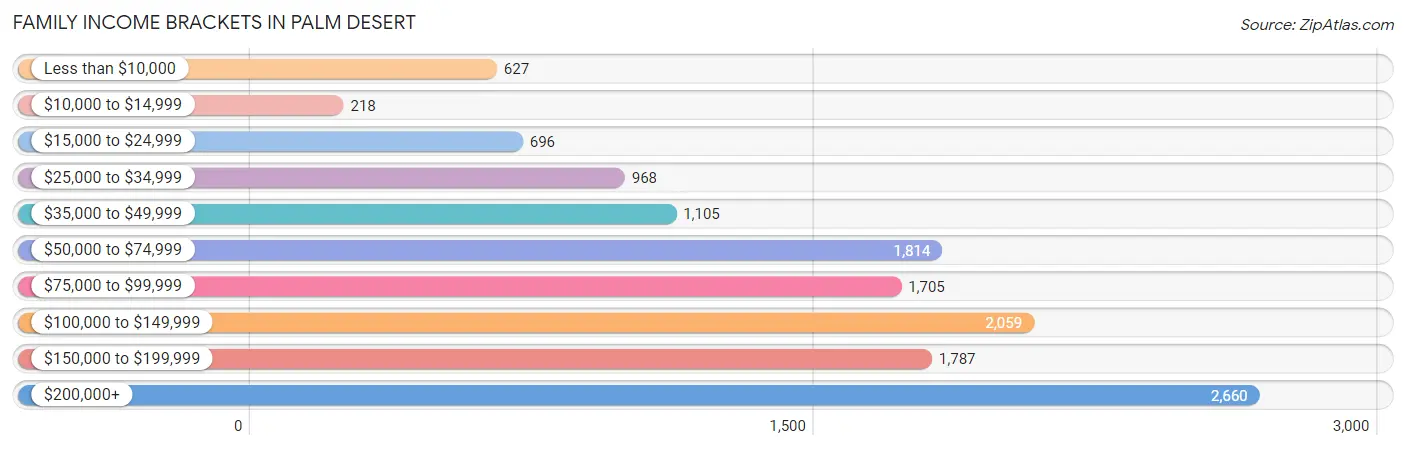
| Income Bracket | # Families | % Families |
| Less than $10,000 | 627 | 4.6% |
| $10,000 to $14,999 | 218 | 1.6% |
| $15,000 to $24,999 | 696 | 5.1% |
| $25,000 to $34,999 | 968 | 7.1% |
| $35,000 to $49,999 | 1,105 | 8.1% |
| $50,000 to $74,999 | 1,814 | 13.3% |
| $75,000 to $99,999 | 1,705 | 12.5% |
| $100,000 to $149,999 | 2,059 | 15.1% |
| $150,000 to $199,999 | 1,787 | 13.1% |
| $200,000+ | 2,660 | 19.5% |
Family Income by Famaliy Size in Palm Desert
6-person families (263 | 1.9%) account for the highest median family income in Palm Desert with $170,707 per family, while 2-person families (9,013 | 66.1%) have the highest median income of $47,424 per family member.
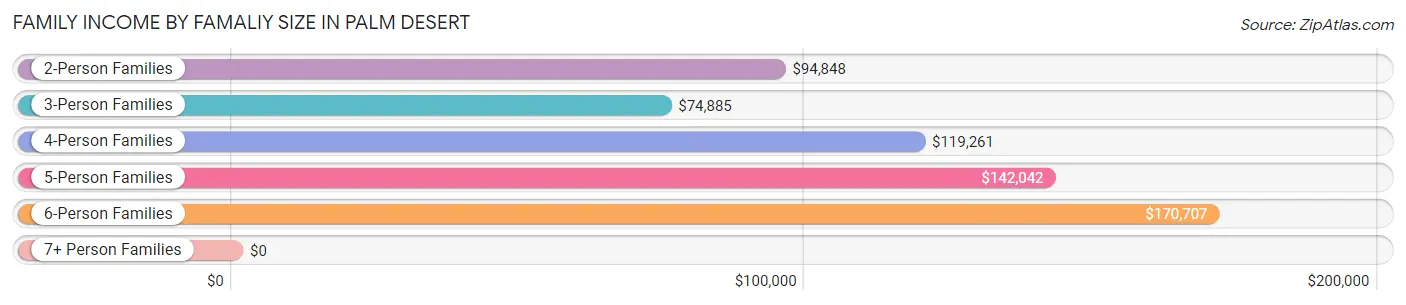
| Income Bracket | # Families | Median Income |
| 2-Person Families | 9,013 (66.1%) | $94,848 |
| 3-Person Families | 2,195 (16.1%) | $74,885 |
| 4-Person Families | 1,457 (10.7%) | $119,261 |
| 5-Person Families | 693 (5.1%) | $142,042 |
| 6-Person Families | 263 (1.9%) | $170,707 |
| 7+ Person Families | 18 (0.1%) | $0 |
| Total | 13,639 (100.0%) | $95,332 |
Family Income by Number of Earners in Palm Desert
The median family income in Palm Desert is $95,332, with families comprising 3+ earners (859) having the highest median family income of $160,707, while families with no earners (4,438) have the lowest median family income of $68,908, accounting for 6.3% and 32.5% of families, respectively.
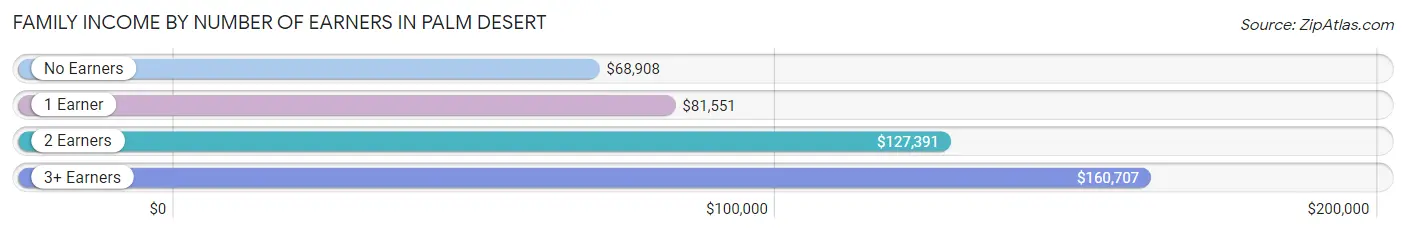
| Number of Earners | # Families | Median Income |
| No Earners | 4,438 (32.5%) | $68,908 |
| 1 Earner | 4,364 (32.0%) | $81,551 |
| 2 Earners | 3,978 (29.2%) | $127,391 |
| 3+ Earners | 859 (6.3%) | $160,707 |
| Total | 13,639 (100.0%) | $95,332 |
Household Income in Palm Desert
Household Income Brackets in Palm Desert
With 3,643 households falling in the category, the $100,000 to $149,999 income range is the most frequent in Palm Desert, accounting for 15.1% of all households. In contrast, only 1,182 households (4.9%) fall into the $10,000 to $14,999 income bracket, making it the least populous group.
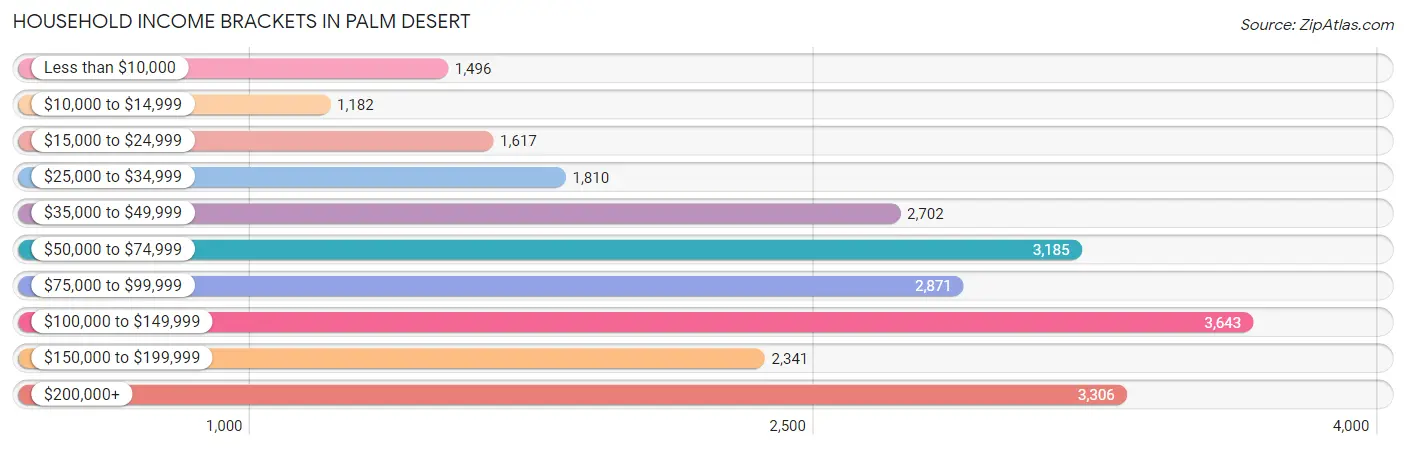
| Income Bracket | # Households | % Households |
| Less than $10,000 | 1,496 | 6.2% |
| $10,000 to $14,999 | 1,182 | 4.9% |
| $15,000 to $24,999 | 1,617 | 6.7% |
| $25,000 to $34,999 | 1,810 | 7.5% |
| $35,000 to $49,999 | 2,702 | 11.2% |
| $50,000 to $74,999 | 3,185 | 13.2% |
| $75,000 to $99,999 | 2,871 | 11.9% |
| $100,000 to $149,999 | 3,643 | 15.1% |
| $150,000 to $199,999 | 2,341 | 9.7% |
| $200,000+ | 3,306 | 13.7% |
Household Income by Householder Age in Palm Desert
The median household income in Palm Desert is $75,691, with the highest median household income of $85,867 found in the 45 to 64 years age bracket for the primary householder. A total of 6,692 households (27.7%) fall into this category. Meanwhile, the 15 to 24 years age bracket for the primary householder has the lowest median household income of $42,143, with 382 households (1.6%) in this group.
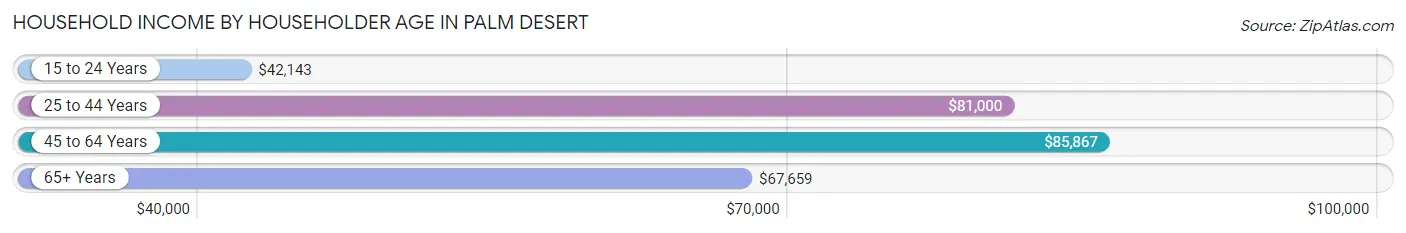
| Income Bracket | # Households | Median Income |
| 15 to 24 Years | 382 (1.6%) | $42,143 |
| 25 to 44 Years | 5,314 (22.0%) | $81,000 |
| 45 to 64 Years | 6,692 (27.7%) | $85,867 |
| 65+ Years | 11,741 (48.7%) | $67,659 |
| Total | 24,129 (100.0%) | $75,691 |
Poverty in Palm Desert
Income Below Poverty by Sex and Age in Palm Desert
With 11.4% poverty level for males and 14.3% for females among the residents of Palm Desert, 12 to 14 year old males and under 5 year old females are the most vulnerable to poverty, with 106 males (23.4%) and 221 females (24.6%) in their respective age groups living below the poverty level.
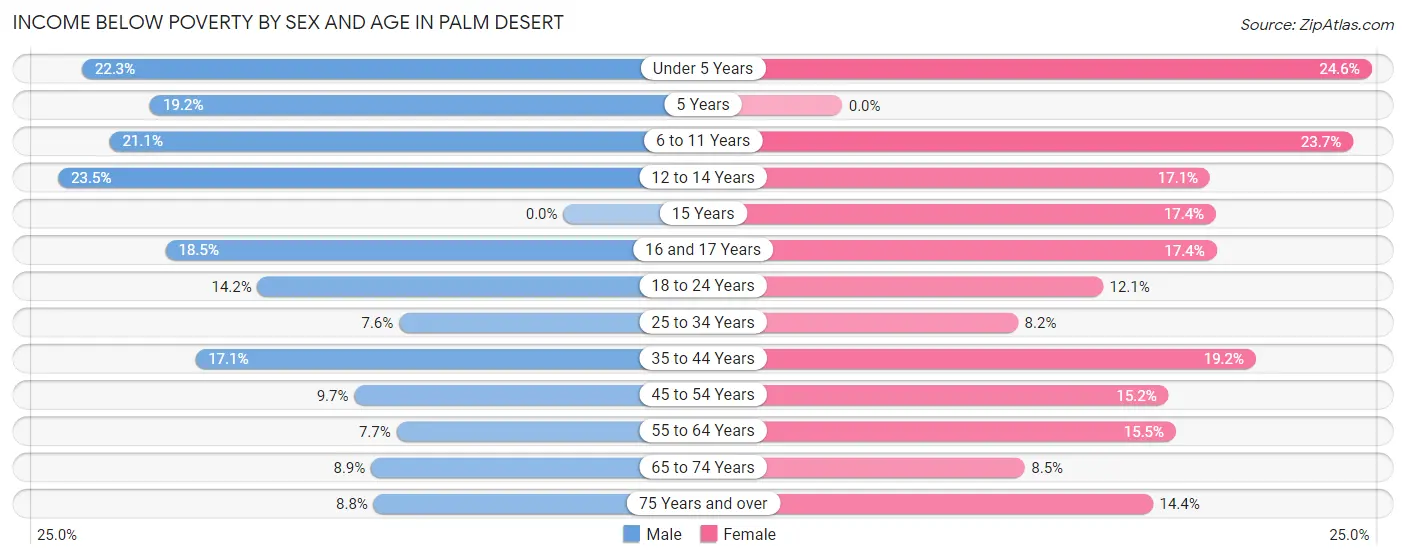
| Age Bracket | Male | Female |
| Under 5 Years | 147 (22.3%) | 221 (24.6%) |
| 5 Years | 28 (19.2%) | 0 (0.0%) |
| 6 to 11 Years | 323 (21.1%) | 348 (23.7%) |
| 12 to 14 Years | 106 (23.4%) | 130 (17.1%) |
| 15 Years | 0 (0.0%) | 42 (17.4%) |
| 16 and 17 Years | 48 (18.5%) | 84 (17.4%) |
| 18 to 24 Years | 230 (14.2%) | 187 (12.1%) |
| 25 to 34 Years | 207 (7.6%) | 192 (8.2%) |
| 35 to 44 Years | 471 (17.1%) | 455 (19.2%) |
| 45 to 54 Years | 202 (9.7%) | 417 (15.2%) |
| 55 to 64 Years | 273 (7.7%) | 569 (15.5%) |
| 65 to 74 Years | 334 (8.9%) | 412 (8.5%) |
| 75 Years and over | 364 (8.8%) | 796 (14.4%) |
| Total | 2,733 (11.4%) | 3,853 (14.3%) |
Income Above Poverty by Sex and Age in Palm Desert
According to the poverty statistics in Palm Desert, males aged 15 years and females aged 5 years are the age groups that are most secure financially, with 100.0% of males and 100.0% of females in these age groups living above the poverty line.
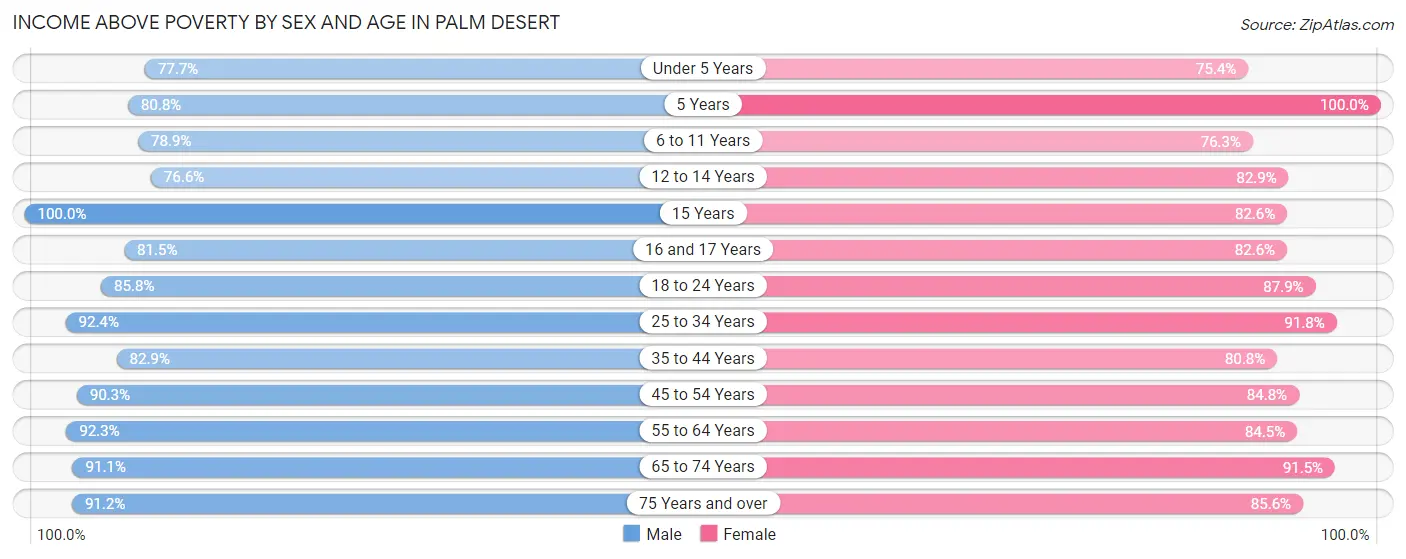
| Age Bracket | Male | Female |
| Under 5 Years | 511 (77.7%) | 678 (75.4%) |
| 5 Years | 118 (80.8%) | 64 (100.0%) |
| 6 to 11 Years | 1,211 (78.9%) | 1,119 (76.3%) |
| 12 to 14 Years | 346 (76.5%) | 631 (82.9%) |
| 15 Years | 288 (100.0%) | 200 (82.6%) |
| 16 and 17 Years | 212 (81.5%) | 399 (82.6%) |
| 18 to 24 Years | 1,391 (85.8%) | 1,359 (87.9%) |
| 25 to 34 Years | 2,510 (92.4%) | 2,161 (91.8%) |
| 35 to 44 Years | 2,287 (82.9%) | 1,913 (80.8%) |
| 45 to 54 Years | 1,880 (90.3%) | 2,334 (84.8%) |
| 55 to 64 Years | 3,252 (92.3%) | 3,102 (84.5%) |
| 65 to 74 Years | 3,412 (91.1%) | 4,453 (91.5%) |
| 75 Years and over | 3,771 (91.2%) | 4,723 (85.6%) |
| Total | 21,189 (88.6%) | 23,136 (85.7%) |
Income Below Poverty Among Married-Couple Families in Palm Desert
The poverty statistics for married-couple families in Palm Desert show that 5.3% or 554 of the total 10,402 families live below the poverty line. Families with 3 or 4 children have the highest poverty rate of 18.6%, comprising of 57 families. On the other hand, families with 1 or 2 children have the lowest poverty rate of 4.6%, which includes 93 families.
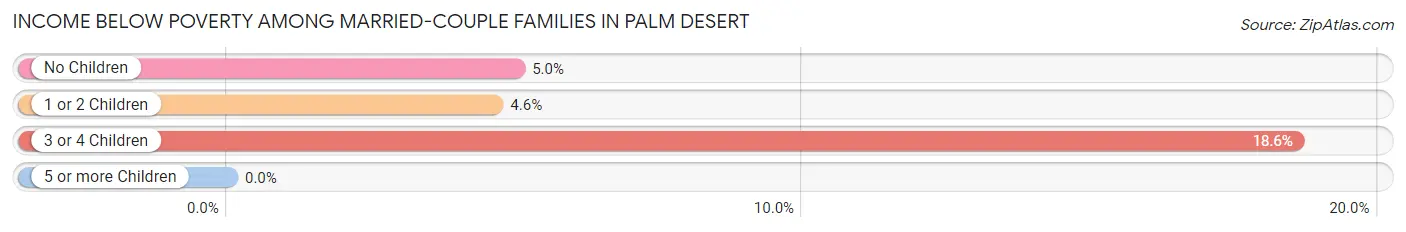
| Children | Above Poverty | Below Poverty |
| No Children | 7,677 (95.0%) | 404 (5.0%) |
| 1 or 2 Children | 1,921 (95.4%) | 93 (4.6%) |
| 3 or 4 Children | 250 (81.4%) | 57 (18.6%) |
| 5 or more Children | 0 (0.0%) | 0 (0.0%) |
| Total | 9,848 (94.7%) | 554 (5.3%) |
Income Below Poverty Among Single-Parent Households in Palm Desert
According to the poverty data in Palm Desert, 11.3% or 82 single-father households and 26.9% or 675 single-mother households are living below the poverty line. Among single-father households, those with 1 or 2 children have the highest poverty rate, with 82 households (21.2%) experiencing poverty. Likewise, among single-mother households, those with 3 or 4 children have the highest poverty rate, with 58 households (100.0%) falling below the poverty line.
| Children | Single Father | Single Mother |
| No Children | 0 (0.0%) | 136 (12.1%) |
| 1 or 2 Children | 82 (21.2%) | 481 (37.3%) |
| 3 or 4 Children | 0 (0.0%) | 58 (100.0%) |
| 5 or more Children | 0 (0.0%) | 0 (0.0%) |
| Total | 82 (11.3%) | 675 (26.9%) |
Income Below Poverty Among Married-Couple vs Single-Parent Households in Palm Desert
The poverty data for Palm Desert shows that 554 of the married-couple family households (5.3%) and 757 of the single-parent households (23.4%) are living below the poverty level. Within the married-couple family households, those with 3 or 4 children have the highest poverty rate, with 57 households (18.6%) falling below the poverty line. Among the single-parent households, those with 3 or 4 children have the highest poverty rate, with 58 household (63.7%) living below poverty.
| Children | Married-Couple Families | Single-Parent Households |
| No Children | 404 (5.0%) | 136 (9.5%) |
| 1 or 2 Children | 93 (4.6%) | 563 (33.6%) |
| 3 or 4 Children | 57 (18.6%) | 58 (63.7%) |
| 5 or more Children | 0 (0.0%) | 0 (0.0%) |
| Total | 554 (5.3%) | 757 (23.4%) |
Race in Palm Desert
The most populous races in Palm Desert are White / Caucasian (36,332 | 70.8%), Hispanic or Latino (12,302 | 24.0%), and Two or more Races (6,855 | 13.4%).
| Race | # Population | % Population |
| Asian | 2,225 | 4.3% |
| Black / African American | 1,478 | 2.9% |
| Hawaiian / Pacific | 136 | 0.3% |
| Hispanic or Latino | 12,302 | 24.0% |
| Native / Alaskan | 344 | 0.7% |
| White / Caucasian | 36,332 | 70.8% |
| Two or more Races | 6,855 | 13.4% |
| Some other Race | 3,920 | 7.6% |
| Total | 51,290 | 100.0% |
Ancestry in Palm Desert
The most populous ancestries reported in Palm Desert are Mexican (9,788 | 19.1%), English (6,124 | 11.9%), German (6,039 | 11.8%), Irish (5,447 | 10.6%), and Italian (3,032 | 5.9%), together accounting for 59.3% of all Palm Desert residents.
| Ancestry | # Population | % Population |
| African | 152 | 0.3% |
| Albanian | 46 | 0.1% |
| American | 2,996 | 5.8% |
| Arab | 370 | 0.7% |
| Argentinean | 74 | 0.1% |
| Armenian | 75 | 0.2% |
| Assyrian / Chaldean / Syriac | 7 | 0.0% |
| Australian | 41 | 0.1% |
| Austrian | 177 | 0.4% |
| Basque | 9 | 0.0% |
| Belgian | 48 | 0.1% |
| Bhutanese | 484 | 0.9% |
| Blackfeet | 306 | 0.6% |
| Brazilian | 61 | 0.1% |
| British | 248 | 0.5% |
| Bulgarian | 177 | 0.4% |
| Burmese | 333 | 0.6% |
| Cambodian | 19 | 0.0% |
| Canadian | 350 | 0.7% |
| Cape Verdean | 7 | 0.0% |
| Central American | 434 | 0.9% |
| Central American Indian | 27 | 0.1% |
| Cherokee | 450 | 0.9% |
| Chickasaw | 6 | 0.0% |
| Chilean | 20 | 0.0% |
| Colombian | 82 | 0.2% |
| Costa Rican | 16 | 0.0% |
| Cree | 10 | 0.0% |
| Croatian | 76 | 0.2% |
| Cuban | 203 | 0.4% |
| Cypriot | 9 | 0.0% |
| Czech | 221 | 0.4% |
| Czechoslovakian | 48 | 0.1% |
| Danish | 778 | 1.5% |
| Dutch | 429 | 0.8% |
| Eastern European | 226 | 0.4% |
| Ecuadorian | 29 | 0.1% |
| Egyptian | 183 | 0.4% |
| English | 6,124 | 11.9% |
| European | 1,309 | 2.5% |
| Filipino | 26 | 0.1% |
| Finnish | 85 | 0.2% |
| French | 1,396 | 2.7% |
| French American Indian | 19 | 0.0% |
| French Canadian | 243 | 0.5% |
| German | 6,039 | 11.8% |
| Greek | 406 | 0.8% |
| Guamanian / Chamorro | 44 | 0.1% |
| Guatemalan | 43 | 0.1% |
| Honduran | 63 | 0.1% |
| Hungarian | 398 | 0.8% |
| Indian (Asian) | 587 | 1.1% |
| Indonesian | 57 | 0.1% |
| Iranian | 185 | 0.4% |
| Irish | 5,447 | 10.6% |
| Israeli | 50 | 0.1% |
| Italian | 3,032 | 5.9% |
| Jordanian | 19 | 0.0% |
| Kiowa | 27 | 0.1% |
| Korean | 1,279 | 2.5% |
| Latvian | 8 | 0.0% |
| Lebanese | 95 | 0.2% |
| Lithuanian | 143 | 0.3% |
| Luxembourger | 9 | 0.0% |
| Macedonian | 87 | 0.2% |
| Malaysian | 20 | 0.0% |
| Mexican | 9,788 | 19.1% |
| Mexican American Indian | 89 | 0.2% |
| Native Hawaiian | 58 | 0.1% |
| Navajo | 52 | 0.1% |
| Nicaraguan | 77 | 0.2% |
| Nigerian | 79 | 0.2% |
| Northern European | 71 | 0.1% |
| Norwegian | 1,012 | 2.0% |
| Pakistani | 119 | 0.2% |
| Palestinian | 44 | 0.1% |
| Panamanian | 19 | 0.0% |
| Pennsylvania German | 7 | 0.0% |
| Peruvian | 128 | 0.3% |
| Polish | 1,099 | 2.1% |
| Portuguese | 143 | 0.3% |
| Puerto Rican | 435 | 0.9% |
| Romanian | 103 | 0.2% |
| Russian | 832 | 1.6% |
| Salvadoran | 216 | 0.4% |
| Samoan | 62 | 0.1% |
| Scandinavian | 213 | 0.4% |
| Scotch-Irish | 465 | 0.9% |
| Scottish | 1,497 | 2.9% |
| Serbian | 31 | 0.1% |
| Slavic | 27 | 0.1% |
| Slovak | 16 | 0.0% |
| Slovene | 24 | 0.1% |
| South American | 405 | 0.8% |
| Spaniard | 228 | 0.4% |
| Spanish | 214 | 0.4% |
| Spanish American | 6 | 0.0% |
| Sri Lankan | 358 | 0.7% |
| Subsaharan African | 245 | 0.5% |
| Swedish | 1,060 | 2.1% |
| Swiss | 248 | 0.5% |
| Thai | 362 | 0.7% |
| Trinidadian and Tobagonian | 49 | 0.1% |
| Turkish | 105 | 0.2% |
| Ukrainian | 182 | 0.4% |
| Venezuelan | 72 | 0.1% |
| Welsh | 276 | 0.5% |
| West Indian | 14 | 0.0% |
| Yaqui | 21 | 0.0% |
| Yugoslavian | 102 | 0.2% |
| Yuman | 17 | 0.0% | View All 111 Rows |
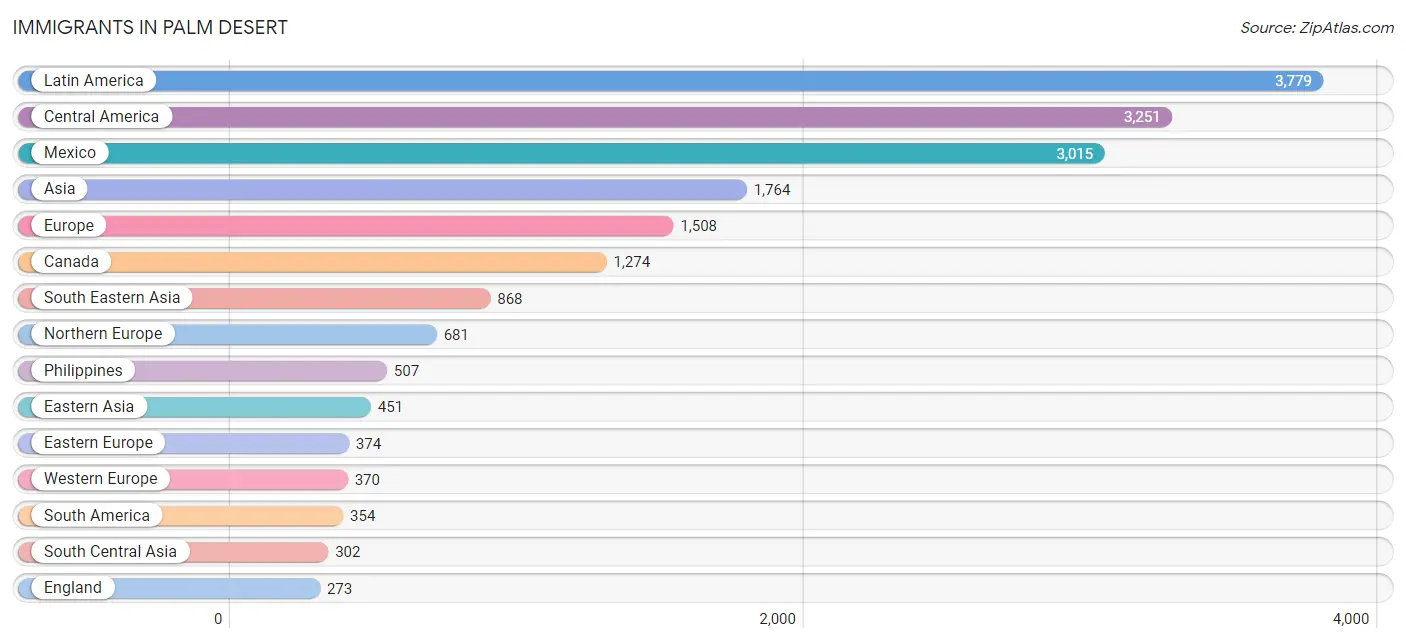
Immigrants in Palm Desert
The most numerous immigrant groups reported in Palm Desert came from Latin America (3,779 | 7.4%), Central America (3,251 | 6.3%), Mexico (3,015 | 5.9%), Asia (1,764 | 3.4%), and Europe (1,508 | 2.9%), together accounting for 26.0% of all Palm Desert residents.
| Immigration Origin | # Population | % Population |
| Africa | 246 | 0.5% |
| Argentina | 81 | 0.2% |
| Asia | 1,764 | 3.4% |
| Australia | 18 | 0.0% |
| Austria | 64 | 0.1% |
| Belarus | 9 | 0.0% |
| Belize | 31 | 0.1% |
| Bosnia and Herzegovina | 48 | 0.1% |
| Brazil | 19 | 0.0% |
| Bulgaria | 93 | 0.2% |
| Canada | 1,274 | 2.5% |
| Caribbean | 174 | 0.3% |
| Central America | 3,251 | 6.3% |
| Chile | 20 | 0.0% |
| China | 189 | 0.4% |
| Colombia | 53 | 0.1% |
| Costa Rica | 37 | 0.1% |
| Croatia | 14 | 0.0% |
| Cuba | 137 | 0.3% |
| Czechoslovakia | 14 | 0.0% |
| Denmark | 9 | 0.0% |
| Eastern Africa | 5 | 0.0% |
| Eastern Asia | 451 | 0.9% |
| Eastern Europe | 374 | 0.7% |
| Egypt | 174 | 0.3% |
| El Salvador | 52 | 0.1% |
| England | 273 | 0.5% |
| Europe | 1,508 | 2.9% |
| France | 68 | 0.1% |
| Germany | 205 | 0.4% |
| Greece | 18 | 0.0% |
| Guatemala | 25 | 0.1% |
| Haiti | 11 | 0.0% |
| Honduras | 72 | 0.1% |
| Hong Kong | 9 | 0.0% |
| India | 160 | 0.3% |
| Indonesia | 43 | 0.1% |
| Iran | 113 | 0.2% |
| Ireland | 40 | 0.1% |
| Israel | 20 | 0.0% |
| Italy | 57 | 0.1% |
| Japan | 142 | 0.3% |
| Jordan | 19 | 0.0% |
| Korea | 101 | 0.2% |
| Laos | 20 | 0.0% |
| Latin America | 3,779 | 7.4% |
| Lithuania | 14 | 0.0% |
| Mexico | 3,015 | 5.9% |
| Netherlands | 8 | 0.0% |
| Nigeria | 24 | 0.1% |
| Northern Africa | 187 | 0.4% |
| Northern Europe | 681 | 1.3% |
| Norway | 7 | 0.0% |
| Oceania | 18 | 0.0% |
| Panama | 19 | 0.0% |
| Peru | 165 | 0.3% |
| Philippines | 507 | 1.0% |
| Poland | 75 | 0.2% |
| Romania | 11 | 0.0% |
| Russia | 33 | 0.1% |
| Scotland | 101 | 0.2% |
| Singapore | 10 | 0.0% |
| South Africa | 30 | 0.1% |
| South America | 354 | 0.7% |
| South Central Asia | 302 | 0.6% |
| South Eastern Asia | 868 | 1.7% |
| Southern Europe | 83 | 0.2% |
| Spain | 3 | 0.0% |
| Sri Lanka | 29 | 0.1% |
| Sweden | 63 | 0.1% |
| Switzerland | 25 | 0.1% |
| Syria | 19 | 0.0% |
| Taiwan | 41 | 0.1% |
| Thailand | 74 | 0.1% |
| Trinidad and Tobago | 26 | 0.1% |
| Turkey | 43 | 0.1% |
| Ukraine | 26 | 0.1% |
| Venezuela | 16 | 0.0% |
| Vietnam | 175 | 0.3% |
| Western Africa | 24 | 0.1% |
| Western Asia | 130 | 0.3% |
| Western Europe | 370 | 0.7% |
| Zimbabwe | 5 | 0.0% | View All 83 Rows |
Sex and Age in Palm Desert
Sex and Age in Palm Desert
The most populous age groups in Palm Desert are 60 to 64 Years (2,199 | 9.1%) for men and 70 to 74 Years (2,473 | 9.1%) for women.
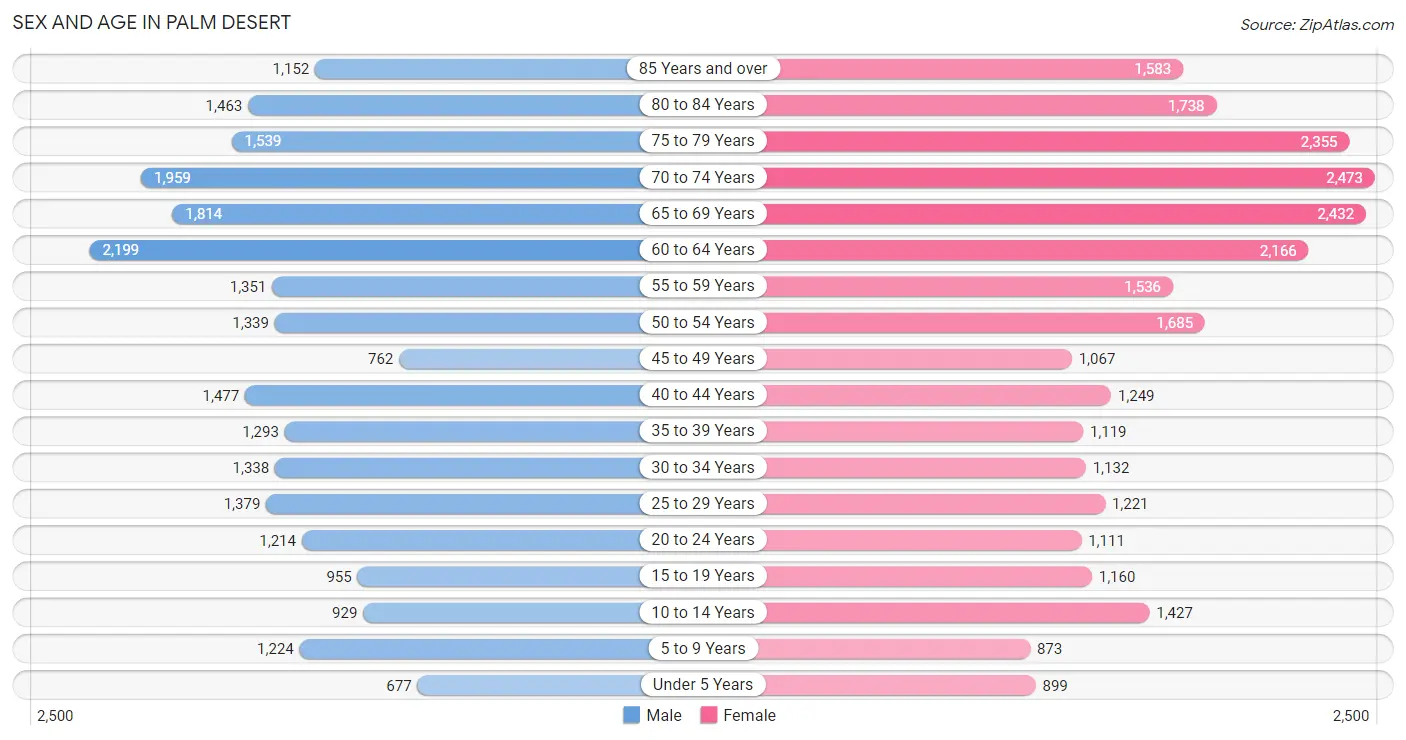
| Age Bracket | Male | Female |
| Under 5 Years | 677 (2.8%) | 899 (3.3%) |
| 5 to 9 Years | 1,224 (5.1%) | 873 (3.2%) |
| 10 to 14 Years | 929 (3.9%) | 1,427 (5.2%) |
| 15 to 19 Years | 955 (4.0%) | 1,160 (4.3%) |
| 20 to 24 Years | 1,214 (5.0%) | 1,111 (4.1%) |
| 25 to 29 Years | 1,379 (5.7%) | 1,221 (4.5%) |
| 30 to 34 Years | 1,338 (5.6%) | 1,132 (4.2%) |
| 35 to 39 Years | 1,293 (5.4%) | 1,119 (4.1%) |
| 40 to 44 Years | 1,477 (6.1%) | 1,249 (4.6%) |
| 45 to 49 Years | 762 (3.2%) | 1,067 (3.9%) |
| 50 to 54 Years | 1,339 (5.6%) | 1,685 (6.2%) |
| 55 to 59 Years | 1,351 (5.6%) | 1,536 (5.6%) |
| 60 to 64 Years | 2,199 (9.1%) | 2,166 (8.0%) |
| 65 to 69 Years | 1,814 (7.5%) | 2,432 (8.9%) |
| 70 to 74 Years | 1,959 (8.1%) | 2,473 (9.1%) |
| 75 to 79 Years | 1,539 (6.4%) | 2,355 (8.6%) |
| 80 to 84 Years | 1,463 (6.1%) | 1,738 (6.4%) |
| 85 Years and over | 1,152 (4.8%) | 1,583 (5.8%) |
| Total | 24,064 (100.0%) | 27,226 (100.0%) |
Families and Households in Palm Desert
Median Family Size in Palm Desert
The median family size in Palm Desert is 2.73 persons per family, with married-couple families (10,402 | 76.3%) accounting for the largest median family size of 2.74 persons per family. On the other hand, single male/father families (727 | 5.3%) represent the smallest median family size with 2.65 persons per family.
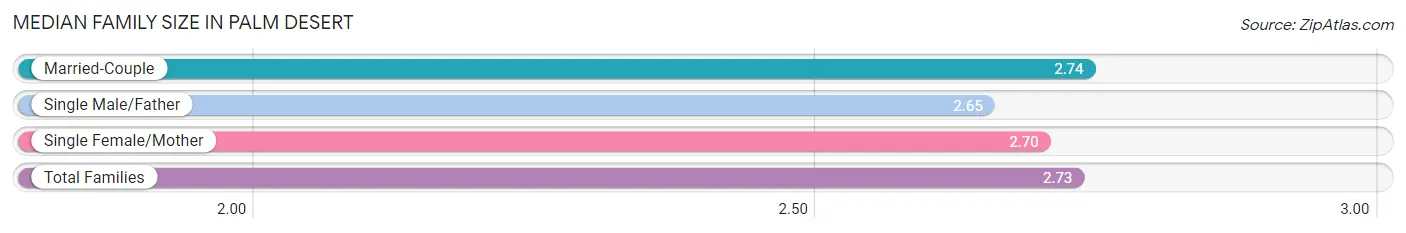
| Family Type | # Families | Family Size |
| Married-Couple | 10,402 (76.3%) | 2.74 |
| Single Male/Father | 727 (5.3%) | 2.65 |
| Single Female/Mother | 2,510 (18.4%) | 2.70 |
| Total Families | 13,639 (100.0%) | 2.73 |
Median Household Size in Palm Desert
The median household size in Palm Desert is 2.11 persons per household, with single male/father households (727 | 3.0%) accounting for the largest median household size of 3.02 persons per household. non-family households (10,490 | 43.5%) represent the smallest median household size with 1.23 persons per household.
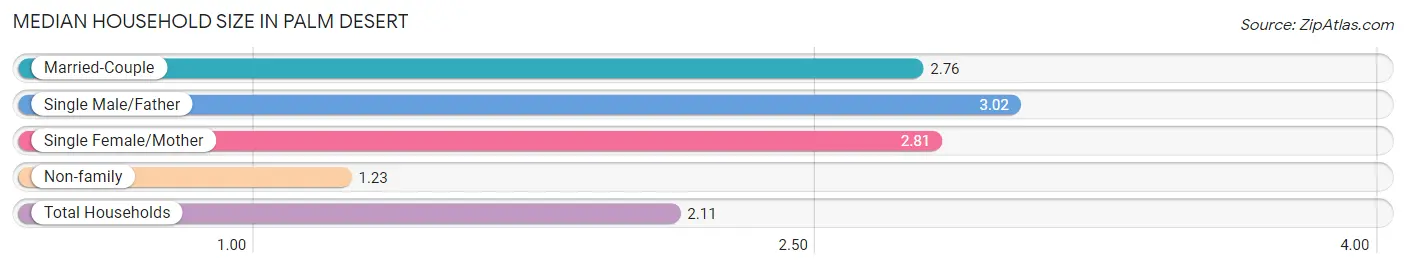
| Household Type | # Households | Household Size |
| Married-Couple | 10,402 (43.1%) | 2.76 |
| Single Male/Father | 727 (3.0%) | 3.02 |
| Single Female/Mother | 2,510 (10.4%) | 2.81 |
| Non-family | 10,490 (43.5%) | 1.23 |
| Total Households | 24,129 (100.0%) | 2.11 |
Household Size by Marriage Status in Palm Desert
Out of a total of 24,129 households in Palm Desert, 13,639 (56.5%) are family households, while 10,490 (43.5%) are nonfamily households. The most numerous type of family households are 2-person households, comprising 8,744, and the most common type of nonfamily households are 1-person households, comprising 8,426.
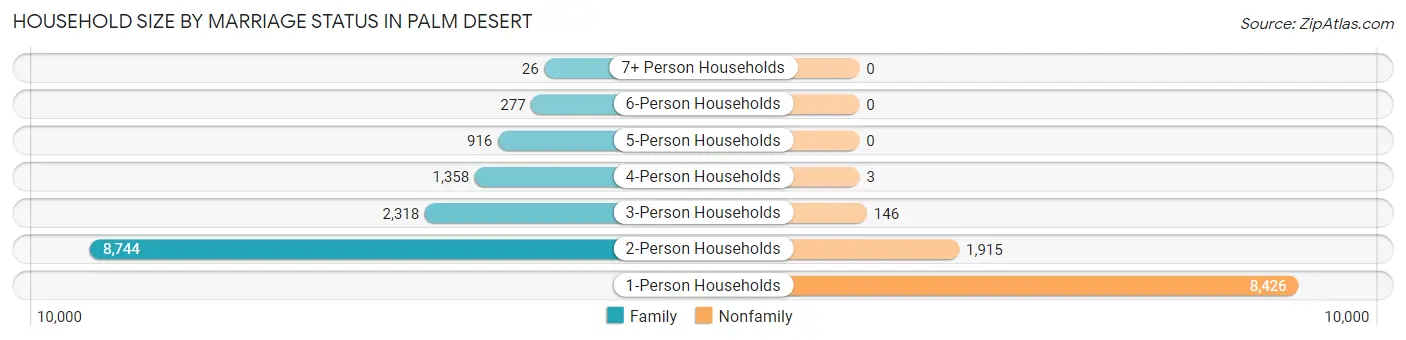
| Household Size | Family Households | Nonfamily Households |
| 1-Person Households | - | 8,426 (34.9%) |
| 2-Person Households | 8,744 (36.2%) | 1,915 (7.9%) |
| 3-Person Households | 2,318 (9.6%) | 146 (0.6%) |
| 4-Person Households | 1,358 (5.6%) | 3 (0.0%) |
| 5-Person Households | 916 (3.8%) | 0 (0.0%) |
| 6-Person Households | 277 (1.1%) | 0 (0.0%) |
| 7+ Person Households | 26 (0.1%) | 0 (0.0%) |
| Total | 13,639 (56.5%) | 10,490 (43.5%) |
Female Fertility in Palm Desert
Fertility by Age in Palm Desert
Average fertility rate in Palm Desert is 24.0 births per 1,000 women. Women in the age bracket of 20 to 34 years have the highest fertility rate with 59.0 births per 1,000 women. Women in the age bracket of 20 to 34 years acount for 100.0% of all women with births.
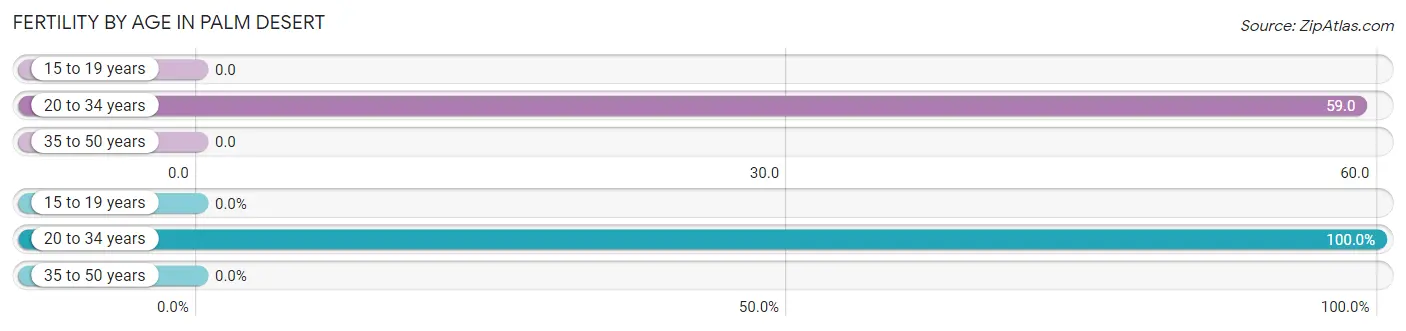
| Age Bracket | Women with Births | Births / 1,000 Women |
| 15 to 19 years | 0 (0.0%) | 0.0 |
| 20 to 34 years | 206 (100.0%) | 59.0 |
| 35 to 50 years | 0 (0.0%) | 0.0 |
| Total | 206 (100.0%) | 24.0 |
Fertility by Age by Marriage Status in Palm Desert
69.9% of women with births (206) in Palm Desert are married. The highest percentage of unmarried women with births falls into 20 to 34 years age bracket with 30.1% of them unmarried at the time of birth, while the lowest percentage of unmarried women with births belong to 20 to 34 years age bracket with 30.1% of them unmarried.
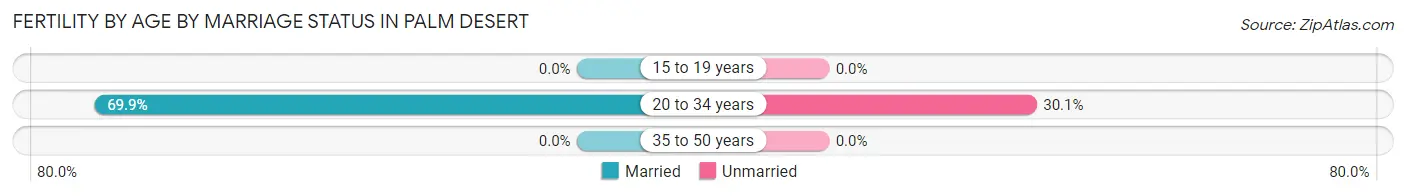
| Age Bracket | Married | Unmarried |
| 15 to 19 years | 0 (0.0%) | 0 (0.0%) |
| 20 to 34 years | 144 (69.9%) | 62 (30.1%) |
| 35 to 50 years | 0 (0.0%) | 0 (0.0%) |
| Total | 144 (69.9%) | 62 (30.1%) |
Fertility by Education in Palm Desert
Average fertility rate in Palm Desert is 24.0 births per 1,000 women. Women with the education attainment of college or associate's degree have the highest fertility rate of 29.0 births per 1,000 women, while women with the education attainment of graduate degree have the lowest fertility at 12.0 births per 1,000 women. Women with the education attainment of college or associate's degree represent 45.6% of all women with births.
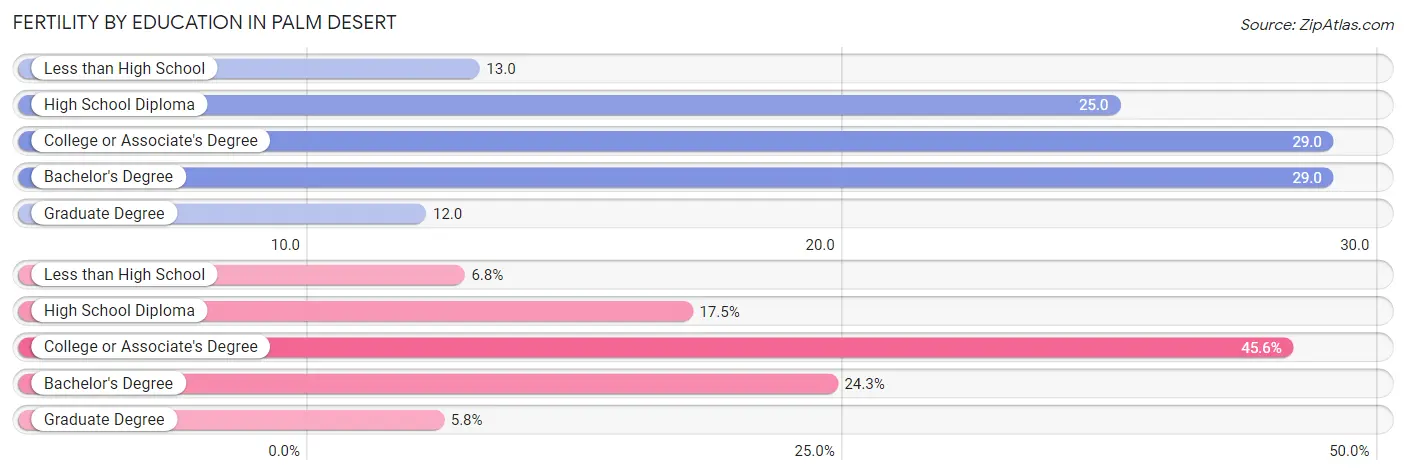
| Educational Attainment | Women with Births | Births / 1,000 Women |
| Less than High School | 14 (6.8%) | 13.0 |
| High School Diploma | 36 (17.5%) | 25.0 |
| College or Associate's Degree | 94 (45.6%) | 29.0 |
| Bachelor's Degree | 50 (24.3%) | 29.0 |
| Graduate Degree | 12 (5.8%) | 12.0 |
| Total | 206 (100.0%) | 24.0 |
Fertility by Education by Marriage Status in Palm Desert
30.1% of women with births in Palm Desert are unmarried. Women with the educational attainment of less than high school are most likely to be married with 100.0% of them married at childbirth, while women with the educational attainment of high school diploma are least likely to be married with 77.8% of them unmarried at childbirth.
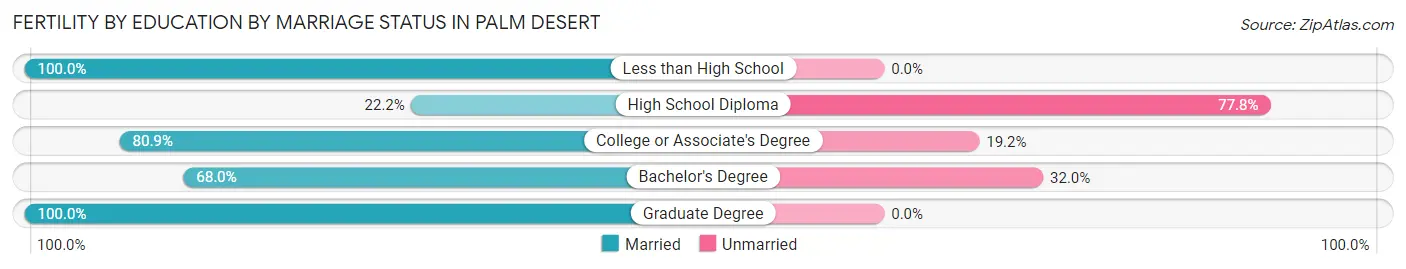
| Educational Attainment | Married | Unmarried |
| Less than High School | 14 (100.0%) | 0 (0.0%) |
| High School Diploma | 8 (22.2%) | 28 (77.8%) |
| College or Associate's Degree | 76 (80.8%) | 18 (19.2%) |
| Bachelor's Degree | 34 (68.0%) | 16 (32.0%) |
| Graduate Degree | 12 (100.0%) | 0 (0.0%) |
| Total | 144 (69.9%) | 62 (30.1%) |
Employment Characteristics in Palm Desert
Employment by Class of Employer in Palm Desert
Among the 20,022 employed individuals in Palm Desert, private company employees (12,070 | 60.3%), self-employed (not incorporated) (2,634 | 13.2%), and not-for-profit organizations (1,876 | 9.4%) make up the most common classes of employment.
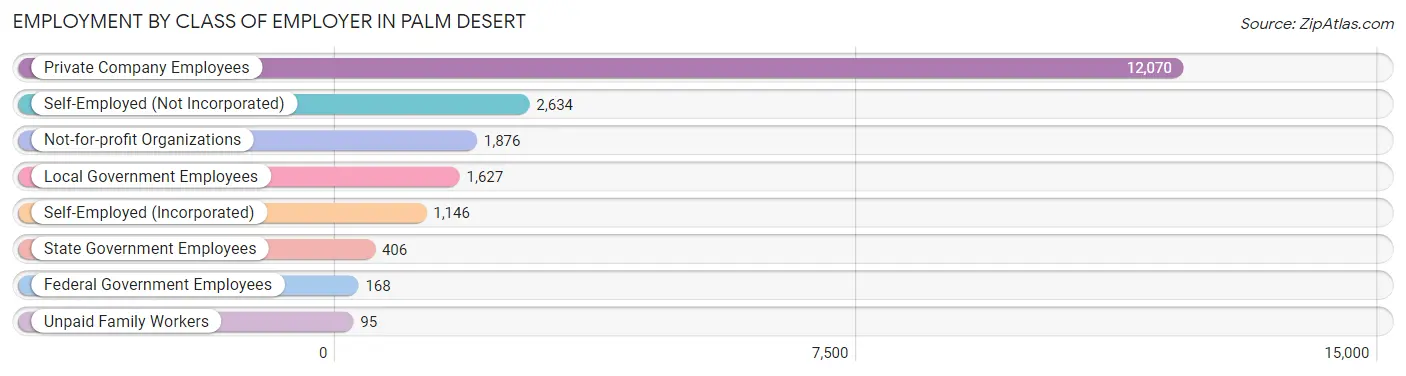
| Employer Class | # Employees | % Employees |
| Private Company Employees | 12,070 | 60.3% |
| Self-Employed (Incorporated) | 1,146 | 5.7% |
| Self-Employed (Not Incorporated) | 2,634 | 13.2% |
| Not-for-profit Organizations | 1,876 | 9.4% |
| Local Government Employees | 1,627 | 8.1% |
| State Government Employees | 406 | 2.0% |
| Federal Government Employees | 168 | 0.8% |
| Unpaid Family Workers | 95 | 0.5% |
| Total | 20,022 | 100.0% |
Employment Status by Age in Palm Desert
According to the labor force statistics for Palm Desert, out of the total population over 16 years of age (44,731), 49.1% or 21,963 individuals are in the labor force, with 6.5% or 1,428 of them unemployed. The age group with the highest labor force participation rate is 30 to 34 years, with 91.5% or 2,260 individuals in the labor force. Within the labor force, the 16 to 19 years age range has the highest percentage of unemployed individuals, with 16.2% or 54 of them being unemployed.
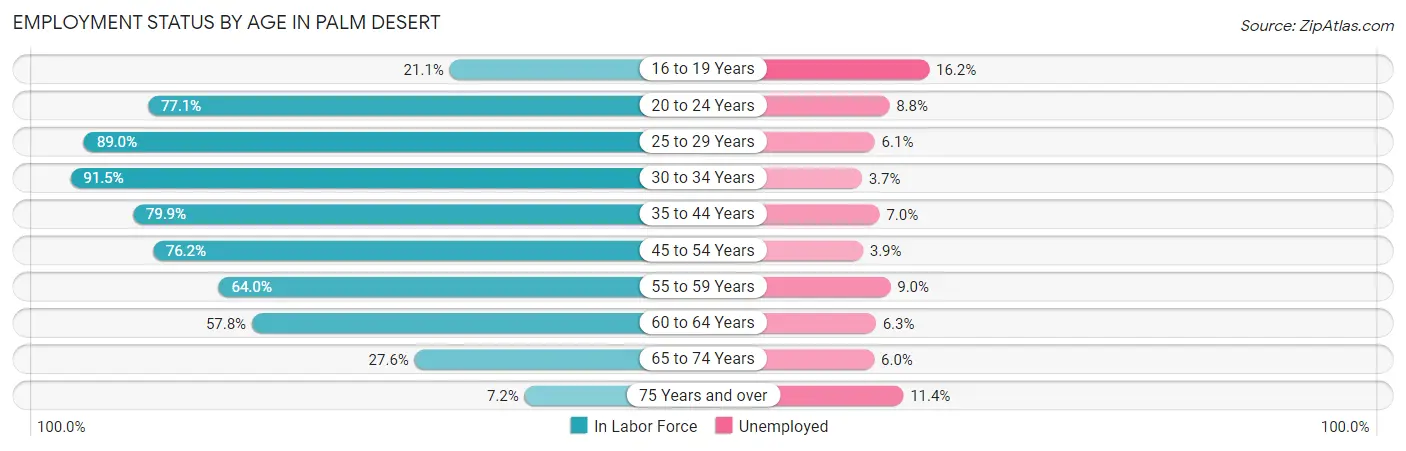
| Age Bracket | In Labor Force | Unemployed |
| 16 to 19 Years | 334 (21.1%) | 54 (16.2%) |
| 20 to 24 Years | 1,793 (77.1%) | 158 (8.8%) |
| 25 to 29 Years | 2,314 (89.0%) | 141 (6.1%) |
| 30 to 34 Years | 2,260 (91.5%) | 84 (3.7%) |
| 35 to 44 Years | 4,105 (79.9%) | 287 (7.0%) |
| 45 to 54 Years | 3,698 (76.2%) | 144 (3.9%) |
| 55 to 59 Years | 1,848 (64.0%) | 166 (9.0%) |
| 60 to 64 Years | 2,523 (57.8%) | 159 (6.3%) |
| 65 to 74 Years | 2,395 (27.6%) | 144 (6.0%) |
| 75 Years and over | 708 (7.2%) | 81 (11.4%) |
| Total | 21,963 (49.1%) | 1,428 (6.5%) |
Employment Status by Educational Attainment in Palm Desert
According to labor force statistics for Palm Desert, 75.1% of individuals (16,757) out of the total population between 25 and 64 years of age (22,313) are in the labor force, with 5.9% or 989 of them being unemployed. The group with the highest labor force participation rate are those with the educational attainment of bachelor's degree or higher, with 81.2% or 6,540 individuals in the labor force. Within the labor force, individuals with high school diploma education have the highest percentage of unemployment, with 7.2% or 176 of them being unemployed.
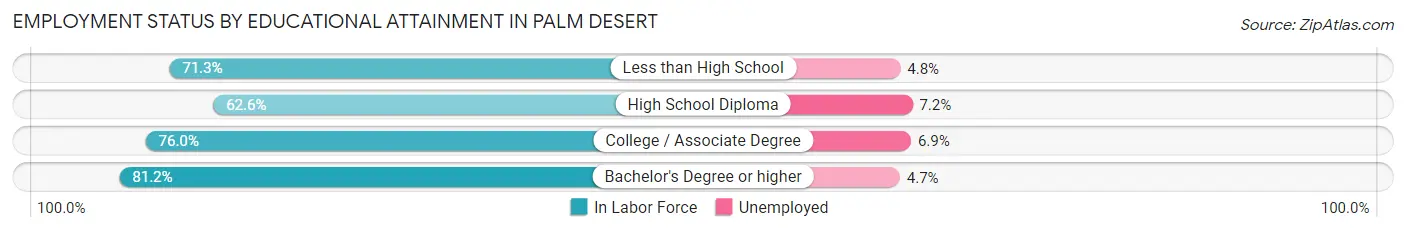
| Educational Attainment | In Labor Force | Unemployed |
| Less than High School | 1,495 (71.3%) | 101 (4.8%) |
| High School Diploma | 2,449 (62.6%) | 282 (7.2%) |
| College / Associate Degree | 6,270 (76.0%) | 569 (6.9%) |
| Bachelor's Degree or higher | 6,540 (81.2%) | 379 (4.7%) |
| Total | 16,757 (75.1%) | 1,316 (5.9%) |
Employment Occupations by Sex in Palm Desert
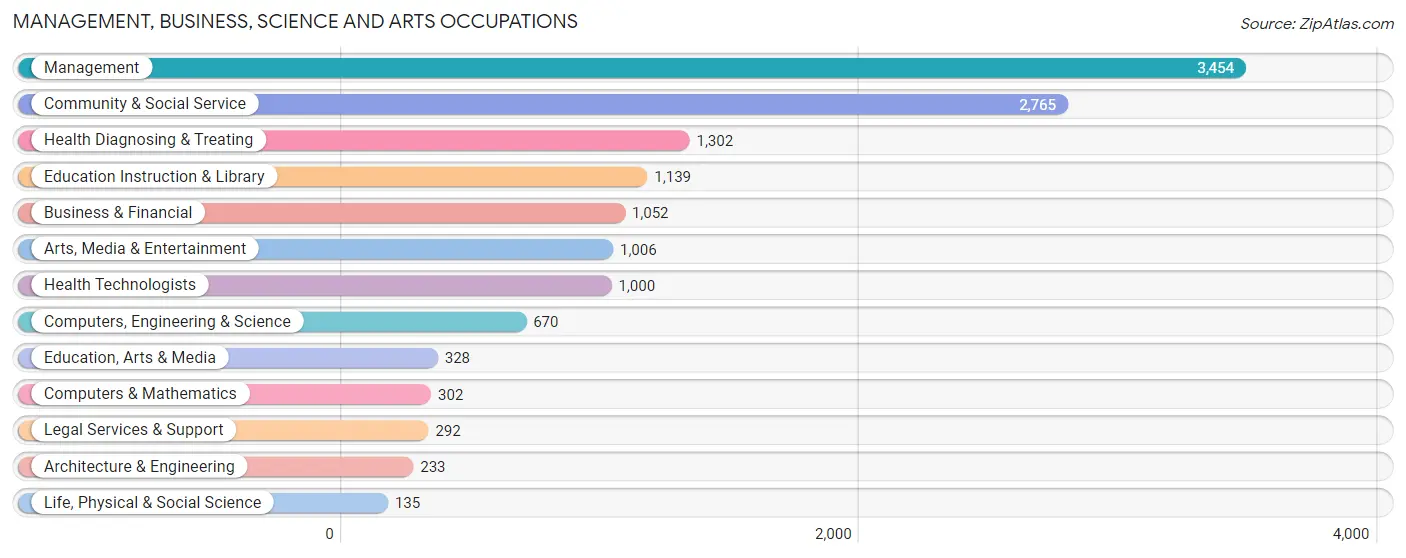
Management, Business, Science and Arts Occupations
The most common Management, Business, Science and Arts occupations in Palm Desert are Management (3,454 | 16.8%), Community & Social Service (2,765 | 13.5%), Health Diagnosing & Treating (1,302 | 6.3%), Education Instruction & Library (1,139 | 5.5%), and Business & Financial (1,052 | 5.1%).
Management, Business, Science and Arts Occupations by Sex
Within the Management, Business, Science and Arts occupations in Palm Desert, the most male-oriented occupations are Computers & Mathematics (80.1%), Architecture & Engineering (71.2%), and Computers, Engineering & Science (70.9%), while the most female-oriented occupations are Education, Arts & Media (82.3%), Education Instruction & Library (76.3%), and Health Technologists (64.1%).
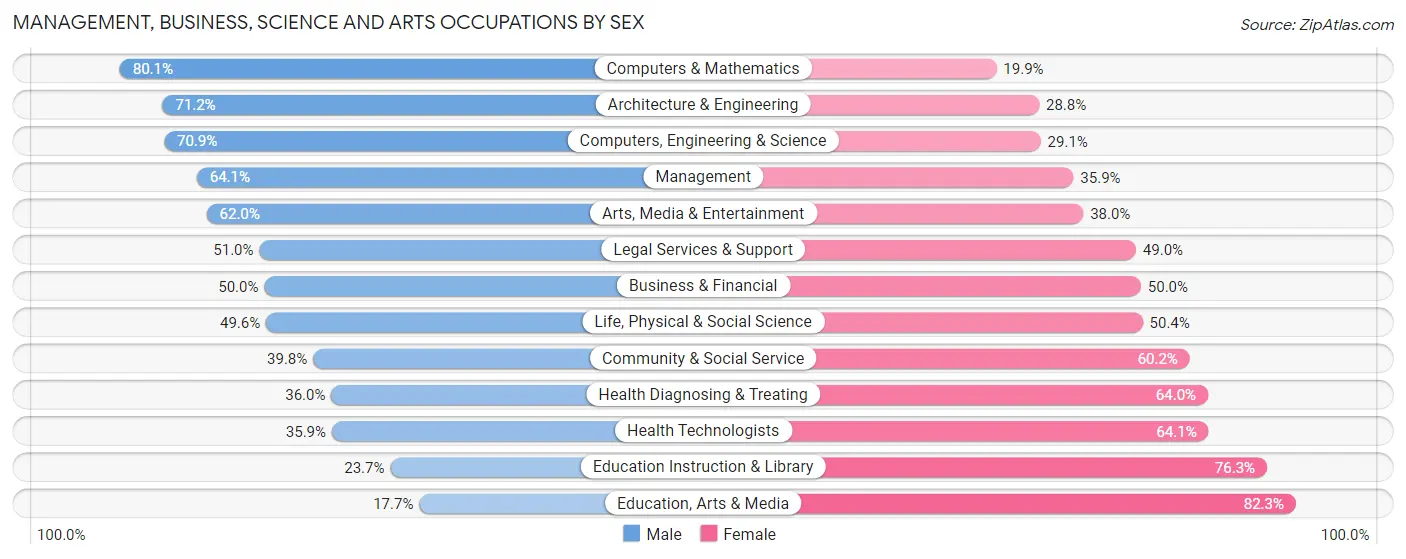
| Occupation | Male | Female |
| Management | 2,213 (64.1%) | 1,241 (35.9%) |
| Business & Financial | 526 (50.0%) | 526 (50.0%) |
| Computers, Engineering & Science | 475 (70.9%) | 195 (29.1%) |
| Computers & Mathematics | 242 (80.1%) | 60 (19.9%) |
| Architecture & Engineering | 166 (71.2%) | 67 (28.8%) |
| Life, Physical & Social Science | 67 (49.6%) | 68 (50.4%) |
| Community & Social Service | 1,101 (39.8%) | 1,664 (60.2%) |
| Education, Arts & Media | 58 (17.7%) | 270 (82.3%) |
| Legal Services & Support | 149 (51.0%) | 143 (49.0%) |
| Education Instruction & Library | 270 (23.7%) | 869 (76.3%) |
| Arts, Media & Entertainment | 624 (62.0%) | 382 (38.0%) |
| Health Diagnosing & Treating | 469 (36.0%) | 833 (64.0%) |
| Health Technologists | 359 (35.9%) | 641 (64.1%) |
| Total (Category) | 4,784 (51.8%) | 4,459 (48.2%) |
| Total (Overall) | 10,891 (53.0%) | 9,673 (47.0%) |
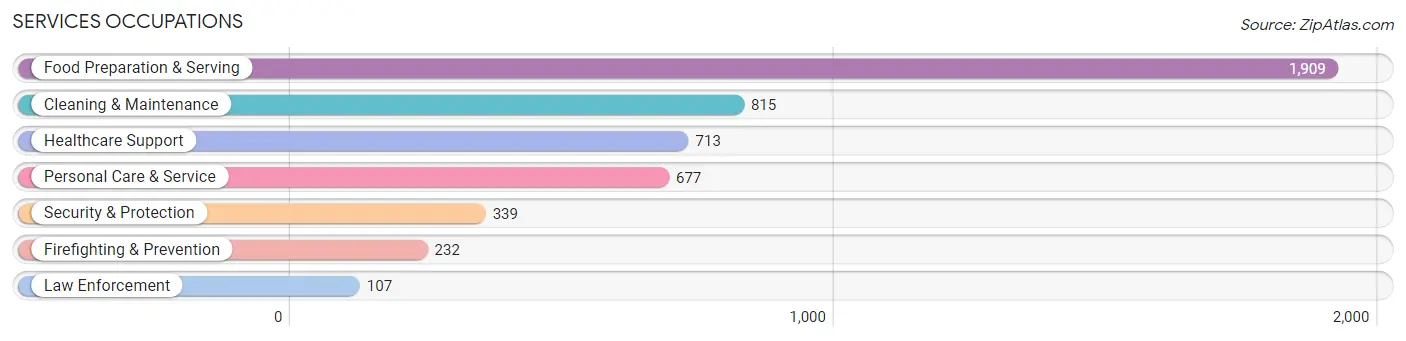
Services Occupations
The most common Services occupations in Palm Desert are Food Preparation & Serving (1,909 | 9.3%), Cleaning & Maintenance (815 | 4.0%), Healthcare Support (713 | 3.5%), Personal Care & Service (677 | 3.3%), and Security & Protection (339 | 1.7%).
Services Occupations by Sex
Within the Services occupations in Palm Desert, the most male-oriented occupations are Law Enforcement (100.0%), Security & Protection (90.6%), and Firefighting & Prevention (86.2%), while the most female-oriented occupations are Healthcare Support (53.9%), Personal Care & Service (52.3%), and Food Preparation & Serving (48.4%).
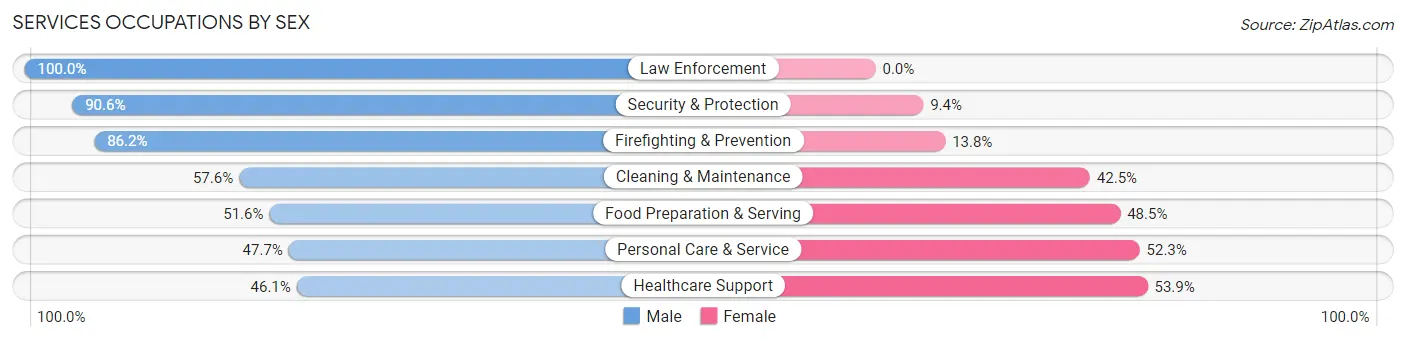
| Occupation | Male | Female |
| Healthcare Support | 329 (46.1%) | 384 (53.9%) |
| Security & Protection | 307 (90.6%) | 32 (9.4%) |
| Firefighting & Prevention | 200 (86.2%) | 32 (13.8%) |
| Law Enforcement | 107 (100.0%) | 0 (0.0%) |
| Food Preparation & Serving | 984 (51.5%) | 925 (48.4%) |
| Cleaning & Maintenance | 469 (57.6%) | 346 (42.4%) |
| Personal Care & Service | 323 (47.7%) | 354 (52.3%) |
| Total (Category) | 2,412 (54.2%) | 2,041 (45.8%) |
| Total (Overall) | 10,891 (53.0%) | 9,673 (47.0%) |
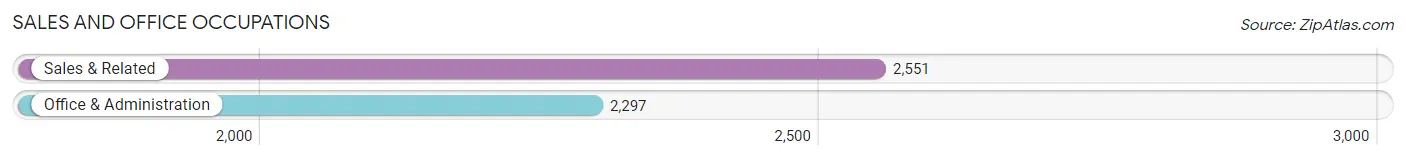
Sales and Office Occupations
The most common Sales and Office occupations in Palm Desert are Sales & Related (2,551 | 12.4%), and Office & Administration (2,297 | 11.2%).
Sales and Office Occupations by Sex
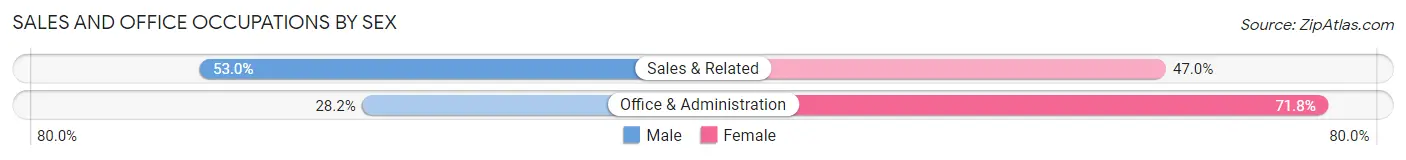
| Occupation | Male | Female |
| Sales & Related | 1,352 (53.0%) | 1,199 (47.0%) |
| Office & Administration | 647 (28.2%) | 1,650 (71.8%) |
| Total (Category) | 1,999 (41.2%) | 2,849 (58.8%) |
| Total (Overall) | 10,891 (53.0%) | 9,673 (47.0%) |
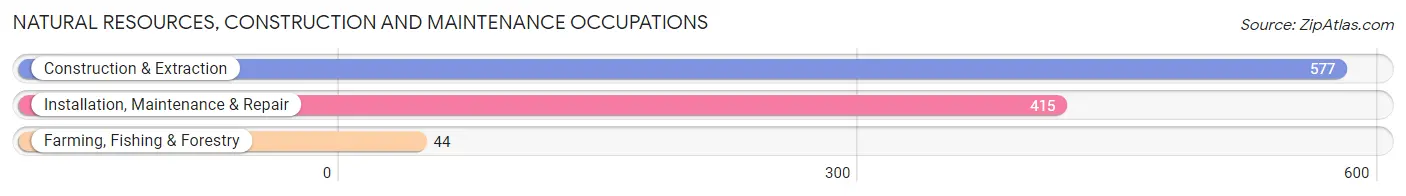
Natural Resources, Construction and Maintenance Occupations
The most common Natural Resources, Construction and Maintenance occupations in Palm Desert are Construction & Extraction (577 | 2.8%), Installation, Maintenance & Repair (415 | 2.0%), and Farming, Fishing & Forestry (44 | 0.2%).
Natural Resources, Construction and Maintenance Occupations by Sex
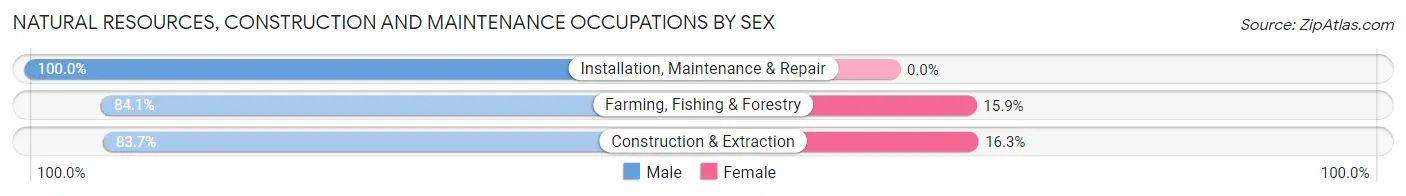
| Occupation | Male | Female |
| Farming, Fishing & Forestry | 37 (84.1%) | 7 (15.9%) |
| Construction & Extraction | 483 (83.7%) | 94 (16.3%) |
| Installation, Maintenance & Repair | 415 (100.0%) | 0 (0.0%) |
| Total (Category) | 935 (90.2%) | 101 (9.8%) |
| Total (Overall) | 10,891 (53.0%) | 9,673 (47.0%) |
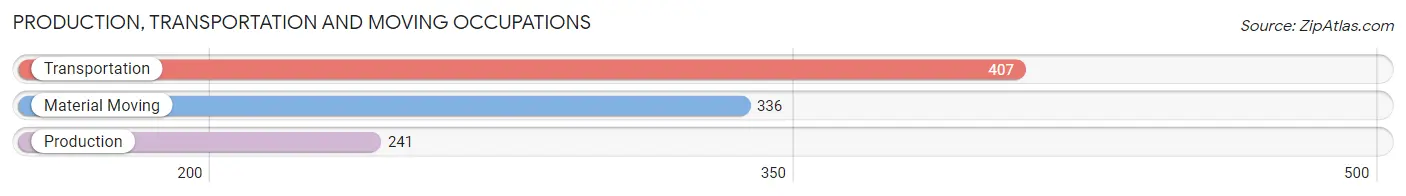
Production, Transportation and Moving Occupations
The most common Production, Transportation and Moving occupations in Palm Desert are Transportation (407 | 2.0%), Material Moving (336 | 1.6%), and Production (241 | 1.2%).
Production, Transportation and Moving Occupations by Sex
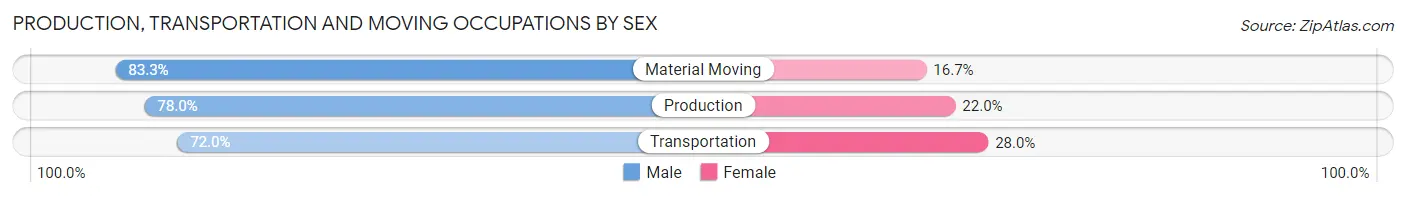
| Occupation | Male | Female |
| Production | 188 (78.0%) | 53 (22.0%) |
| Transportation | 293 (72.0%) | 114 (28.0%) |
| Material Moving | 280 (83.3%) | 56 (16.7%) |
| Total (Category) | 761 (77.3%) | 223 (22.7%) |
| Total (Overall) | 10,891 (53.0%) | 9,673 (47.0%) |
Employment Industries by Sex in Palm Desert
Employment Industries in Palm Desert
The major employment industries in Palm Desert include Accommodation & Food Services (2,779 | 13.5%), Health Care & Social Assistance (2,660 | 12.9%), Retail Trade (2,188 | 10.6%), Professional & Scientific (1,831 | 8.9%), and Educational Services (1,467 | 7.1%).
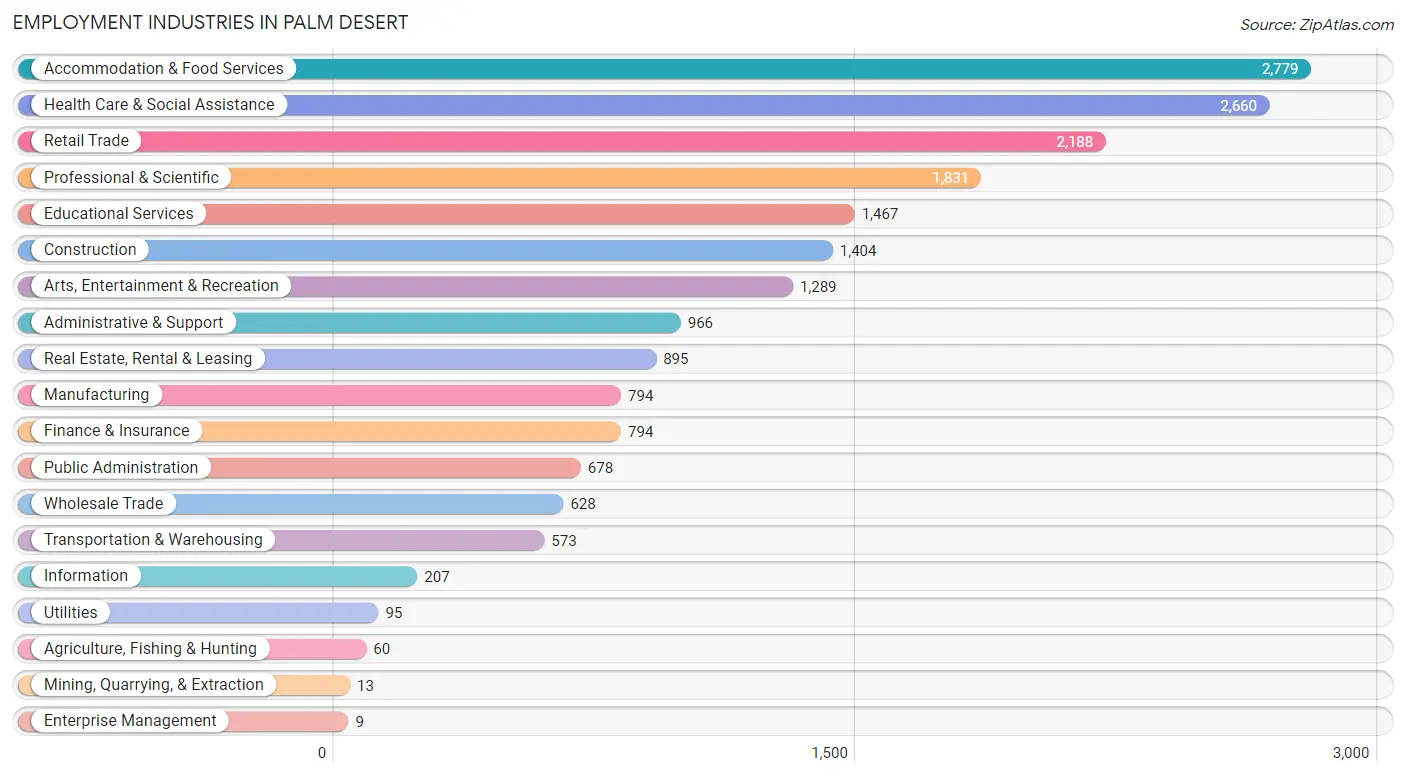
Employment Industries by Sex in Palm Desert
The Palm Desert industries that see more men than women are Enterprise Management (100.0%), Transportation & Warehousing (87.6%), and Wholesale Trade (84.2%), whereas the industries that tend to have a higher number of women are Mining, Quarrying, & Extraction (100.0%), Health Care & Social Assistance (72.7%), and Educational Services (72.3%).
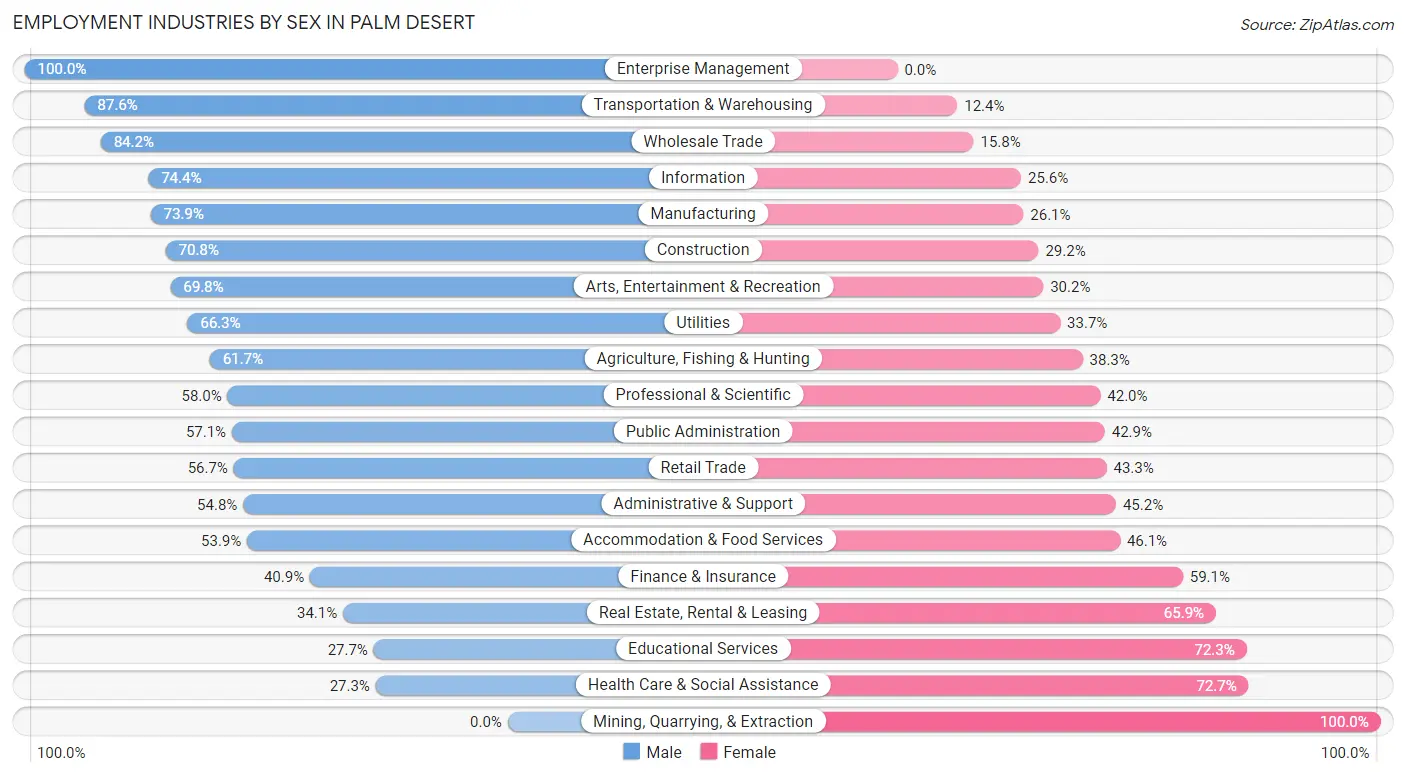
| Industry | Male | Female |
| Agriculture, Fishing & Hunting | 37 (61.7%) | 23 (38.3%) |
| Mining, Quarrying, & Extraction | 0 (0.0%) | 13 (100.0%) |
| Construction | 994 (70.8%) | 410 (29.2%) |
| Manufacturing | 587 (73.9%) | 207 (26.1%) |
| Wholesale Trade | 529 (84.2%) | 99 (15.8%) |
| Retail Trade | 1,241 (56.7%) | 947 (43.3%) |
| Transportation & Warehousing | 502 (87.6%) | 71 (12.4%) |
| Utilities | 63 (66.3%) | 32 (33.7%) |
| Information | 154 (74.4%) | 53 (25.6%) |
| Finance & Insurance | 325 (40.9%) | 469 (59.1%) |
| Real Estate, Rental & Leasing | 305 (34.1%) | 590 (65.9%) |
| Professional & Scientific | 1,062 (58.0%) | 769 (42.0%) |
| Enterprise Management | 9 (100.0%) | 0 (0.0%) |
| Administrative & Support | 529 (54.8%) | 437 (45.2%) |
| Educational Services | 407 (27.7%) | 1,060 (72.3%) |
| Health Care & Social Assistance | 727 (27.3%) | 1,933 (72.7%) |
| Arts, Entertainment & Recreation | 900 (69.8%) | 389 (30.2%) |
| Accommodation & Food Services | 1,499 (53.9%) | 1,280 (46.1%) |
| Public Administration | 387 (57.1%) | 291 (42.9%) |
| Total | 10,891 (53.0%) | 9,673 (47.0%) |
Education in Palm Desert
School Enrollment in Palm Desert
The most common levels of schooling among the 9,430 students in Palm Desert are college / undergraduate (2,423 | 25.7%), elementary school (1,886 | 20.0%), and middle school (1,763 | 18.7%).
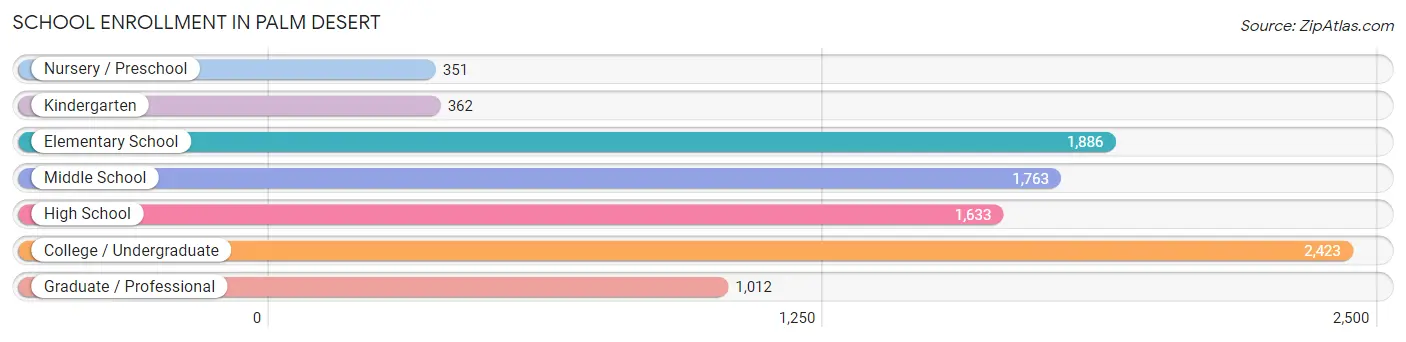
| School Level | # Students | % Students |
| Nursery / Preschool | 351 | 3.7% |
| Kindergarten | 362 | 3.8% |
| Elementary School | 1,886 | 20.0% |
| Middle School | 1,763 | 18.7% |
| High School | 1,633 | 17.3% |
| College / Undergraduate | 2,423 | 25.7% |
| Graduate / Professional | 1,012 | 10.7% |
| Total | 9,430 | 100.0% |
School Enrollment by Age by Funding Source in Palm Desert
Out of a total of 9,430 students who are enrolled in schools in Palm Desert, 1,631 (17.3%) attend a private institution, while the remaining 7,799 (82.7%) are enrolled in public schools. The age group of 25 to 34 year olds has the highest likelihood of being enrolled in private schools, with 331 (38.1% in the age bracket) enrolled. Conversely, the age group of 15 to 17 year olds has the lowest likelihood of being enrolled in a private school, with 1,120 (91.5% in the age bracket) attending a public institution.
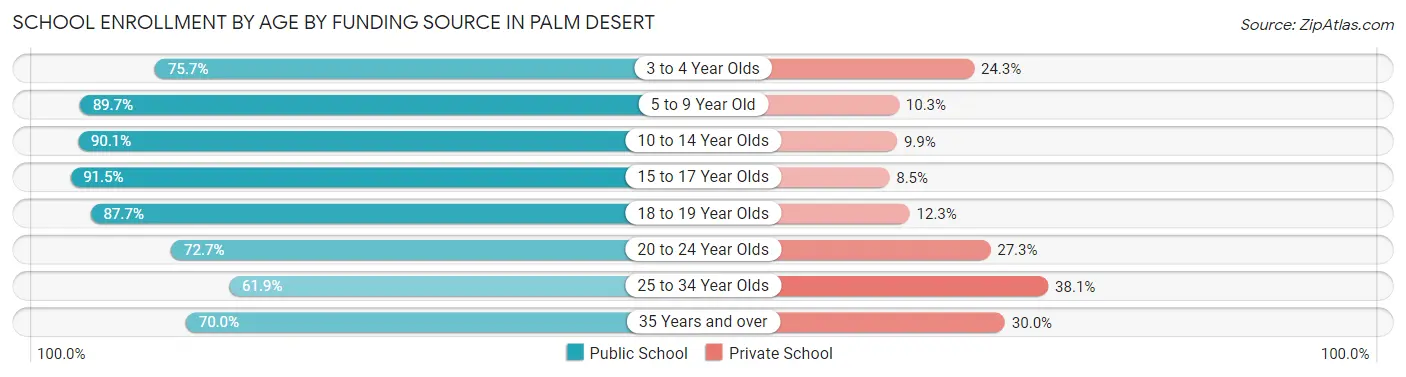
| Age Bracket | Public School | Private School |
| 3 to 4 Year Olds | 268 (75.7%) | 86 (24.3%) |
| 5 to 9 Year Old | 1,719 (89.7%) | 197 (10.3%) |
| 10 to 14 Year Olds | 2,105 (90.1%) | 232 (9.9%) |
| 15 to 17 Year Olds | 1,120 (91.5%) | 104 (8.5%) |
| 18 to 19 Year Olds | 600 (87.7%) | 84 (12.3%) |
| 20 to 24 Year Olds | 519 (72.7%) | 195 (27.3%) |
| 25 to 34 Year Olds | 538 (61.9%) | 331 (38.1%) |
| 35 Years and over | 932 (70.0%) | 400 (30.0%) |
| Total | 7,799 (82.7%) | 1,631 (17.3%) |
Educational Attainment by Field of Study in Palm Desert
Business (3,487 | 20.4%), education (2,016 | 11.8%), social sciences (1,864 | 10.9%), science & technology (1,582 | 9.3%), and liberal arts & history (1,175 | 6.9%) are the most common fields of study among 17,081 individuals in Palm Desert who have obtained a bachelor's degree or higher.
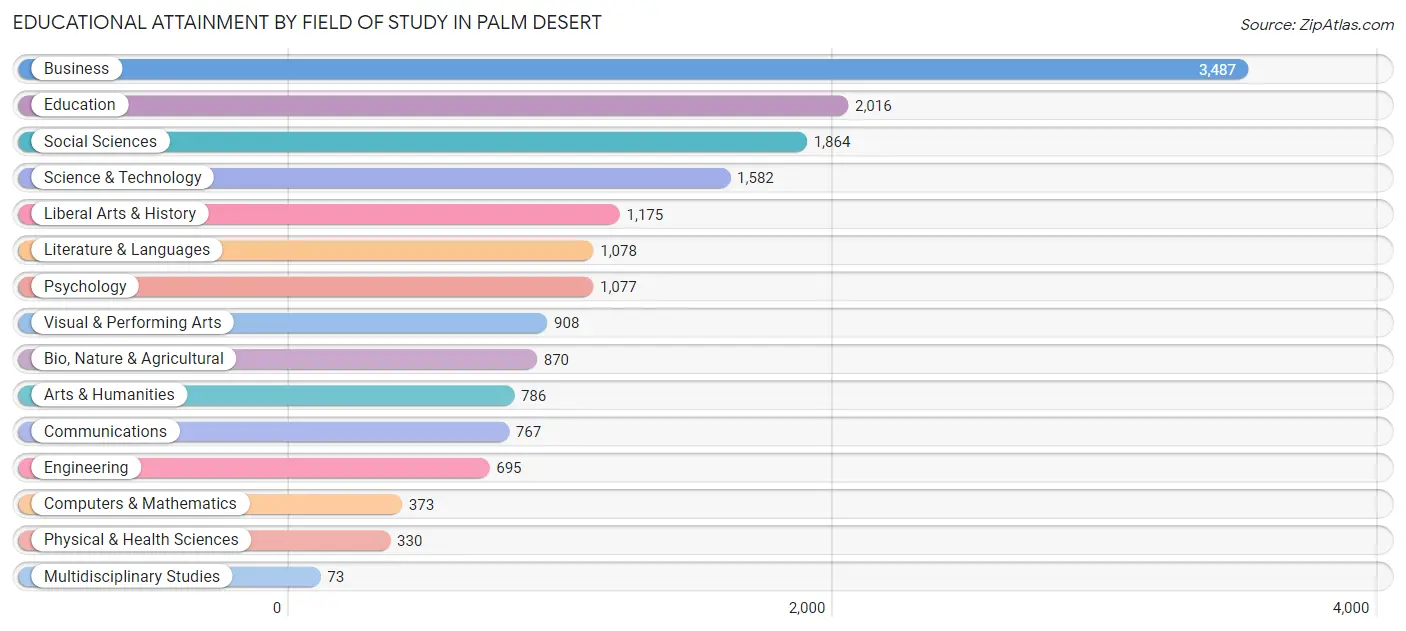
| Field of Study | # Graduates | % Graduates |
| Computers & Mathematics | 373 | 2.2% |
| Bio, Nature & Agricultural | 870 | 5.1% |
| Physical & Health Sciences | 330 | 1.9% |
| Psychology | 1,077 | 6.3% |
| Social Sciences | 1,864 | 10.9% |
| Engineering | 695 | 4.1% |
| Multidisciplinary Studies | 73 | 0.4% |
| Science & Technology | 1,582 | 9.3% |
| Business | 3,487 | 20.4% |
| Education | 2,016 | 11.8% |
| Literature & Languages | 1,078 | 6.3% |
| Liberal Arts & History | 1,175 | 6.9% |
| Visual & Performing Arts | 908 | 5.3% |
| Communications | 767 | 4.5% |
| Arts & Humanities | 786 | 4.6% |
| Total | 17,081 | 100.0% |
Transportation & Commute in Palm Desert
Vehicle Availability by Sex in Palm Desert
The most prevalent vehicle ownership categories in Palm Desert are males with 2 vehicles (4,846, accounting for 45.4%) and females with 2 vehicles (3,799, making up 51.9%).
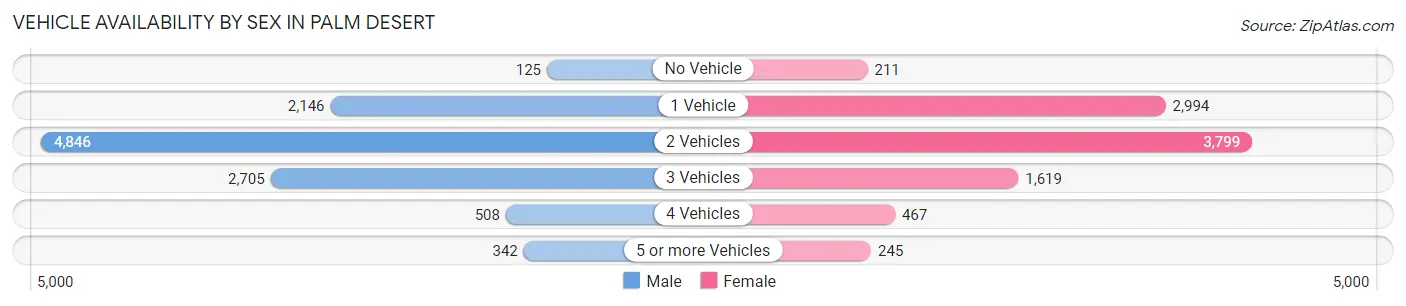
| Vehicles Available | Male | Female |
| No Vehicle | 125 (1.2%) | 211 (2.3%) |
| 1 Vehicle | 2,146 (20.1%) | 2,994 (32.1%) |
| 2 Vehicles | 4,846 (45.4%) | 3,799 (40.7%) |
| 3 Vehicles | 2,705 (25.4%) | 1,619 (17.3%) |
| 4 Vehicles | 508 (4.8%) | 467 (5.0%) |
| 5 or more Vehicles | 342 (3.2%) | 245 (2.6%) |
| Total | 10,672 (100.0%) | 9,335 (100.0%) |
Commute Time in Palm Desert
The most frequently occuring commute durations in Palm Desert are 15 to 19 minutes (3,926 commuters, 22.7%), 10 to 14 minutes (3,458 commuters, 20.0%), and 20 to 24 minutes (3,352 commuters, 19.3%).
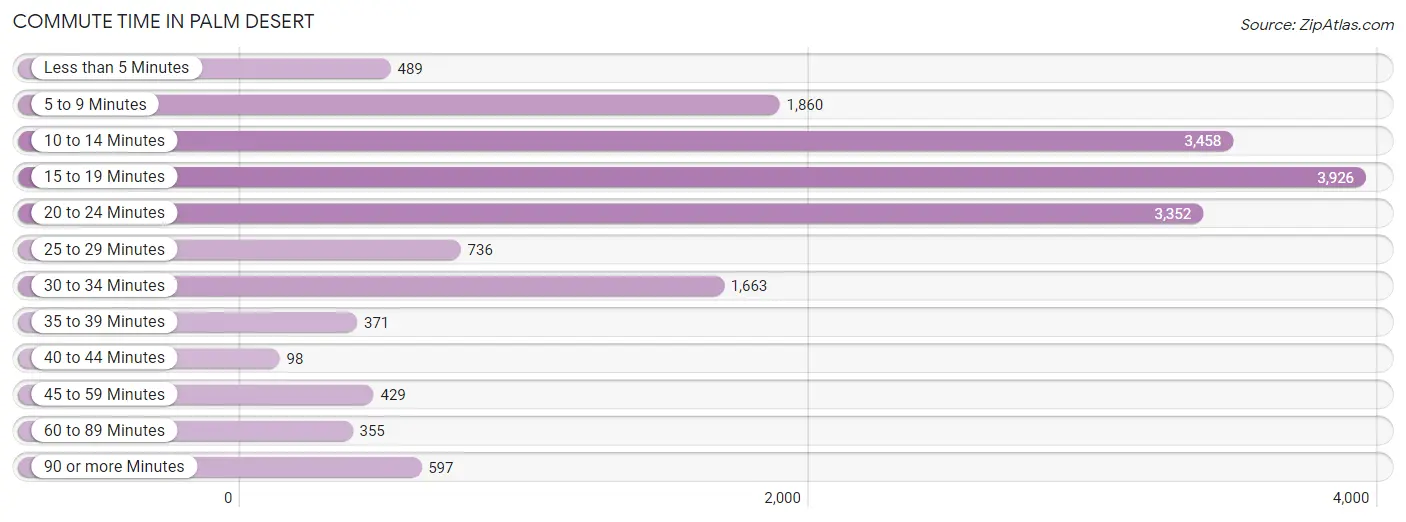
| Commute Time | # Commuters | % Commuters |
| Less than 5 Minutes | 489 | 2.8% |
| 5 to 9 Minutes | 1,860 | 10.7% |
| 10 to 14 Minutes | 3,458 | 20.0% |
| 15 to 19 Minutes | 3,926 | 22.7% |
| 20 to 24 Minutes | 3,352 | 19.3% |
| 25 to 29 Minutes | 736 | 4.3% |
| 30 to 34 Minutes | 1,663 | 9.6% |
| 35 to 39 Minutes | 371 | 2.1% |
| 40 to 44 Minutes | 98 | 0.6% |
| 45 to 59 Minutes | 429 | 2.5% |
| 60 to 89 Minutes | 355 | 2.1% |
| 90 or more Minutes | 597 | 3.4% |
Commute Time by Sex in Palm Desert
The most common commute times in Palm Desert are 20 to 24 minutes (1,957 commuters, 21.1%) for males and 15 to 19 minutes (2,055 commuters, 25.5%) for females.
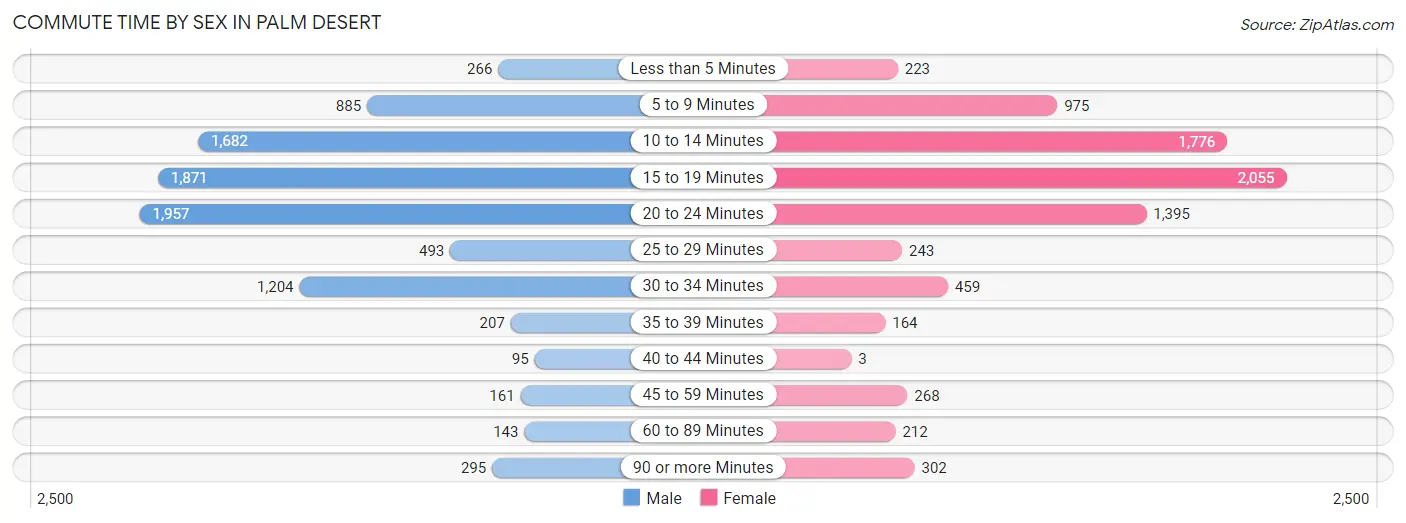
| Commute Time | Male | Female |
| Less than 5 Minutes | 266 (2.9%) | 223 (2.8%) |
| 5 to 9 Minutes | 885 (9.6%) | 975 (12.1%) |
| 10 to 14 Minutes | 1,682 (18.2%) | 1,776 (22.0%) |
| 15 to 19 Minutes | 1,871 (20.2%) | 2,055 (25.5%) |
| 20 to 24 Minutes | 1,957 (21.1%) | 1,395 (17.3%) |
| 25 to 29 Minutes | 493 (5.3%) | 243 (3.0%) |
| 30 to 34 Minutes | 1,204 (13.0%) | 459 (5.7%) |
| 35 to 39 Minutes | 207 (2.2%) | 164 (2.0%) |
| 40 to 44 Minutes | 95 (1.0%) | 3 (0.0%) |
| 45 to 59 Minutes | 161 (1.7%) | 268 (3.3%) |
| 60 to 89 Minutes | 143 (1.5%) | 212 (2.6%) |
| 90 or more Minutes | 295 (3.2%) | 302 (3.7%) |
Time of Departure to Work by Sex in Palm Desert
The most frequent times of departure to work in Palm Desert are 7:00 AM to 7:29 AM (1,419, 15.3%) for males and 8:00 AM to 8:29 AM (1,273, 15.8%) for females.
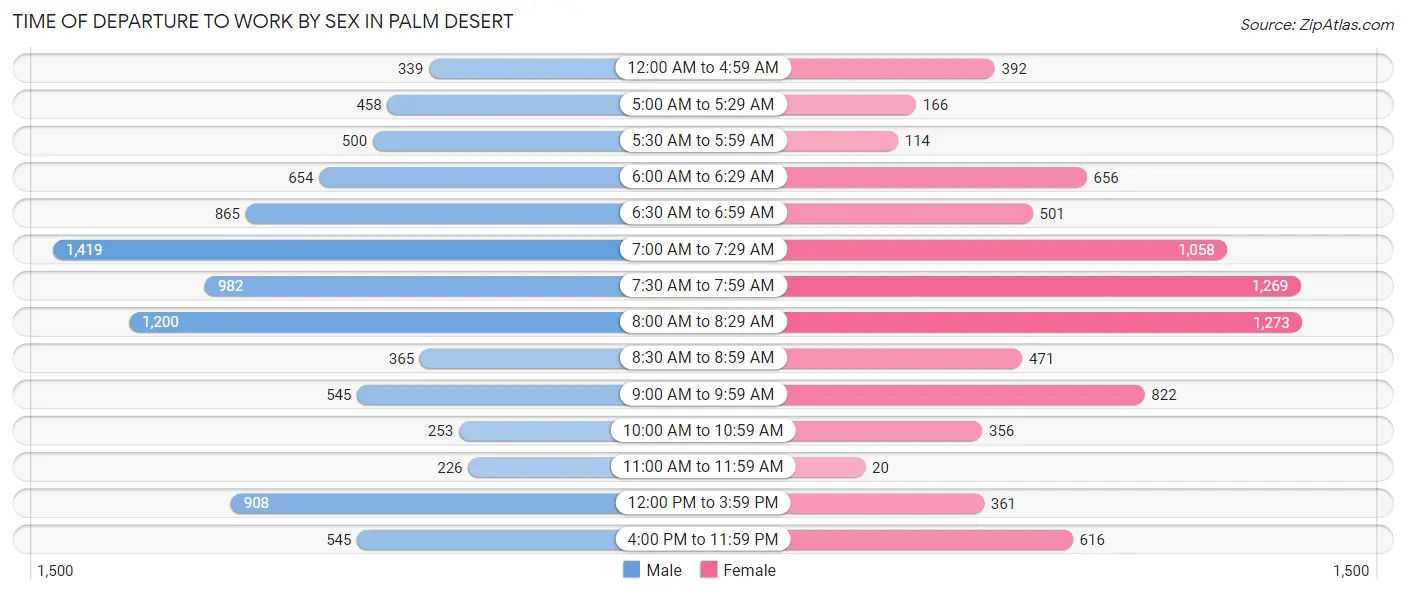
| Time of Departure | Male | Female |
| 12:00 AM to 4:59 AM | 339 (3.7%) | 392 (4.9%) |
| 5:00 AM to 5:29 AM | 458 (5.0%) | 166 (2.1%) |
| 5:30 AM to 5:59 AM | 500 (5.4%) | 114 (1.4%) |
| 6:00 AM to 6:29 AM | 654 (7.1%) | 656 (8.1%) |
| 6:30 AM to 6:59 AM | 865 (9.3%) | 501 (6.2%) |
| 7:00 AM to 7:29 AM | 1,419 (15.3%) | 1,058 (13.1%) |
| 7:30 AM to 7:59 AM | 982 (10.6%) | 1,269 (15.7%) |
| 8:00 AM to 8:29 AM | 1,200 (13.0%) | 1,273 (15.8%) |
| 8:30 AM to 8:59 AM | 365 (3.9%) | 471 (5.8%) |
| 9:00 AM to 9:59 AM | 545 (5.9%) | 822 (10.2%) |
| 10:00 AM to 10:59 AM | 253 (2.7%) | 356 (4.4%) |
| 11:00 AM to 11:59 AM | 226 (2.4%) | 20 (0.3%) |
| 12:00 PM to 3:59 PM | 908 (9.8%) | 361 (4.5%) |
| 4:00 PM to 11:59 PM | 545 (5.9%) | 616 (7.6%) |
| Total | 9,259 (100.0%) | 8,075 (100.0%) |
Housing Occupancy in Palm Desert
Occupancy by Ownership in Palm Desert
Of the total 24,129 dwellings in Palm Desert, owner-occupied units account for 15,934 (66.0%), while renter-occupied units make up 8,195 (34.0%).
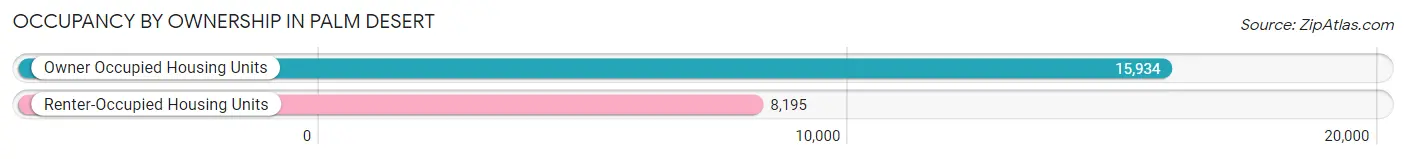
| Occupancy | # Housing Units | % Housing Units |
| Owner Occupied Housing Units | 15,934 | 66.0% |
| Renter-Occupied Housing Units | 8,195 | 34.0% |
| Total Occupied Housing Units | 24,129 | 100.0% |
Occupancy by Household Size in Palm Desert

| Household Size | # Housing Units | % Housing Units |
| 1-Person Household | 8,426 | 34.9% |
| 2-Person Household | 10,659 | 44.2% |
| 3-Person Household | 2,464 | 10.2% |
| 4+ Person Household | 2,580 | 10.7% |
| Total Housing Units | 24,129 | 100.0% |
Occupancy by Ownership by Household Size in Palm Desert
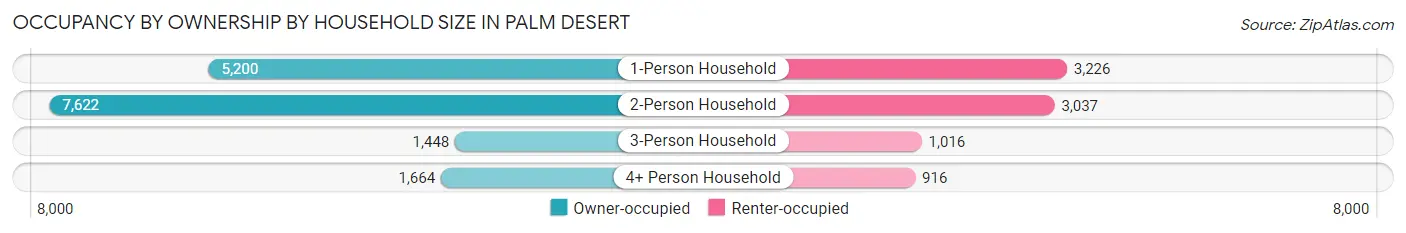
| Household Size | Owner-occupied | Renter-occupied |
| 1-Person Household | 5,200 (61.7%) | 3,226 (38.3%) |
| 2-Person Household | 7,622 (71.5%) | 3,037 (28.5%) |
| 3-Person Household | 1,448 (58.8%) | 1,016 (41.2%) |
| 4+ Person Household | 1,664 (64.5%) | 916 (35.5%) |
| Total Housing Units | 15,934 (66.0%) | 8,195 (34.0%) |
Occupancy by Educational Attainment in Palm Desert
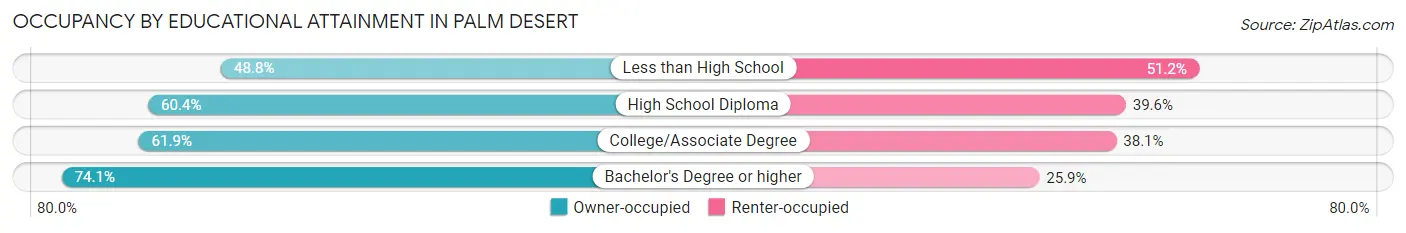
| Household Size | Owner-occupied | Renter-occupied |
| Less than High School | 713 (48.8%) | 747 (51.2%) |
| High School Diploma | 2,119 (60.4%) | 1,389 (39.6%) |
| College/Associate Degree | 5,575 (61.9%) | 3,431 (38.1%) |
| Bachelor's Degree or higher | 7,527 (74.1%) | 2,628 (25.9%) |
Occupancy by Age of Householder in Palm Desert
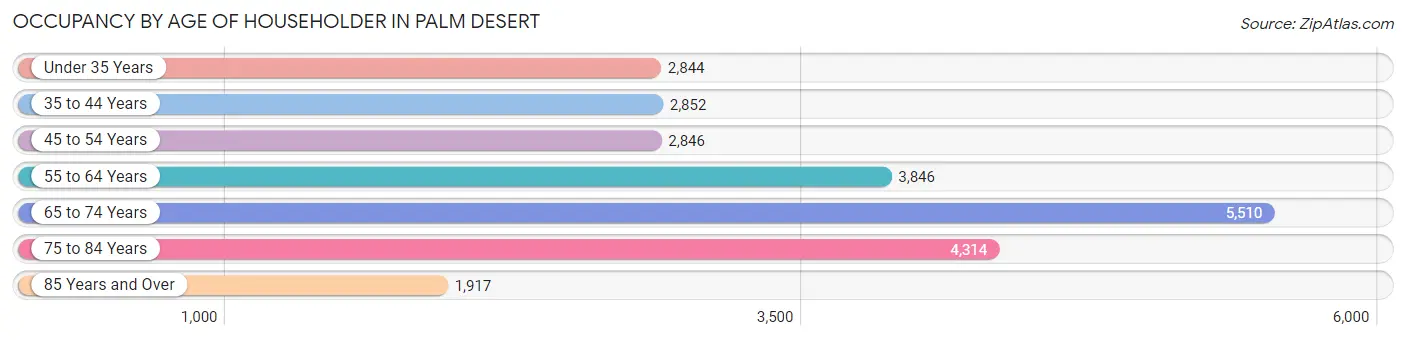
| Age Bracket | # Households | % Households |
| Under 35 Years | 2,844 | 11.8% |
| 35 to 44 Years | 2,852 | 11.8% |
| 45 to 54 Years | 2,846 | 11.8% |
| 55 to 64 Years | 3,846 | 15.9% |
| 65 to 74 Years | 5,510 | 22.8% |
| 75 to 84 Years | 4,314 | 17.9% |
| 85 Years and Over | 1,917 | 7.9% |
| Total | 24,129 | 100.0% |
Housing Finances in Palm Desert
Median Income by Occupancy in Palm Desert
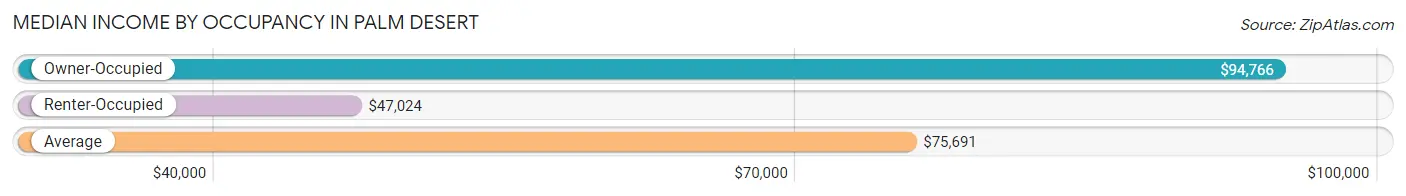
| Occupancy Type | # Households | Median Income |
| Owner-Occupied | 15,934 (66.0%) | $94,766 |
| Renter-Occupied | 8,195 (34.0%) | $47,024 |
| Average | 24,129 (100.0%) | $75,691 |
Occupancy by Householder Income Bracket in Palm Desert
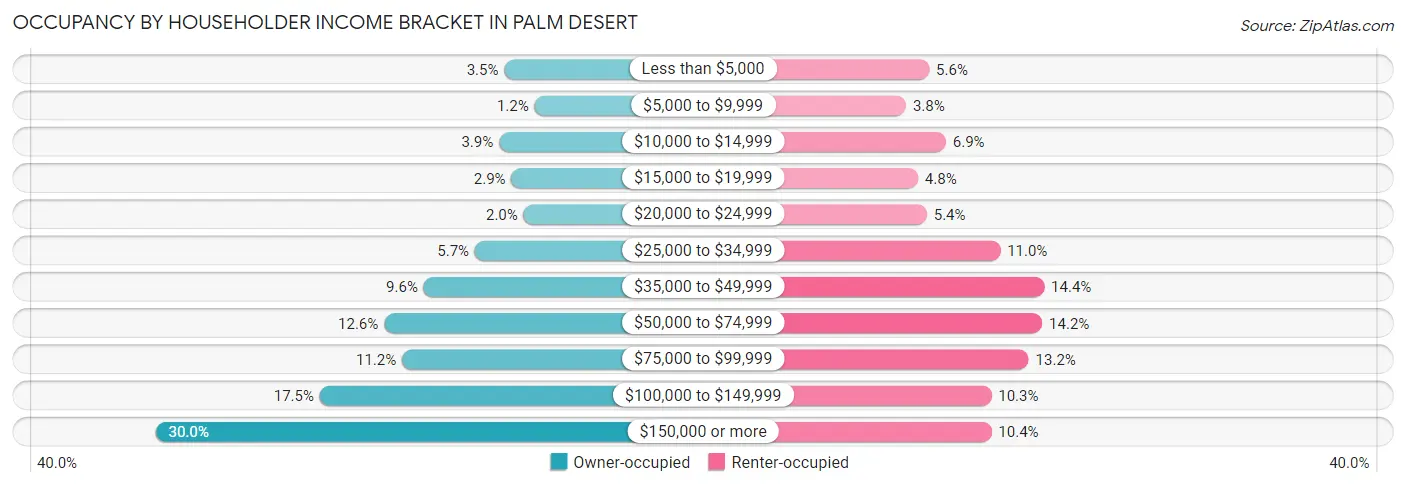
| Income Bracket | Owner-occupied | Renter-occupied |
| Less than $5,000 | 550 (3.5%) | 460 (5.6%) |
| $5,000 to $9,999 | 183 (1.1%) | 315 (3.8%) |
| $10,000 to $14,999 | 613 (3.8%) | 564 (6.9%) |
| $15,000 to $19,999 | 464 (2.9%) | 389 (4.8%) |
| $20,000 to $24,999 | 315 (2.0%) | 445 (5.4%) |
| $25,000 to $34,999 | 907 (5.7%) | 903 (11.0%) |
| $35,000 to $49,999 | 1,528 (9.6%) | 1,178 (14.4%) |
| $50,000 to $74,999 | 2,010 (12.6%) | 1,165 (14.2%) |
| $75,000 to $99,999 | 1,791 (11.2%) | 1,081 (13.2%) |
| $100,000 to $149,999 | 2,790 (17.5%) | 847 (10.3%) |
| $150,000 or more | 4,783 (30.0%) | 848 (10.3%) |
| Total | 15,934 (100.0%) | 8,195 (100.0%) |
Monthly Housing Cost Tiers in Palm Desert
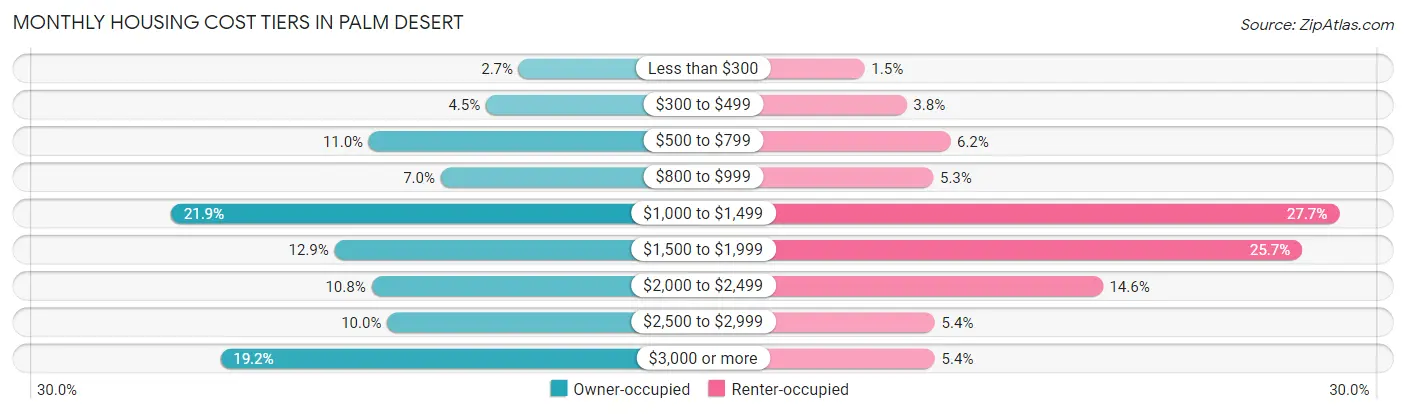
| Monthly Cost | Owner-occupied | Renter-occupied |
| Less than $300 | 430 (2.7%) | 122 (1.5%) |
| $300 to $499 | 718 (4.5%) | 312 (3.8%) |
| $500 to $799 | 1,749 (11.0%) | 510 (6.2%) |
| $800 to $999 | 1,117 (7.0%) | 433 (5.3%) |
| $1,000 to $1,499 | 3,493 (21.9%) | 2,271 (27.7%) |
| $1,500 to $1,999 | 2,052 (12.9%) | 2,103 (25.7%) |
| $2,000 to $2,499 | 1,728 (10.8%) | 1,200 (14.6%) |
| $2,500 to $2,999 | 1,589 (10.0%) | 440 (5.4%) |
| $3,000 or more | 3,058 (19.2%) | 440 (5.4%) |
| Total | 15,934 (100.0%) | 8,195 (100.0%) |
Physical Housing Characteristics in Palm Desert
Housing Structures in Palm Desert
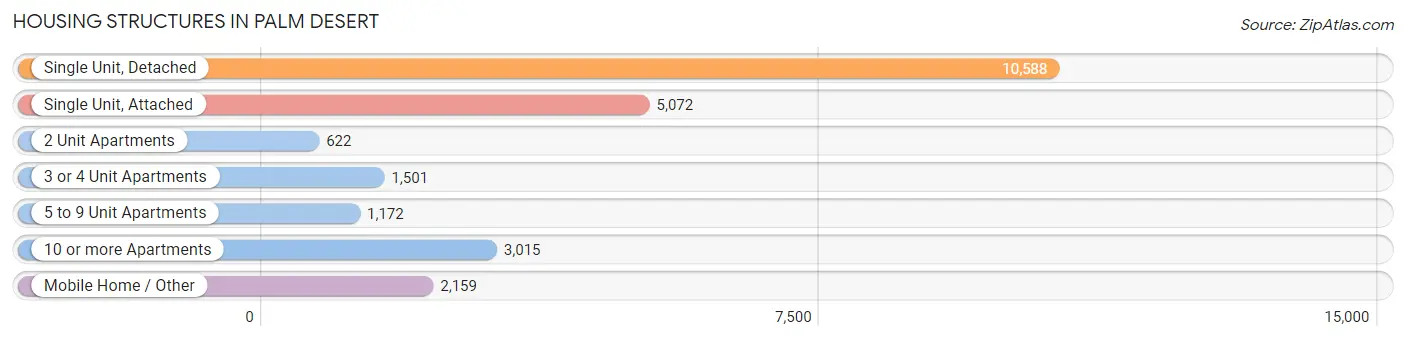
| Structure Type | # Housing Units | % Housing Units |
| Single Unit, Detached | 10,588 | 43.9% |
| Single Unit, Attached | 5,072 | 21.0% |
| 2 Unit Apartments | 622 | 2.6% |
| 3 or 4 Unit Apartments | 1,501 | 6.2% |
| 5 to 9 Unit Apartments | 1,172 | 4.9% |
| 10 or more Apartments | 3,015 | 12.5% |
| Mobile Home / Other | 2,159 | 8.9% |
| Total | 24,129 | 100.0% |
Housing Structures by Occupancy in Palm Desert
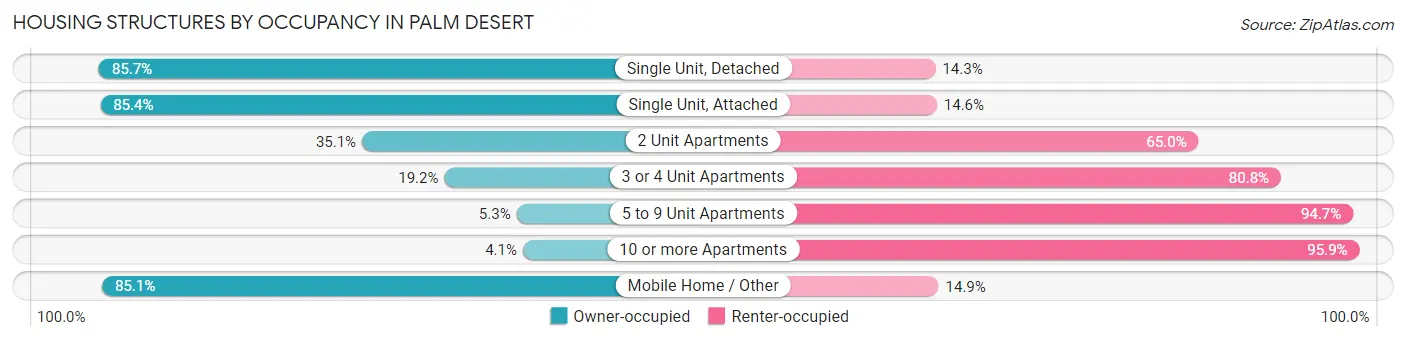
| Structure Type | Owner-occupied | Renter-occupied |
| Single Unit, Detached | 9,073 (85.7%) | 1,515 (14.3%) |
| Single Unit, Attached | 4,333 (85.4%) | 739 (14.6%) |
| 2 Unit Apartments | 218 (35.0%) | 404 (64.9%) |
| 3 or 4 Unit Apartments | 288 (19.2%) | 1,213 (80.8%) |
| 5 to 9 Unit Apartments | 62 (5.3%) | 1,110 (94.7%) |
| 10 or more Apartments | 123 (4.1%) | 2,892 (95.9%) |
| Mobile Home / Other | 1,837 (85.1%) | 322 (14.9%) |
| Total | 15,934 (66.0%) | 8,195 (34.0%) |
Housing Structures by Number of Rooms in Palm Desert
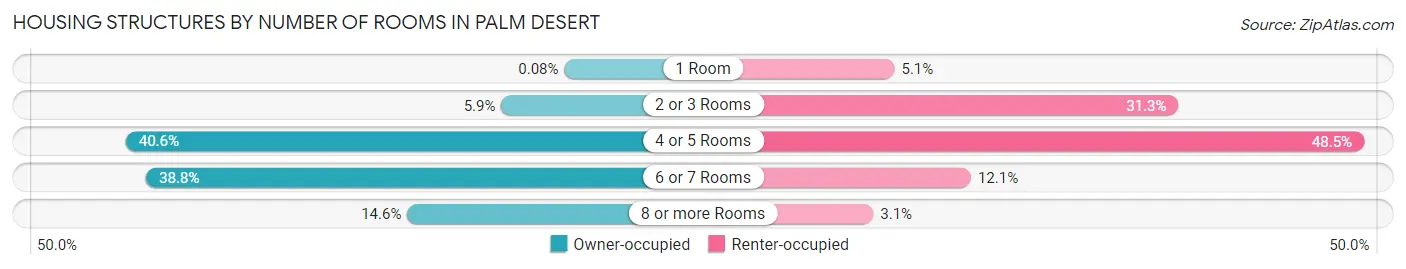
| Number of Rooms | Owner-occupied | Renter-occupied |
| 1 Room | 13 (0.1%) | 414 (5.1%) |
| 2 or 3 Rooms | 941 (5.9%) | 2,564 (31.3%) |
| 4 or 5 Rooms | 6,476 (40.6%) | 3,971 (48.5%) |
| 6 or 7 Rooms | 6,176 (38.8%) | 993 (12.1%) |
| 8 or more Rooms | 2,328 (14.6%) | 253 (3.1%) |
| Total | 15,934 (100.0%) | 8,195 (100.0%) |
Housing Structure by Heating Type in Palm Desert
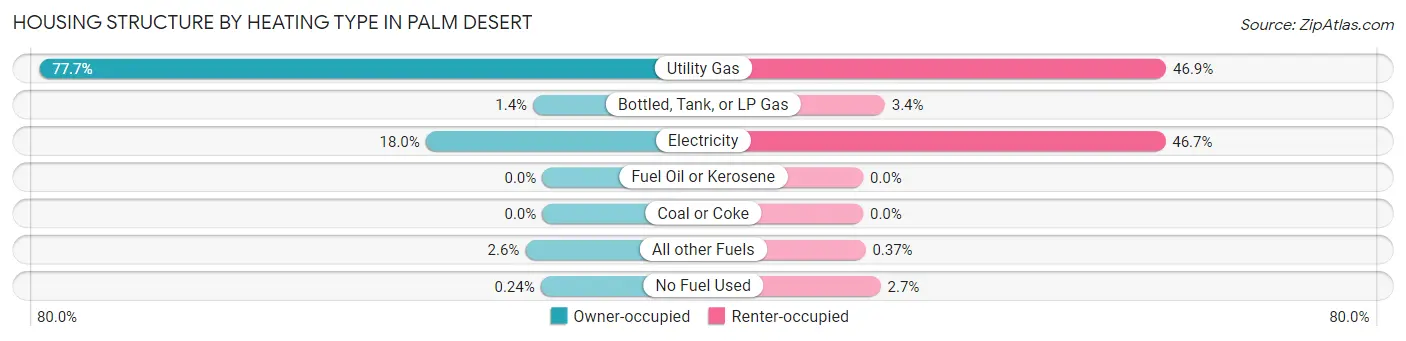
| Heating Type | Owner-occupied | Renter-occupied |
| Utility Gas | 12,384 (77.7%) | 3,839 (46.9%) |
| Bottled, Tank, or LP Gas | 226 (1.4%) | 275 (3.4%) |
| Electricity | 2,870 (18.0%) | 3,829 (46.7%) |
| Fuel Oil or Kerosene | 0 (0.0%) | 0 (0.0%) |
| Coal or Coke | 0 (0.0%) | 0 (0.0%) |
| All other Fuels | 416 (2.6%) | 30 (0.4%) |
| No Fuel Used | 38 (0.2%) | 222 (2.7%) |
| Total | 15,934 (100.0%) | 8,195 (100.0%) |
Household Vehicle Usage in Palm Desert
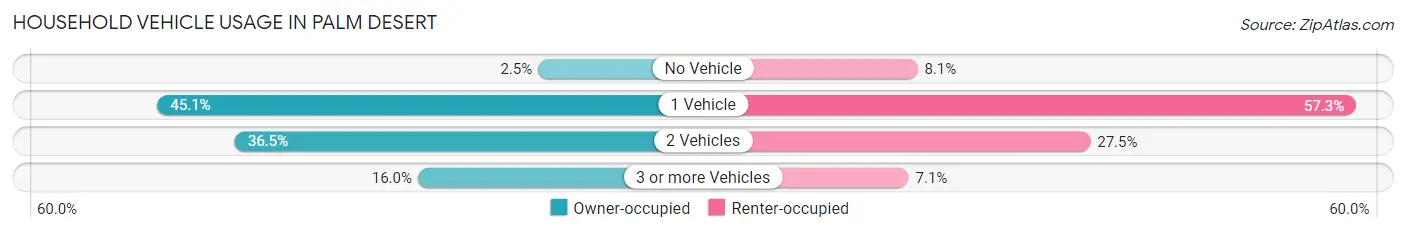
| Vehicles per Household | Owner-occupied | Renter-occupied |
| No Vehicle | 395 (2.5%) | 666 (8.1%) |
| 1 Vehicle | 7,189 (45.1%) | 4,692 (57.3%) |
| 2 Vehicles | 5,808 (36.4%) | 2,253 (27.5%) |
| 3 or more Vehicles | 2,542 (16.0%) | 584 (7.1%) |
| Total | 15,934 (100.0%) | 8,195 (100.0%) |
Real Estate & Mortgages in Palm Desert
Real Estate and Mortgage Overview in Palm Desert
| Characteristic | Without Mortgage | With Mortgage |
| Housing Units | 7,444 | 8,490 |
| Median Property Value | $414,200 | $476,500 |
| Median Household Income | $69,913 | $2,915 |
| Monthly Housing Costs | $1,023 | $2,856 |
| Real Estate Taxes | $4,057 | $305 |
Property Value by Mortgage Status in Palm Desert
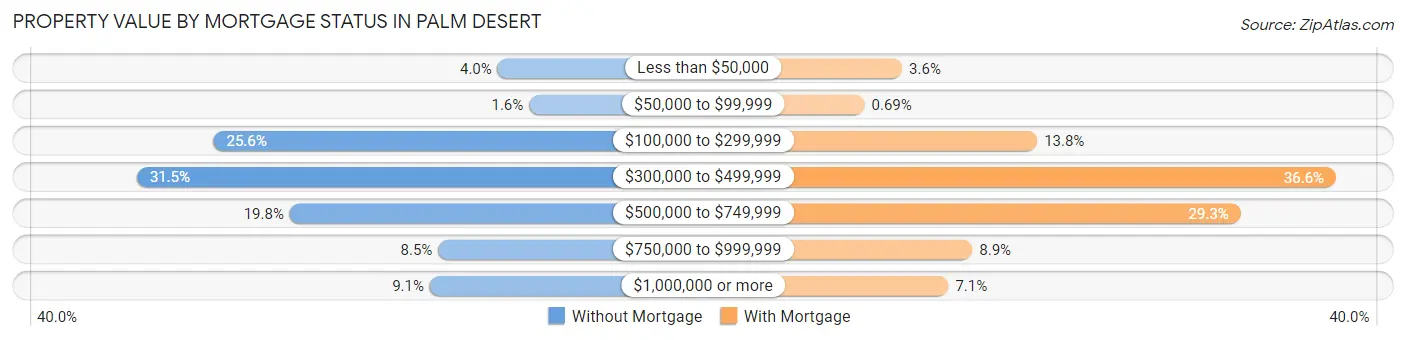
| Property Value | Without Mortgage | With Mortgage |
| Less than $50,000 | 295 (4.0%) | 301 (3.5%) |
| $50,000 to $99,999 | 116 (1.6%) | 59 (0.7%) |
| $100,000 to $299,999 | 1,906 (25.6%) | 1,175 (13.8%) |
| $300,000 to $499,999 | 2,341 (31.5%) | 3,107 (36.6%) |
| $500,000 to $749,999 | 1,474 (19.8%) | 2,491 (29.3%) |
| $750,000 to $999,999 | 632 (8.5%) | 756 (8.9%) |
| $1,000,000 or more | 680 (9.1%) | 601 (7.1%) |
| Total | 7,444 (100.0%) | 8,490 (100.0%) |
Household Income by Mortgage Status in Palm Desert
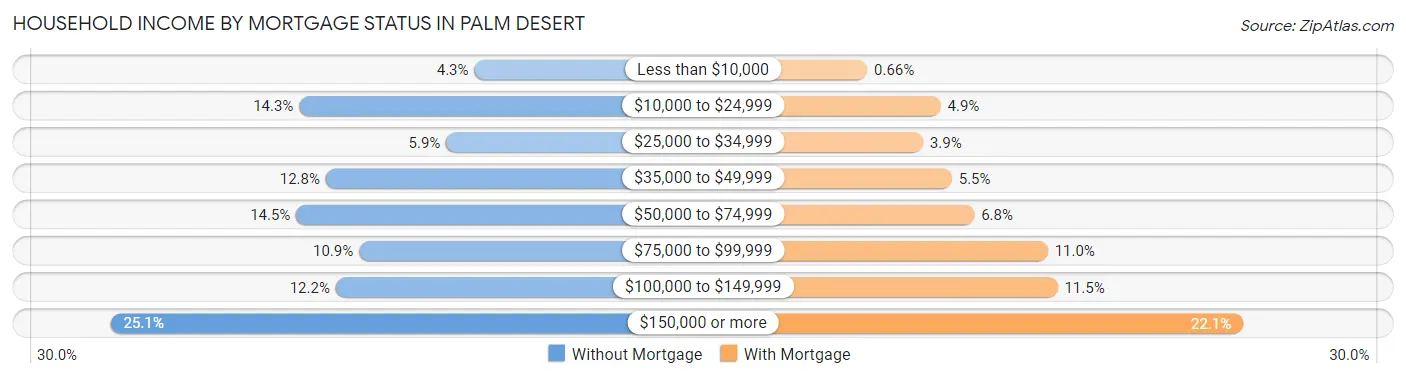
| Household Income | Without Mortgage | With Mortgage |
| Less than $10,000 | 320 (4.3%) | 56 (0.7%) |
| $10,000 to $24,999 | 1,065 (14.3%) | 413 (4.9%) |
| $25,000 to $34,999 | 440 (5.9%) | 327 (3.8%) |
| $35,000 to $49,999 | 952 (12.8%) | 467 (5.5%) |
| $50,000 to $74,999 | 1,078 (14.5%) | 576 (6.8%) |
| $75,000 to $99,999 | 811 (10.9%) | 932 (11.0%) |
| $100,000 to $149,999 | 910 (12.2%) | 980 (11.5%) |
| $150,000 or more | 1,868 (25.1%) | 1,880 (22.1%) |
| Total | 7,444 (100.0%) | 8,490 (100.0%) |
Property Value to Household Income Ratio in Palm Desert
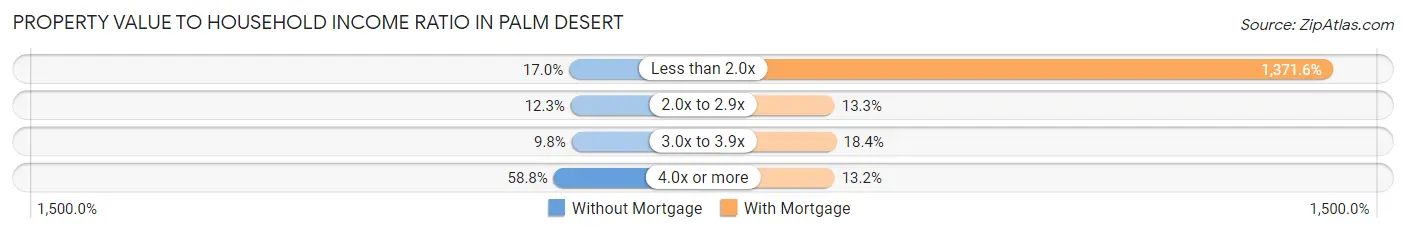
| Value-to-Income Ratio | Without Mortgage | With Mortgage |
| Less than 2.0x | 1,262 (17.0%) | 116,452 (1,371.6%) |
| 2.0x to 2.9x | 917 (12.3%) | 1,126 (13.3%) |
| 3.0x to 3.9x | 731 (9.8%) | 1,559 (18.4%) |
| 4.0x or more | 4,378 (58.8%) | 1,120 (13.2%) |
| Total | 7,444 (100.0%) | 8,490 (100.0%) |
Real Estate Taxes by Mortgage Status in Palm Desert
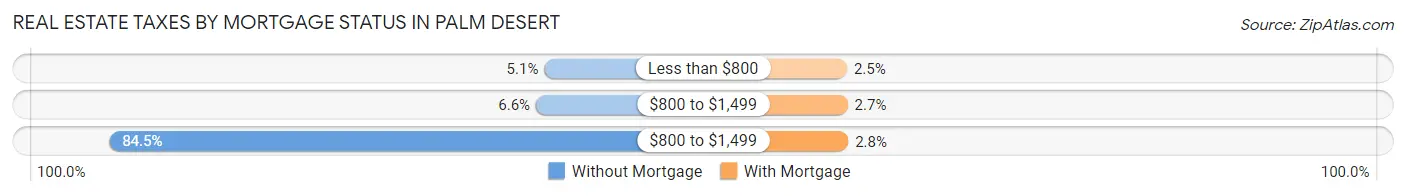
| Property Taxes | Without Mortgage | With Mortgage |
| Less than $800 | 379 (5.1%) | 216 (2.5%) |
| $800 to $1,499 | 492 (6.6%) | 227 (2.7%) |
| $800 to $1,499 | 6,293 (84.5%) | 235 (2.8%) |
| Total | 7,444 (100.0%) | 8,490 (100.0%) |
Health & Disability in Palm Desert
Health Insurance Coverage by Age in Palm Desert
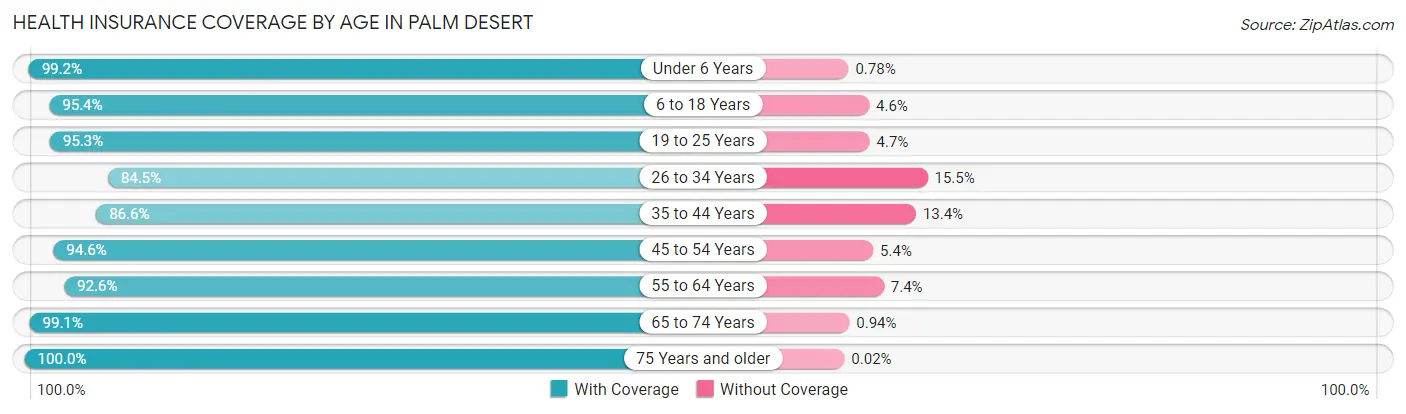
| Age Bracket | With Coverage | Without Coverage |
| Under 6 Years | 1,772 (99.2%) | 14 (0.8%) |
| 6 to 18 Years | 5,663 (95.4%) | 274 (4.6%) |
| 19 to 25 Years | 3,152 (95.3%) | 156 (4.7%) |
| 26 to 34 Years | 3,808 (84.5%) | 700 (15.5%) |
| 35 to 44 Years | 4,441 (86.6%) | 685 (13.4%) |
| 45 to 54 Years | 4,573 (94.6%) | 260 (5.4%) |
| 55 to 64 Years | 6,666 (92.6%) | 530 (7.4%) |
| 65 to 74 Years | 8,530 (99.1%) | 81 (0.9%) |
| 75 Years and older | 9,652 (100.0%) | 2 (0.0%) |
| Total | 48,257 (94.7%) | 2,702 (5.3%) |
Health Insurance Coverage by Citizenship Status in Palm Desert
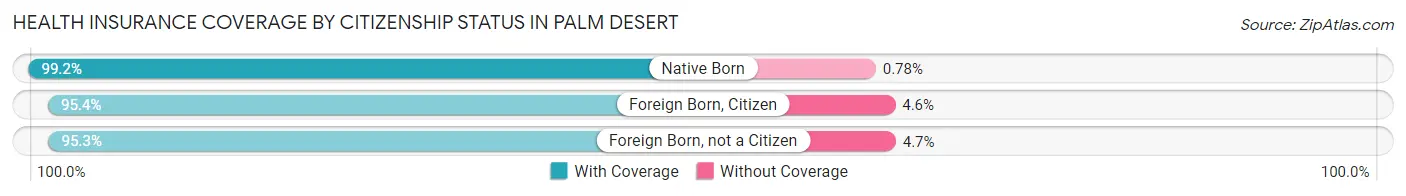
| Citizenship Status | With Coverage | Without Coverage |
| Native Born | 1,772 (99.2%) | 14 (0.8%) |
| Foreign Born, Citizen | 5,663 (95.4%) | 274 (4.6%) |
| Foreign Born, not a Citizen | 3,152 (95.3%) | 156 (4.7%) |
Health Insurance Coverage by Household Income in Palm Desert
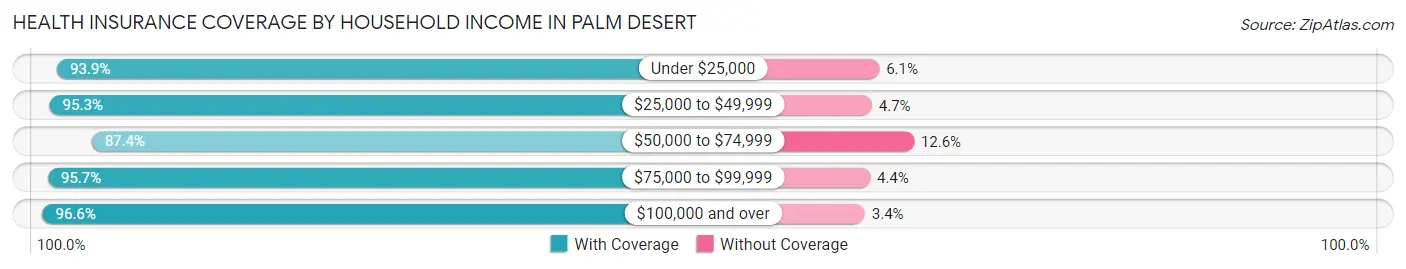
| Household Income | With Coverage | Without Coverage |
| Under $25,000 | 6,552 (93.9%) | 424 (6.1%) |
| $25,000 to $49,999 | 7,629 (95.3%) | 376 (4.7%) |
| $50,000 to $74,999 | 5,925 (87.4%) | 853 (12.6%) |
| $75,000 to $99,999 | 6,223 (95.7%) | 283 (4.3%) |
| $100,000 and over | 21,821 (96.6%) | 764 (3.4%) |
Public vs Private Health Insurance Coverage by Age in Palm Desert
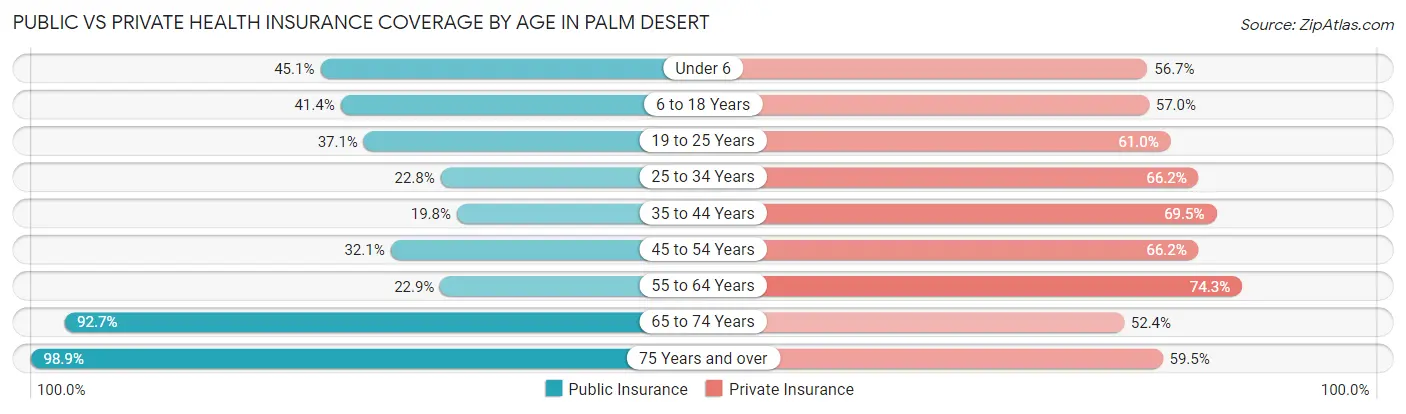
| Age Bracket | Public Insurance | Private Insurance |
| Under 6 | 806 (45.1%) | 1,013 (56.7%) |
| 6 to 18 Years | 2,456 (41.4%) | 3,383 (57.0%) |
| 19 to 25 Years | 1,226 (37.1%) | 2,018 (61.0%) |
| 25 to 34 Years | 1,028 (22.8%) | 2,985 (66.2%) |
| 35 to 44 Years | 1,014 (19.8%) | 3,562 (69.5%) |
| 45 to 54 Years | 1,551 (32.1%) | 3,200 (66.2%) |
| 55 to 64 Years | 1,645 (22.9%) | 5,346 (74.3%) |
| 65 to 74 Years | 7,978 (92.6%) | 4,509 (52.4%) |
| 75 Years and over | 9,548 (98.9%) | 5,747 (59.5%) |
| Total | 27,252 (53.5%) | 31,763 (62.3%) |
Disability Status by Sex by Age in Palm Desert
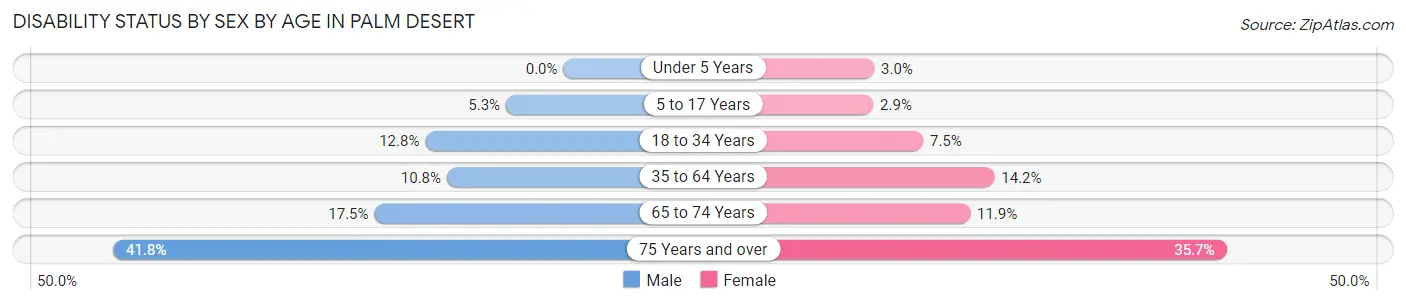
| Age Bracket | Male | Female |
| Under 5 Years | 0 (0.0%) | 27 (3.0%) |
| 5 to 17 Years | 144 (5.3%) | 88 (2.9%) |
| 18 to 34 Years | 556 (12.8%) | 294 (7.5%) |
| 35 to 64 Years | 904 (10.8%) | 1,245 (14.2%) |
| 65 to 74 Years | 657 (17.5%) | 579 (11.9%) |
| 75 Years and over | 1,728 (41.8%) | 1,969 (35.7%) |
Disability Class by Sex by Age in Palm Desert
Disability Class: Hearing Difficulty
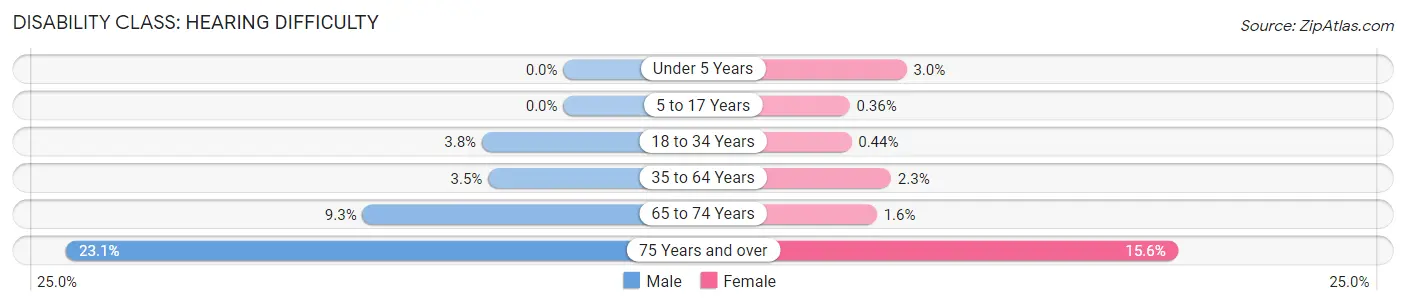
| Age Bracket | Male | Female |
| Under 5 Years | 0 (0.0%) | 27 (3.0%) |
| 5 to 17 Years | 0 (0.0%) | 11 (0.4%) |
| 18 to 34 Years | 164 (3.8%) | 17 (0.4%) |
| 35 to 64 Years | 292 (3.5%) | 200 (2.3%) |
| 65 to 74 Years | 349 (9.3%) | 79 (1.6%) |
| 75 Years and over | 954 (23.1%) | 860 (15.6%) |
Disability Class: Vision Difficulty
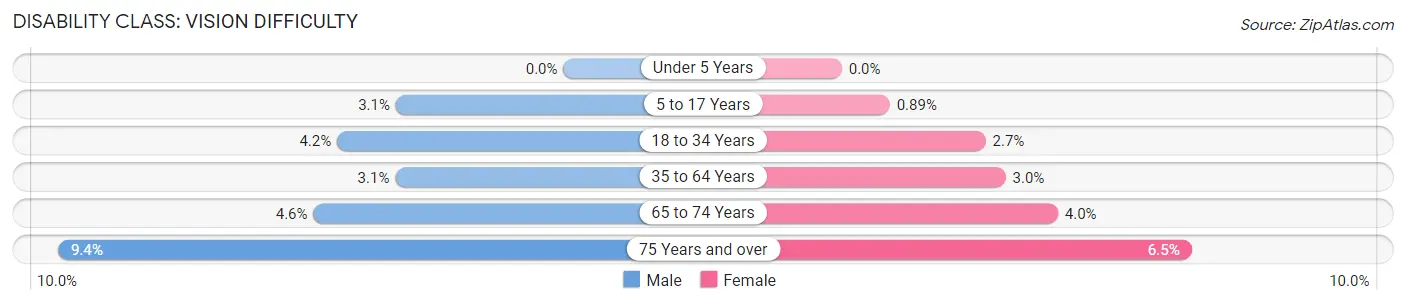
| Age Bracket | Male | Female |
| Under 5 Years | 0 (0.0%) | 0 (0.0%) |
| 5 to 17 Years | 84 (3.1%) | 27 (0.9%) |
| 18 to 34 Years | 182 (4.2%) | 104 (2.7%) |
| 35 to 64 Years | 261 (3.1%) | 267 (3.0%) |
| 65 to 74 Years | 174 (4.6%) | 195 (4.0%) |
| 75 Years and over | 388 (9.4%) | 358 (6.5%) |
Disability Class: Cognitive Difficulty
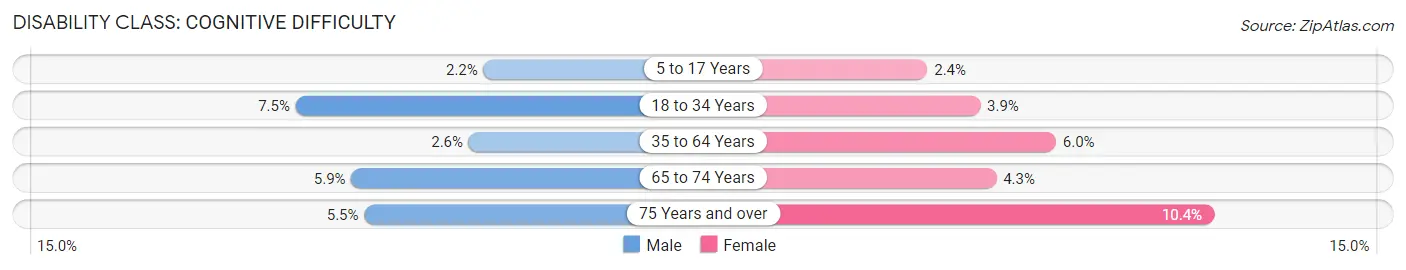
| Age Bracket | Male | Female |
| 5 to 17 Years | 60 (2.2%) | 72 (2.4%) |
| 18 to 34 Years | 323 (7.4%) | 150 (3.8%) |
| 35 to 64 Years | 220 (2.6%) | 524 (6.0%) |
| 65 to 74 Years | 221 (5.9%) | 209 (4.3%) |
| 75 Years and over | 229 (5.5%) | 572 (10.4%) |
Disability Class: Ambulatory Difficulty
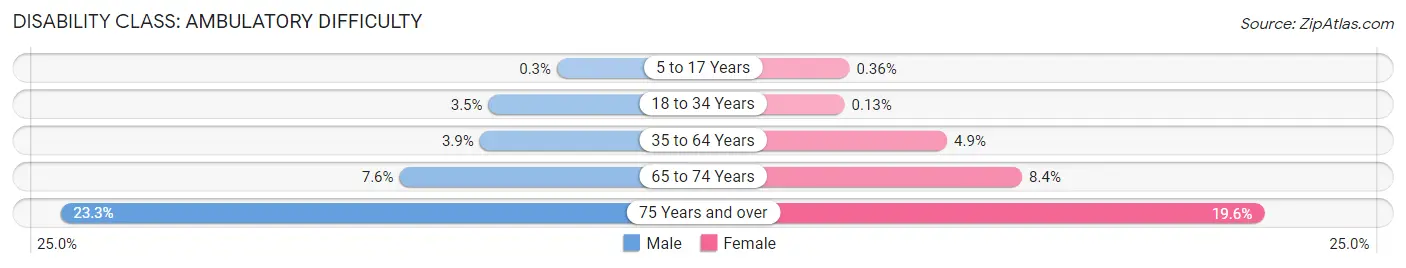
| Age Bracket | Male | Female |
| 5 to 17 Years | 8 (0.3%) | 11 (0.4%) |
| 18 to 34 Years | 151 (3.5%) | 5 (0.1%) |
| 35 to 64 Years | 325 (3.9%) | 430 (4.9%) |
| 65 to 74 Years | 285 (7.6%) | 407 (8.4%) |
| 75 Years and over | 965 (23.3%) | 1,081 (19.6%) |
Disability Class: Self-Care Difficulty
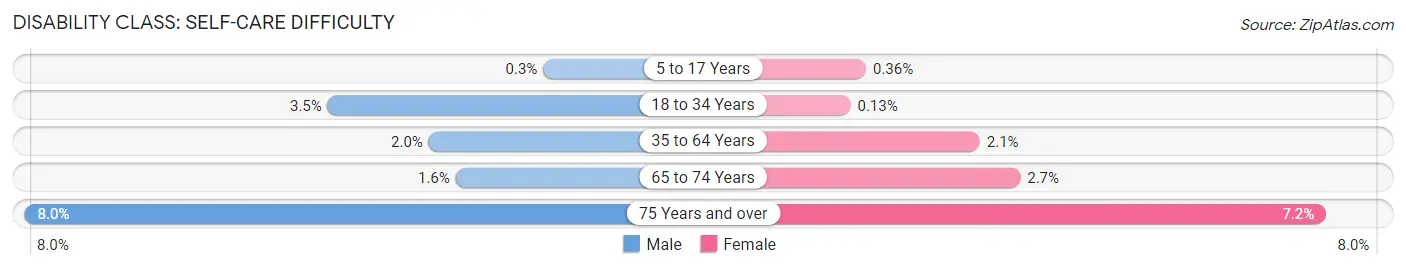
| Age Bracket | Male | Female |
| 5 to 17 Years | 8 (0.3%) | 11 (0.4%) |
| 18 to 34 Years | 152 (3.5%) | 5 (0.1%) |
| 35 to 64 Years | 167 (2.0%) | 180 (2.1%) |
| 65 to 74 Years | 60 (1.6%) | 129 (2.6%) |
| 75 Years and over | 331 (8.0%) | 397 (7.2%) |
Technology Access in Palm Desert
Computing Device Access in Palm Desert
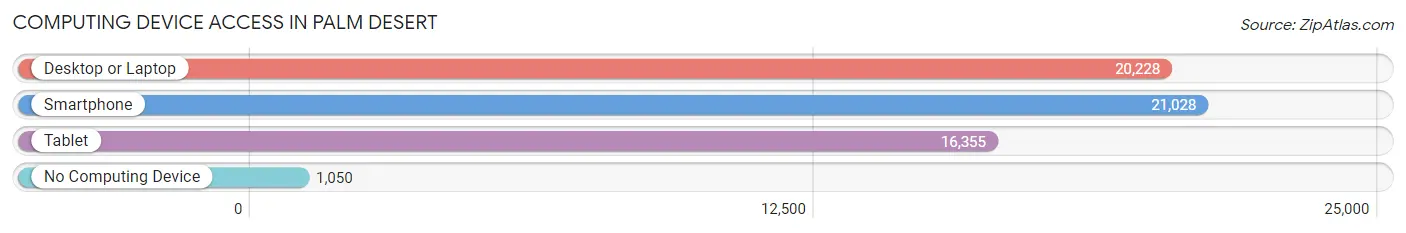
| Device Type | # Households | % Households |
| Desktop or Laptop | 20,228 | 83.8% |
| Smartphone | 21,028 | 87.2% |
| Tablet | 16,355 | 67.8% |
| No Computing Device | 1,050 | 4.3% |
| Total | 24,129 | 100.0% |
Internet Access in Palm Desert
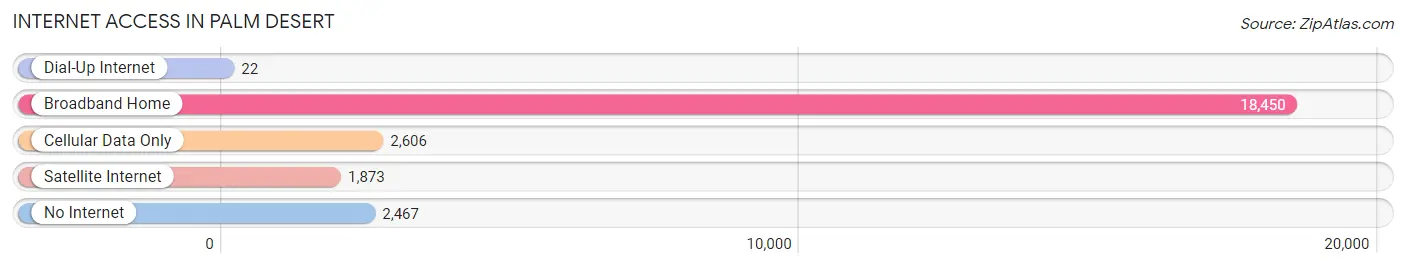
| Internet Type | # Households | % Households |
| Dial-Up Internet | 22 | 0.1% |
| Broadband Home | 18,450 | 76.5% |
| Cellular Data Only | 2,606 | 10.8% |
| Satellite Internet | 1,873 | 7.8% |
| No Internet | 2,467 | 10.2% |
| Total | 24,129 | 100.0% |
Palm Desert Summary
Palm Desert is a city located in Riverside County, California, United States. It is part of the Coachella Valley, a region of the Sonoran Desert. The city is located in the eastern part of the Coachella Valley, approximately 11 miles east of Palm Springs and 122 miles east of Los Angeles. As of the 2010 census, the population of Palm Desert was 48,445.
Geography
Palm Desert is located in the Coachella Valley, a region of the Sonoran Desert. The city is located in the eastern part of the valley, approximately 11 miles east of Palm Springs and 122 miles east of Los Angeles. The city is bordered by the Santa Rosa Mountains to the west, the San Jacinto Mountains to the east, and the Little San Bernardino Mountains to the north. The city has a total area of 27.0 square miles, of which 26.9 square miles is land and 0.1 square miles is water.
Climate
Palm Desert has a hot desert climate, with hot summers and mild winters. The average high temperature in the summer is around 100°F, and the average low temperature in the winter is around 50°F. The city receives an average of 8.5 inches of precipitation per year, with most of it occurring in the winter months.
Demographics
As of the 2010 census, there were 48,445 people, 22,739 households, and 13,082 families residing in the city. The population density was 1,811.2 people per square mile. The racial makeup of the city was 77.2% White, 4.3% African American, 0.7% Native American, 5.2% Asian, 0.2% Pacific Islander, 8.7% from other races, and 3.7% from two or more races. Hispanic or Latino of any race were 22.5% of the population.
Economy
Palm Desert is a major tourist destination in the Coachella Valley, and tourism is the city’s largest industry. The city is home to a number of resorts, golf courses, and shopping centers. The city is also home to a number of corporate headquarters, including the headquarters of the Agua Caliente Band of Cahuilla Indians. The city’s economy is also supported by a number of manufacturing and technology companies, as well as a number of government and military installations.
History
The area that is now Palm Desert was originally inhabited by the Cahuilla people. The first non-native settlers arrived in the area in the late 19th century, and the city was officially incorporated in 1973. The city experienced rapid growth in the 1970s and 1980s, and by the 1990s it had become a major tourist destination. The city has continued to grow in recent years, and it is now home to a number of resorts, golf courses, and shopping centers.
Common Questions
What is Per Capita Income in Palm Desert?
Per Capita income in Palm Desert is $55,369.
What is the Median Family Income in Palm Desert?
Median Family Income in Palm Desert is $95,332.
What is the Median Household income in Palm Desert?
Median Household Income in Palm Desert is $75,691.
What is Income or Wage Gap in Palm Desert?
Income or Wage Gap in Palm Desert is 20.9%.
Women in Palm Desert earn 79.1 cents for every dollar earned by a man.
What is Family Income Deficit in Palm Desert?
Family Income Deficit in Palm Desert is $10,526.
Families that are below poverty line in Palm Desert earn $10,526 less on average than the poverty threshold level.
What is Inequality or Gini Index in Palm Desert?
Inequality or Gini Index in Palm Desert is 0.53.
What is the Total Population of Palm Desert?
Total Population of Palm Desert is 51,290.
What is the Total Male Population of Palm Desert?
Total Male Population of Palm Desert is 24,064.
What is the Total Female Population of Palm Desert?
Total Female Population of Palm Desert is 27,226.
What is the Ratio of Males per 100 Females in Palm Desert?
There are 88.39 Males per 100 Females in Palm Desert.
What is the Ratio of Females per 100 Males in Palm Desert?
There are 113.14 Females per 100 Males in Palm Desert.
What is the Median Population Age in Palm Desert?
Median Population Age in Palm Desert is 55.2 Years.
What is the Average Family Size in Palm Desert
Average Family Size in Palm Desert is 2.7 People.
What is the Average Household Size in Palm Desert
Average Household Size in Palm Desert is 2.1 People.
How Large is the Labor Force in Palm Desert?
There are 21,963 People in the Labor Forcein in Palm Desert.
What is the Percentage of People in the Labor Force in Palm Desert?
49.1% of People are in the Labor Force in Palm Desert.
What is the Unemployment Rate in Palm Desert?
Unemployment Rate in Palm Desert is 6.5%.