Piru, CA Map & Demographics
Piru Map
Piru Overview
$27,495
PER CAPITA INCOME
$75,192
AVG FAMILY INCOME
$80,313
AVG HOUSEHOLD INCOME
21.4%
WAGE / INCOME GAP [ % ]
78.6¢/ $1
WAGE / INCOME GAP [ $ ]
$7,538
FAMILY INCOME DEFICIT
0.40
INEQUALITY / GINI INDEX
2,182
TOTAL POPULATION
1,060
MALE POPULATION
1,122
FEMALE POPULATION
94.47
MALES / 100 FEMALES
105.85
FEMALES / 100 MALES
32.7
MEDIAN AGE
3.8
AVG FAMILY SIZE
3.5
AVG HOUSEHOLD SIZE
1,122
LABOR FORCE [ PEOPLE ]
67.9%
PERCENT IN LABOR FORCE
7.8%
UNEMPLOYMENT RATE
Piru Zip Codes
Piru Area Codes
Income in Piru
Income Overview in Piru
Per Capita Income in Piru is $27,495, while median incomes of families and households are $75,192 and $80,313 respectively.
| Characteristic | Number | Measure |
| Per Capita Income | 2,182 | $27,495 |
| Median Family Income | 524 | $75,192 |
| Mean Family Income | 524 | $93,680 |
| Median Household Income | 622 | $80,313 |
| Mean Household Income | 622 | $92,674 |
| Income Deficit | 524 | $7,538 |
| Wage / Income Gap (%) | 2,182 | 21.43% |
| Wage / Income Gap ($) | 2,182 | 78.57¢ per $1 |
| Gini / Inequality Index | 2,182 | 0.40 |
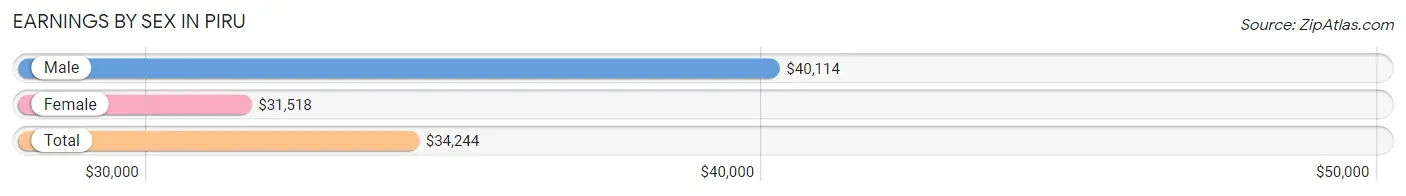
Earnings by Sex in Piru
Average Earnings in Piru are $34,244, $40,114 for men and $31,518 for women, a difference of 21.4%.
| Sex | Number | Average Earnings |
| Male | 629 (56.5%) | $40,114 |
| Female | 485 (43.5%) | $31,518 |
| Total | 1,114 (100.0%) | $34,244 |
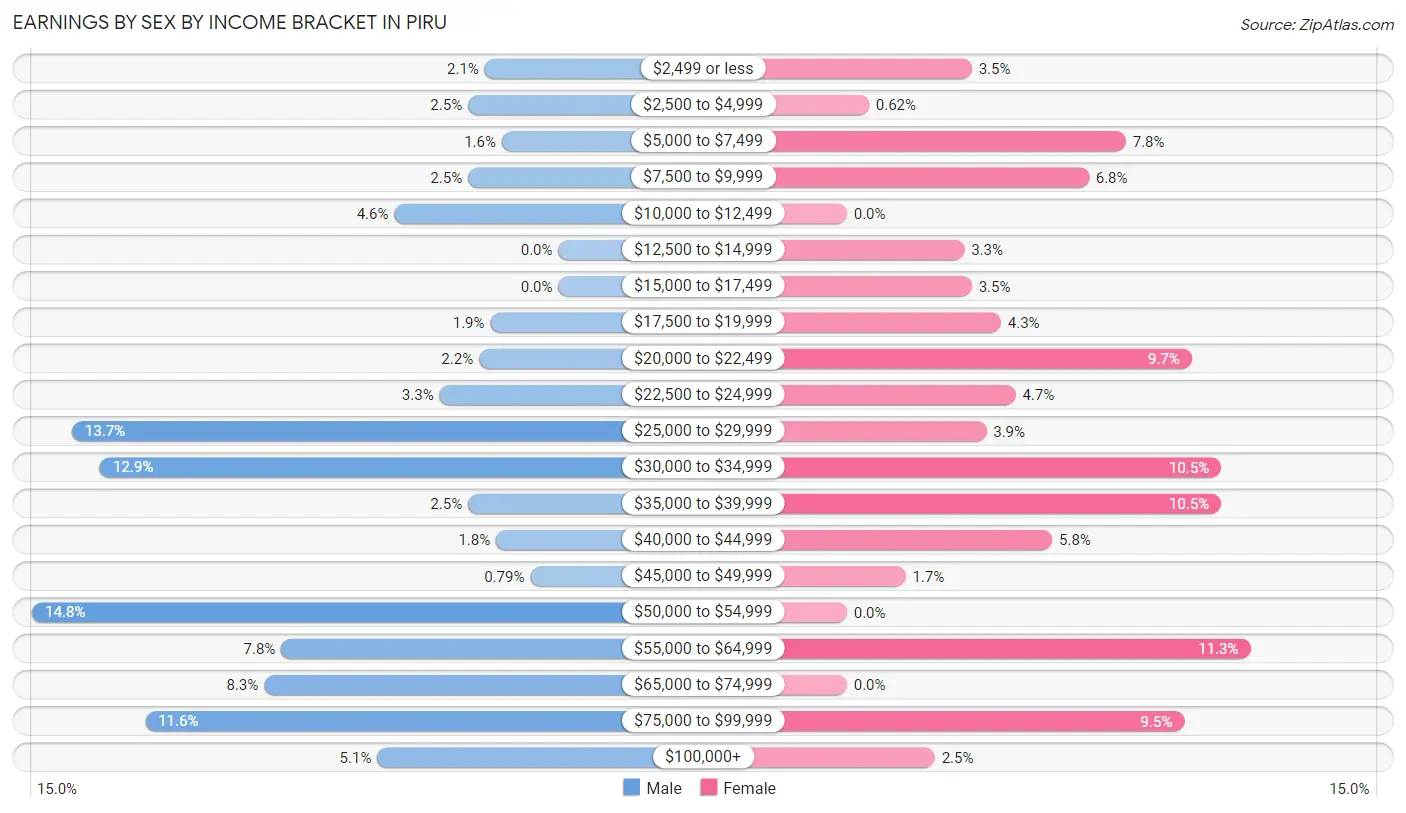
Earnings by Sex by Income Bracket in Piru
The most common earnings brackets in Piru are $50,000 to $54,999 for men (93 | 14.8%) and $55,000 to $64,999 for women (55 | 11.3%).
| Income | Male | Female |
| $2,499 or less | 13 (2.1%) | 17 (3.5%) |
| $2,500 to $4,999 | 16 (2.5%) | 3 (0.6%) |
| $5,000 to $7,499 | 10 (1.6%) | 38 (7.8%) |
| $7,500 to $9,999 | 16 (2.5%) | 33 (6.8%) |
| $10,000 to $12,499 | 29 (4.6%) | 0 (0.0%) |
| $12,500 to $14,999 | 0 (0.0%) | 16 (3.3%) |
| $15,000 to $17,499 | 0 (0.0%) | 17 (3.5%) |
| $17,500 to $19,999 | 12 (1.9%) | 21 (4.3%) |
| $20,000 to $22,499 | 14 (2.2%) | 47 (9.7%) |
| $22,500 to $24,999 | 21 (3.3%) | 23 (4.7%) |
| $25,000 to $29,999 | 86 (13.7%) | 19 (3.9%) |
| $30,000 to $34,999 | 81 (12.9%) | 51 (10.5%) |
| $35,000 to $39,999 | 16 (2.5%) | 51 (10.5%) |
| $40,000 to $44,999 | 11 (1.8%) | 28 (5.8%) |
| $45,000 to $49,999 | 5 (0.8%) | 8 (1.7%) |
| $50,000 to $54,999 | 93 (14.8%) | 0 (0.0%) |
| $55,000 to $64,999 | 49 (7.8%) | 55 (11.3%) |
| $65,000 to $74,999 | 52 (8.3%) | 0 (0.0%) |
| $75,000 to $99,999 | 73 (11.6%) | 46 (9.5%) |
| $100,000+ | 32 (5.1%) | 12 (2.5%) |
| Total | 629 (100.0%) | 485 (100.0%) |
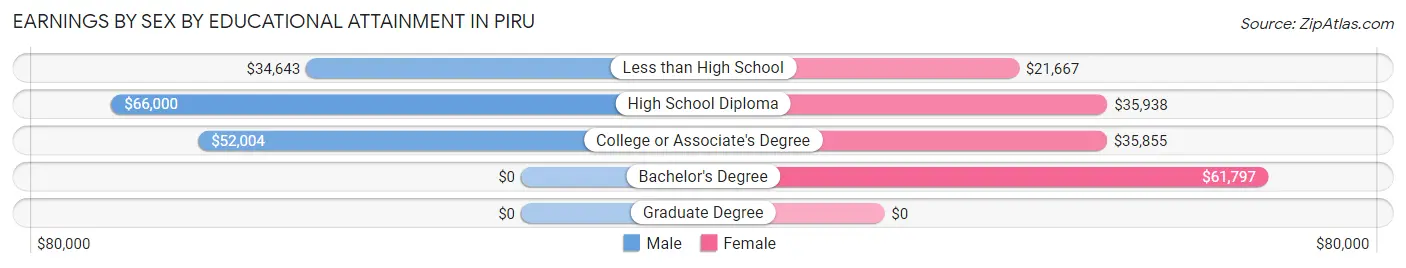
Earnings by Sex by Educational Attainment in Piru
Average earnings in Piru are $50,726 for men and $34,122 for women, a difference of 32.7%. Men with an educational attainment of high school diploma enjoy the highest average annual earnings of $66,000, while those with less than high school education earn the least with $34,643. Women with an educational attainment of bachelor's degree earn the most with the average annual earnings of $61,797, while those with less than high school education have the smallest earnings of $21,667.
| Educational Attainment | Male Income | Female Income |
| Less than High School | $34,643 | $21,667 |
| High School Diploma | $66,000 | $35,938 |
| College or Associate's Degree | $52,004 | $35,855 |
| Bachelor's Degree | - | - |
| Graduate Degree | - | - |
| Total | $50,726 | $34,122 |
Family Income in Piru
Family Income Brackets in Piru
According to the Piru family income data, there are 127 families falling into the $50,000 to $74,999 income range, which is the most common income bracket and makes up 24.2% of all families. Conversely, the less than $10,000 income bracket is the least frequent group with only 3 families (0.6%) belonging to this category.
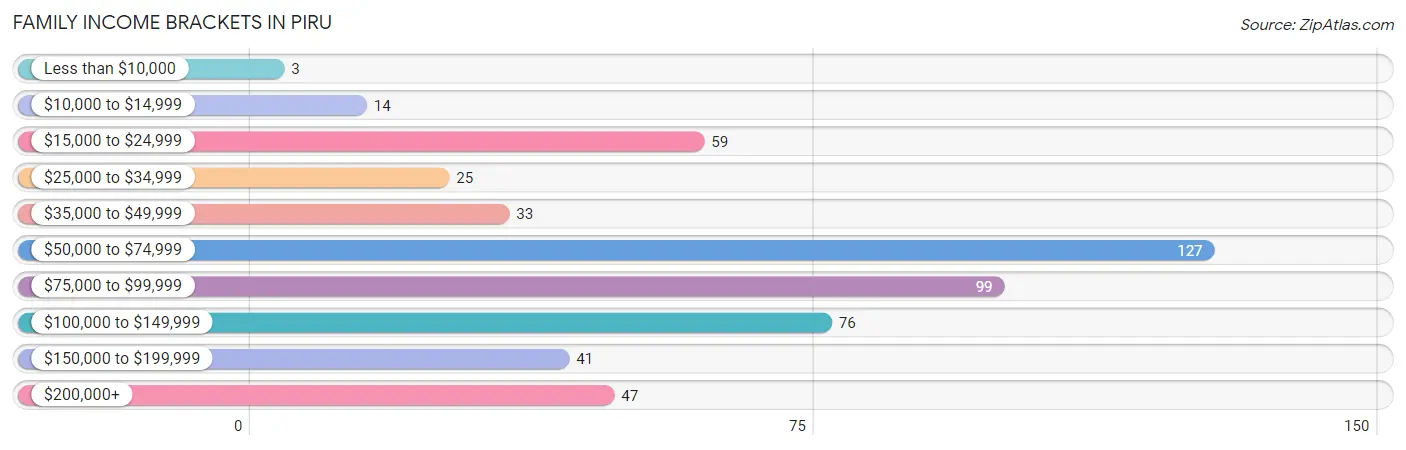
| Income Bracket | # Families | % Families |
| Less than $10,000 | 3 | 0.6% |
| $10,000 to $14,999 | 14 | 2.7% |
| $15,000 to $24,999 | 59 | 11.3% |
| $25,000 to $34,999 | 25 | 4.8% |
| $35,000 to $49,999 | 33 | 6.3% |
| $50,000 to $74,999 | 127 | 24.2% |
| $75,000 to $99,999 | 99 | 18.9% |
| $100,000 to $149,999 | 76 | 14.5% |
| $150,000 to $199,999 | 41 | 7.8% |
| $200,000+ | 47 | 9.0% |
Family Income by Famaliy Size in Piru
3-person families (170 | 32.4%) account for the highest median family income in Piru with $76,538 per family, while 2-person families (153 | 29.2%) have the highest median income of $30,387 per family member.
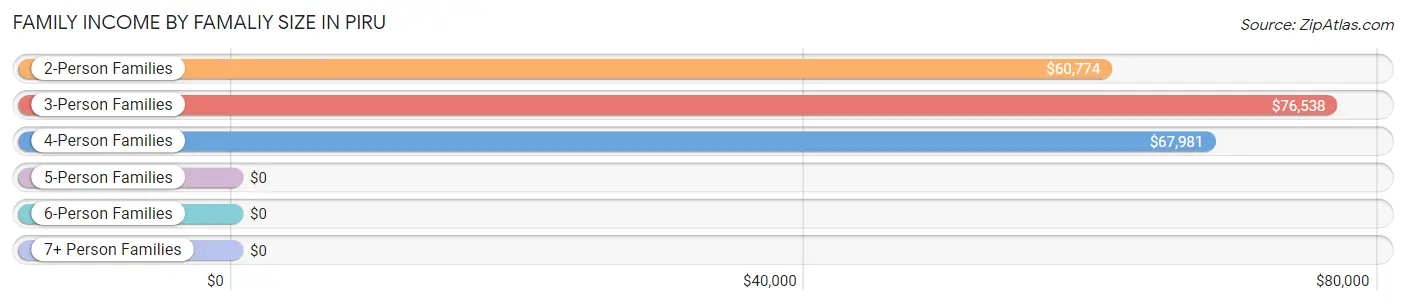
| Income Bracket | # Families | Median Income |
| 2-Person Families | 153 (29.2%) | $60,774 |
| 3-Person Families | 170 (32.4%) | $76,538 |
| 4-Person Families | 107 (20.4%) | $67,981 |
| 5-Person Families | 40 (7.6%) | $0 |
| 6-Person Families | 32 (6.1%) | $0 |
| 7+ Person Families | 22 (4.2%) | $0 |
| Total | 524 (100.0%) | $75,192 |
Family Income by Number of Earners in Piru
The median family income in Piru is $75,192, with families comprising 3+ earners (86) having the highest median family income of $145,278, while families with 1 earner (170) have the lowest median family income of $43,333, accounting for 16.4% and 32.4% of families, respectively.
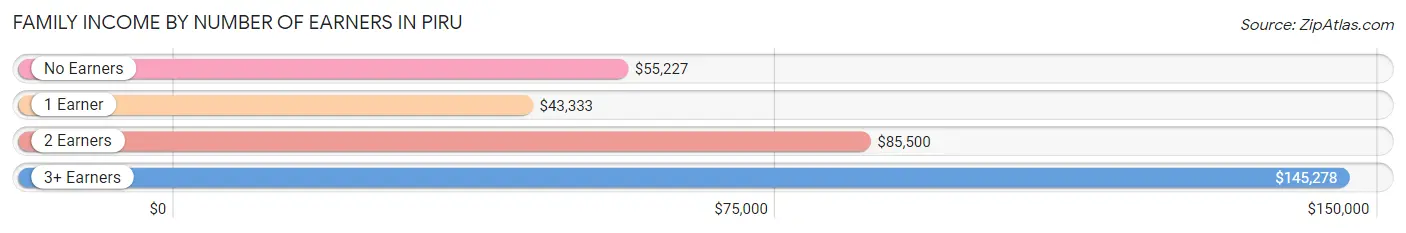
| Number of Earners | # Families | Median Income |
| No Earners | 44 (8.4%) | $55,227 |
| 1 Earner | 170 (32.4%) | $43,333 |
| 2 Earners | 224 (42.7%) | $85,500 |
| 3+ Earners | 86 (16.4%) | $145,278 |
| Total | 524 (100.0%) | $75,192 |
Household Income in Piru
Household Income Brackets in Piru
With 122 households falling in the category, the $100,000 to $149,999 income range is the most frequent in Piru, accounting for 19.6% of all households. In contrast, only 14 households (2.2%) fall into the $10,000 to $14,999 income bracket, making it the least populous group.
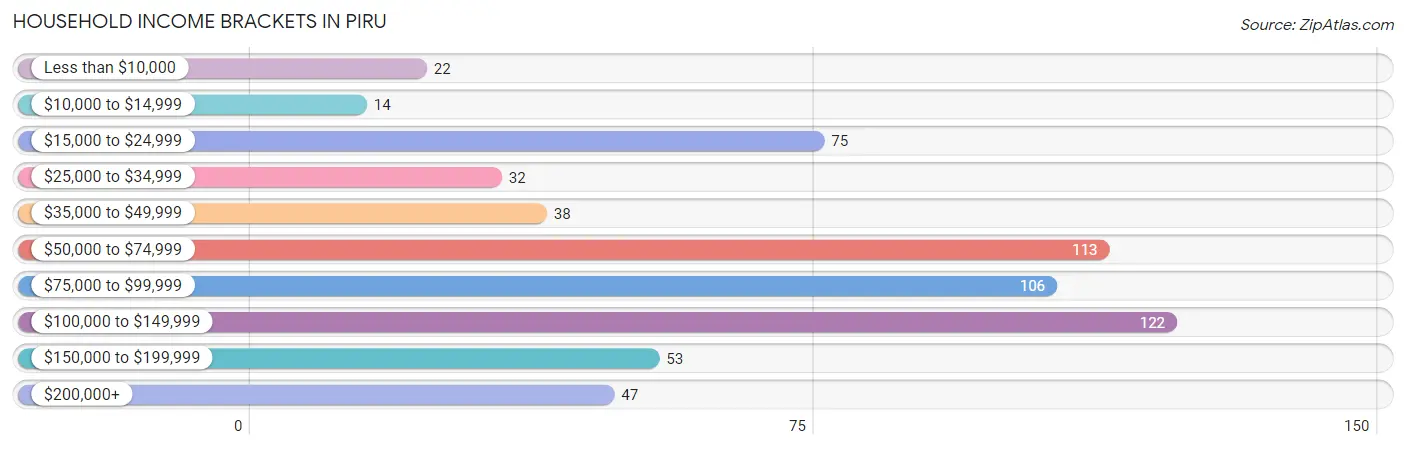
| Income Bracket | # Households | % Households |
| Less than $10,000 | 22 | 3.5% |
| $10,000 to $14,999 | 14 | 2.3% |
| $15,000 to $24,999 | 75 | 12.1% |
| $25,000 to $34,999 | 32 | 5.1% |
| $35,000 to $49,999 | 38 | 6.1% |
| $50,000 to $74,999 | 113 | 18.2% |
| $75,000 to $99,999 | 106 | 17.0% |
| $100,000 to $149,999 | 122 | 19.6% |
| $150,000 to $199,999 | 53 | 8.5% |
| $200,000+ | 47 | 7.6% |
Household Income by Householder Age in Piru
The median household income in Piru is $80,313, with the highest median household income of $91,818 found in the 65+ years age bracket for the primary householder. A total of 156 households (25.1%) fall into this category. Meanwhile, the 15 to 24 years age bracket for the primary householder has the lowest median household income of $0, with 8 households (1.3%) in this group.
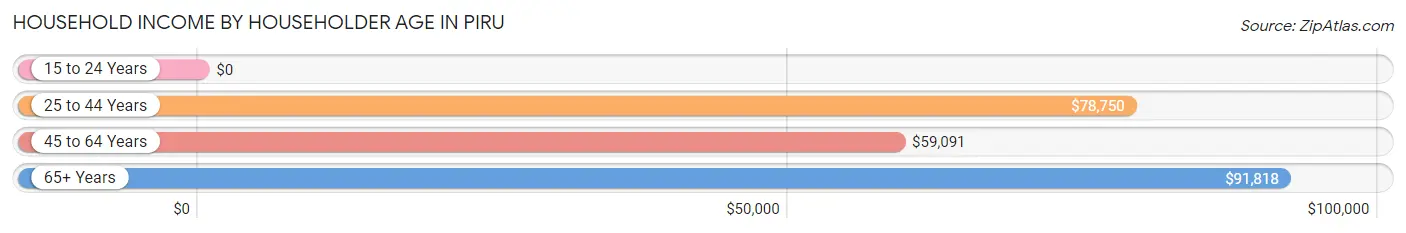
| Income Bracket | # Households | Median Income |
| 15 to 24 Years | 8 (1.3%) | $0 |
| 25 to 44 Years | 240 (38.6%) | $78,750 |
| 45 to 64 Years | 218 (35.0%) | $59,091 |
| 65+ Years | 156 (25.1%) | $91,818 |
| Total | 622 (100.0%) | $80,313 |
Poverty in Piru
Income Below Poverty by Sex and Age in Piru
With 16.4% poverty level for males and 11.5% for females among the residents of Piru, 16 and 17 year old males and 5 year old females are the most vulnerable to poverty, with 12 males (100.0%) and 6 females (100.0%) in their respective age groups living below the poverty level.
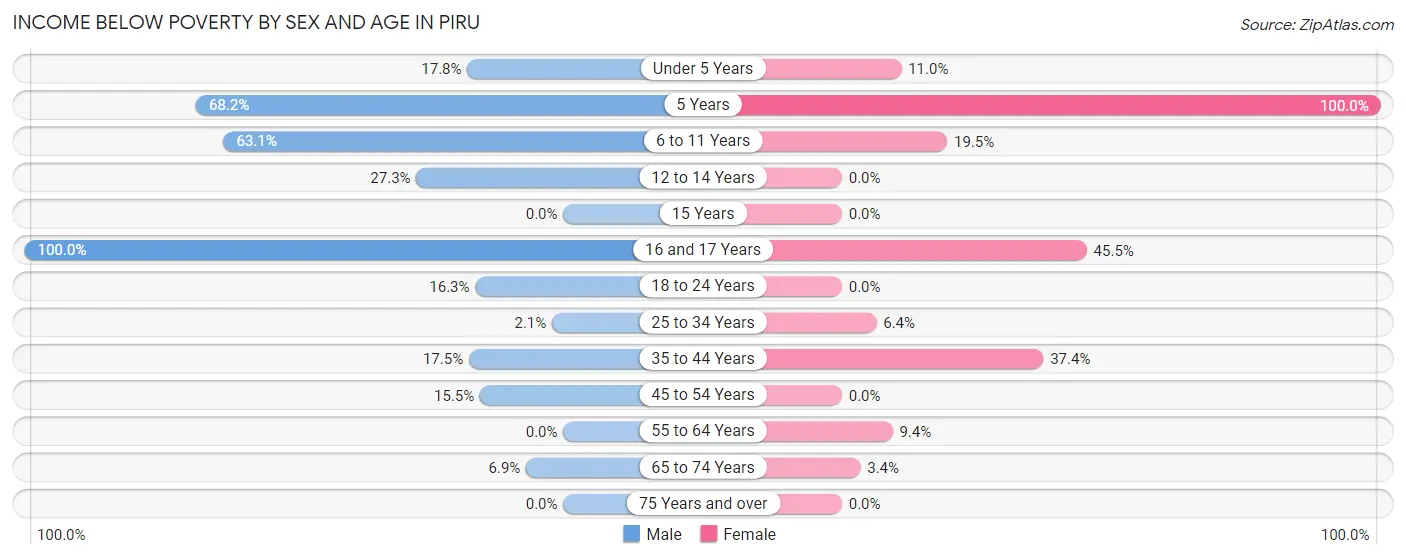
| Age Bracket | Male | Female |
| Under 5 Years | 18 (17.8%) | 16 (11.0%) |
| 5 Years | 15 (68.2%) | 6 (100.0%) |
| 6 to 11 Years | 41 (63.1%) | 17 (19.5%) |
| 12 to 14 Years | 15 (27.3%) | 0 (0.0%) |
| 15 Years | 0 (0.0%) | 0 (0.0%) |
| 16 and 17 Years | 12 (100.0%) | 15 (45.5%) |
| 18 to 24 Years | 16 (16.3%) | 0 (0.0%) |
| 25 to 34 Years | 4 (2.1%) | 11 (6.4%) |
| 35 to 44 Years | 24 (17.5%) | 43 (37.4%) |
| 45 to 54 Years | 19 (15.4%) | 0 (0.0%) |
| 55 to 64 Years | 0 (0.0%) | 14 (9.4%) |
| 65 to 74 Years | 10 (6.9%) | 6 (3.4%) |
| 75 Years and over | 0 (0.0%) | 0 (0.0%) |
| Total | 174 (16.4%) | 128 (11.5%) |
Income Above Poverty by Sex and Age in Piru
According to the poverty statistics in Piru, males aged 55 to 64 years and females aged 12 to 14 years are the age groups that are most secure financially, with 100.0% of males and 100.0% of females in these age groups living above the poverty line.
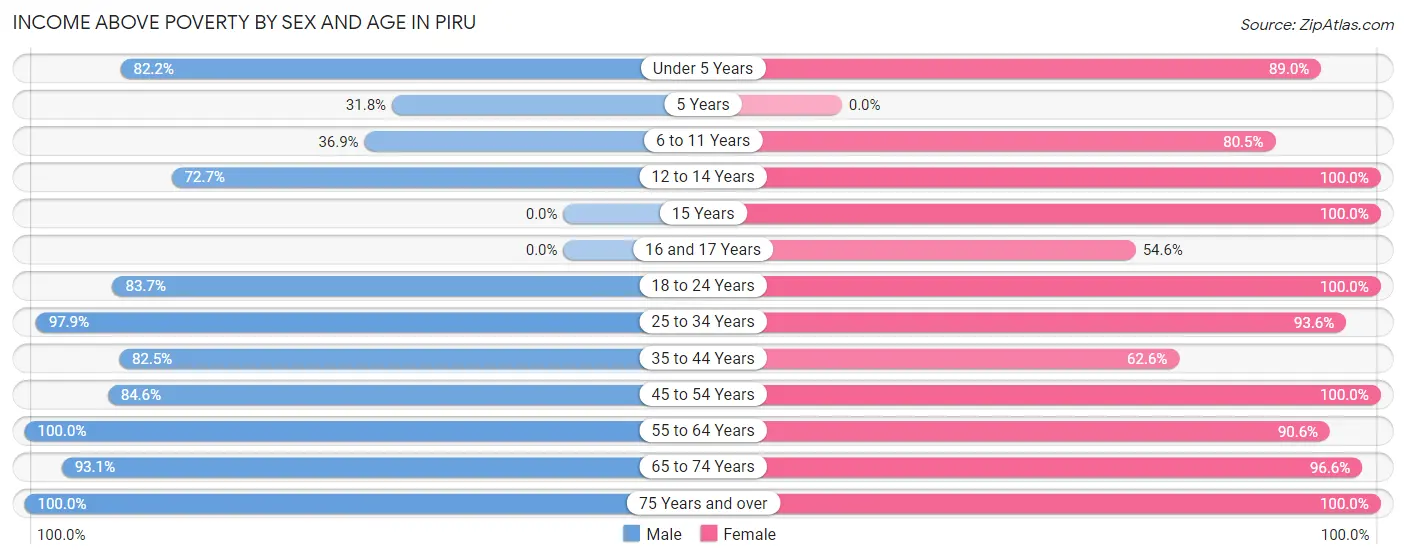
| Age Bracket | Male | Female |
| Under 5 Years | 83 (82.2%) | 129 (89.0%) |
| 5 Years | 7 (31.8%) | 0 (0.0%) |
| 6 to 11 Years | 24 (36.9%) | 70 (80.5%) |
| 12 to 14 Years | 40 (72.7%) | 7 (100.0%) |
| 15 Years | 0 (0.0%) | 32 (100.0%) |
| 16 and 17 Years | 0 (0.0%) | 18 (54.5%) |
| 18 to 24 Years | 82 (83.7%) | 97 (100.0%) |
| 25 to 34 Years | 187 (97.9%) | 161 (93.6%) |
| 35 to 44 Years | 113 (82.5%) | 72 (62.6%) |
| 45 to 54 Years | 104 (84.6%) | 66 (100.0%) |
| 55 to 64 Years | 71 (100.0%) | 135 (90.6%) |
| 65 to 74 Years | 135 (93.1%) | 169 (96.6%) |
| 75 Years and over | 40 (100.0%) | 29 (100.0%) |
| Total | 886 (83.6%) | 985 (88.5%) |
Income Below Poverty Among Married-Couple Families in Piru
The poverty statistics for married-couple families in Piru show that 6.7% or 26 of the total 387 families live below the poverty line. Families with 3 or 4 children have the highest poverty rate of 25.5%, comprising of 13 families. On the other hand, families with no children have the lowest poverty rate of 0.0%, which includes 0 families.
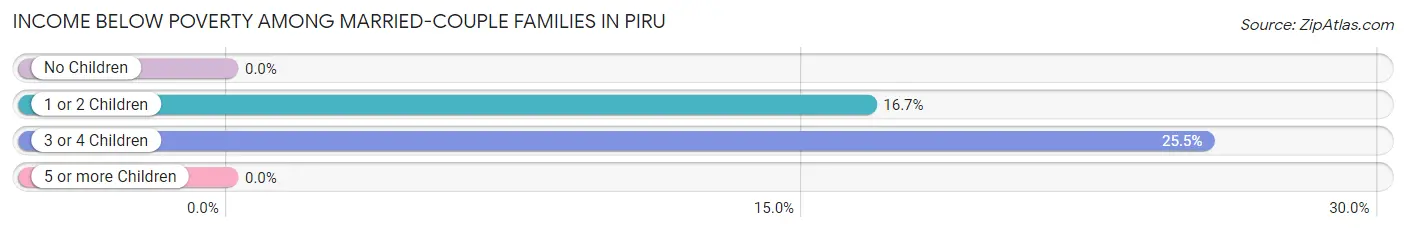
| Children | Above Poverty | Below Poverty |
| No Children | 248 (100.0%) | 0 (0.0%) |
| 1 or 2 Children | 65 (83.3%) | 13 (16.7%) |
| 3 or 4 Children | 38 (74.5%) | 13 (25.5%) |
| 5 or more Children | 10 (100.0%) | 0 (0.0%) |
| Total | 361 (93.3%) | 26 (6.7%) |
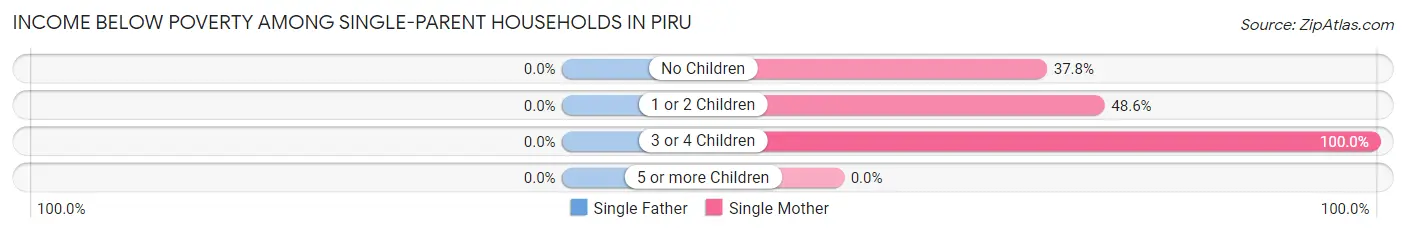
Income Below Poverty Among Single-Parent Households in Piru
| Children | Single Father | Single Mother |
| No Children | 0 (0.0%) | 14 (37.8%) |
| 1 or 2 Children | 0 (0.0%) | 17 (48.6%) |
| 3 or 4 Children | 0 (0.0%) | 14 (100.0%) |
| 5 or more Children | 0 (0.0%) | 0 (0.0%) |
| Total | 0 (0.0%) | 45 (52.3%) |
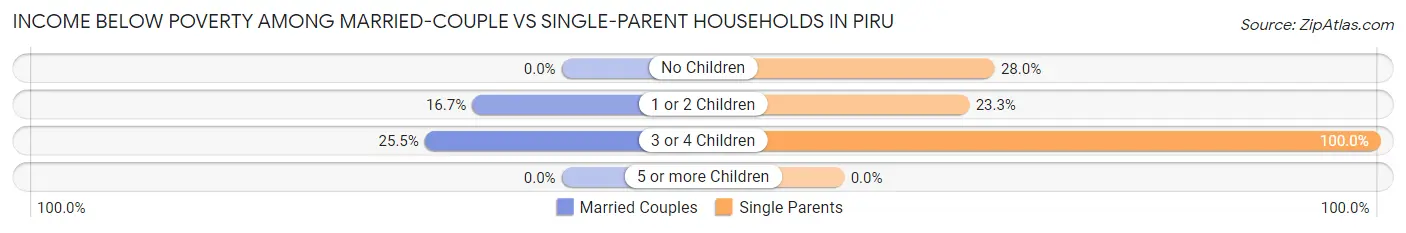
Income Below Poverty Among Married-Couple vs Single-Parent Households in Piru
The poverty data for Piru shows that 26 of the married-couple family households (6.7%) and 45 of the single-parent households (32.9%) are living below the poverty level. Within the married-couple family households, those with 3 or 4 children have the highest poverty rate, with 13 households (25.5%) falling below the poverty line. Among the single-parent households, those with 3 or 4 children have the highest poverty rate, with 14 household (100.0%) living below poverty.
| Children | Married-Couple Families | Single-Parent Households |
| No Children | 0 (0.0%) | 14 (28.0%) |
| 1 or 2 Children | 13 (16.7%) | 17 (23.3%) |
| 3 or 4 Children | 13 (25.5%) | 14 (100.0%) |
| 5 or more Children | 0 (0.0%) | 0 (0.0%) |
| Total | 26 (6.7%) | 45 (32.9%) |
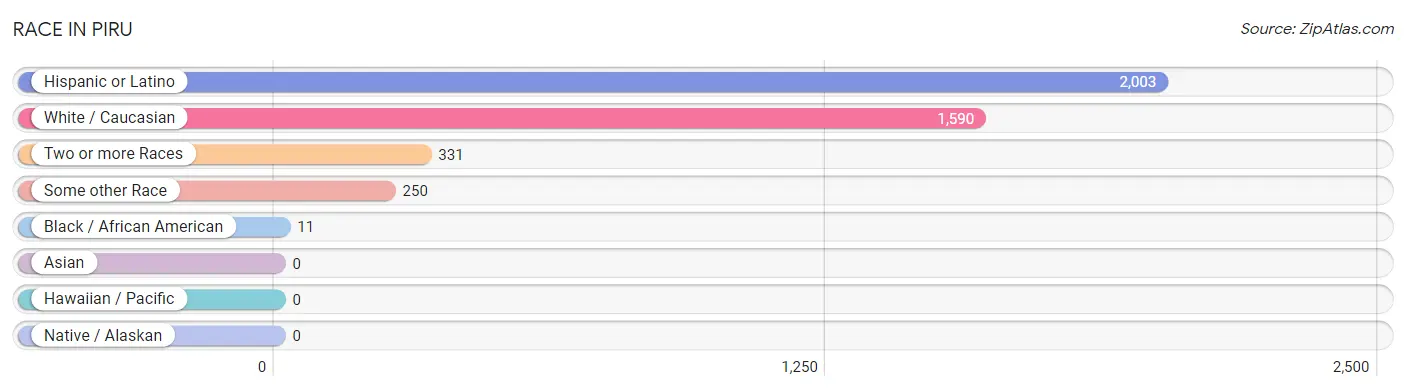
Race in Piru
The most populous races in Piru are Hispanic or Latino (2,003 | 91.8%), White / Caucasian (1,590 | 72.9%), and Two or more Races (331 | 15.2%).
| Race | # Population | % Population |
| Asian | 0 | 0.0% |
| Black / African American | 11 | 0.5% |
| Hawaiian / Pacific | 0 | 0.0% |
| Hispanic or Latino | 2,003 | 91.8% |
| Native / Alaskan | 0 | 0.0% |
| White / Caucasian | 1,590 | 72.9% |
| Two or more Races | 331 | 15.2% |
| Some other Race | 250 | 11.5% |
| Total | 2,182 | 100.0% |
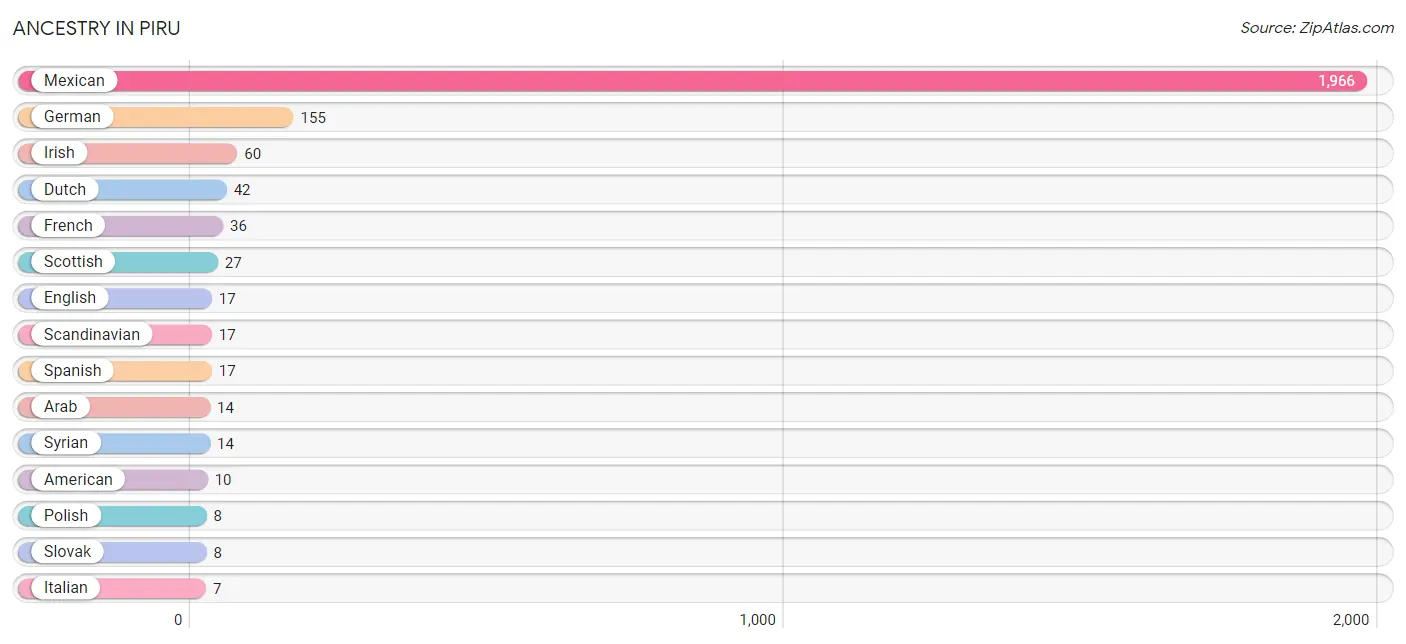
Ancestry in Piru
The most populous ancestries reported in Piru are Mexican (1,966 | 90.1%), German (155 | 7.1%), Irish (60 | 2.8%), Dutch (42 | 1.9%), and French (36 | 1.7%), together accounting for 103.5% of all Piru residents.
| Ancestry | # Population | % Population |
| American | 10 | 0.5% |
| Arab | 14 | 0.6% |
| Cuban | 4 | 0.2% |
| Dutch | 42 | 1.9% |
| English | 17 | 0.8% |
| French | 36 | 1.7% |
| German | 155 | 7.1% |
| Irish | 60 | 2.8% |
| Italian | 7 | 0.3% |
| Jamaican | 4 | 0.2% |
| Mexican | 1,966 | 90.1% |
| Polish | 8 | 0.4% |
| Scandinavian | 17 | 0.8% |
| Scottish | 27 | 1.2% |
| Slovak | 8 | 0.4% |
| Spaniard | 7 | 0.3% |
| Spanish | 17 | 0.8% |
| Swedish | 7 | 0.3% |
| Syrian | 14 | 0.6% | View All 19 Rows |
Immigrants in Piru
The most numerous immigrant groups reported in Piru came from Central America (638 | 29.2%), Latin America (638 | 29.2%), Mexico (638 | 29.2%), Canada (18 | 0.8%), and Asia (8 | 0.4%), together accounting for 88.9% of all Piru residents.
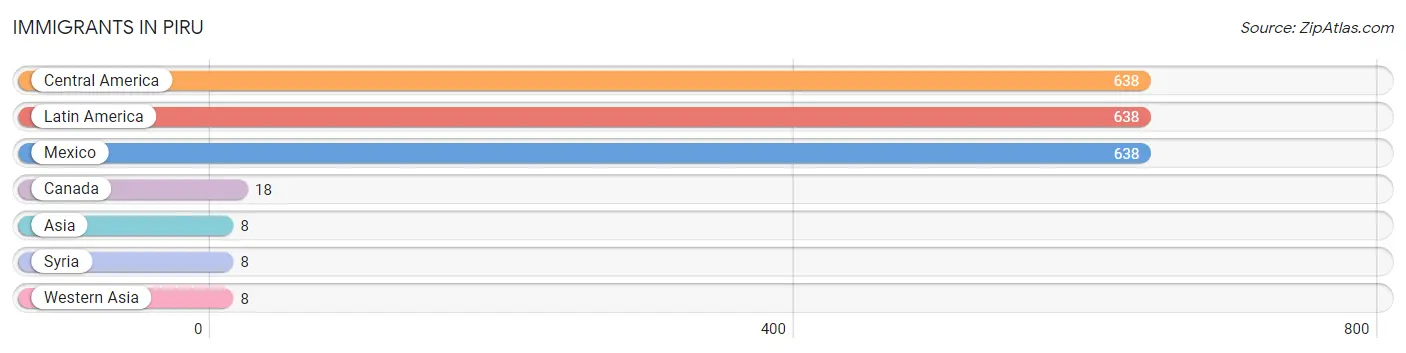
| Immigration Origin | # Population | % Population |
| Asia | 8 | 0.4% |
| Canada | 18 | 0.8% |
| Central America | 638 | 29.2% |
| Latin America | 638 | 29.2% |
| Mexico | 638 | 29.2% |
| Syria | 8 | 0.4% |
| Western Asia | 8 | 0.4% | View All 7 Rows |
Sex and Age in Piru
Sex and Age in Piru
The most populous age groups in Piru are 65 to 69 Years (110 | 10.4%) for men and Under 5 Years (154 | 13.7%) for women.
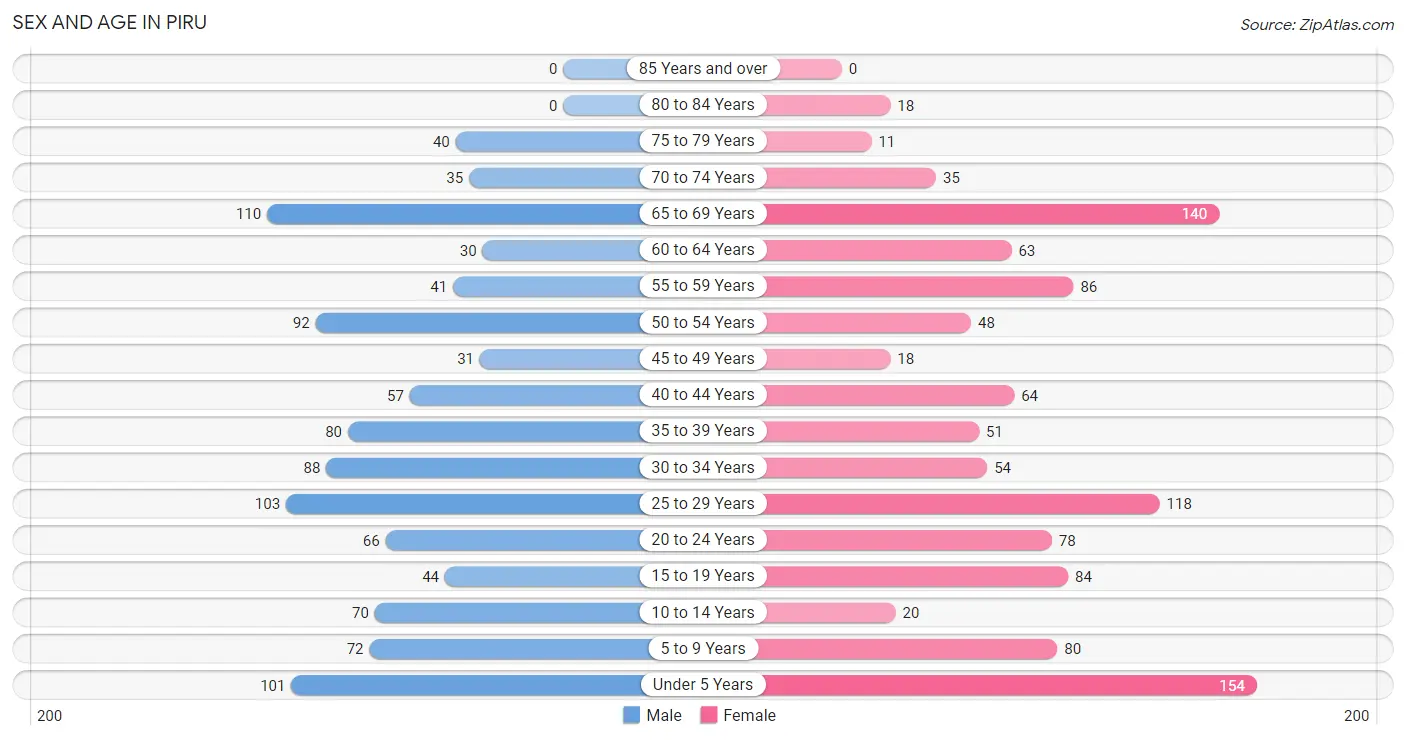
| Age Bracket | Male | Female |
| Under 5 Years | 101 (9.5%) | 154 (13.7%) |
| 5 to 9 Years | 72 (6.8%) | 80 (7.1%) |
| 10 to 14 Years | 70 (6.6%) | 20 (1.8%) |
| 15 to 19 Years | 44 (4.2%) | 84 (7.5%) |
| 20 to 24 Years | 66 (6.2%) | 78 (7.0%) |
| 25 to 29 Years | 103 (9.7%) | 118 (10.5%) |
| 30 to 34 Years | 88 (8.3%) | 54 (4.8%) |
| 35 to 39 Years | 80 (7.5%) | 51 (4.5%) |
| 40 to 44 Years | 57 (5.4%) | 64 (5.7%) |
| 45 to 49 Years | 31 (2.9%) | 18 (1.6%) |
| 50 to 54 Years | 92 (8.7%) | 48 (4.3%) |
| 55 to 59 Years | 41 (3.9%) | 86 (7.7%) |
| 60 to 64 Years | 30 (2.8%) | 63 (5.6%) |
| 65 to 69 Years | 110 (10.4%) | 140 (12.5%) |
| 70 to 74 Years | 35 (3.3%) | 35 (3.1%) |
| 75 to 79 Years | 40 (3.8%) | 11 (1.0%) |
| 80 to 84 Years | 0 (0.0%) | 18 (1.6%) |
| 85 Years and over | 0 (0.0%) | 0 (0.0%) |
| Total | 1,060 (100.0%) | 1,122 (100.0%) |
Families and Households in Piru
Median Family Size in Piru
The median family size in Piru is 3.80 persons per family, with single female/mother families (86 | 16.4%) accounting for the largest median family size of 4.21 persons per family. On the other hand, married-couple families (387 | 73.9%) represent the smallest median family size with 3.70 persons per family.
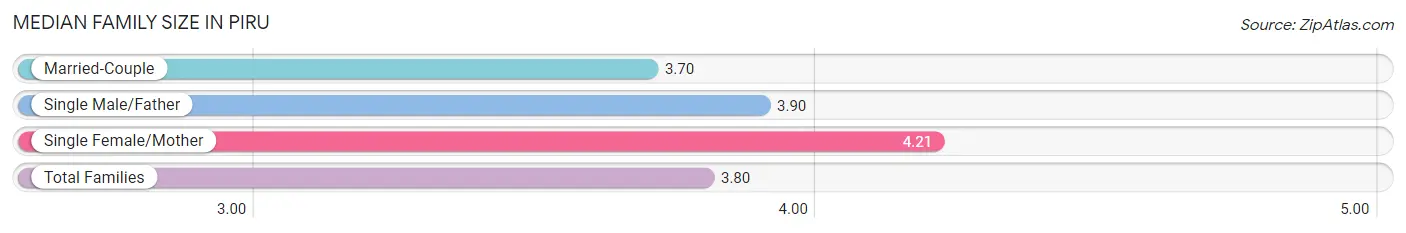
| Family Type | # Families | Family Size |
| Married-Couple | 387 (73.9%) | 3.70 |
| Single Male/Father | 51 (9.7%) | 3.90 |
| Single Female/Mother | 86 (16.4%) | 4.21 |
| Total Families | 524 (100.0%) | 3.80 |
Median Household Size in Piru
The median household size in Piru is 3.51 persons per household, with single male/father households (51 | 8.2%) accounting for the largest median household size of 4.31 persons per household. non-family households (98 | 15.8%) represent the smallest median household size with 1.57 persons per household.
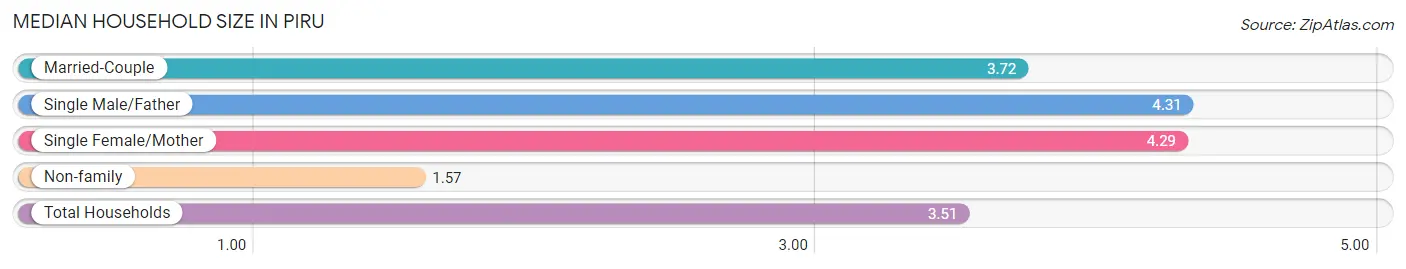
| Household Type | # Households | Household Size |
| Married-Couple | 387 (62.2%) | 3.72 |
| Single Male/Father | 51 (8.2%) | 4.31 |
| Single Female/Mother | 86 (13.8%) | 4.29 |
| Non-family | 98 (15.8%) | 1.57 |
| Total Households | 622 (100.0%) | 3.51 |
Household Size by Marriage Status in Piru
Out of a total of 622 households in Piru, 524 (84.2%) are family households, while 98 (15.8%) are nonfamily households. The most numerous type of family households are 3-person households, comprising 150, and the most common type of nonfamily households are 1-person households, comprising 59.
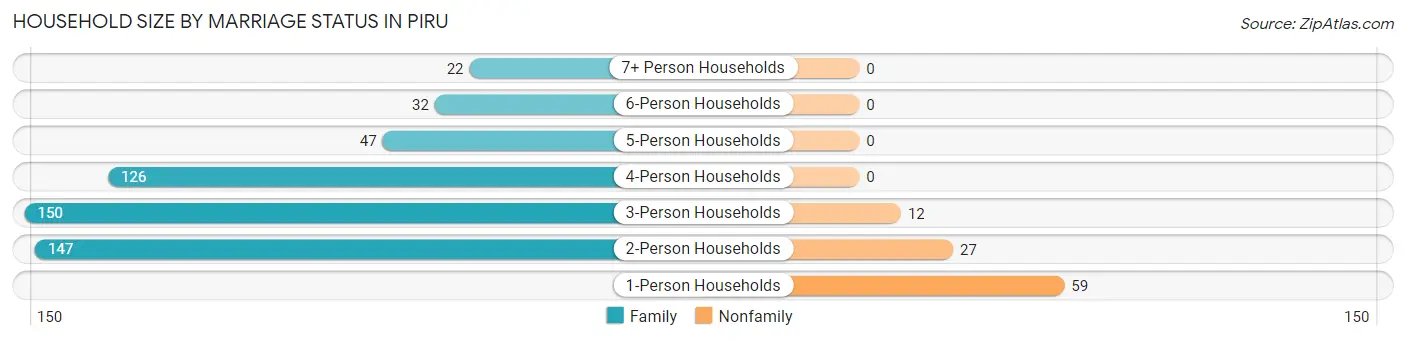
| Household Size | Family Households | Nonfamily Households |
| 1-Person Households | - | 59 (9.5%) |
| 2-Person Households | 147 (23.6%) | 27 (4.3%) |
| 3-Person Households | 150 (24.1%) | 12 (1.9%) |
| 4-Person Households | 126 (20.3%) | 0 (0.0%) |
| 5-Person Households | 47 (7.6%) | 0 (0.0%) |
| 6-Person Households | 32 (5.1%) | 0 (0.0%) |
| 7+ Person Households | 22 (3.5%) | 0 (0.0%) |
| Total | 524 (84.2%) | 98 (15.8%) |
Female Fertility in Piru
Fertility by Age in Piru
Average fertility rate in Piru is 140.0 births per 1,000 women. Women in the age bracket of 20 to 34 years have the highest fertility rate with 188.0 births per 1,000 women. Women in the age bracket of 20 to 34 years acount for 68.1% of all women with births.
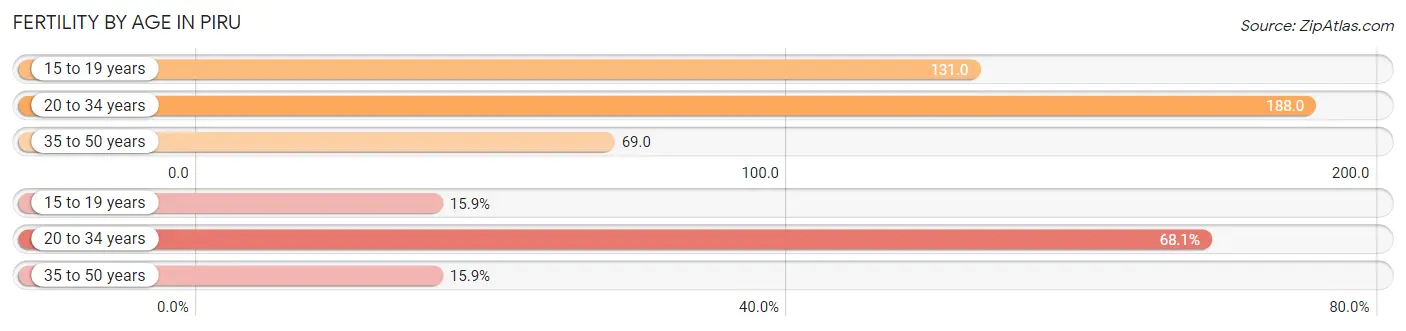
| Age Bracket | Women with Births | Births / 1,000 Women |
| 15 to 19 years | 11 (15.9%) | 131.0 |
| 20 to 34 years | 47 (68.1%) | 188.0 |
| 35 to 50 years | 11 (15.9%) | 69.0 |
| Total | 69 (100.0%) | 140.0 |
Fertility by Age by Marriage Status in Piru
84.1% of women with births (69) in Piru are married. The highest percentage of unmarried women with births falls into 15 to 19 years age bracket with 100.0% of them unmarried at the time of birth, while the lowest percentage of unmarried women with births belong to 20 to 34 years age bracket with 0.0% of them unmarried.
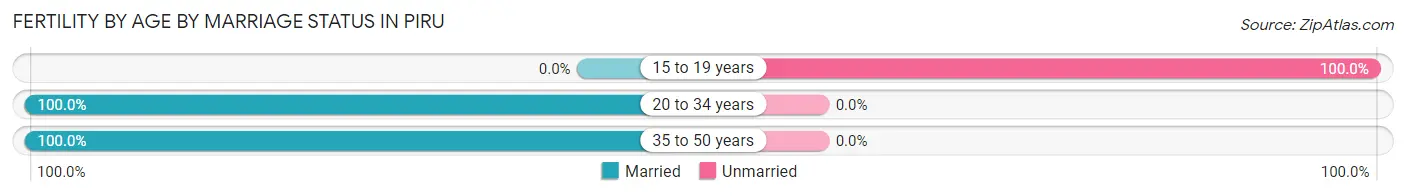
| Age Bracket | Married | Unmarried |
| 15 to 19 years | 0 (0.0%) | 11 (100.0%) |
| 20 to 34 years | 47 (100.0%) | 0 (0.0%) |
| 35 to 50 years | 11 (100.0%) | 0 (0.0%) |
| Total | 58 (84.1%) | 11 (15.9%) |
Fertility by Education in Piru
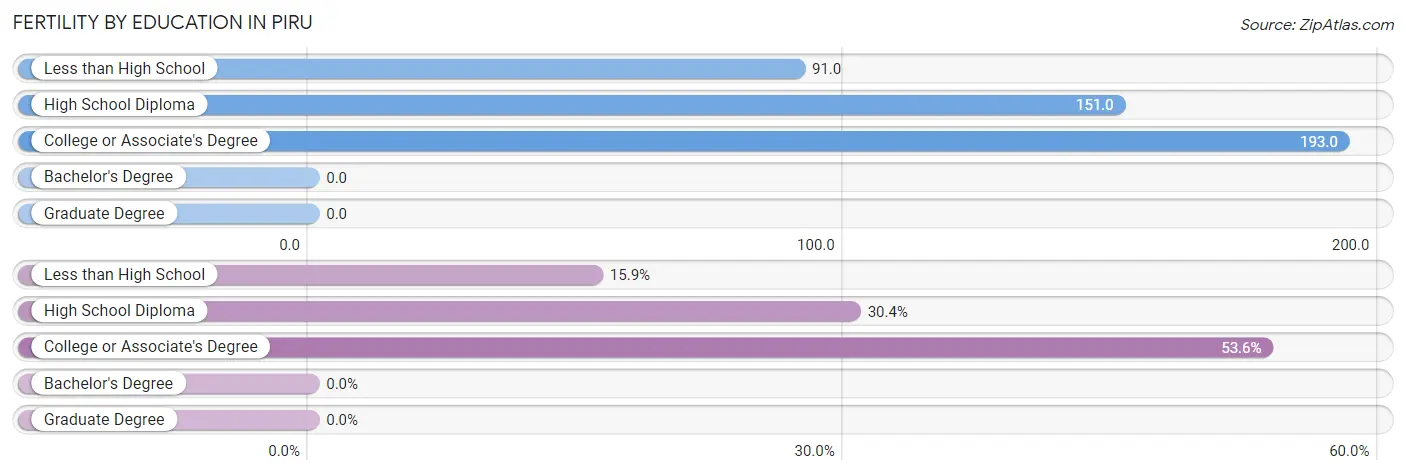
| Educational Attainment | Women with Births | Births / 1,000 Women |
| Less than High School | 11 (15.9%) | 91.0 |
| High School Diploma | 21 (30.4%) | 151.0 |
| College or Associate's Degree | 37 (53.6%) | 193.0 |
| Bachelor's Degree | 0 (0.0%) | 0.0 |
| Graduate Degree | 0 (0.0%) | 0.0 |
| Total | 69 (100.0%) | 140.0 |
Fertility by Education by Marriage Status in Piru
15.9% of women with births in Piru are unmarried. Women with the educational attainment of high school diploma are most likely to be married with 100.0% of them married at childbirth, while women with the educational attainment of less than high school are least likely to be married with 100.0% of them unmarried at childbirth.
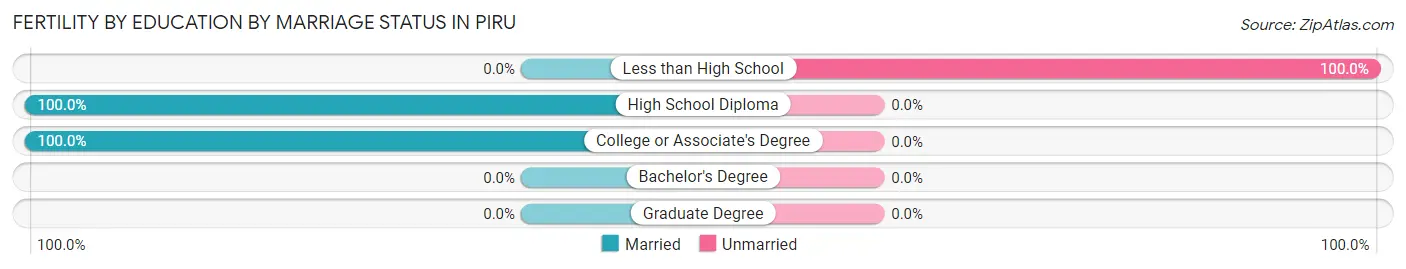
| Educational Attainment | Married | Unmarried |
| Less than High School | 0 (0.0%) | 11 (100.0%) |
| High School Diploma | 21 (100.0%) | 0 (0.0%) |
| College or Associate's Degree | 37 (100.0%) | 0 (0.0%) |
| Bachelor's Degree | 0 (0.0%) | 0 (0.0%) |
| Graduate Degree | 0 (0.0%) | 0 (0.0%) |
| Total | 58 (84.1%) | 11 (15.9%) |
Employment Characteristics in Piru
Employment by Class of Employer in Piru
Among the 1,026 employed individuals in Piru, private company employees (816 | 79.5%), local government employees (74 | 7.2%), and self-employed (not incorporated) (56 | 5.5%) make up the most common classes of employment.
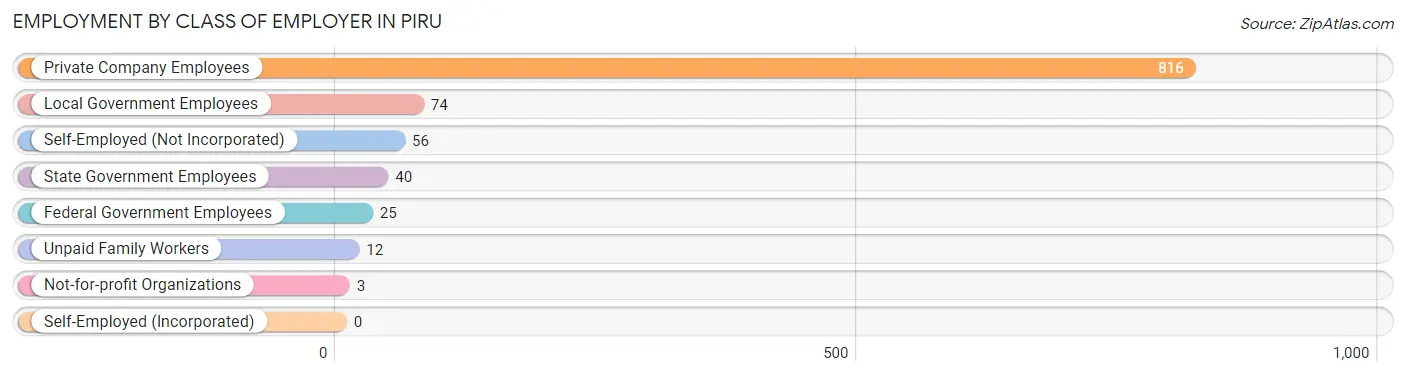
| Employer Class | # Employees | % Employees |
| Private Company Employees | 816 | 79.5% |
| Self-Employed (Incorporated) | 0 | 0.0% |
| Self-Employed (Not Incorporated) | 56 | 5.5% |
| Not-for-profit Organizations | 3 | 0.3% |
| Local Government Employees | 74 | 7.2% |
| State Government Employees | 40 | 3.9% |
| Federal Government Employees | 25 | 2.4% |
| Unpaid Family Workers | 12 | 1.2% |
| Total | 1,026 | 100.0% |
Employment Status by Age in Piru
According to the labor force statistics for Piru, out of the total population over 16 years of age (1,653), 67.9% or 1,122 individuals are in the labor force, with 7.8% or 88 of them unemployed. The age group with the highest labor force participation rate is 55 to 59 years, with 94.5% or 120 individuals in the labor force. Within the labor force, the 45 to 54 years age range has the highest percentage of unemployed individuals, with 19.4% or 24 of them being unemployed.
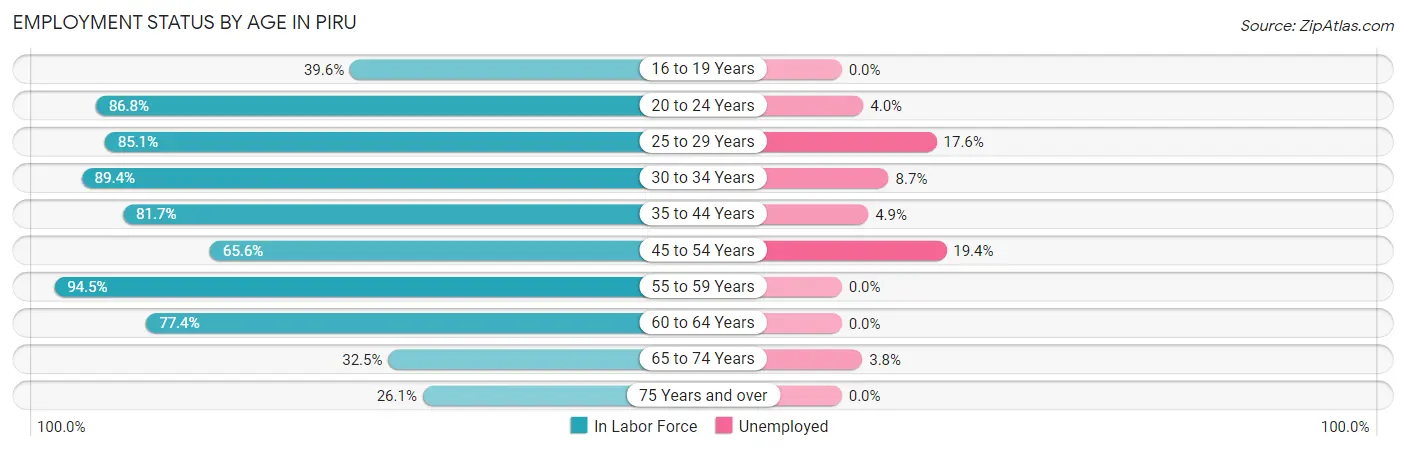
| Age Bracket | In Labor Force | Unemployed |
| 16 to 19 Years | 38 (39.6%) | 0 (0.0%) |
| 20 to 24 Years | 125 (86.8%) | 5 (4.0%) |
| 25 to 29 Years | 188 (85.1%) | 33 (17.6%) |
| 30 to 34 Years | 127 (89.4%) | 11 (8.7%) |
| 35 to 44 Years | 206 (81.7%) | 10 (4.9%) |
| 45 to 54 Years | 124 (65.6%) | 24 (19.4%) |
| 55 to 59 Years | 120 (94.5%) | 0 (0.0%) |
| 60 to 64 Years | 72 (77.4%) | 0 (0.0%) |
| 65 to 74 Years | 104 (32.5%) | 4 (3.8%) |
| 75 Years and over | 18 (26.1%) | 0 (0.0%) |
| Total | 1,122 (67.9%) | 88 (7.8%) |
Employment Status by Educational Attainment in Piru
According to labor force statistics for Piru, 81.7% of individuals (837) out of the total population between 25 and 64 years of age (1,024) are in the labor force, with 9.3% or 78 of them being unemployed. The group with the highest labor force participation rate are those with the educational attainment of bachelor's degree or higher, with 96.1% or 123 individuals in the labor force. Within the labor force, individuals with high school diploma education have the highest percentage of unemployment, with 21.7% or 30 of them being unemployed.
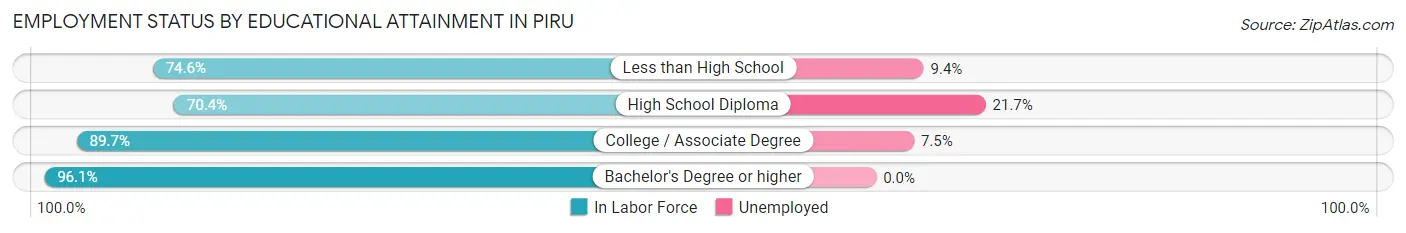
| Educational Attainment | In Labor Force | Unemployed |
| Less than High School | 255 (74.6%) | 32 (9.4%) |
| High School Diploma | 138 (70.4%) | 43 (21.7%) |
| College / Associate Degree | 321 (89.7%) | 27 (7.5%) |
| Bachelor's Degree or higher | 123 (96.1%) | 0 (0.0%) |
| Total | 837 (81.7%) | 95 (9.3%) |
Employment Occupations by Sex in Piru
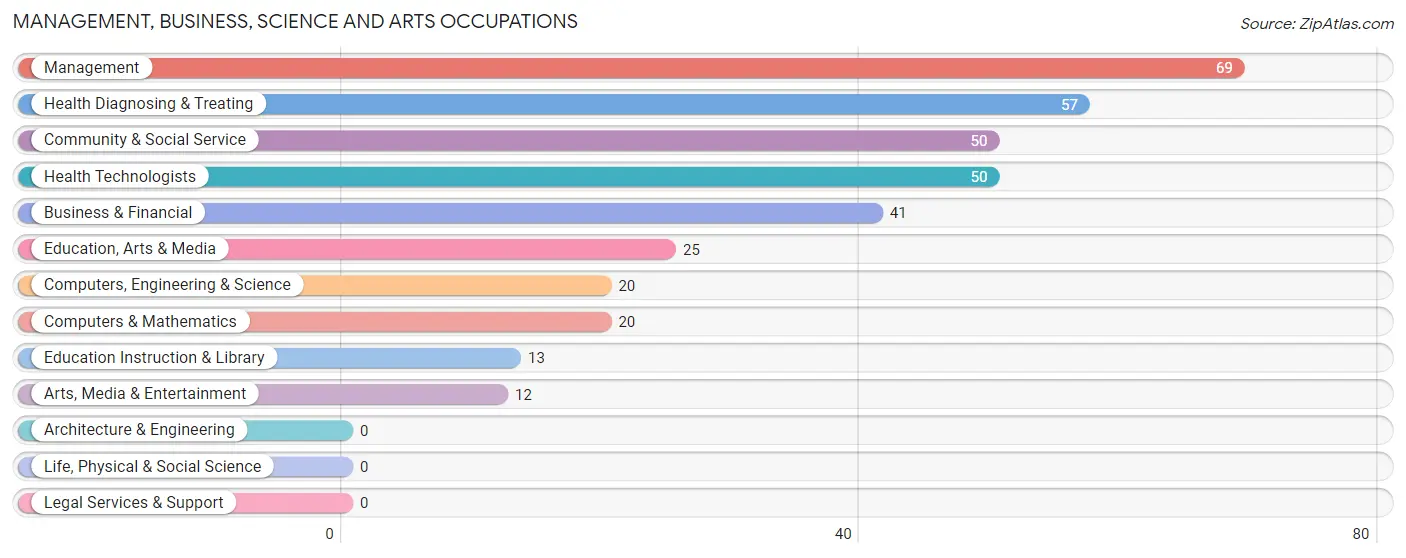
Management, Business, Science and Arts Occupations
The most common Management, Business, Science and Arts occupations in Piru are Management (69 | 6.7%), Health Diagnosing & Treating (57 | 5.5%), Community & Social Service (50 | 4.8%), Health Technologists (50 | 4.8%), and Business & Financial (41 | 4.0%).
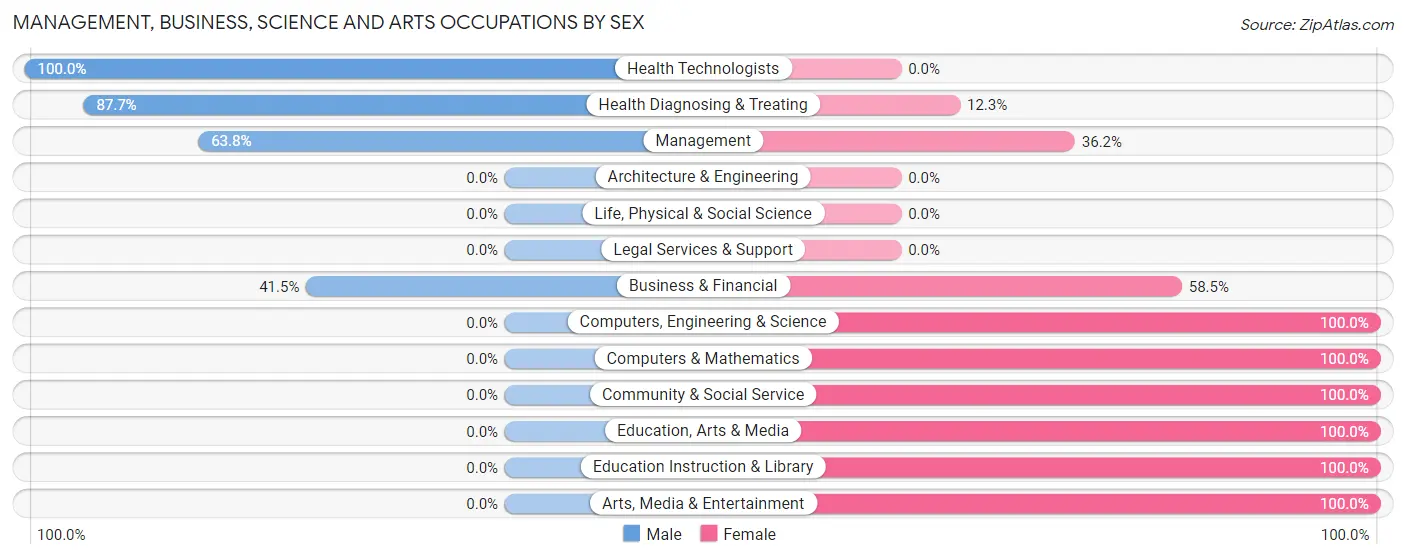
Management, Business, Science and Arts Occupations by Sex
Within the Management, Business, Science and Arts occupations in Piru, the most male-oriented occupations are Health Technologists (100.0%), Health Diagnosing & Treating (87.7%), and Management (63.8%), while the most female-oriented occupations are Computers, Engineering & Science (100.0%), Computers & Mathematics (100.0%), and Community & Social Service (100.0%).
| Occupation | Male | Female |
| Management | 44 (63.8%) | 25 (36.2%) |
| Business & Financial | 17 (41.5%) | 24 (58.5%) |
| Computers, Engineering & Science | 0 (0.0%) | 20 (100.0%) |
| Computers & Mathematics | 0 (0.0%) | 20 (100.0%) |
| Architecture & Engineering | 0 (0.0%) | 0 (0.0%) |
| Life, Physical & Social Science | 0 (0.0%) | 0 (0.0%) |
| Community & Social Service | 0 (0.0%) | 50 (100.0%) |
| Education, Arts & Media | 0 (0.0%) | 25 (100.0%) |
| Legal Services & Support | 0 (0.0%) | 0 (0.0%) |
| Education Instruction & Library | 0 (0.0%) | 13 (100.0%) |
| Arts, Media & Entertainment | 0 (0.0%) | 12 (100.0%) |
| Health Diagnosing & Treating | 50 (87.7%) | 7 (12.3%) |
| Health Technologists | 50 (100.0%) | 0 (0.0%) |
| Total (Category) | 111 (46.8%) | 126 (53.2%) |
| Total (Overall) | 598 (57.8%) | 437 (42.2%) |
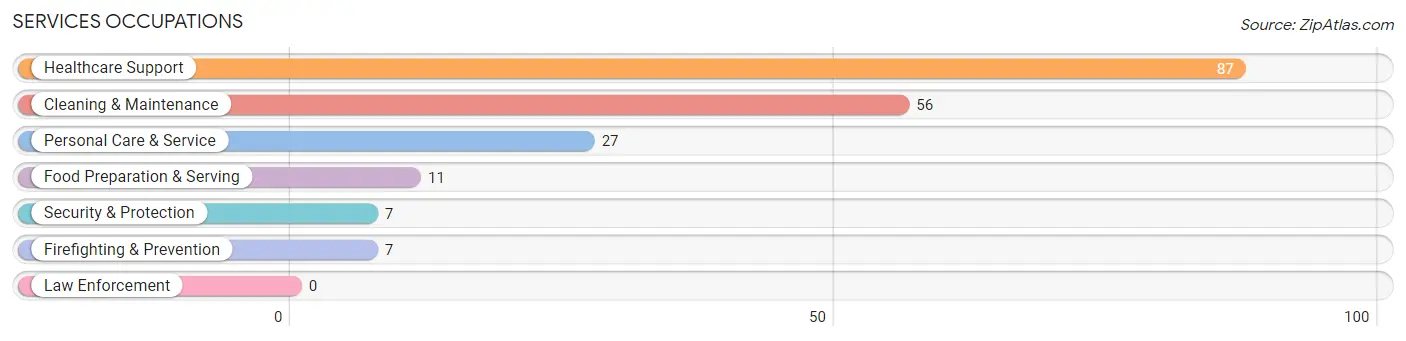
Services Occupations
The most common Services occupations in Piru are Healthcare Support (87 | 8.4%), Cleaning & Maintenance (56 | 5.4%), Personal Care & Service (27 | 2.6%), Food Preparation & Serving (11 | 1.1%), and Security & Protection (7 | 0.7%).
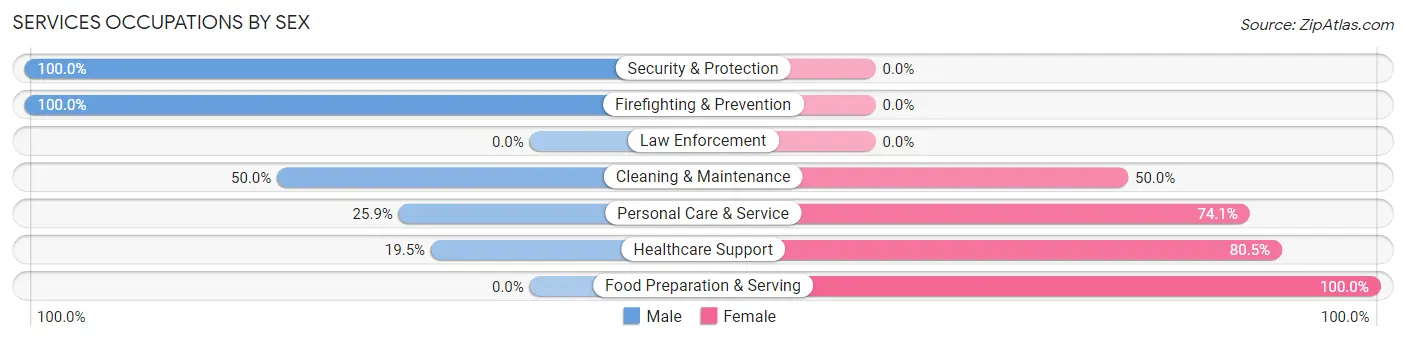
Services Occupations by Sex
Within the Services occupations in Piru, the most male-oriented occupations are Security & Protection (100.0%), Firefighting & Prevention (100.0%), and Cleaning & Maintenance (50.0%), while the most female-oriented occupations are Food Preparation & Serving (100.0%), Healthcare Support (80.5%), and Personal Care & Service (74.1%).
| Occupation | Male | Female |
| Healthcare Support | 17 (19.5%) | 70 (80.5%) |
| Security & Protection | 7 (100.0%) | 0 (0.0%) |
| Firefighting & Prevention | 7 (100.0%) | 0 (0.0%) |
| Law Enforcement | 0 (0.0%) | 0 (0.0%) |
| Food Preparation & Serving | 0 (0.0%) | 11 (100.0%) |
| Cleaning & Maintenance | 28 (50.0%) | 28 (50.0%) |
| Personal Care & Service | 7 (25.9%) | 20 (74.1%) |
| Total (Category) | 59 (31.4%) | 129 (68.6%) |
| Total (Overall) | 598 (57.8%) | 437 (42.2%) |
Sales and Office Occupations
The most common Sales and Office occupations in Piru are Sales & Related (122 | 11.8%), and Office & Administration (35 | 3.4%).
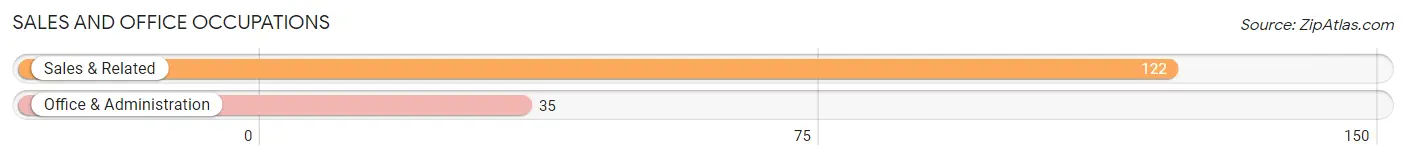
Sales and Office Occupations by Sex
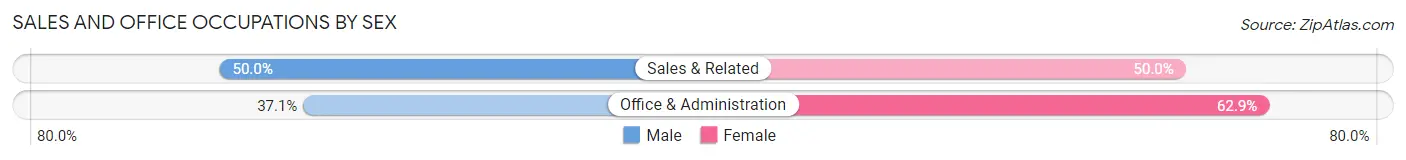
| Occupation | Male | Female |
| Sales & Related | 61 (50.0%) | 61 (50.0%) |
| Office & Administration | 13 (37.1%) | 22 (62.9%) |
| Total (Category) | 74 (47.1%) | 83 (52.9%) |
| Total (Overall) | 598 (57.8%) | 437 (42.2%) |
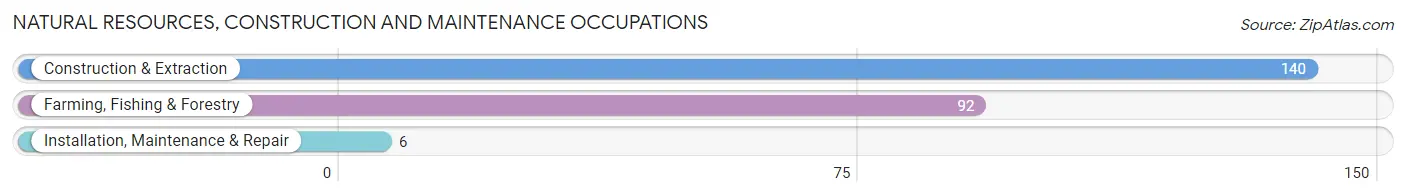
Natural Resources, Construction and Maintenance Occupations
The most common Natural Resources, Construction and Maintenance occupations in Piru are Construction & Extraction (140 | 13.5%), Farming, Fishing & Forestry (92 | 8.9%), and Installation, Maintenance & Repair (6 | 0.6%).
Natural Resources, Construction and Maintenance Occupations by Sex
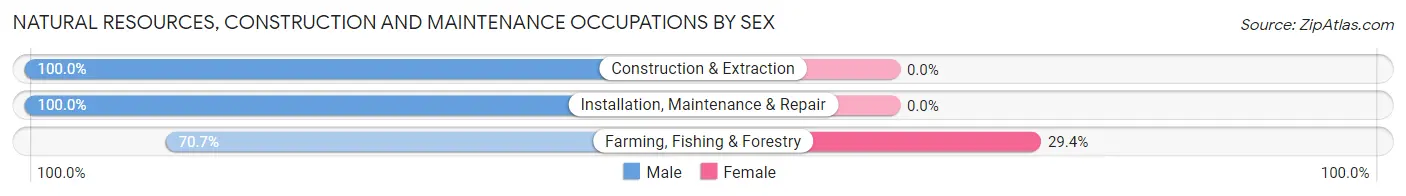
| Occupation | Male | Female |
| Farming, Fishing & Forestry | 65 (70.7%) | 27 (29.3%) |
| Construction & Extraction | 140 (100.0%) | 0 (0.0%) |
| Installation, Maintenance & Repair | 6 (100.0%) | 0 (0.0%) |
| Total (Category) | 211 (88.7%) | 27 (11.3%) |
| Total (Overall) | 598 (57.8%) | 437 (42.2%) |
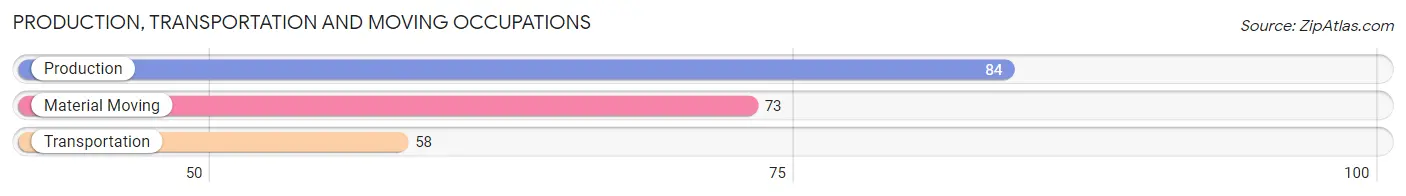
Production, Transportation and Moving Occupations
The most common Production, Transportation and Moving occupations in Piru are Production (84 | 8.1%), Material Moving (73 | 7.0%), and Transportation (58 | 5.6%).
Production, Transportation and Moving Occupations by Sex
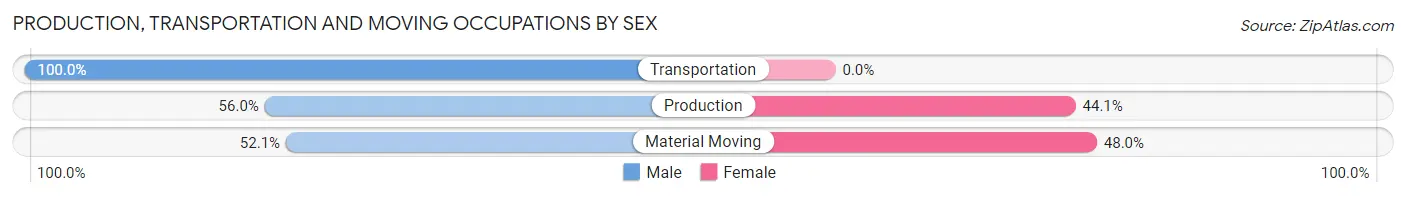
| Occupation | Male | Female |
| Production | 47 (55.9%) | 37 (44.1%) |
| Transportation | 58 (100.0%) | 0 (0.0%) |
| Material Moving | 38 (52.0%) | 35 (47.9%) |
| Total (Category) | 143 (66.5%) | 72 (33.5%) |
| Total (Overall) | 598 (57.8%) | 437 (42.2%) |
Employment Industries by Sex in Piru
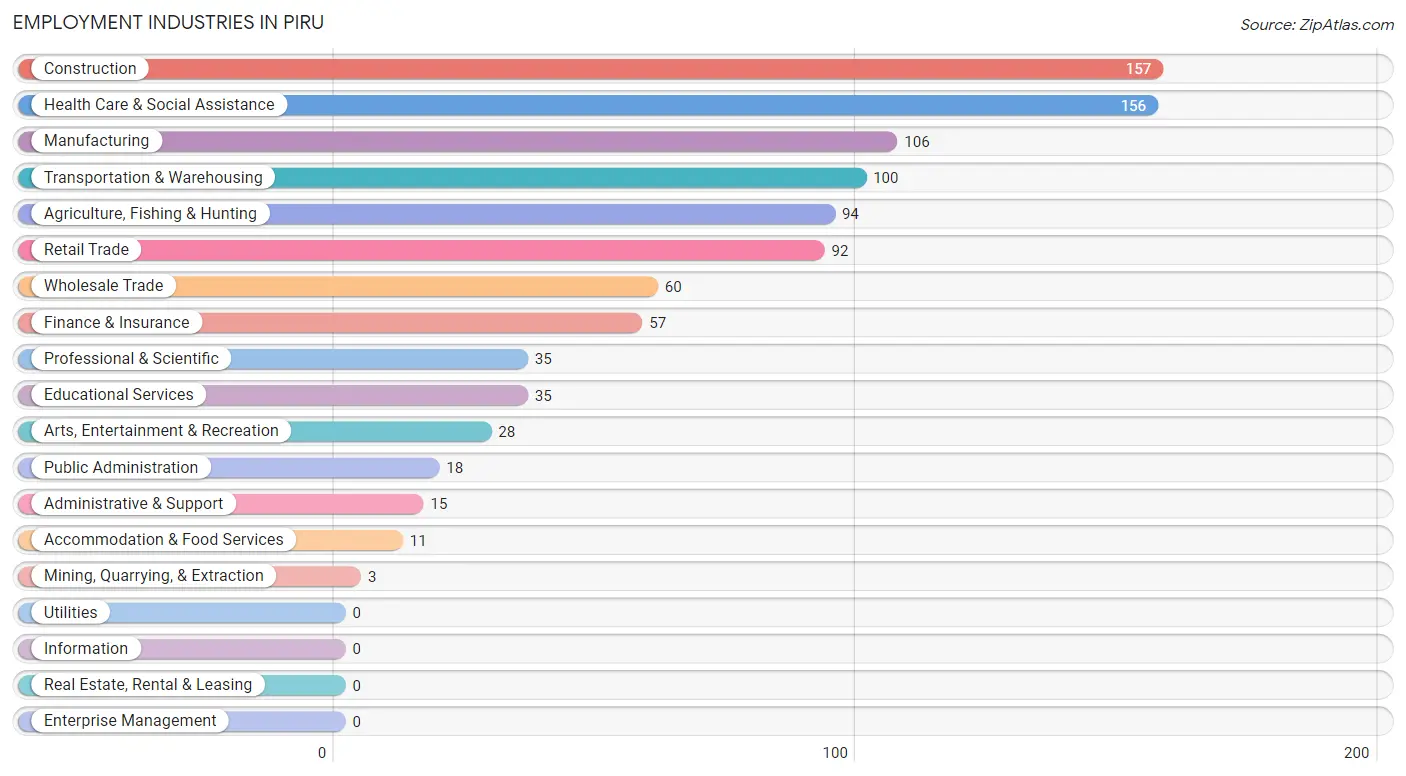
Employment Industries in Piru
The major employment industries in Piru include Construction (157 | 15.2%), Health Care & Social Assistance (156 | 15.1%), Manufacturing (106 | 10.2%), Transportation & Warehousing (100 | 9.7%), and Agriculture, Fishing & Hunting (94 | 9.1%).
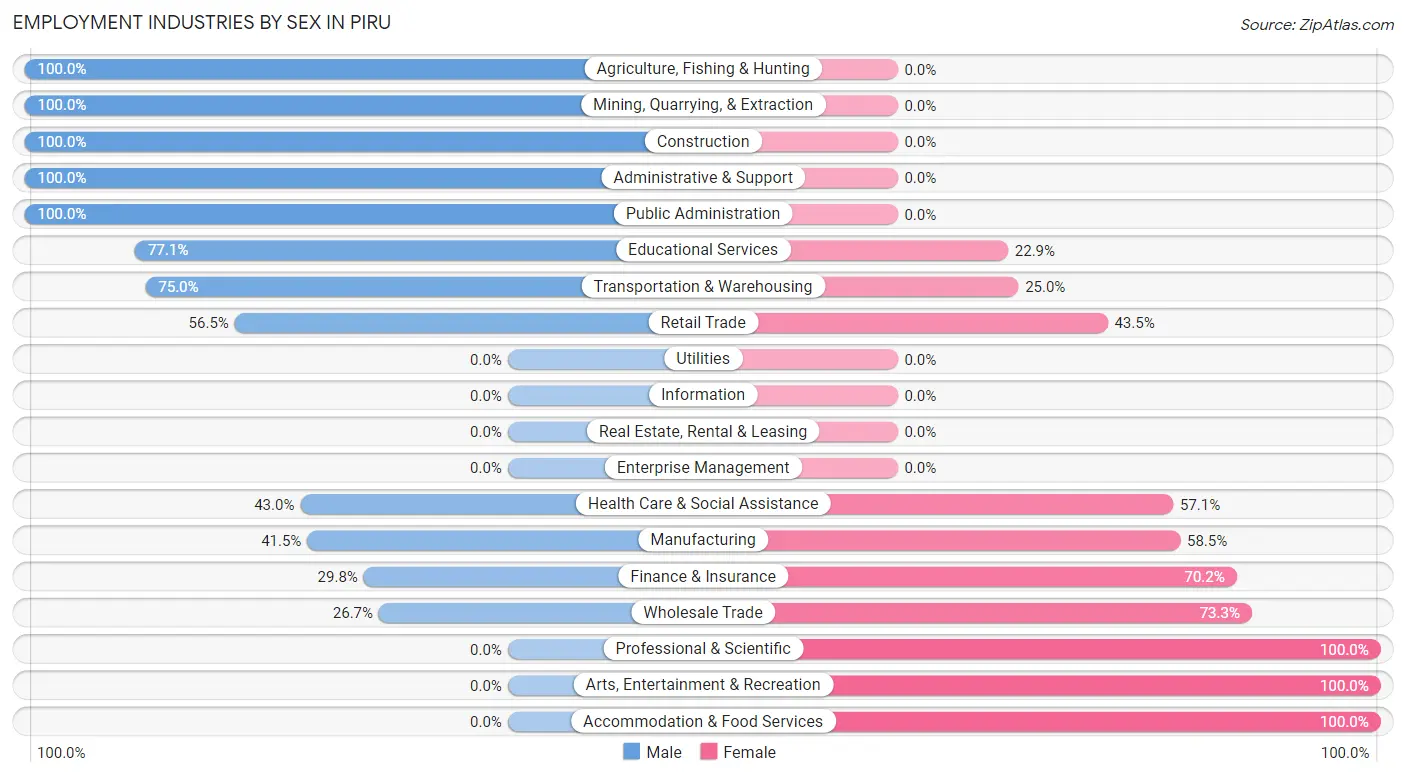
Employment Industries by Sex in Piru
The Piru industries that see more men than women are Agriculture, Fishing & Hunting (100.0%), Mining, Quarrying, & Extraction (100.0%), and Construction (100.0%), whereas the industries that tend to have a higher number of women are Professional & Scientific (100.0%), Arts, Entertainment & Recreation (100.0%), and Accommodation & Food Services (100.0%).
| Industry | Male | Female |
| Agriculture, Fishing & Hunting | 94 (100.0%) | 0 (0.0%) |
| Mining, Quarrying, & Extraction | 3 (100.0%) | 0 (0.0%) |
| Construction | 157 (100.0%) | 0 (0.0%) |
| Manufacturing | 44 (41.5%) | 62 (58.5%) |
| Wholesale Trade | 16 (26.7%) | 44 (73.3%) |
| Retail Trade | 52 (56.5%) | 40 (43.5%) |
| Transportation & Warehousing | 75 (75.0%) | 25 (25.0%) |
| Utilities | 0 (0.0%) | 0 (0.0%) |
| Information | 0 (0.0%) | 0 (0.0%) |
| Finance & Insurance | 17 (29.8%) | 40 (70.2%) |
| Real Estate, Rental & Leasing | 0 (0.0%) | 0 (0.0%) |
| Professional & Scientific | 0 (0.0%) | 35 (100.0%) |
| Enterprise Management | 0 (0.0%) | 0 (0.0%) |
| Administrative & Support | 15 (100.0%) | 0 (0.0%) |
| Educational Services | 27 (77.1%) | 8 (22.9%) |
| Health Care & Social Assistance | 67 (42.9%) | 89 (57.1%) |
| Arts, Entertainment & Recreation | 0 (0.0%) | 28 (100.0%) |
| Accommodation & Food Services | 0 (0.0%) | 11 (100.0%) |
| Public Administration | 18 (100.0%) | 0 (0.0%) |
| Total | 598 (57.8%) | 437 (42.2%) |
Education in Piru
School Enrollment in Piru
The most common levels of schooling among the 494 students in Piru are college / undergraduate (147 | 29.8%), elementary school (127 | 25.7%), and high school (102 | 20.6%).
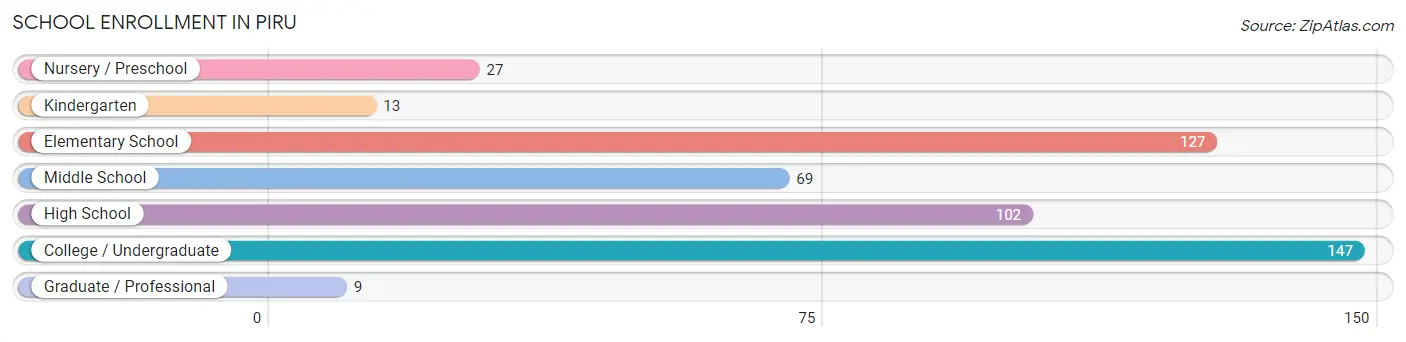
| School Level | # Students | % Students |
| Nursery / Preschool | 27 | 5.5% |
| Kindergarten | 13 | 2.6% |
| Elementary School | 127 | 25.7% |
| Middle School | 69 | 14.0% |
| High School | 102 | 20.6% |
| College / Undergraduate | 147 | 29.8% |
| Graduate / Professional | 9 | 1.8% |
| Total | 494 | 100.0% |
School Enrollment by Age by Funding Source in Piru
Out of a total of 494 students who are enrolled in schools in Piru, 47 (9.5%) attend a private institution, while the remaining 447 (90.5%) are enrolled in public schools. The age group of 35 years and over has the highest likelihood of being enrolled in private schools, with 5 (62.5% in the age bracket) enrolled. Conversely, the age group of 3 to 4 year olds has the lowest likelihood of being enrolled in a private school, with 27 (100.0% in the age bracket) attending a public institution.
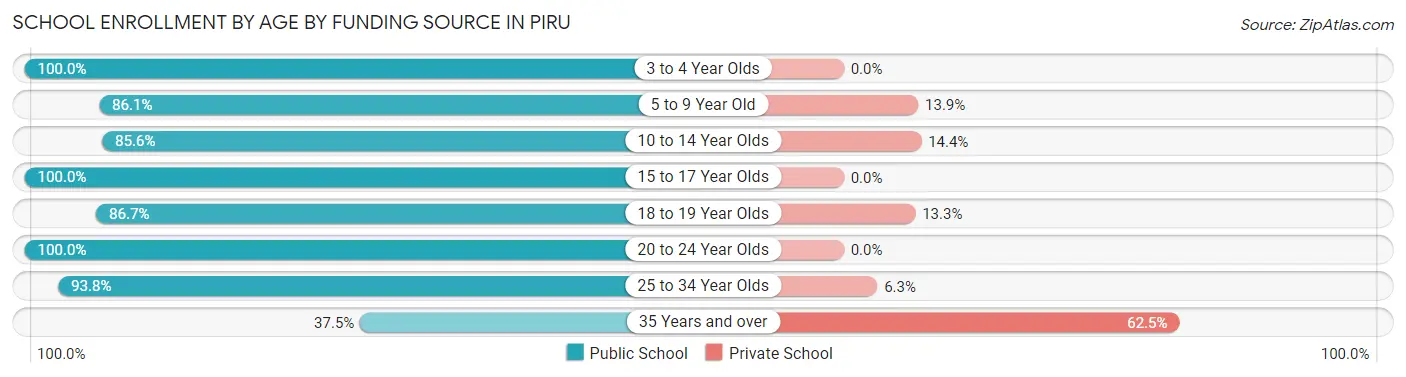
| Age Bracket | Public School | Private School |
| 3 to 4 Year Olds | 27 (100.0%) | 0 (0.0%) |
| 5 to 9 Year Old | 118 (86.1%) | 19 (13.9%) |
| 10 to 14 Year Olds | 77 (85.6%) | 13 (14.4%) |
| 15 to 17 Year Olds | 77 (100.0%) | 0 (0.0%) |
| 18 to 19 Year Olds | 39 (86.7%) | 6 (13.3%) |
| 20 to 24 Year Olds | 46 (100.0%) | 0 (0.0%) |
| 25 to 34 Year Olds | 60 (93.8%) | 4 (6.2%) |
| 35 Years and over | 3 (37.5%) | 5 (62.5%) |
| Total | 447 (90.5%) | 47 (9.5%) |
Educational Attainment by Field of Study in Piru
Social sciences (42 | 25.5%), science & technology (32 | 19.4%), business (23 | 13.9%), bio, nature & agricultural (22 | 13.3%), and engineering (21 | 12.7%) are the most common fields of study among 165 individuals in Piru who have obtained a bachelor's degree or higher.
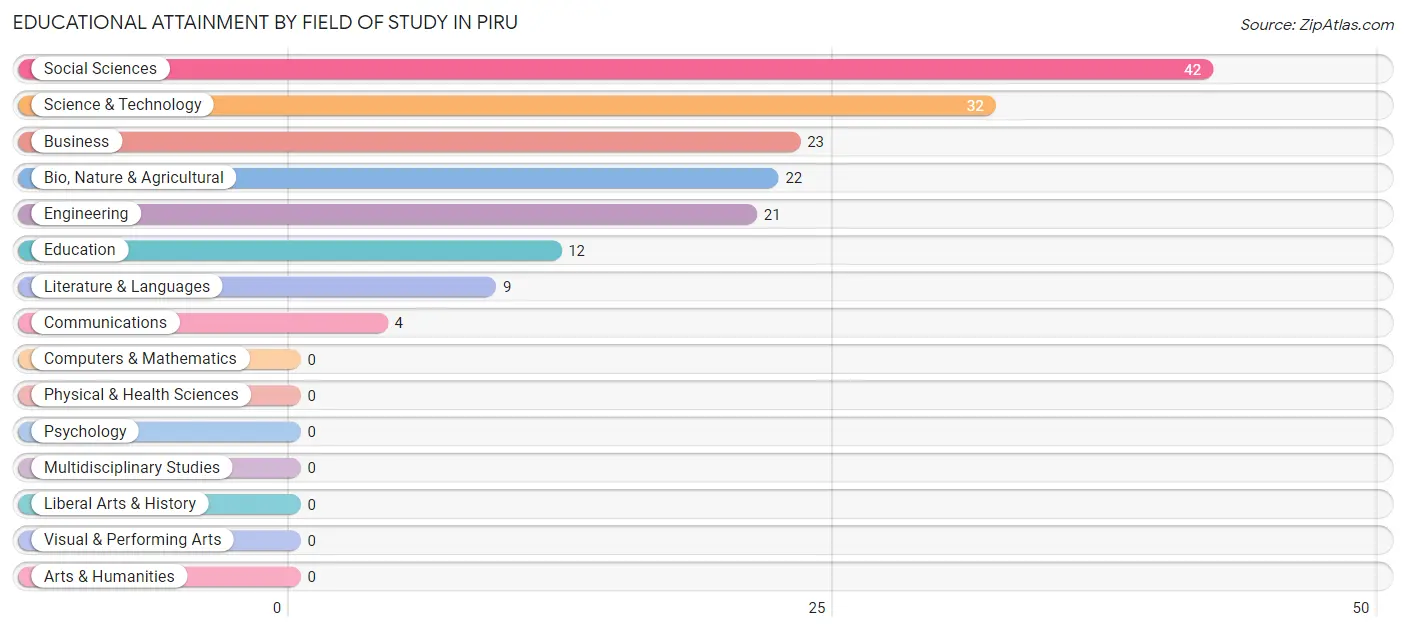
| Field of Study | # Graduates | % Graduates |
| Computers & Mathematics | 0 | 0.0% |
| Bio, Nature & Agricultural | 22 | 13.3% |
| Physical & Health Sciences | 0 | 0.0% |
| Psychology | 0 | 0.0% |
| Social Sciences | 42 | 25.5% |
| Engineering | 21 | 12.7% |
| Multidisciplinary Studies | 0 | 0.0% |
| Science & Technology | 32 | 19.4% |
| Business | 23 | 13.9% |
| Education | 12 | 7.3% |
| Literature & Languages | 9 | 5.4% |
| Liberal Arts & History | 0 | 0.0% |
| Visual & Performing Arts | 0 | 0.0% |
| Communications | 4 | 2.4% |
| Arts & Humanities | 0 | 0.0% |
| Total | 165 | 100.0% |
Transportation & Commute in Piru
Vehicle Availability by Sex in Piru
The most prevalent vehicle ownership categories in Piru are males with 2 vehicles (232, accounting for 39.4%) and females with 2 vehicles (115, making up 53.1%).
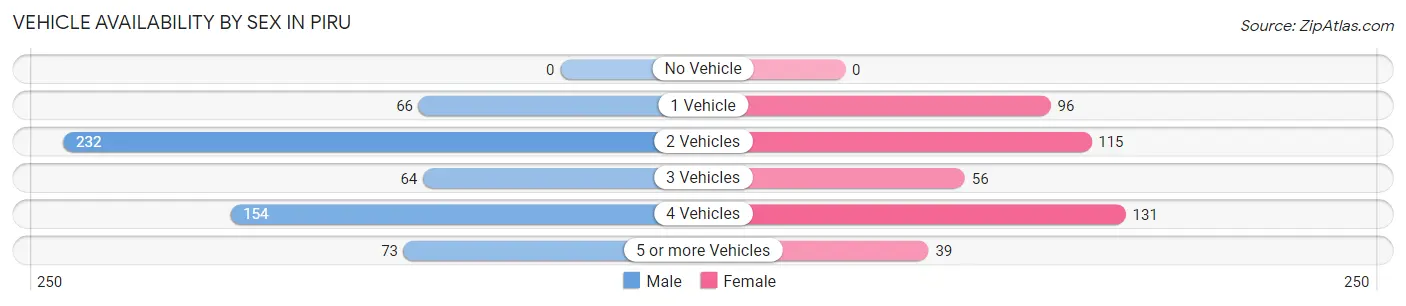
| Vehicles Available | Male | Female |
| No Vehicle | 0 (0.0%) | 0 (0.0%) |
| 1 Vehicle | 66 (11.2%) | 96 (22.0%) |
| 2 Vehicles | 232 (39.4%) | 115 (26.3%) |
| 3 Vehicles | 64 (10.9%) | 56 (12.8%) |
| 4 Vehicles | 154 (26.2%) | 131 (30.0%) |
| 5 or more Vehicles | 73 (12.4%) | 39 (8.9%) |
| Total | 589 (100.0%) | 437 (100.0%) |
Commute Time in Piru
The most frequently occuring commute durations in Piru are 20 to 24 minutes (159 commuters, 17.3%), 30 to 34 minutes (133 commuters, 14.5%), and 45 to 59 minutes (99 commuters, 10.8%).
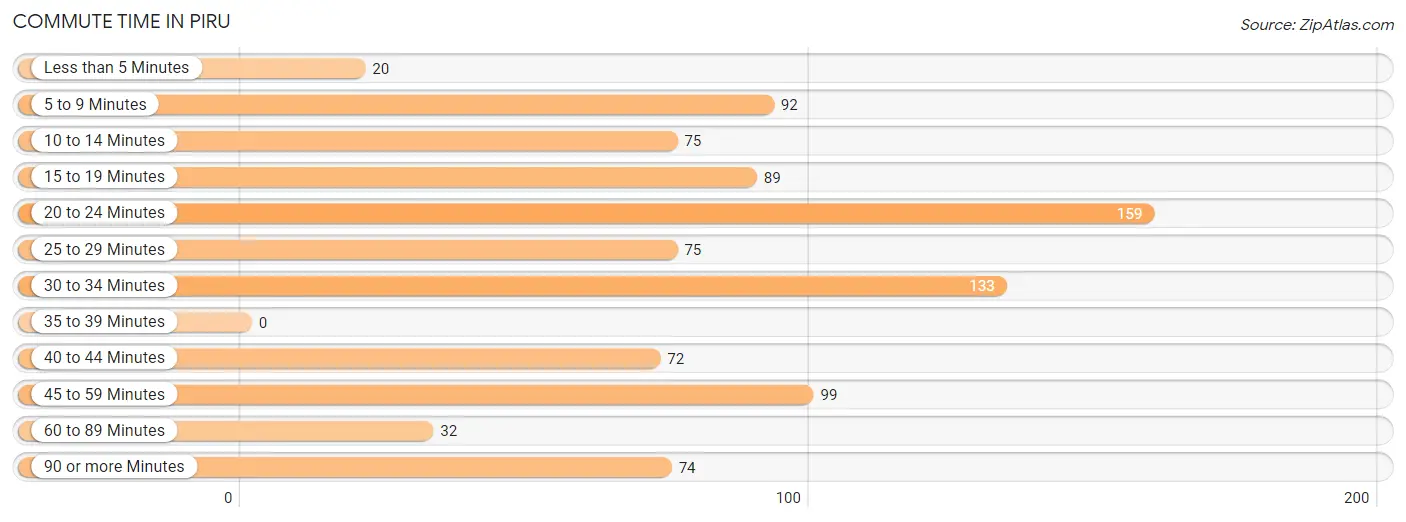
| Commute Time | # Commuters | % Commuters |
| Less than 5 Minutes | 20 | 2.2% |
| 5 to 9 Minutes | 92 | 10.0% |
| 10 to 14 Minutes | 75 | 8.2% |
| 15 to 19 Minutes | 89 | 9.7% |
| 20 to 24 Minutes | 159 | 17.3% |
| 25 to 29 Minutes | 75 | 8.2% |
| 30 to 34 Minutes | 133 | 14.5% |
| 35 to 39 Minutes | 0 | 0.0% |
| 40 to 44 Minutes | 72 | 7.8% |
| 45 to 59 Minutes | 99 | 10.8% |
| 60 to 89 Minutes | 32 | 3.5% |
| 90 or more Minutes | 74 | 8.0% |
Commute Time by Sex in Piru
The most common commute times in Piru are 30 to 34 minutes (100 commuters, 18.9%) for males and 20 to 24 minutes (92 commuters, 23.6%) for females.
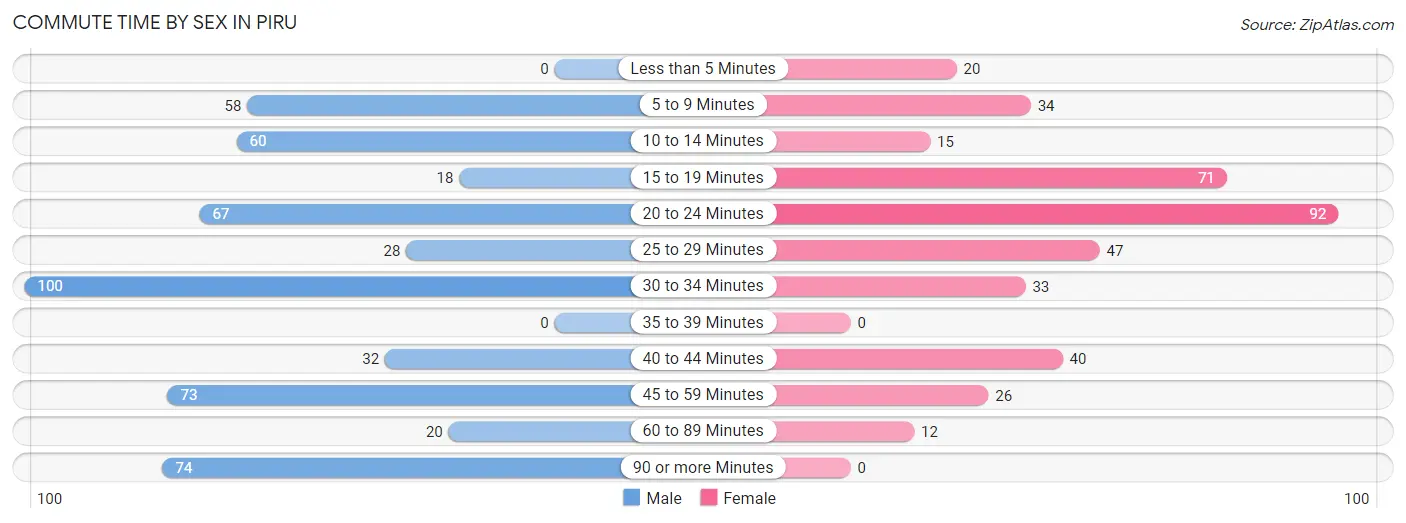
| Commute Time | Male | Female |
| Less than 5 Minutes | 0 (0.0%) | 20 (5.1%) |
| 5 to 9 Minutes | 58 (10.9%) | 34 (8.7%) |
| 10 to 14 Minutes | 60 (11.3%) | 15 (3.8%) |
| 15 to 19 Minutes | 18 (3.4%) | 71 (18.2%) |
| 20 to 24 Minutes | 67 (12.6%) | 92 (23.6%) |
| 25 to 29 Minutes | 28 (5.3%) | 47 (12.0%) |
| 30 to 34 Minutes | 100 (18.9%) | 33 (8.5%) |
| 35 to 39 Minutes | 0 (0.0%) | 0 (0.0%) |
| 40 to 44 Minutes | 32 (6.0%) | 40 (10.3%) |
| 45 to 59 Minutes | 73 (13.8%) | 26 (6.7%) |
| 60 to 89 Minutes | 20 (3.8%) | 12 (3.1%) |
| 90 or more Minutes | 74 (14.0%) | 0 (0.0%) |
Time of Departure to Work by Sex in Piru
The most frequent times of departure to work in Piru are 6:30 AM to 6:59 AM (92, 17.4%) for males and 7:30 AM to 7:59 AM (76, 19.5%) for females.
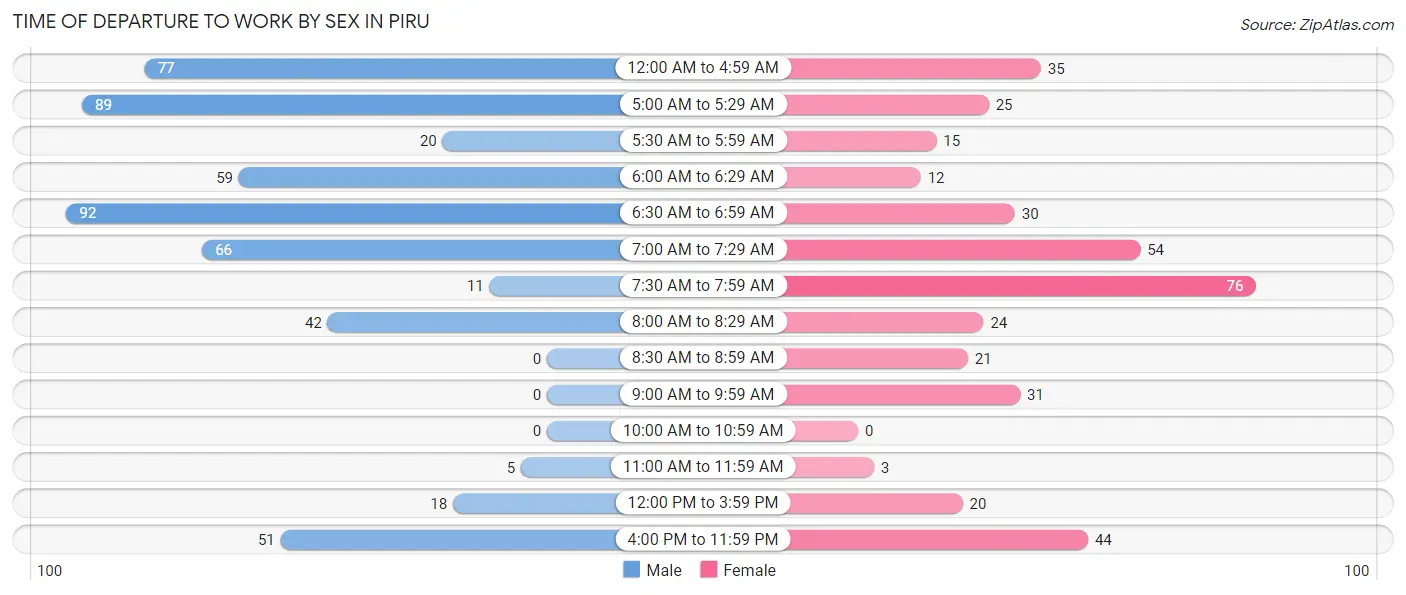
| Time of Departure | Male | Female |
| 12:00 AM to 4:59 AM | 77 (14.5%) | 35 (9.0%) |
| 5:00 AM to 5:29 AM | 89 (16.8%) | 25 (6.4%) |
| 5:30 AM to 5:59 AM | 20 (3.8%) | 15 (3.8%) |
| 6:00 AM to 6:29 AM | 59 (11.1%) | 12 (3.1%) |
| 6:30 AM to 6:59 AM | 92 (17.4%) | 30 (7.7%) |
| 7:00 AM to 7:29 AM | 66 (12.4%) | 54 (13.9%) |
| 7:30 AM to 7:59 AM | 11 (2.1%) | 76 (19.5%) |
| 8:00 AM to 8:29 AM | 42 (7.9%) | 24 (6.1%) |
| 8:30 AM to 8:59 AM | 0 (0.0%) | 21 (5.4%) |
| 9:00 AM to 9:59 AM | 0 (0.0%) | 31 (8.0%) |
| 10:00 AM to 10:59 AM | 0 (0.0%) | 0 (0.0%) |
| 11:00 AM to 11:59 AM | 5 (0.9%) | 3 (0.8%) |
| 12:00 PM to 3:59 PM | 18 (3.4%) | 20 (5.1%) |
| 4:00 PM to 11:59 PM | 51 (9.6%) | 44 (11.3%) |
| Total | 530 (100.0%) | 390 (100.0%) |
Housing Occupancy in Piru
Occupancy by Ownership in Piru
Of the total 622 dwellings in Piru, owner-occupied units account for 361 (58.0%), while renter-occupied units make up 261 (42.0%).
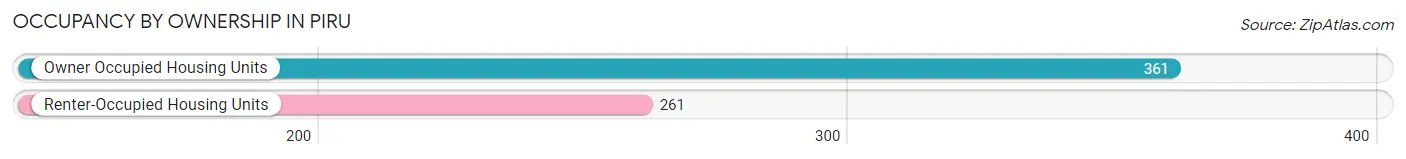
| Occupancy | # Housing Units | % Housing Units |
| Owner Occupied Housing Units | 361 | 58.0% |
| Renter-Occupied Housing Units | 261 | 42.0% |
| Total Occupied Housing Units | 622 | 100.0% |
Occupancy by Household Size in Piru
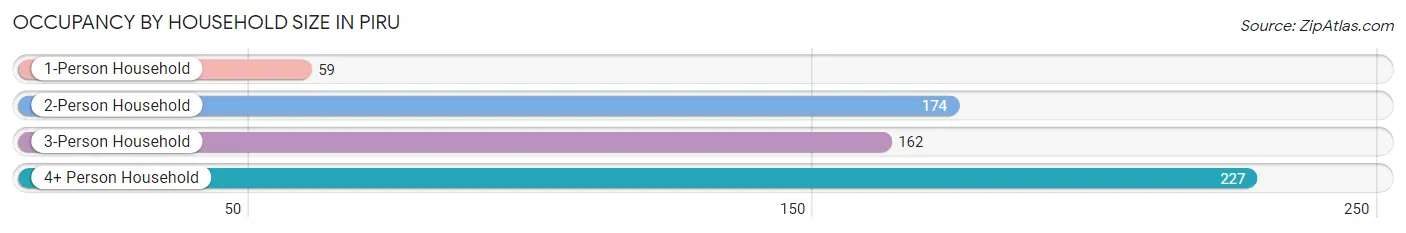
| Household Size | # Housing Units | % Housing Units |
| 1-Person Household | 59 | 9.5% |
| 2-Person Household | 174 | 28.0% |
| 3-Person Household | 162 | 26.1% |
| 4+ Person Household | 227 | 36.5% |
| Total Housing Units | 622 | 100.0% |
Occupancy by Ownership by Household Size in Piru
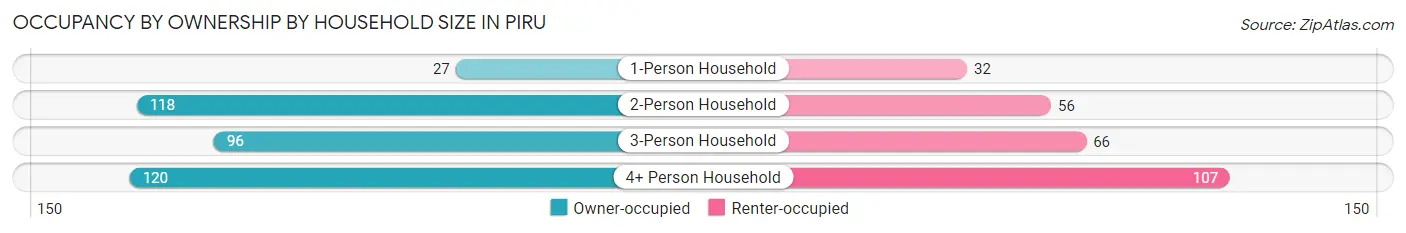
| Household Size | Owner-occupied | Renter-occupied |
| 1-Person Household | 27 (45.8%) | 32 (54.2%) |
| 2-Person Household | 118 (67.8%) | 56 (32.2%) |
| 3-Person Household | 96 (59.3%) | 66 (40.7%) |
| 4+ Person Household | 120 (52.9%) | 107 (47.1%) |
| Total Housing Units | 361 (58.0%) | 261 (42.0%) |
Occupancy by Educational Attainment in Piru
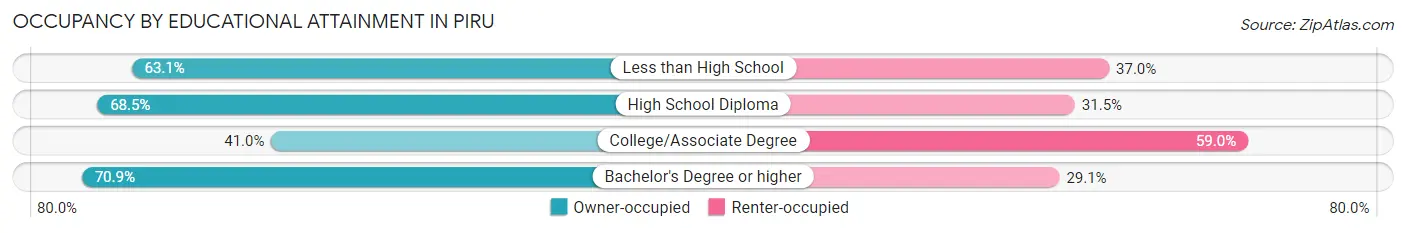
| Household Size | Owner-occupied | Renter-occupied |
| Less than High School | 157 (63.0%) | 92 (36.9%) |
| High School Diploma | 63 (68.5%) | 29 (31.5%) |
| College/Associate Degree | 80 (41.0%) | 115 (59.0%) |
| Bachelor's Degree or higher | 61 (70.9%) | 25 (29.1%) |
Occupancy by Age of Householder in Piru
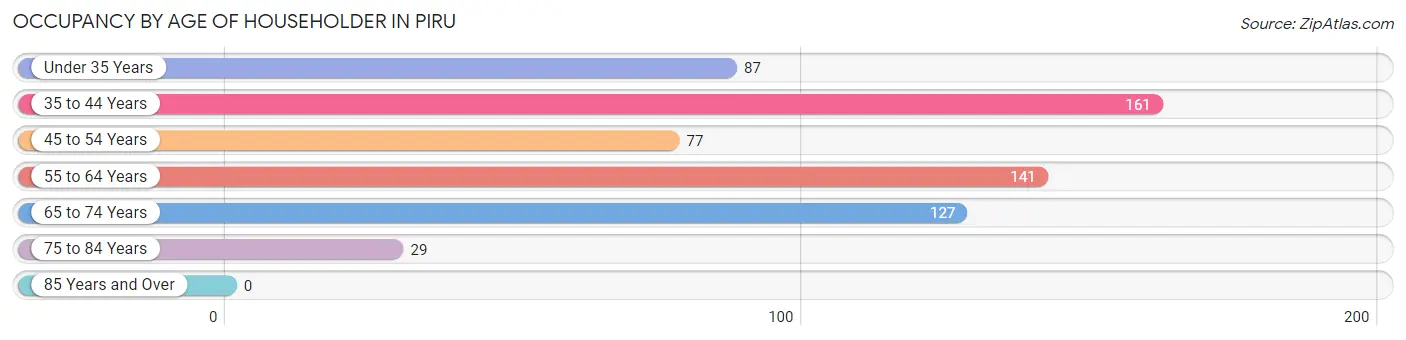
| Age Bracket | # Households | % Households |
| Under 35 Years | 87 | 14.0% |
| 35 to 44 Years | 161 | 25.9% |
| 45 to 54 Years | 77 | 12.4% |
| 55 to 64 Years | 141 | 22.7% |
| 65 to 74 Years | 127 | 20.4% |
| 75 to 84 Years | 29 | 4.7% |
| 85 Years and Over | 0 | 0.0% |
| Total | 622 | 100.0% |
Housing Finances in Piru
Median Income by Occupancy in Piru

| Occupancy Type | # Households | Median Income |
| Owner-Occupied | 361 (58.0%) | $99,107 |
| Renter-Occupied | 261 (42.0%) | $60,250 |
| Average | 622 (100.0%) | $80,313 |
Occupancy by Householder Income Bracket in Piru
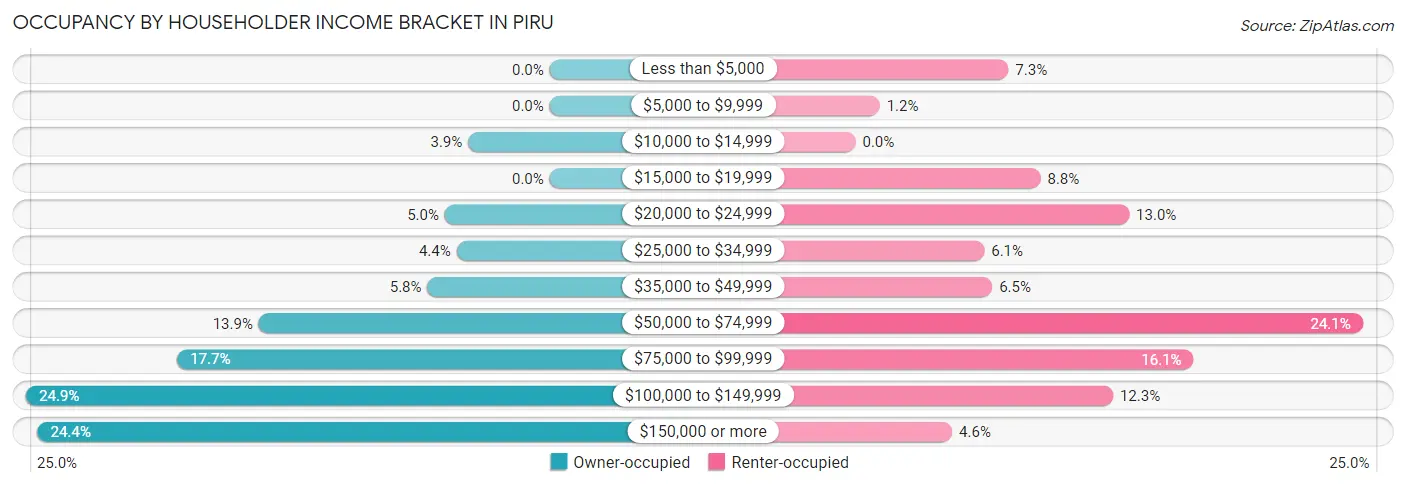
| Income Bracket | Owner-occupied | Renter-occupied |
| Less than $5,000 | 0 (0.0%) | 19 (7.3%) |
| $5,000 to $9,999 | 0 (0.0%) | 3 (1.1%) |
| $10,000 to $14,999 | 14 (3.9%) | 0 (0.0%) |
| $15,000 to $19,999 | 0 (0.0%) | 23 (8.8%) |
| $20,000 to $24,999 | 18 (5.0%) | 34 (13.0%) |
| $25,000 to $34,999 | 16 (4.4%) | 16 (6.1%) |
| $35,000 to $49,999 | 21 (5.8%) | 17 (6.5%) |
| $50,000 to $74,999 | 50 (13.9%) | 63 (24.1%) |
| $75,000 to $99,999 | 64 (17.7%) | 42 (16.1%) |
| $100,000 to $149,999 | 90 (24.9%) | 32 (12.3%) |
| $150,000 or more | 88 (24.4%) | 12 (4.6%) |
| Total | 361 (100.0%) | 261 (100.0%) |
Monthly Housing Cost Tiers in Piru
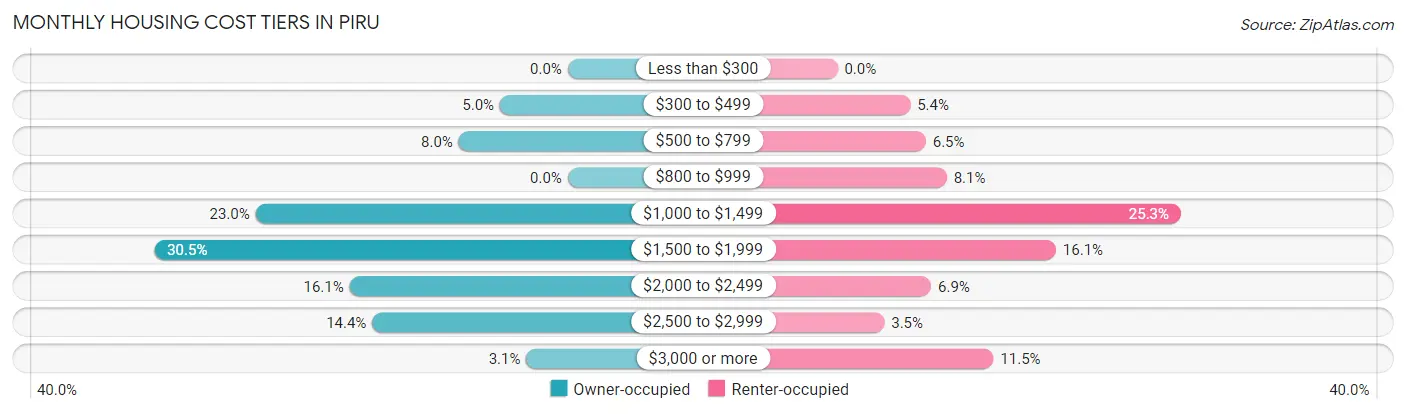
| Monthly Cost | Owner-occupied | Renter-occupied |
| Less than $300 | 0 (0.0%) | 0 (0.0%) |
| $300 to $499 | 18 (5.0%) | 14 (5.4%) |
| $500 to $799 | 29 (8.0%) | 17 (6.5%) |
| $800 to $999 | 0 (0.0%) | 21 (8.1%) |
| $1,000 to $1,499 | 83 (23.0%) | 66 (25.3%) |
| $1,500 to $1,999 | 110 (30.5%) | 42 (16.1%) |
| $2,000 to $2,499 | 58 (16.1%) | 18 (6.9%) |
| $2,500 to $2,999 | 52 (14.4%) | 9 (3.5%) |
| $3,000 or more | 11 (3.0%) | 30 (11.5%) |
| Total | 361 (100.0%) | 261 (100.0%) |
Physical Housing Characteristics in Piru
Housing Structures in Piru
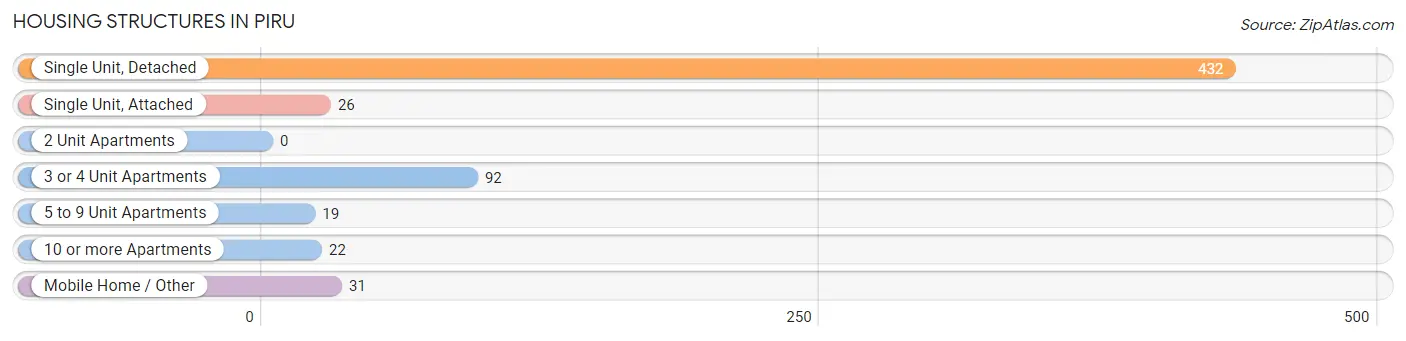
| Structure Type | # Housing Units | % Housing Units |
| Single Unit, Detached | 432 | 69.5% |
| Single Unit, Attached | 26 | 4.2% |
| 2 Unit Apartments | 0 | 0.0% |
| 3 or 4 Unit Apartments | 92 | 14.8% |
| 5 to 9 Unit Apartments | 19 | 3.0% |
| 10 or more Apartments | 22 | 3.5% |
| Mobile Home / Other | 31 | 5.0% |
| Total | 622 | 100.0% |
Housing Structures by Occupancy in Piru
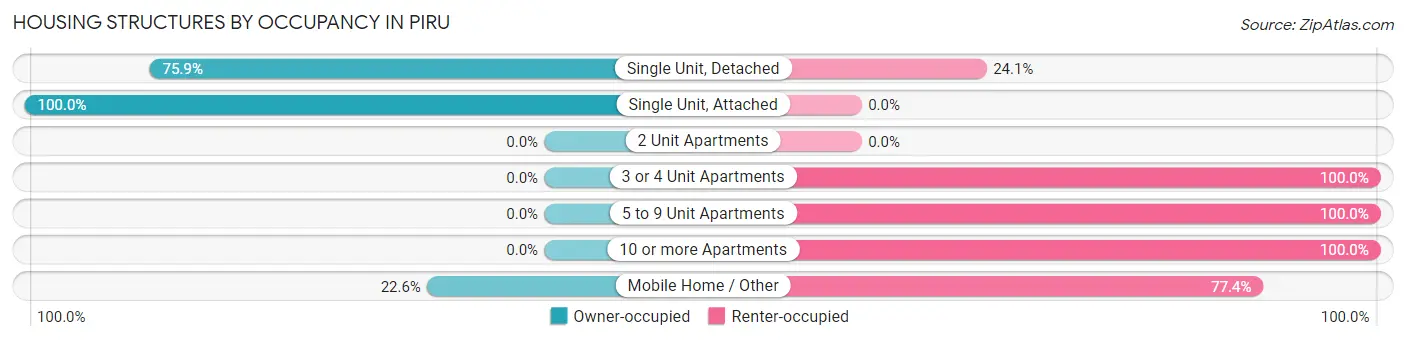
| Structure Type | Owner-occupied | Renter-occupied |
| Single Unit, Detached | 328 (75.9%) | 104 (24.1%) |
| Single Unit, Attached | 26 (100.0%) | 0 (0.0%) |
| 2 Unit Apartments | 0 (0.0%) | 0 (0.0%) |
| 3 or 4 Unit Apartments | 0 (0.0%) | 92 (100.0%) |
| 5 to 9 Unit Apartments | 0 (0.0%) | 19 (100.0%) |
| 10 or more Apartments | 0 (0.0%) | 22 (100.0%) |
| Mobile Home / Other | 7 (22.6%) | 24 (77.4%) |
| Total | 361 (58.0%) | 261 (42.0%) |
Housing Structures by Number of Rooms in Piru
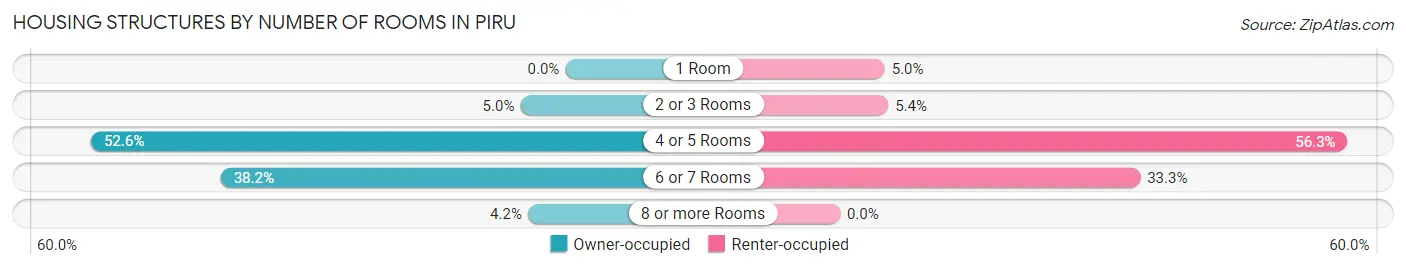
| Number of Rooms | Owner-occupied | Renter-occupied |
| 1 Room | 0 (0.0%) | 13 (5.0%) |
| 2 or 3 Rooms | 18 (5.0%) | 14 (5.4%) |
| 4 or 5 Rooms | 190 (52.6%) | 147 (56.3%) |
| 6 or 7 Rooms | 138 (38.2%) | 87 (33.3%) |
| 8 or more Rooms | 15 (4.2%) | 0 (0.0%) |
| Total | 361 (100.0%) | 261 (100.0%) |
Housing Structure by Heating Type in Piru
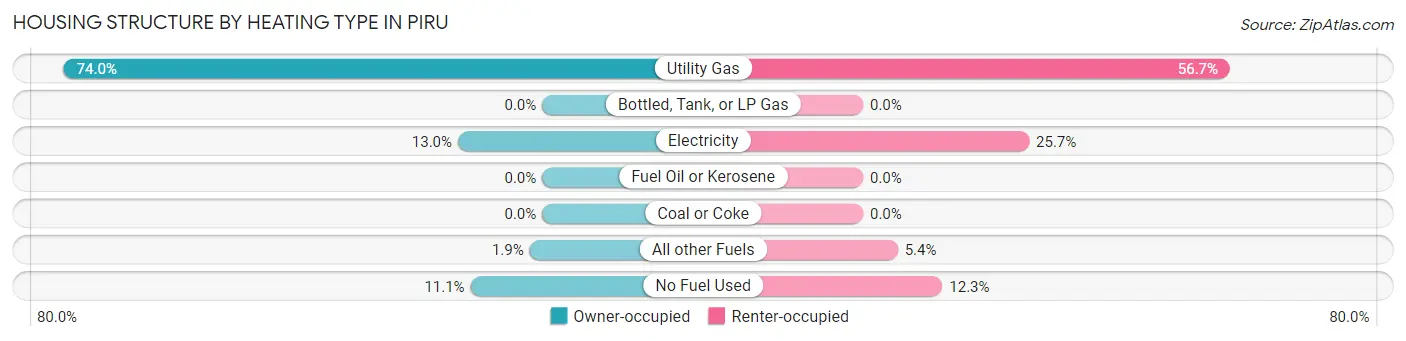
| Heating Type | Owner-occupied | Renter-occupied |
| Utility Gas | 267 (74.0%) | 148 (56.7%) |
| Bottled, Tank, or LP Gas | 0 (0.0%) | 0 (0.0%) |
| Electricity | 47 (13.0%) | 67 (25.7%) |
| Fuel Oil or Kerosene | 0 (0.0%) | 0 (0.0%) |
| Coal or Coke | 0 (0.0%) | 0 (0.0%) |
| All other Fuels | 7 (1.9%) | 14 (5.4%) |
| No Fuel Used | 40 (11.1%) | 32 (12.3%) |
| Total | 361 (100.0%) | 261 (100.0%) |
Household Vehicle Usage in Piru
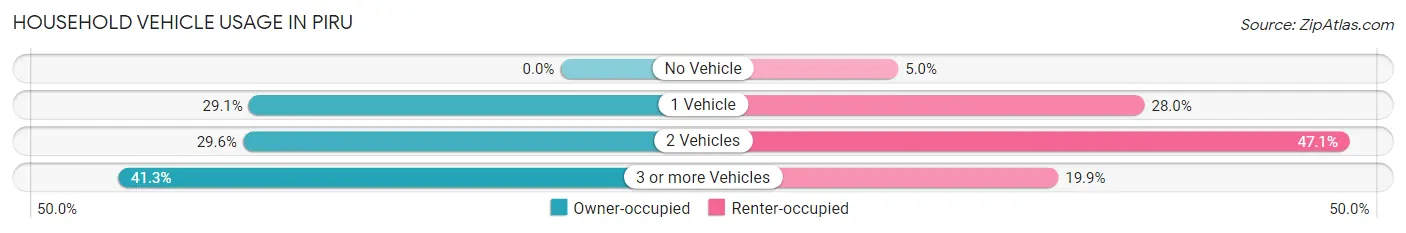
| Vehicles per Household | Owner-occupied | Renter-occupied |
| No Vehicle | 0 (0.0%) | 13 (5.0%) |
| 1 Vehicle | 105 (29.1%) | 73 (28.0%) |
| 2 Vehicles | 107 (29.6%) | 123 (47.1%) |
| 3 or more Vehicles | 149 (41.3%) | 52 (19.9%) |
| Total | 361 (100.0%) | 261 (100.0%) |
Real Estate & Mortgages in Piru
Real Estate and Mortgage Overview in Piru
| Characteristic | Without Mortgage | With Mortgage |
| Housing Units | 90 | 271 |
| Median Property Value | $711,500 | $452,400 |
| Median Household Income | - | - |
| Monthly Housing Costs | - | - |
| Real Estate Taxes | $4,434 | $0 |
Property Value by Mortgage Status in Piru
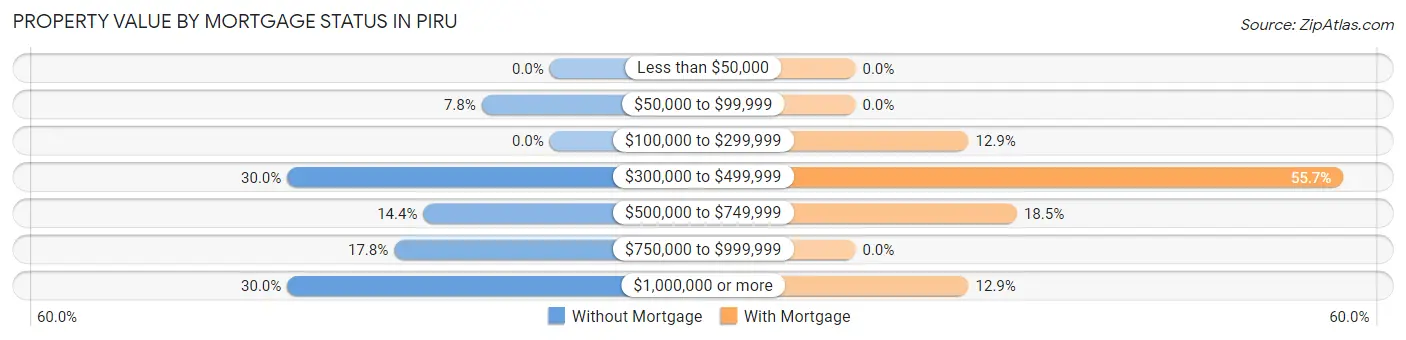
| Property Value | Without Mortgage | With Mortgage |
| Less than $50,000 | 0 (0.0%) | 0 (0.0%) |
| $50,000 to $99,999 | 7 (7.8%) | 0 (0.0%) |
| $100,000 to $299,999 | 0 (0.0%) | 35 (12.9%) |
| $300,000 to $499,999 | 27 (30.0%) | 151 (55.7%) |
| $500,000 to $749,999 | 13 (14.4%) | 50 (18.4%) |
| $750,000 to $999,999 | 16 (17.8%) | 0 (0.0%) |
| $1,000,000 or more | 27 (30.0%) | 35 (12.9%) |
| Total | 90 (100.0%) | 271 (100.0%) |
Household Income by Mortgage Status in Piru
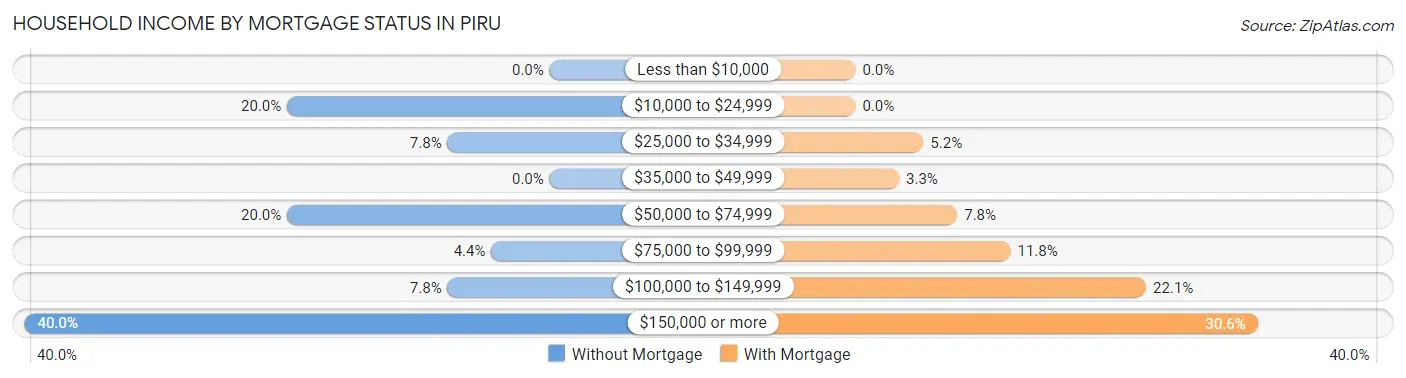
| Household Income | Without Mortgage | With Mortgage |
| Less than $10,000 | 0 (0.0%) | 0 (0.0%) |
| $10,000 to $24,999 | 18 (20.0%) | 0 (0.0%) |
| $25,000 to $34,999 | 7 (7.8%) | 14 (5.2%) |
| $35,000 to $49,999 | 0 (0.0%) | 9 (3.3%) |
| $50,000 to $74,999 | 18 (20.0%) | 21 (7.7%) |
| $75,000 to $99,999 | 4 (4.4%) | 32 (11.8%) |
| $100,000 to $149,999 | 7 (7.8%) | 60 (22.1%) |
| $150,000 or more | 36 (40.0%) | 83 (30.6%) |
| Total | 90 (100.0%) | 271 (100.0%) |
Property Value to Household Income Ratio in Piru
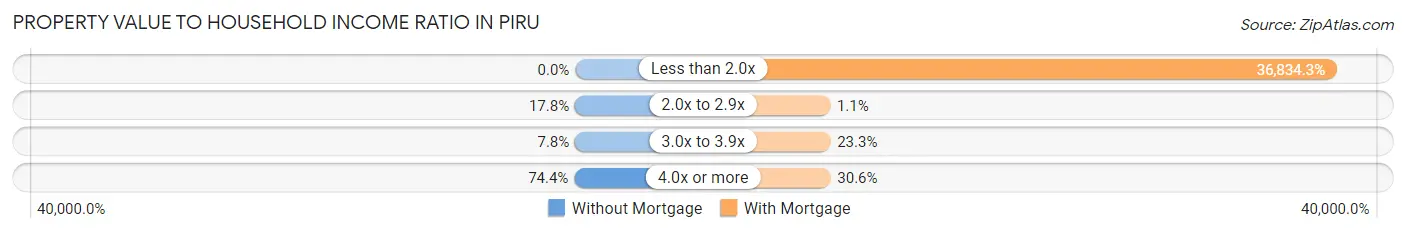
| Value-to-Income Ratio | Without Mortgage | With Mortgage |
| Less than 2.0x | 0 (0.0%) | 99,821 (36,834.3%) |
| 2.0x to 2.9x | 16 (17.8%) | 3 (1.1%) |
| 3.0x to 3.9x | 7 (7.8%) | 63 (23.3%) |
| 4.0x or more | 67 (74.4%) | 83 (30.6%) |
| Total | 90 (100.0%) | 271 (100.0%) |
Real Estate Taxes by Mortgage Status in Piru
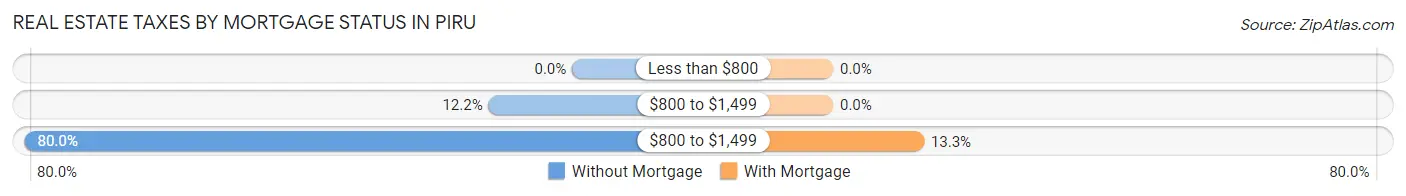
| Property Taxes | Without Mortgage | With Mortgage |
| Less than $800 | 0 (0.0%) | 0 (0.0%) |
| $800 to $1,499 | 11 (12.2%) | 0 (0.0%) |
| $800 to $1,499 | 72 (80.0%) | 36 (13.3%) |
| Total | 90 (100.0%) | 271 (100.0%) |
Health & Disability in Piru
Health Insurance Coverage by Age in Piru
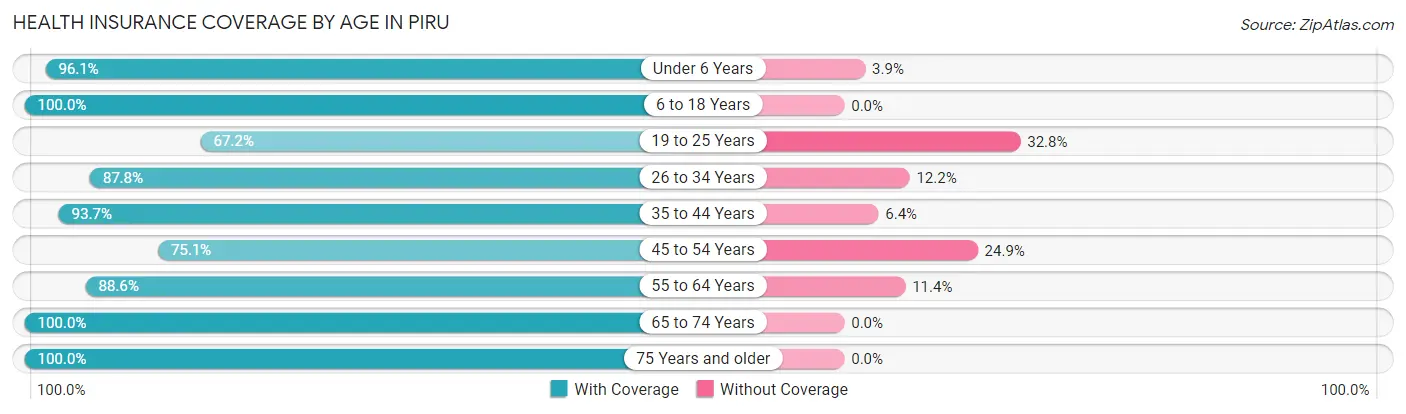
| Age Bracket | With Coverage | Without Coverage |
| Under 6 Years | 272 (96.1%) | 11 (3.9%) |
| 6 to 18 Years | 291 (100.0%) | 0 (0.0%) |
| 19 to 25 Years | 176 (67.2%) | 86 (32.8%) |
| 26 to 34 Years | 260 (87.8%) | 36 (12.2%) |
| 35 to 44 Years | 236 (93.6%) | 16 (6.4%) |
| 45 to 54 Years | 142 (75.1%) | 47 (24.9%) |
| 55 to 64 Years | 195 (88.6%) | 25 (11.4%) |
| 65 to 74 Years | 320 (100.0%) | 0 (0.0%) |
| 75 Years and older | 69 (100.0%) | 0 (0.0%) |
| Total | 1,961 (89.9%) | 221 (10.1%) |
Health Insurance Coverage by Citizenship Status in Piru
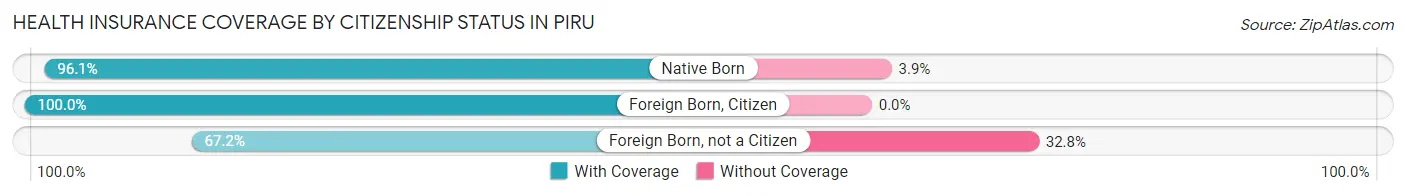
| Citizenship Status | With Coverage | Without Coverage |
| Native Born | 272 (96.1%) | 11 (3.9%) |
| Foreign Born, Citizen | 291 (100.0%) | 0 (0.0%) |
| Foreign Born, not a Citizen | 176 (67.2%) | 86 (32.8%) |
Health Insurance Coverage by Household Income in Piru
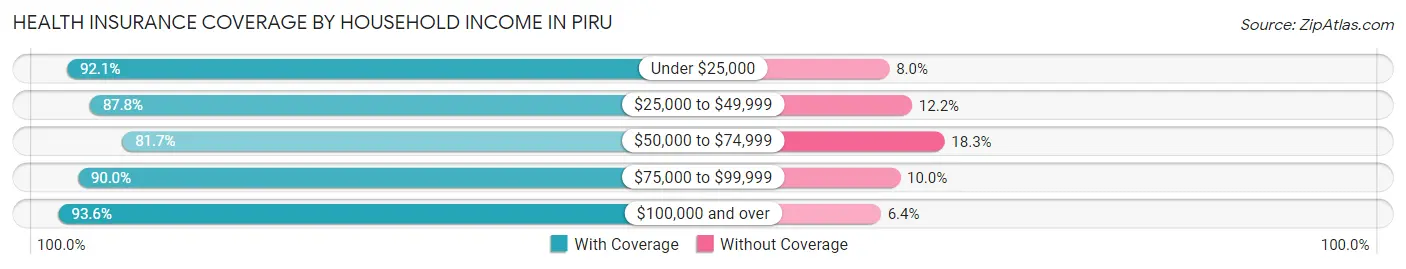
| Household Income | With Coverage | Without Coverage |
| Under $25,000 | 278 (92.0%) | 24 (8.0%) |
| $25,000 to $49,999 | 180 (87.8%) | 25 (12.2%) |
| $50,000 to $74,999 | 344 (81.7%) | 77 (18.3%) |
| $75,000 to $99,999 | 379 (90.0%) | 42 (10.0%) |
| $100,000 and over | 780 (93.6%) | 53 (6.4%) |
Public vs Private Health Insurance Coverage by Age in Piru
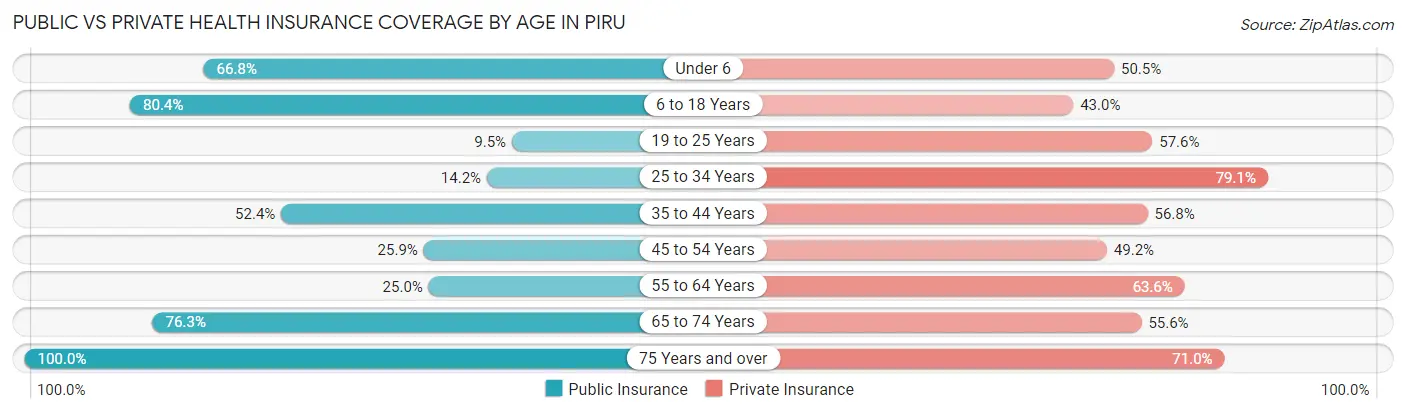
| Age Bracket | Public Insurance | Private Insurance |
| Under 6 | 189 (66.8%) | 143 (50.5%) |
| 6 to 18 Years | 234 (80.4%) | 125 (43.0%) |
| 19 to 25 Years | 25 (9.5%) | 151 (57.6%) |
| 25 to 34 Years | 42 (14.2%) | 234 (79.0%) |
| 35 to 44 Years | 132 (52.4%) | 143 (56.8%) |
| 45 to 54 Years | 49 (25.9%) | 93 (49.2%) |
| 55 to 64 Years | 55 (25.0%) | 140 (63.6%) |
| 65 to 74 Years | 244 (76.2%) | 178 (55.6%) |
| 75 Years and over | 69 (100.0%) | 49 (71.0%) |
| Total | 1,039 (47.6%) | 1,256 (57.6%) |
Disability Status by Sex by Age in Piru
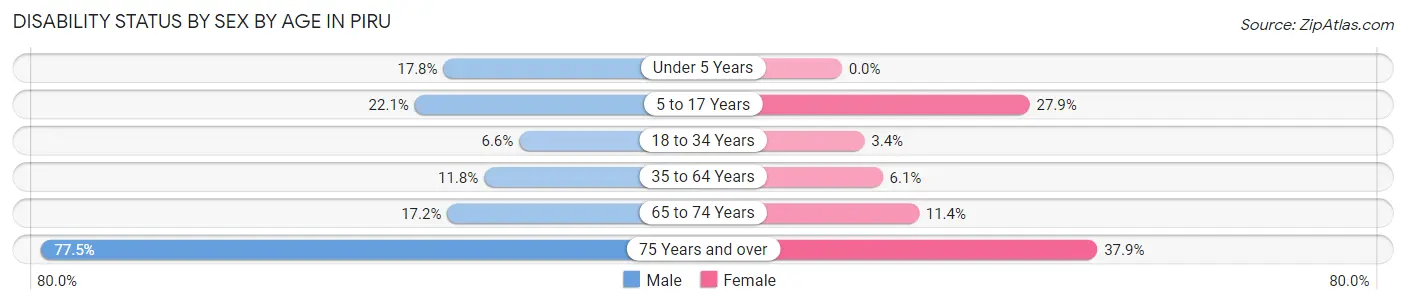
| Age Bracket | Male | Female |
| Under 5 Years | 18 (17.8%) | 0 (0.0%) |
| 5 to 17 Years | 34 (22.1%) | 46 (27.9%) |
| 18 to 34 Years | 19 (6.6%) | 9 (3.4%) |
| 35 to 64 Years | 39 (11.8%) | 20 (6.1%) |
| 65 to 74 Years | 25 (17.2%) | 20 (11.4%) |
| 75 Years and over | 31 (77.5%) | 11 (37.9%) |
Disability Class by Sex by Age in Piru
Disability Class: Hearing Difficulty
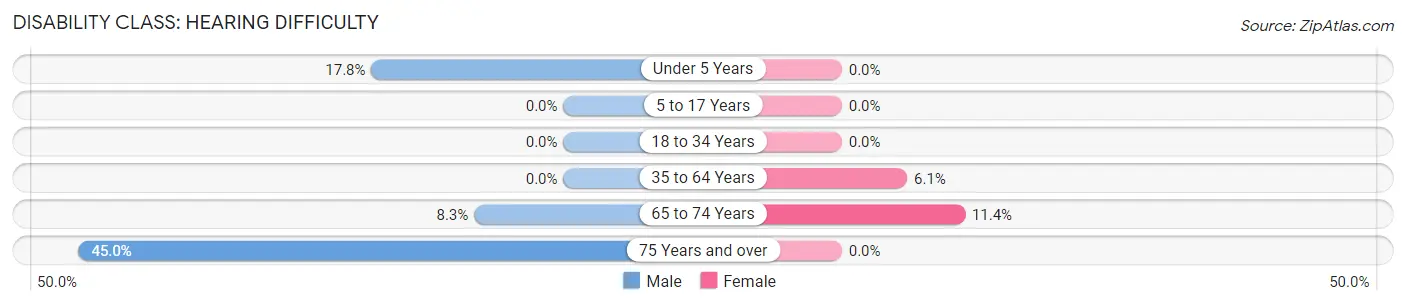
| Age Bracket | Male | Female |
| Under 5 Years | 18 (17.8%) | 0 (0.0%) |
| 5 to 17 Years | 0 (0.0%) | 0 (0.0%) |
| 18 to 34 Years | 0 (0.0%) | 0 (0.0%) |
| 35 to 64 Years | 0 (0.0%) | 20 (6.1%) |
| 65 to 74 Years | 12 (8.3%) | 20 (11.4%) |
| 75 Years and over | 18 (45.0%) | 0 (0.0%) |
Disability Class: Vision Difficulty
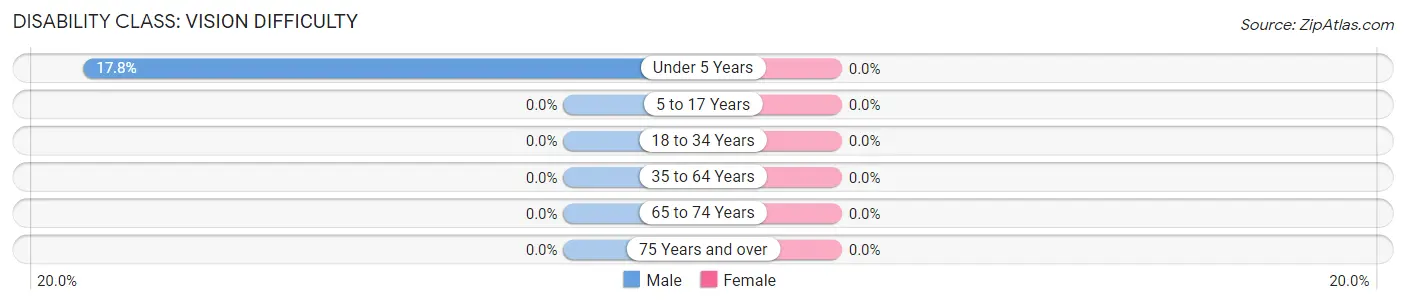
| Age Bracket | Male | Female |
| Under 5 Years | 18 (17.8%) | 0 (0.0%) |
| 5 to 17 Years | 0 (0.0%) | 0 (0.0%) |
| 18 to 34 Years | 0 (0.0%) | 0 (0.0%) |
| 35 to 64 Years | 0 (0.0%) | 0 (0.0%) |
| 65 to 74 Years | 0 (0.0%) | 0 (0.0%) |
| 75 Years and over | 0 (0.0%) | 0 (0.0%) |
Disability Class: Cognitive Difficulty
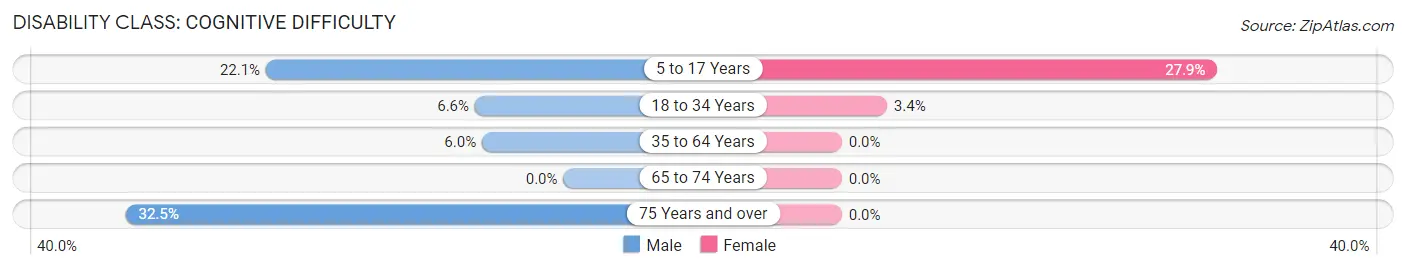
| Age Bracket | Male | Female |
| 5 to 17 Years | 34 (22.1%) | 46 (27.9%) |
| 18 to 34 Years | 19 (6.6%) | 9 (3.4%) |
| 35 to 64 Years | 20 (6.0%) | 0 (0.0%) |
| 65 to 74 Years | 0 (0.0%) | 0 (0.0%) |
| 75 Years and over | 13 (32.5%) | 0 (0.0%) |
Disability Class: Ambulatory Difficulty
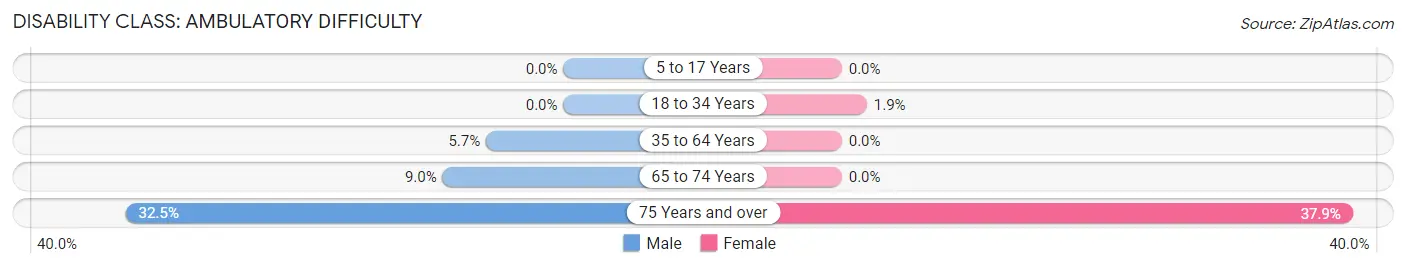
| Age Bracket | Male | Female |
| 5 to 17 Years | 0 (0.0%) | 0 (0.0%) |
| 18 to 34 Years | 0 (0.0%) | 5 (1.9%) |
| 35 to 64 Years | 19 (5.7%) | 0 (0.0%) |
| 65 to 74 Years | 13 (9.0%) | 0 (0.0%) |
| 75 Years and over | 13 (32.5%) | 11 (37.9%) |
Disability Class: Self-Care Difficulty
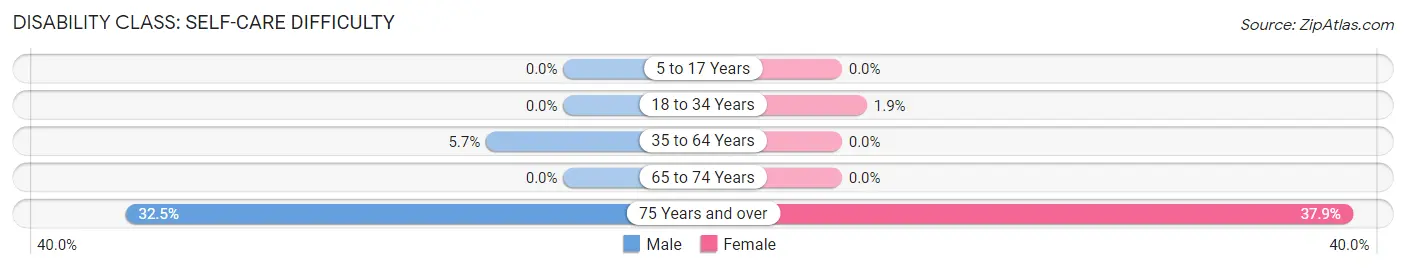
| Age Bracket | Male | Female |
| 5 to 17 Years | 0 (0.0%) | 0 (0.0%) |
| 18 to 34 Years | 0 (0.0%) | 5 (1.9%) |
| 35 to 64 Years | 19 (5.7%) | 0 (0.0%) |
| 65 to 74 Years | 0 (0.0%) | 0 (0.0%) |
| 75 Years and over | 13 (32.5%) | 11 (37.9%) |
Technology Access in Piru
Computing Device Access in Piru
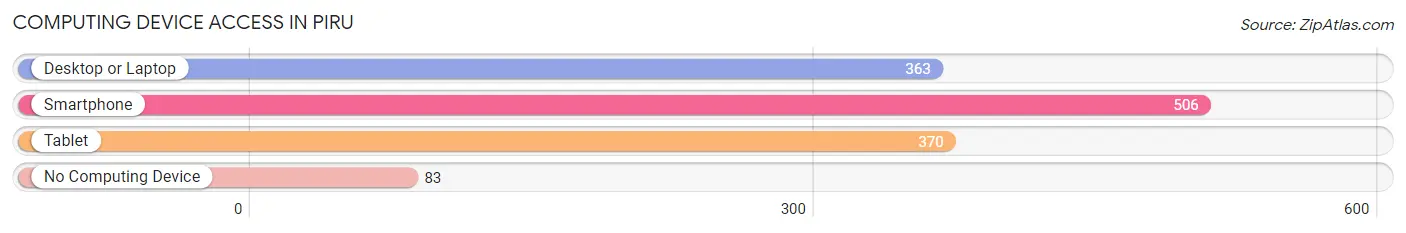
| Device Type | # Households | % Households |
| Desktop or Laptop | 363 | 58.4% |
| Smartphone | 506 | 81.4% |
| Tablet | 370 | 59.5% |
| No Computing Device | 83 | 13.3% |
| Total | 622 | 100.0% |
Internet Access in Piru
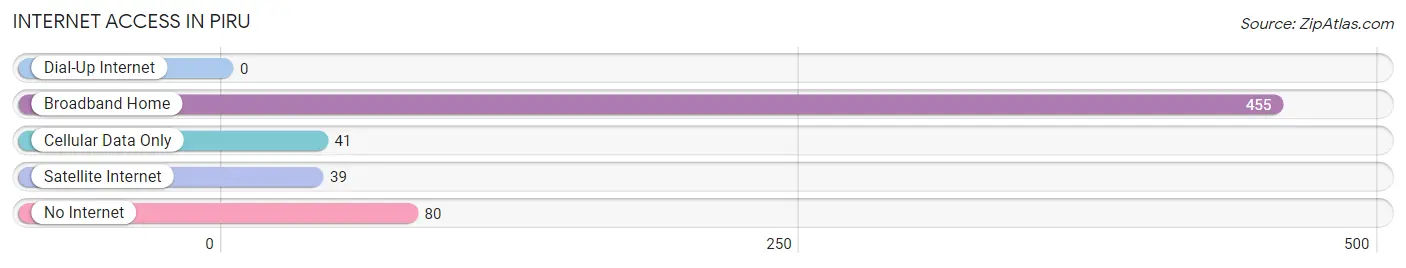
| Internet Type | # Households | % Households |
| Dial-Up Internet | 0 | 0.0% |
| Broadband Home | 455 | 73.2% |
| Cellular Data Only | 41 | 6.6% |
| Satellite Internet | 39 | 6.3% |
| No Internet | 80 | 12.9% |
| Total | 622 | 100.0% |
Piru Summary
Piru, California is a small unincorporated community located in Ventura County, California. It is situated in the Santa Clara River Valley, approximately 40 miles northwest of Los Angeles. The population of Piru was 2,063 at the 2010 census.
History
The area now known as Piru was originally inhabited by the Tataviam people, a Native American tribe that lived in the area for thousands of years before the arrival of Europeans. The first Europeans to settle in the area were Spanish missionaries, who established the Mission San Fernando Rey de España in 1797. The mission was abandoned in 1834, and the area was subsequently settled by ranchers and farmers.
In 1887, the Southern Pacific Railroad built a station in the area, which was named Piru after the nearby Piru Creek. The town of Piru was officially established in 1887, and the first post office was established in 1888.
Geography
Piru is located in the Santa Clara River Valley, approximately 40 miles northwest of Los Angeles. It is situated at an elevation of 1,077 feet (329 m). The town is surrounded by rolling hills and mountains, including the Topatopa Mountains to the east and the Santa Susana Mountains to the west.
The climate in Piru is Mediterranean, with hot, dry summers and mild, wet winters. The average annual temperature is 68°F (20°C), and the average annual precipitation is 17.5 inches (445 mm).
Economy
The economy of Piru is largely based on agriculture. The town is home to several farms and ranches, which produce a variety of crops, including citrus fruits, avocados, and olives. The town is also home to several wineries, which produce a variety of wines.
In addition to agriculture, Piru is home to several small businesses, including restaurants, shops, and services. The town is also home to a number of manufacturing companies, which produce a variety of products, including furniture, clothing, and electronics.
Demographics
As of the 2010 census, the population of Piru was 2,063. The racial makeup of the town was 73.3% White, 0.9% African American, 0.7% Native American, 0.3% Asian, 0.1% Pacific Islander, 22.2% from other races, and 2.5% from two or more races. Hispanic or Latino of any race were 44.2% of the population.
The median household income in Piru was $41,250, and the median family income was $45,938. The per capita income was $17,845. About 17.2% of families and 20.3% of the population were below the poverty line, including 28.3% of those under age 18 and 8.2% of those age 65 or over.
Common Questions
What is Per Capita Income in Piru?
Per Capita income in Piru is $27,495.
What is the Median Family Income in Piru?
Median Family Income in Piru is $75,192.
What is the Median Household income in Piru?
Median Household Income in Piru is $80,313.
What is Income or Wage Gap in Piru?
Income or Wage Gap in Piru is 21.4%.
Women in Piru earn 78.6 cents for every dollar earned by a man.
What is Family Income Deficit in Piru?
Family Income Deficit in Piru is $7,538.
Families that are below poverty line in Piru earn $7,538 less on average than the poverty threshold level.
What is Inequality or Gini Index in Piru?
Inequality or Gini Index in Piru is 0.40.
What is the Total Population of Piru?
Total Population of Piru is 2,182.
What is the Total Male Population of Piru?
Total Male Population of Piru is 1,060.
What is the Total Female Population of Piru?
Total Female Population of Piru is 1,122.
What is the Ratio of Males per 100 Females in Piru?
There are 94.47 Males per 100 Females in Piru.
What is the Ratio of Females per 100 Males in Piru?
There are 105.85 Females per 100 Males in Piru.
What is the Median Population Age in Piru?
Median Population Age in Piru is 32.7 Years.
What is the Average Family Size in Piru
Average Family Size in Piru is 3.8 People.
What is the Average Household Size in Piru
Average Household Size in Piru is 3.5 People.
How Large is the Labor Force in Piru?
There are 1,122 People in the Labor Forcein in Piru.
What is the Percentage of People in the Labor Force in Piru?
67.9% of People are in the Labor Force in Piru.
What is the Unemployment Rate in Piru?
Unemployment Rate in Piru is 7.8%.