Cities with the Highest Percentage of Population Walking to Work in Virginia
RELATED REPORTS & OPTIONS
Walk to Work
Virginia
Compare Cities
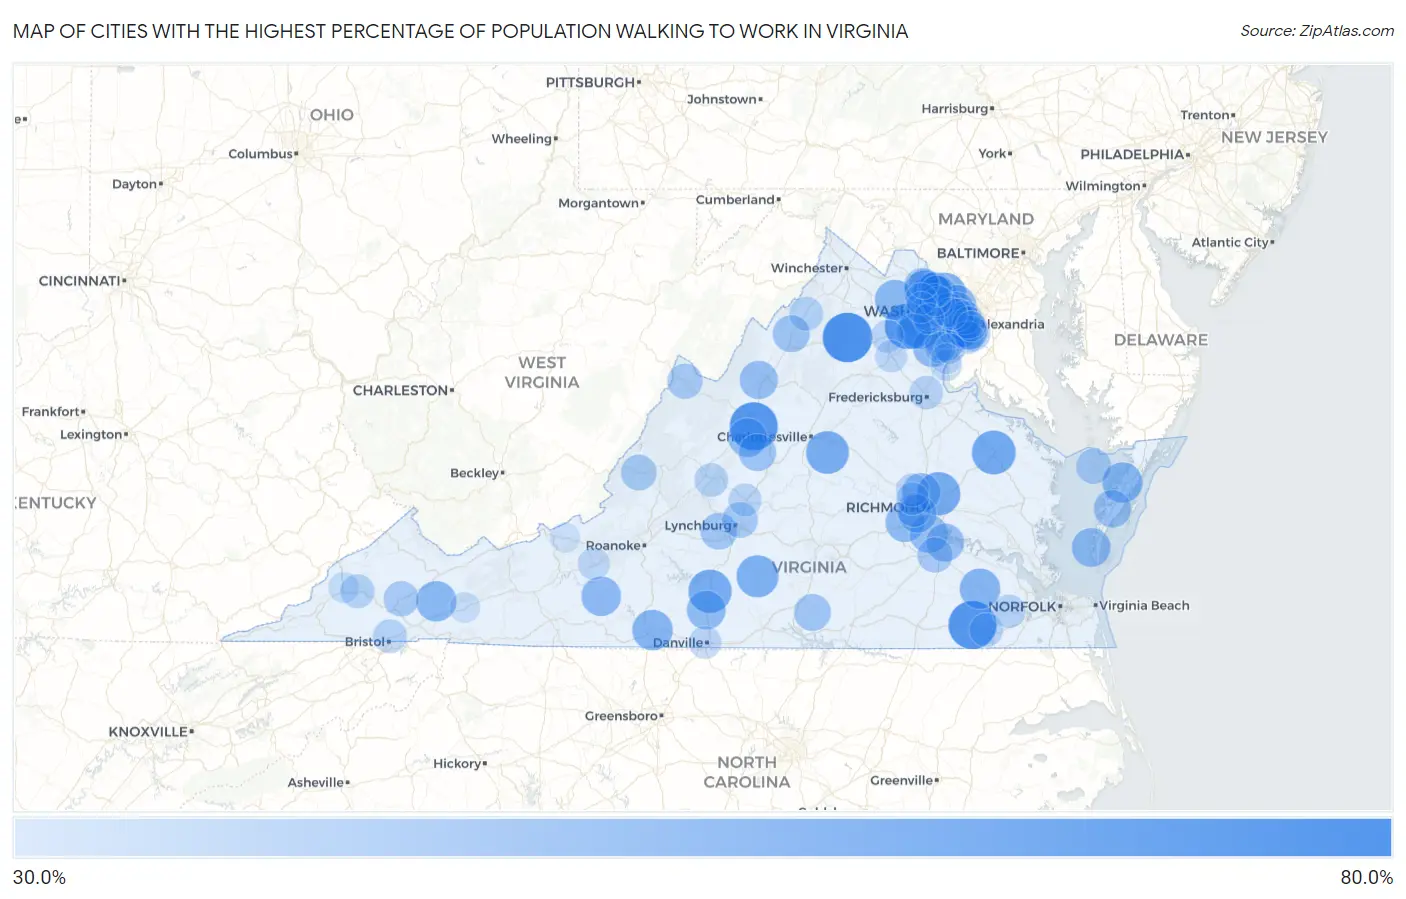
Map of Cities with the Highest Percentage of Population Walking to Work in Virginia
0.0%
80.0%
Cities with the Highest Percentage of Population Walking to Work in Virginia
| City | % Walk to Work | vs State | vs National | |
| 1. | Washington | 78.3% | 28.7%(+49.6)#1 | 33.4%(+44.9)#14 |
| 2. | Courtland | 75.1% | 28.7%(+46.4)#2 | 33.4%(+41.7)#45 |
| 3. | Fishersville | 74.6% | 28.7%(+45.9)#3 | 33.4%(+41.2)#49 |
| 4. | Gainesville | 68.3% | 28.7%(+39.6)#4 | 33.4%(+34.9)#171 |
| 5. | Tappahannock | 64.6% | 28.7%(+35.9)#5 | 33.4%(+31.2)#367 |
| 6. | Mechanicsville | 63.2% | 28.7%(+34.5)#6 | 33.4%(+29.8)#482 |
| 7. | Gretna | 63.2% | 28.7%(+34.5)#7 | 33.4%(+29.8)#488 |
| 8. | Lake Monticello | 62.3% | 28.7%(+33.6)#8 | 33.4%(+28.9)#568 |
| 9. | Sterling | 61.7% | 28.7%(+33.0)#9 | 33.4%(+28.3)#626 |
| 10. | Bull Run | 61.3% | 28.7%(+32.6)#10 | 33.4%(+27.9)#682 |
| 11. | Great Falls | 60.6% | 28.7%(+31.9)#11 | 33.4%(+27.2)#755 |
| 12. | Brookneal | 60.3% | 28.7%(+31.6)#12 | 33.4%(+26.9)#828 |
| 13. | Ashburn | 59.2% | 28.7%(+30.5)#13 | 33.4%(+25.8)#970 |
| 14. | Dranesville | 58.6% | 28.7%(+29.9)#14 | 33.4%(+25.2)#1,050 |
| 15. | Martinsville | 56.9% | 28.7%(+28.2)#15 | 33.4%(+23.5)#1,328 |
| 16. | Wakefield | 56.9% | 28.7%(+28.2)#16 | 33.4%(+23.5)#1,333 |
| 17. | Difficult Run | 56.7% | 28.7%(+28.0)#17 | 33.4%(+23.3)#1,346 |
| 18. | Saltville | 56.7% | 28.7%(+28.0)#18 | 33.4%(+23.3)#1,353 |
| 19. | Onancock | 56.3% | 28.7%(+27.6)#19 | 33.4%(+22.9)#1,451 |
| 20. | Middleburg | 56.3% | 28.7%(+27.6)#20 | 33.4%(+22.9)#1,460 |
| 21. | Mclean | 55.6% | 28.7%(+26.9)#21 | 33.4%(+22.2)#1,535 |
| 22. | Annandale | 55.6% | 28.7%(+26.9)#22 | 33.4%(+22.2)#1,536 |
| 23. | Floyd | 54.6% | 28.7%(+25.9)#23 | 33.4%(+21.2)#1,730 |
| 24. | Brandermill | 53.4% | 28.7%(+24.7)#24 | 33.4%(+20.0)#1,951 |
| 25. | Lake Ridge | 53.3% | 28.7%(+24.6)#25 | 33.4%(+19.9)#1,962 |
| 26. | Independent Hill | 53.1% | 28.7%(+24.4)#26 | 33.4%(+19.7)#2,010 |
| 27. | Cape Charles | 53.1% | 28.7%(+24.4)#27 | 33.4%(+19.7)#2,016 |
| 28. | Chatham | 53.0% | 28.7%(+24.3)#28 | 33.4%(+19.6)#2,032 |
| 29. | Springfield | 52.7% | 28.7%(+24.0)#29 | 33.4%(+19.3)#2,073 |
| 30. | Stuarts Draft | 52.5% | 28.7%(+23.8)#30 | 33.4%(+19.1)#2,107 |
| 31. | Laurel | 52.3% | 28.7%(+23.6)#31 | 33.4%(+18.9)#2,161 |
| 32. | Idylwood | 52.0% | 28.7%(+23.3)#32 | 33.4%(+18.6)#2,231 |
| 33. | Chester | 51.6% | 28.7%(+22.9)#33 | 33.4%(+18.2)#2,277 |
| 34. | Dayton | 51.5% | 28.7%(+22.8)#34 | 33.4%(+18.1)#2,303 |
| 35. | Hopewell | 51.3% | 28.7%(+22.6)#35 | 33.4%(+17.9)#2,338 |
| 36. | Groveton | 51.3% | 28.7%(+22.6)#36 | 33.4%(+17.9)#2,342 |
| 37. | Manchester | 51.1% | 28.7%(+22.4)#37 | 33.4%(+17.7)#2,379 |
| 38. | Franconia | 50.6% | 28.7%(+21.9)#38 | 33.4%(+17.2)#2,464 |
| 39. | Franklin Farm | 50.1% | 28.7%(+21.4)#39 | 33.4%(+16.7)#2,584 |
| 40. | Exmore | 49.9% | 28.7%(+21.2)#40 | 33.4%(+16.5)#2,627 |
| 41. | Dulles Town Center | 49.4% | 28.7%(+20.7)#41 | 33.4%(+16.0)#2,730 |
| 42. | Wintergreen | 49.4% | 28.7%(+20.7)#42 | 33.4%(+16.0)#2,737 |
| 43. | Union Mill | 48.6% | 28.7%(+19.9)#43 | 33.4%(+15.2)#2,859 |
| 44. | Mount Jackson | 48.5% | 28.7%(+19.8)#44 | 33.4%(+15.1)#2,884 |
| 45. | Belmont | 48.3% | 28.7%(+19.6)#45 | 33.4%(+14.9)#2,931 |
| 46. | Chase City | 48.3% | 28.7%(+19.6)#46 | 33.4%(+14.9)#2,939 |
| 47. | Forest | 48.2% | 28.7%(+19.5)#47 | 33.4%(+14.8)#2,961 |
| 48. | Chantilly | 47.4% | 28.7%(+18.7)#48 | 33.4%(+14.0)#3,105 |
| 49. | Madison Heights | 45.7% | 28.7%(+17.0)#49 | 33.4%(+12.3)#3,410 |
| 50. | Covington | 45.7% | 28.7%(+17.0)#50 | 33.4%(+12.3)#3,415 |
| 51. | Linton Hall | 45.4% | 28.7%(+16.7)#51 | 33.4%(+12.0)#3,487 |
| 52. | Lincolnia | 45.1% | 28.7%(+16.4)#52 | 33.4%(+11.7)#3,557 |
| 53. | Petersburg | 44.8% | 28.7%(+16.1)#53 | 33.4%(+11.4)#3,611 |
| 54. | Lebanon | 44.7% | 28.7%(+16.0)#54 | 33.4%(+11.3)#3,635 |
| 55. | Monterey | 44.7% | 28.7%(+16.0)#55 | 33.4%(+11.3)#3,644 |
| 56. | Hayfield | 44.5% | 28.7%(+15.8)#56 | 33.4%(+11.1)#3,672 |
| 57. | Tangier | 44.5% | 28.7%(+15.8)#57 | 33.4%(+11.1)#3,695 |
| 58. | Fort Hunt | 44.4% | 28.7%(+15.7)#58 | 33.4%(+11.0)#3,703 |
| 59. | Kingstowne | 42.2% | 28.7%(+13.5)#59 | 33.4%(+8.80)#4,176 |
| 60. | Vienna | 42.1% | 28.7%(+13.4)#60 | 33.4%(+8.70)#4,189 |
| 61. | Hybla Valley | 41.8% | 28.7%(+13.1)#61 | 33.4%(+8.40)#4,239 |
| 62. | Woodstock | 41.6% | 28.7%(+12.9)#62 | 33.4%(+8.20)#4,301 |
| 63. | Coeburn | 41.6% | 28.7%(+12.9)#63 | 33.4%(+8.20)#4,311 |
| 64. | Bon Air | 41.5% | 28.7%(+12.8)#64 | 33.4%(+8.10)#4,326 |
| 65. | Cascades | 41.5% | 28.7%(+12.8)#65 | 33.4%(+8.10)#4,327 |
| 66. | Bristol | 41.4% | 28.7%(+12.7)#66 | 33.4%(+8.00)#4,370 |
| 67. | Buena Vista | 40.9% | 28.7%(+12.2)#67 | 33.4%(+7.50)#4,470 |
| 68. | Franklin | 40.8% | 28.7%(+12.1)#68 | 33.4%(+7.40)#4,491 |
| 69. | Falmouth | 40.5% | 28.7%(+11.8)#69 | 33.4%(+7.10)#4,573 |
| 70. | Bailey S Crossroads | 40.1% | 28.7%(+11.4)#70 | 33.4%(+6.70)#4,679 |
| 71. | Windsor | 40.1% | 28.7%(+11.4)#71 | 33.4%(+6.70)#4,684 |
| 72. | Innsbrook | 39.4% | 28.7%(+10.7)#72 | 33.4%(+6.00)#4,826 |
| 73. | Amherst | 39.4% | 28.7%(+10.7)#73 | 33.4%(+6.00)#4,832 |
| 74. | Hutchison | 39.0% | 28.7%(+10.3)#74 | 33.4%(+5.60)#4,919 |
| 75. | Tuckahoe | 38.7% | 28.7%(+10.0)#75 | 33.4%(+5.30)#4,984 |
| 76. | West Falls Church | 38.7% | 28.7%(+10.0)#76 | 33.4%(+5.30)#4,988 |
| 77. | Danville | 38.6% | 28.7%(+9.90)#77 | 33.4%(+5.20)#5,003 |
| 78. | Mount Vernon | 38.6% | 28.7%(+9.90)#78 | 33.4%(+5.20)#5,012 |
| 79. | Warrenton | 38.6% | 28.7%(+9.90)#79 | 33.4%(+5.20)#5,013 |
| 80. | Reston | 38.2% | 28.7%(+9.50)#80 | 33.4%(+4.80)#5,116 |
| 81. | Bealeton | 37.9% | 28.7%(+9.20)#81 | 33.4%(+4.50)#5,175 |
| 82. | Alexandria | 37.8% | 28.7%(+9.10)#82 | 33.4%(+4.40)#5,188 |
| 83. | Christiansburg | 37.7% | 28.7%(+9.00)#83 | 33.4%(+4.30)#5,230 |
| 84. | Merrifield | 37.6% | 28.7%(+8.90)#84 | 33.4%(+4.20)#5,250 |
| 85. | Herndon | 37.3% | 28.7%(+8.60)#85 | 33.4%(+3.90)#5,338 |
| 86. | Leesylvania | 37.1% | 28.7%(+8.40)#86 | 33.4%(+3.70)#5,380 |
| 87. | Quantico | 36.6% | 28.7%(+7.90)#87 | 33.4%(+3.20)#5,514 |
| 88. | Sugarland Run | 36.0% | 28.7%(+7.30)#88 | 33.4%(+2.60)#5,658 |
| 89. | Loudoun Valley Estates | 35.8% | 28.7%(+7.10)#89 | 33.4%(+2.40)#5,711 |
| 90. | Dale City | 35.5% | 28.7%(+6.80)#90 | 33.4%(+2.10)#5,782 |
| 91. | South Riding | 35.4% | 28.7%(+6.70)#91 | 33.4%(+2.00)#5,833 |
| 92. | Woodlawn Cdp Fairfax County | 35.2% | 28.7%(+6.50)#92 | 33.4%(+1.80)#5,887 |
| 93. | Wise | 34.8% | 28.7%(+6.10)#93 | 33.4%(+1.40)#5,992 |
| 94. | Centreville | 34.6% | 28.7%(+5.90)#94 | 33.4%(+1.20)#6,030 |
| 95. | Cherry Hill | 34.2% | 28.7%(+5.50)#95 | 33.4%(+0.800)#6,155 |
| 96. | Marion | 34.2% | 28.7%(+5.50)#96 | 33.4%(+0.800)#6,161 |
| 97. | Woodbridge | 33.5% | 28.7%(+4.80)#97 | 33.4%(+0.100)#6,326 |
| 98. | Huntington | 33.0% | 28.7%(+4.30)#98 | 33.4%(-0.400)#6,451 |
| 99. | Pembroke | 33.0% | 28.7%(+4.30)#99 | 33.4%(-0.400)#6,461 |
| 100. | Lansdowne | 32.9% | 28.7%(+4.20)#100 | 33.4%(-0.500)#6,475 |
Common Questions
What are the Top 10 Cities with the Highest Percentage of Population Walking to Work in Virginia?
Top 10 Cities with the Highest Percentage of Population Walking to Work in Virginia are:
#1
78.3%
#2
75.1%
#3
74.6%
#4
68.3%
#5
64.6%
#6
63.2%
#7
63.2%
#8
62.3%
#9
61.7%
#10
61.3%
What city has the Highest Percentage of Population Walking to Work in Virginia?
Washington has the Highest Percentage of Population Walking to Work in Virginia with 78.3%.
What is the Percentage of Population Walking to Work in the State of Virginia?
Percentage of Population Walking to Work in Virginia is 28.7%.
What is the Percentage of Population Walking to Work in the United States?
Percentage of Population Walking to Work in the United States is 33.4%.