Cities with the Highest Percentage of Population Walking to Work in Indiana
RELATED REPORTS & OPTIONS
Walk to Work
Indiana
Compare Cities
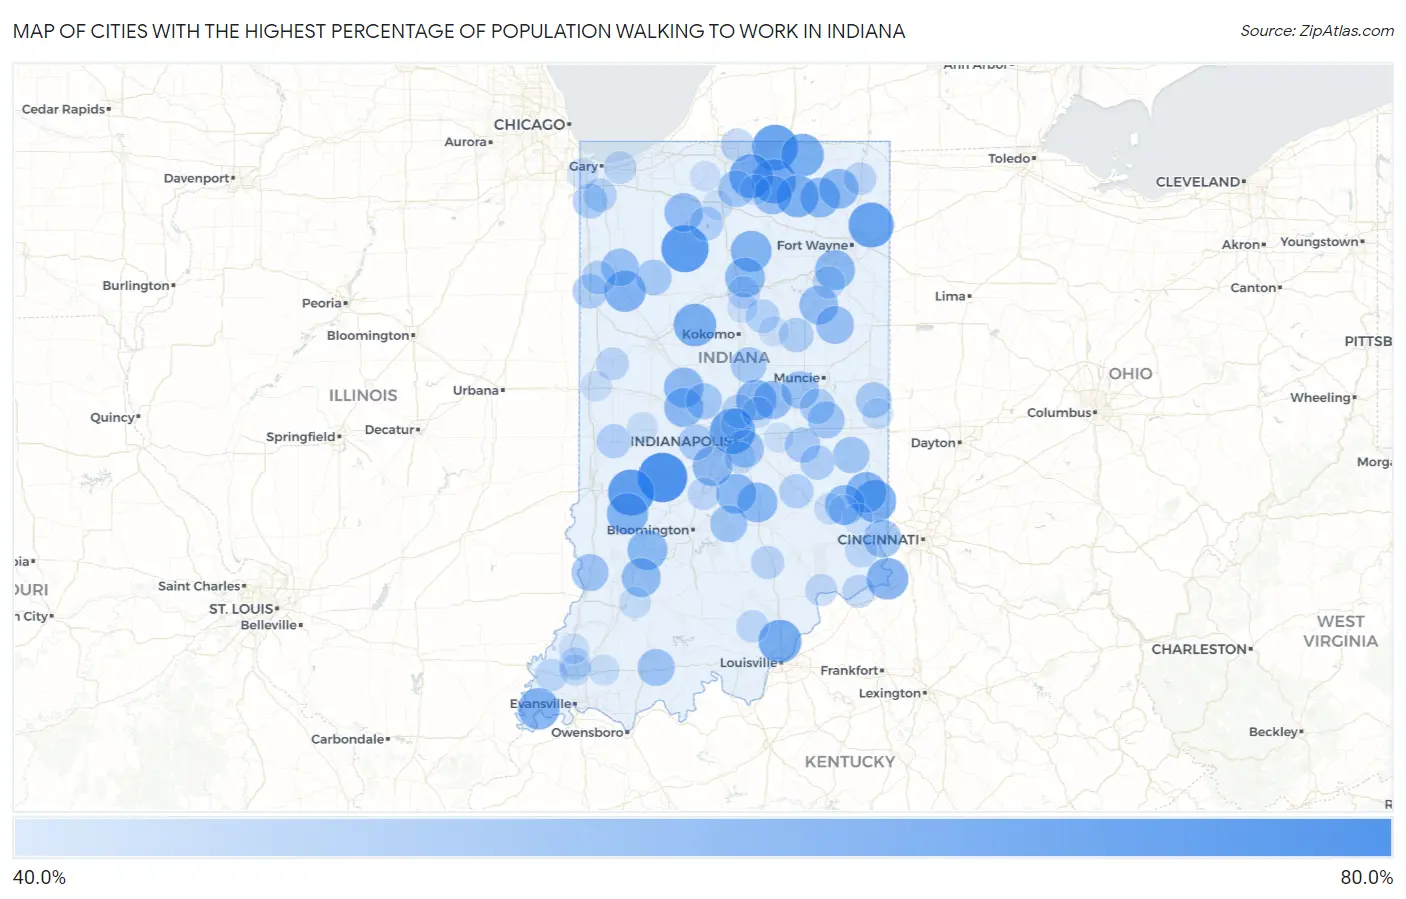
Map of Cities with the Highest Percentage of Population Walking to Work in Indiana
0.0%
80.0%
Cities with the Highest Percentage of Population Walking to Work in Indiana
| City | % Walk to Work | vs State | vs National | |
| 1. | Cloverdale | 74.3% | 30.2%(+44.1)#1 | 33.4%(+40.9)#51 |
| 2. | Winamac | 70.2% | 30.2%(+40.0)#2 | 33.4%(+36.8)#114 |
| 3. | Center Point | 68.5% | 30.2%(+38.3)#3 | 33.4%(+35.1)#164 |
| 4. | Bristol | 67.5% | 30.2%(+37.3)#4 | 33.4%(+34.1)#199 |
| 5. | Spring Hill | 66.8% | 30.2%(+36.6)#5 | 33.4%(+33.4)#238 |
| 6. | Grabill | 66.6% | 30.2%(+36.4)#6 | 33.4%(+33.2)#241 |
| 7. | New Paris | 65.0% | 30.2%(+34.8)#7 | 33.4%(+31.6)#353 |
| 8. | Wakarusa | 64.4% | 30.2%(+34.2)#8 | 33.4%(+31.0)#390 |
| 9. | Sellersburg | 62.8% | 30.2%(+32.6)#9 | 33.4%(+29.4)#516 |
| 10. | Flora | 62.3% | 30.2%(+32.1)#10 | 33.4%(+28.9)#574 |
| 11. | Shipshewana | 62.3% | 30.2%(+32.1)#11 | 33.4%(+28.9)#579 |
| 12. | Cedar Grove | 61.9% | 30.2%(+31.7)#12 | 33.4%(+28.5)#619 |
| 13. | Cromwell | 61.3% | 30.2%(+31.1)#13 | 33.4%(+27.9)#693 |
| 14. | Patriot | 60.5% | 30.2%(+30.3)#14 | 33.4%(+27.1)#791 |
| 15. | Mount Vernon | 60.2% | 30.2%(+30.0)#15 | 33.4%(+26.8)#842 |
| 16. | Remington | 59.9% | 30.2%(+29.7)#16 | 33.4%(+26.5)#880 |
| 17. | Clay City | 59.8% | 30.2%(+29.6)#17 | 33.4%(+26.4)#888 |
| 18. | Brookville | 59.2% | 30.2%(+29.0)#18 | 33.4%(+25.8)#977 |
| 19. | Akron | 59.2% | 30.2%(+29.0)#19 | 33.4%(+25.8)#980 |
| 20. | Noblesville | 58.7% | 30.2%(+28.5)#20 | 33.4%(+25.3)#1,037 |
| 21. | Bloomfield | 57.7% | 30.2%(+27.5)#21 | 33.4%(+24.3)#1,196 |
| 22. | Albion | 57.6% | 30.2%(+27.4)#22 | 33.4%(+24.2)#1,208 |
| 23. | Edinburgh | 57.5% | 30.2%(+27.3)#23 | 33.4%(+24.1)#1,224 |
| 24. | Trafalgar | 57.5% | 30.2%(+27.3)#24 | 33.4%(+24.1)#1,229 |
| 25. | Oldenburg | 57.5% | 30.2%(+27.3)#25 | 33.4%(+24.1)#1,232 |
| 26. | Denver | 57.5% | 30.2%(+27.3)#26 | 33.4%(+24.1)#1,235 |
| 27. | Zanesville | 57.5% | 30.2%(+27.3)#27 | 33.4%(+24.1)#1,236 |
| 28. | Mooresville | 57.4% | 30.2%(+27.2)#28 | 33.4%(+24.0)#1,244 |
| 29. | Thorntown | 57.3% | 30.2%(+27.1)#29 | 33.4%(+23.9)#1,266 |
| 30. | Kendallville | 57.2% | 30.2%(+27.0)#30 | 33.4%(+23.8)#1,286 |
| 31. | Advance | 56.6% | 30.2%(+26.4)#31 | 33.4%(+23.2)#1,374 |
| 32. | Odon | 56.0% | 30.2%(+25.8)#32 | 33.4%(+22.6)#1,496 |
| 33. | Warren | 55.7% | 30.2%(+25.5)#33 | 33.4%(+22.3)#1,532 |
| 34. | Knox | 55.4% | 30.2%(+25.2)#34 | 33.4%(+22.0)#1,592 |
| 35. | Milford | 55.4% | 30.2%(+25.2)#35 | 33.4%(+22.0)#1,595 |
| 36. | Lapel | 55.2% | 30.2%(+25.0)#36 | 33.4%(+21.8)#1,647 |
| 37. | Montpelier | 54.2% | 30.2%(+24.0)#37 | 33.4%(+20.8)#1,819 |
| 38. | Beech Grove | 54.1% | 30.2%(+23.9)#38 | 33.4%(+20.7)#1,830 |
| 39. | Lawrenceburg | 54.0% | 30.2%(+23.8)#39 | 33.4%(+20.6)#1,847 |
| 40. | Rensselaer | 53.6% | 30.2%(+23.4)#40 | 33.4%(+20.2)#1,905 |
| 41. | Chesterfield | 53.5% | 30.2%(+23.3)#41 | 33.4%(+20.1)#1,921 |
| 42. | Nashville | 52.8% | 30.2%(+22.6)#42 | 33.4%(+19.4)#2,062 |
| 43. | Ferdinand | 52.7% | 30.2%(+22.5)#43 | 33.4%(+19.3)#2,085 |
| 44. | Oaktown | 52.7% | 30.2%(+22.5)#44 | 33.4%(+19.3)#2,088 |
| 45. | New Castle | 52.2% | 30.2%(+22.0)#45 | 33.4%(+18.8)#2,191 |
| 46. | Bremen | 52.2% | 30.2%(+22.0)#46 | 33.4%(+18.8)#2,198 |
| 47. | Connersville | 51.5% | 30.2%(+21.3)#47 | 33.4%(+18.1)#2,292 |
| 48. | Lebanon | 51.3% | 30.2%(+21.1)#48 | 33.4%(+17.9)#2,340 |
| 49. | Tipton | 50.5% | 30.2%(+20.3)#49 | 33.4%(+17.1)#2,490 |
| 50. | Monon | 50.5% | 30.2%(+20.3)#50 | 33.4%(+17.1)#2,494 |
| 51. | Lynn | 50.5% | 30.2%(+20.3)#51 | 33.4%(+17.1)#2,498 |
| 52. | Danville | 50.1% | 30.2%(+19.9)#52 | 33.4%(+16.7)#2,588 |
| 53. | Carthage | 49.8% | 30.2%(+19.6)#53 | 33.4%(+16.4)#2,644 |
| 54. | Sulphur Springs | 49.6% | 30.2%(+19.4)#54 | 33.4%(+16.2)#2,679 |
| 55. | Kentland | 48.9% | 30.2%(+18.7)#55 | 33.4%(+15.5)#2,824 |
| 56. | Cedar Lake | 48.7% | 30.2%(+18.5)#56 | 33.4%(+15.3)#2,848 |
| 57. | Jonesboro | 48.4% | 30.2%(+18.2)#57 | 33.4%(+15.0)#2,919 |
| 58. | Rushville | 48.2% | 30.2%(+18.0)#58 | 33.4%(+14.8)#2,963 |
| 59. | St Paul | 48.0% | 30.2%(+17.8)#59 | 33.4%(+14.6)#3,007 |
| 60. | Carmel | 47.6% | 30.2%(+17.4)#60 | 33.4%(+14.2)#3,053 |
| 61. | Rockville | 47.5% | 30.2%(+17.3)#61 | 33.4%(+14.1)#3,079 |
| 62. | Culver | 47.5% | 30.2%(+17.3)#62 | 33.4%(+14.1)#3,085 |
| 63. | Brook | 47.5% | 30.2%(+17.3)#63 | 33.4%(+14.1)#3,087 |
| 64. | Amboy | 47.2% | 30.2%(+17.0)#64 | 33.4%(+13.8)#3,167 |
| 65. | Crown Point | 46.6% | 30.2%(+16.4)#65 | 33.4%(+13.2)#3,231 |
| 66. | Seymour | 46.3% | 30.2%(+16.1)#66 | 33.4%(+12.9)#3,300 |
| 67. | Granger | 46.1% | 30.2%(+15.9)#67 | 33.4%(+12.7)#3,346 |
| 68. | Vevay | 45.9% | 30.2%(+15.7)#68 | 33.4%(+12.5)#3,383 |
| 69. | Attica | 45.5% | 30.2%(+15.3)#69 | 33.4%(+12.1)#3,457 |
| 70. | Ashley | 45.5% | 30.2%(+15.3)#70 | 33.4%(+12.1)#3,469 |
| 71. | Peru | 45.4% | 30.2%(+15.2)#71 | 33.4%(+12.0)#3,497 |
| 72. | Ardmore | 45.4% | 30.2%(+15.2)#72 | 33.4%(+12.0)#3,505 |
| 73. | Portage | 45.2% | 30.2%(+15.0)#73 | 33.4%(+11.8)#3,534 |
| 74. | Martinsville | 45.2% | 30.2%(+15.0)#74 | 33.4%(+11.8)#3,540 |
| 75. | Markle | 45.1% | 30.2%(+14.9)#75 | 33.4%(+11.7)#3,572 |
| 76. | Dillsboro | 45.0% | 30.2%(+14.8)#76 | 33.4%(+11.6)#3,584 |
| 77. | Poseyville | 45.0% | 30.2%(+14.8)#77 | 33.4%(+11.6)#3,585 |
| 78. | New Pekin | 44.9% | 30.2%(+14.7)#78 | 33.4%(+11.5)#3,606 |
| 79. | Madison | 44.5% | 30.2%(+14.3)#79 | 33.4%(+11.1)#3,667 |
| 80. | Fort Branch | 44.4% | 30.2%(+14.2)#80 | 33.4%(+11.0)#3,707 |
| 81. | Southport | 43.9% | 30.2%(+13.7)#81 | 33.4%(+10.5)#3,801 |
| 82. | Haubstadt | 43.5% | 30.2%(+13.3)#82 | 33.4%(+10.1)#3,880 |
| 83. | Montgomery | 43.5% | 30.2%(+13.3)#83 | 33.4%(+10.1)#3,886 |
| 84. | New Point | 43.5% | 30.2%(+13.3)#84 | 33.4%(+10.1)#3,897 |
| 85. | Meridian Hills | 43.2% | 30.2%(+13.0)#85 | 33.4%(+9.80)#3,958 |
| 86. | Fishers | 43.0% | 30.2%(+12.8)#86 | 33.4%(+9.60)#3,976 |
| 87. | Fountain City | 42.7% | 30.2%(+12.5)#87 | 33.4%(+9.30)#4,046 |
| 88. | Munster | 42.6% | 30.2%(+12.4)#88 | 33.4%(+9.20)#4,056 |
| 89. | Covington | 42.4% | 30.2%(+12.2)#89 | 33.4%(+9.00)#4,128 |
| 90. | Lynnville | 42.4% | 30.2%(+12.2)#90 | 33.4%(+9.00)#4,133 |
| 91. | Russellville | 42.4% | 30.2%(+12.2)#91 | 33.4%(+9.00)#4,138 |
| 92. | North Liberty | 41.9% | 30.2%(+11.7)#92 | 33.4%(+8.50)#4,233 |
| 93. | Nappanee | 41.8% | 30.2%(+11.6)#93 | 33.4%(+8.40)#4,245 |
| 94. | Sunman | 41.8% | 30.2%(+11.6)#94 | 33.4%(+8.40)#4,253 |
| 95. | Bunker Hill | 41.8% | 30.2%(+11.6)#95 | 33.4%(+8.40)#4,256 |
| 96. | Princeton | 41.7% | 30.2%(+11.5)#96 | 33.4%(+8.30)#4,271 |
| 97. | Swayzee | 41.5% | 30.2%(+11.3)#97 | 33.4%(+8.10)#4,347 |
| 98. | Plymouth | 41.4% | 30.2%(+11.2)#98 | 33.4%(+8.00)#4,373 |
| 99. | Batesville | 41.3% | 30.2%(+11.1)#99 | 33.4%(+7.90)#4,398 |
| 100. | Greenfield | 41.1% | 30.2%(+10.9)#100 | 33.4%(+7.70)#4,439 |
Common Questions
What are the Top 10 Cities with the Highest Percentage of Population Walking to Work in Indiana?
Top 10 Cities with the Highest Percentage of Population Walking to Work in Indiana are:
#1
74.3%
#2
70.2%
#3
68.5%
#4
67.5%
#5
66.8%
#6
66.6%
#7
65.0%
#8
64.4%
#9
62.8%
#10
62.3%
What city has the Highest Percentage of Population Walking to Work in Indiana?
Cloverdale has the Highest Percentage of Population Walking to Work in Indiana with 74.3%.
What is the Percentage of Population Walking to Work in the State of Indiana?
Percentage of Population Walking to Work in Indiana is 30.2%.
What is the Percentage of Population Walking to Work in the United States?
Percentage of Population Walking to Work in the United States is 33.4%.