Zip Codes with the Highest Percentage of Population Walking to Work in San Diego, CA
RELATED REPORTS & OPTIONS
Walk to Work
San Diego
Compare Zip Codes
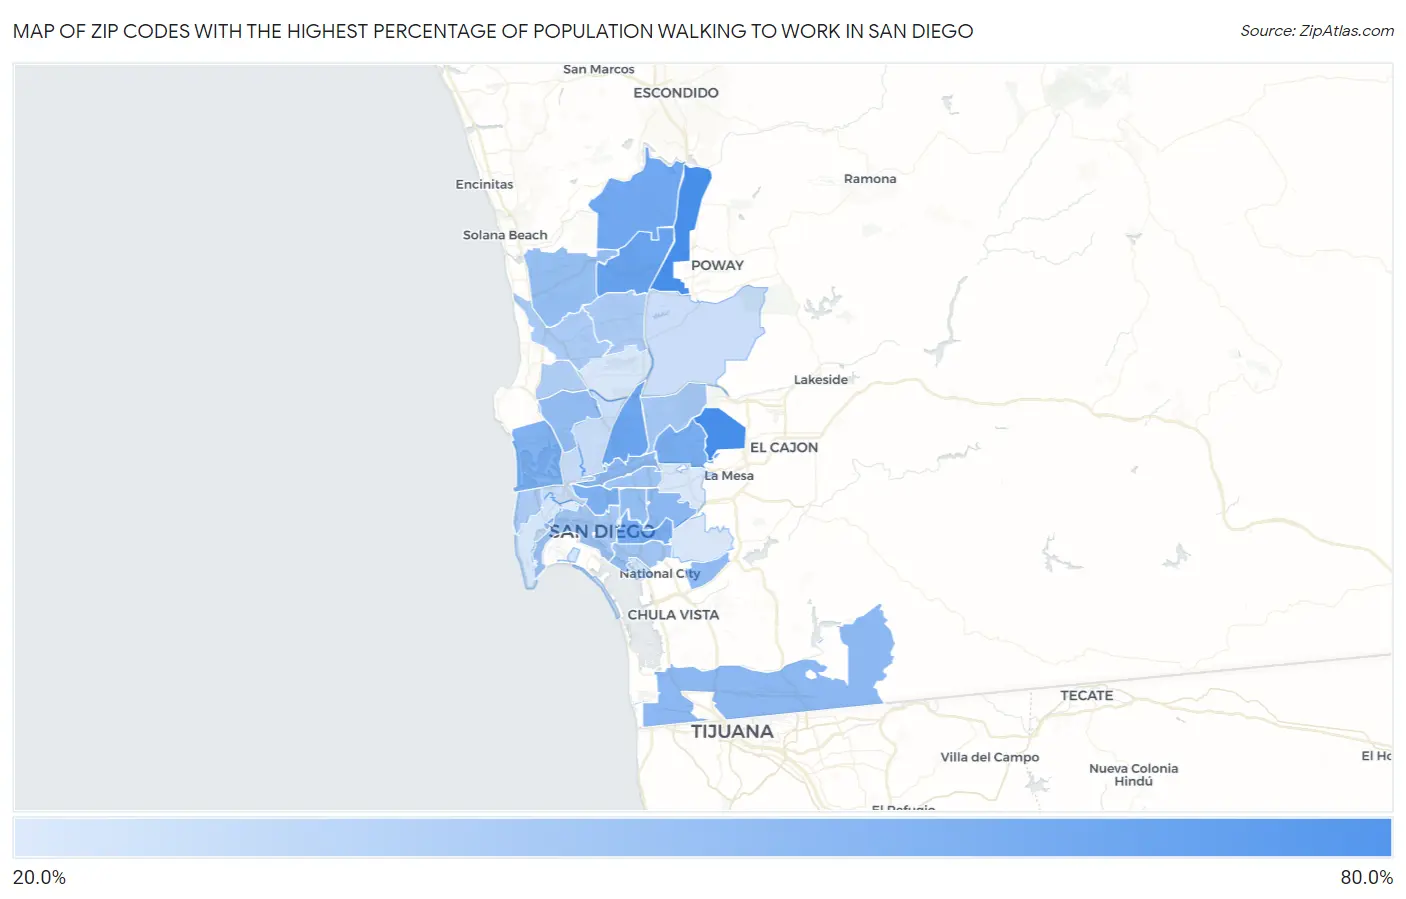
Map of Zip Codes with the Highest Percentage of Population Walking to Work in San Diego
20.2%
60.4%
Zip Codes with the Highest Percentage of Population Walking to Work in San Diego, CA
| Zip Code | % Walk to Work | vs State | vs National | |
| 1. | 92128 | 60.4% | 34.4%(+26.0)#40 | 33.4%(+27.0)#1,338 |
| 2. | 92119 | 60.3% | 34.4%(+25.9)#42 | 33.4%(+26.9)#1,367 |
| 3. | 92129 | 50.5% | 34.4%(+16.1)#197 | 33.4%(+17.1)#4,339 |
| 4. | 92123 | 49.5% | 34.4%(+15.1)#222 | 33.4%(+16.1)#4,718 |
| 5. | 92127 | 47.8% | 34.4%(+13.4)#257 | 33.4%(+14.4)#5,351 |
| 6. | 92102 | 46.4% | 34.4%(+12.0)#298 | 33.4%(+13.0)#5,873 |
| 7. | 92120 | 46.4% | 34.4%(+12.0)#301 | 33.4%(+13.0)#5,878 |
| 8. | 92103 | 44.5% | 34.4%(+10.1)#358 | 33.4%(+11.1)#6,569 |
| 9. | 92109 | 43.4% | 34.4%(+9.00)#398 | 33.4%(+10.0)#7,014 |
| 10. | 92108 | 40.6% | 34.4%(+6.20)#483 | 33.4%(+7.20)#8,111 |
| 11. | 92154 | 40.4% | 34.4%(+6.00)#494 | 33.4%(+7.00)#8,209 |
| 12. | 92105 | 40.2% | 34.4%(+5.80)#500 | 33.4%(+6.80)#8,307 |
| 13. | 92139 | 39.0% | 34.4%(+4.60)#540 | 33.4%(+5.60)#8,781 |
| 14. | 92117 | 38.6% | 34.4%(+4.20)#552 | 33.4%(+5.20)#8,962 |
| 15. | 92104 | 38.0% | 34.4%(+3.60)#586 | 33.4%(+4.60)#9,210 |
| 16. | 92130 | 37.9% | 34.4%(+3.50)#592 | 33.4%(+4.50)#9,249 |
| 17. | 92116 | 35.4% | 34.4%(+1.00)#717 | 33.4%(+2.00)#10,377 |
| 18. | 92113 | 34.7% | 34.4%(+0.300)#750 | 33.4%(+1.30)#10,649 |
| 19. | 92101 | 34.0% | 34.4%(-0.400)#784 | 33.4%(+0.600)#10,950 |
| 20. | 92124 | 33.5% | 34.4%(-0.900)#807 | 33.4%(+0.100)#11,163 |
| 21. | 92126 | 32.6% | 34.4%(-1.80)#848 | 33.4%(-0.800)#11,523 |
| 22. | 92121 | 32.5% | 34.4%(-1.90)#855 | 33.4%(-0.900)#11,619 |
| 23. | 92107 | 31.8% | 34.4%(-2.60)#877 | 33.4%(-1.60)#11,850 |
| 24. | 92122 | 31.3% | 34.4%(-3.10)#892 | 33.4%(-2.10)#12,072 |
| 25. | 92111 | 25.3% | 34.4%(-9.10)#1,046 | 33.4%(-8.10)#14,199 |
| 26. | 92110 | 25.3% | 34.4%(-9.10)#1,047 | 33.4%(-8.10)#14,209 |
| 27. | 92131 | 24.8% | 34.4%(-9.60)#1,061 | 33.4%(-8.60)#14,328 |
| 28. | 92136 | 22.5% | 34.4%(-11.9)#1,115 | 33.4%(-10.9)#15,127 |
| 29. | 92155 | 22.4% | 34.4%(-12.0)#1,117 | 33.4%(-11.0)#15,154 |
| 30. | 92135 | 22.1% | 34.4%(-12.3)#1,121 | 33.4%(-11.3)#15,236 |
| 31. | 92106 | 22.0% | 34.4%(-12.4)#1,124 | 33.4%(-11.4)#15,258 |
| 32. | 92114 | 21.5% | 34.4%(-12.9)#1,139 | 33.4%(-11.9)#15,543 |
| 33. | 92145 | 21.4% | 34.4%(-13.0)#1,149 | 33.4%(-12.0)#15,641 |
| 34. | 92115 | 21.3% | 34.4%(-13.1)#1,150 | 33.4%(-12.1)#15,650 |
| 35. | 92134 | 21.1% | 34.4%(-13.3)#1,156 | 33.4%(-12.3)#15,776 |
| 36. | 92147 | 21.0% | 34.4%(-13.4)#1,161 | 33.4%(-12.4)#15,826 |
| 37. | 92140 | 20.2% | 34.4%(-14.2)#1,176 | 33.4%(-13.2)#16,219 |
1
Common Questions
What are the Top 10 Zip Codes with the Highest Percentage of Population Walking to Work in San Diego, CA?
Top 10 Zip Codes with the Highest Percentage of Population Walking to Work in San Diego, CA are:
What zip code has the Highest Percentage of Population Walking to Work in San Diego, CA?
92128 has the Highest Percentage of Population Walking to Work in San Diego, CA with 60.4%.
What is the Percentage of Population Walking to Work in San Diego, CA?
Percentage of Population Walking to Work in San Diego is 28.9%.
What is the Percentage of Population Walking to Work in California?
Percentage of Population Walking to Work in California is 34.4%.
What is the Percentage of Population Walking to Work in the United States?
Percentage of Population Walking to Work in the United States is 33.4%.