Cities with the Highest Percentage of Population Walking to Work in New York
RELATED REPORTS & OPTIONS
Walk to Work
New York
Compare Cities
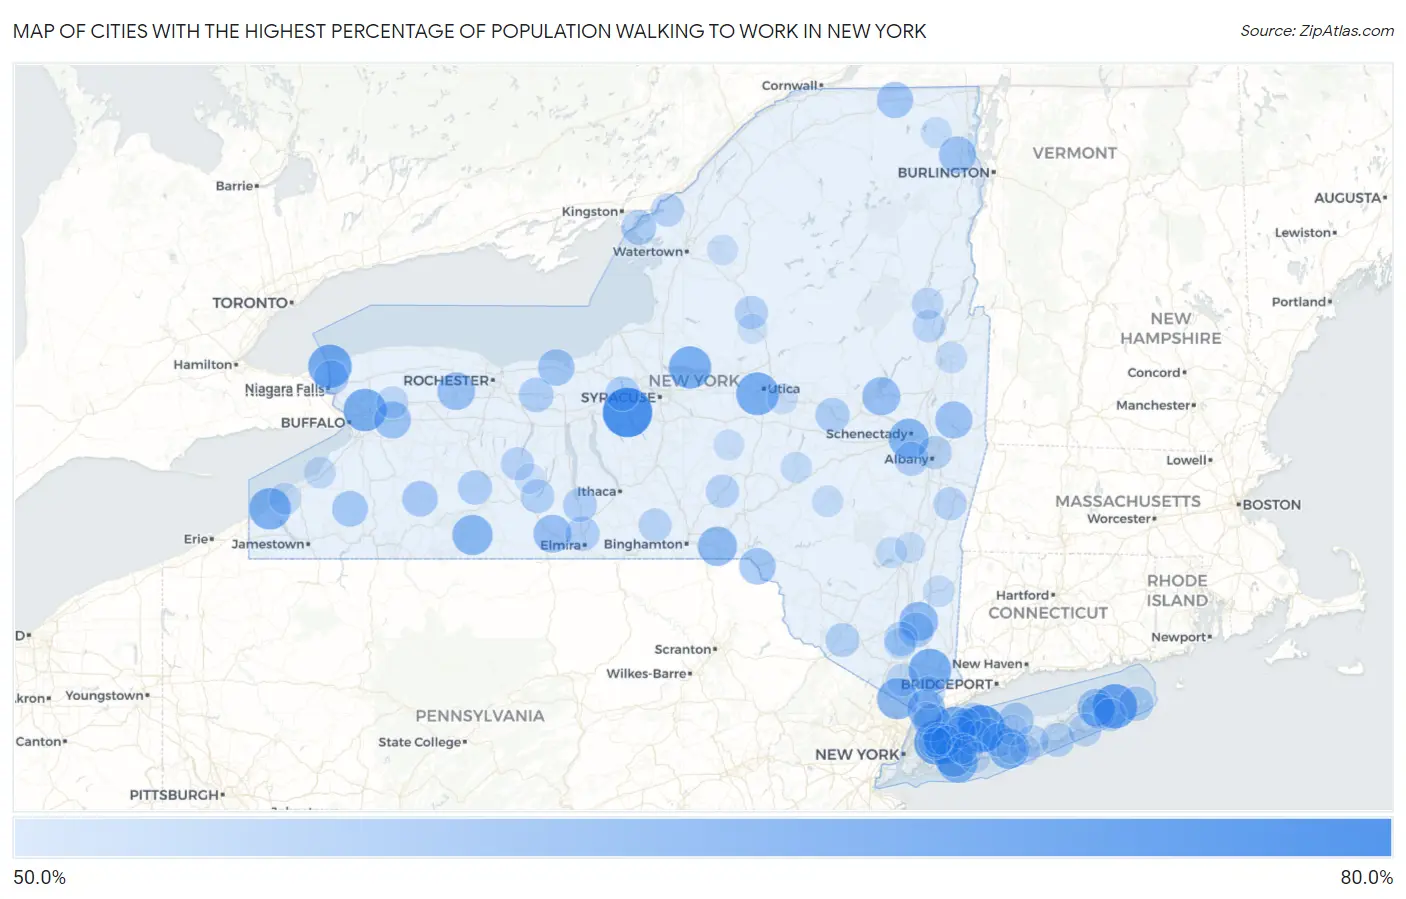
Map of Cities with the Highest Percentage of Population Walking to Work in New York
0.0%
80.0%
Cities with the Highest Percentage of Population Walking to Work in New York
| City | % Walk to Work | vs State | vs National | |
| 1. | Skaneateles | 78.1% | 38.1%(+40.0)#1 | 33.4%(+44.7)#16 |
| 2. | East Northport | 75.2% | 38.1%(+37.1)#2 | 33.4%(+41.8)#41 |
| 3. | Kensington | 71.4% | 38.1%(+33.3)#3 | 33.4%(+38.0)#83 |
| 4. | Springs | 71.3% | 38.1%(+33.2)#4 | 33.4%(+37.9)#86 |
| 5. | Youngstown | 70.3% | 38.1%(+32.2)#5 | 33.4%(+36.9)#111 |
| 6. | New Hartford | 69.3% | 38.1%(+31.2)#6 | 33.4%(+35.9)#132 |
| 7. | Williamsville | 69.1% | 38.1%(+31.0)#7 | 33.4%(+35.7)#140 |
| 8. | Yorktown Heights | 69.1% | 38.1%(+31.0)#8 | 33.4%(+35.7)#142 |
| 9. | Cleveland | 68.8% | 38.1%(+30.7)#9 | 33.4%(+35.4)#152 |
| 10. | Mill Neck | 68.1% | 38.1%(+30.0)#10 | 33.4%(+34.7)#182 |
| 11. | Roslyn Heights | 67.9% | 38.1%(+29.8)#11 | 33.4%(+34.5)#186 |
| 12. | Westfield | 67.9% | 38.1%(+29.8)#12 | 33.4%(+34.5)#188 |
| 13. | Chestnut Ridge | 67.2% | 38.1%(+29.1)#13 | 33.4%(+33.8)#225 |
| 14. | Greenville Cdp Westchester County | 66.4% | 38.1%(+28.3)#14 | 33.4%(+33.0)#257 |
| 15. | Rotterdam | 66.1% | 38.1%(+28.0)#15 | 33.4%(+32.7)#280 |
| 16. | Sayville | 66.1% | 38.1%(+28.0)#16 | 33.4%(+32.7)#282 |
| 17. | Bellmore | 66.1% | 38.1%(+28.0)#17 | 33.4%(+32.7)#283 |
| 18. | Andover | 66.1% | 38.1%(+28.0)#18 | 33.4%(+32.7)#286 |
| 19. | Windsor | 64.8% | 38.1%(+26.7)#19 | 33.4%(+31.4)#361 |
| 20. | North Merrick | 64.6% | 38.1%(+26.5)#20 | 33.4%(+31.2)#365 |
| 21. | Myers Corner | 64.4% | 38.1%(+26.3)#21 | 33.4%(+31.0)#385 |
| 22. | Hartsdale | 63.5% | 38.1%(+25.4)#22 | 33.4%(+30.1)#448 |
| 23. | Broadalbin | 63.4% | 38.1%(+25.3)#23 | 33.4%(+30.0)#468 |
| 24. | Painted Post | 63.2% | 38.1%(+25.1)#24 | 33.4%(+29.8)#487 |
| 25. | Bergen | 63.1% | 38.1%(+25.0)#25 | 33.4%(+29.7)#501 |
| 26. | Larchmont | 62.7% | 38.1%(+24.6)#26 | 33.4%(+29.3)#524 |
| 27. | North Haven | 62.5% | 38.1%(+24.4)#27 | 33.4%(+29.1)#544 |
| 28. | Valley Falls | 62.3% | 38.1%(+24.2)#28 | 33.4%(+28.9)#581 |
| 29. | Peru | 62.2% | 38.1%(+24.1)#29 | 33.4%(+28.8)#590 |
| 30. | Alden | 62.1% | 38.1%(+24.0)#30 | 33.4%(+28.7)#604 |
| 31. | Hancock | 61.5% | 38.1%(+23.4)#31 | 33.4%(+28.1)#651 |
| 32. | Sodus | 61.4% | 38.1%(+23.3)#32 | 33.4%(+28.0)#673 |
| 33. | Chateaugay | 61.1% | 38.1%(+23.0)#33 | 33.4%(+27.7)#725 |
| 34. | Cattaraugus | 60.5% | 38.1%(+22.4)#34 | 33.4%(+27.1)#781 |
| 35. | Setauket | 60.4% | 38.1%(+22.3)#35 | 33.4%(+27.0)#806 |
| 36. | Rushford | 60.3% | 38.1%(+22.2)#36 | 33.4%(+26.9)#835 |
| 37. | Fishkill | 59.5% | 38.1%(+21.4)#37 | 33.4%(+26.1)#915 |
| 38. | Sag Harbor | 59.3% | 38.1%(+21.2)#38 | 33.4%(+25.9)#952 |
| 39. | Cape Vincent | 59.3% | 38.1%(+21.2)#39 | 33.4%(+25.9)#959 |
| 40. | Mount Sinai | 59.2% | 38.1%(+21.1)#40 | 33.4%(+25.8)#974 |
| 41. | Montauk | 59.1% | 38.1%(+21.0)#41 | 33.4%(+25.7)#994 |
| 42. | Palmyra | 59.1% | 38.1%(+21.0)#42 | 33.4%(+25.7)#996 |
| 43. | Jordan | 59.1% | 38.1%(+21.0)#43 | 33.4%(+25.7)#1,003 |
| 44. | Lewiston | 59.0% | 38.1%(+20.9)#44 | 33.4%(+25.6)#1,016 |
| 45. | Fort Plain | 58.8% | 38.1%(+20.7)#45 | 33.4%(+25.4)#1,028 |
| 46. | Asharoken | 58.8% | 38.1%(+20.7)#46 | 33.4%(+25.4)#1,032 |
| 47. | Canaseraga | 58.8% | 38.1%(+20.7)#47 | 33.4%(+25.4)#1,033 |
| 48. | Horseheads | 58.7% | 38.1%(+20.6)#48 | 33.4%(+25.3)#1,041 |
| 49. | New Windsor | 58.6% | 38.1%(+20.5)#49 | 33.4%(+25.2)#1,053 |
| 50. | South Huntington | 58.5% | 38.1%(+20.4)#50 | 33.4%(+25.1)#1,064 |
| 51. | Voorheesville | 58.5% | 38.1%(+20.4)#51 | 33.4%(+25.1)#1,074 |
| 52. | Montour Falls | 58.3% | 38.1%(+20.2)#52 | 33.4%(+24.9)#1,122 |
| 53. | Otisville | 58.2% | 38.1%(+20.1)#53 | 33.4%(+24.8)#1,141 |
| 54. | Great Neck Plaza | 58.1% | 38.1%(+20.0)#54 | 33.4%(+24.7)#1,147 |
| 55. | Hammondsport | 58.0% | 38.1%(+19.9)#55 | 33.4%(+24.6)#1,164 |
| 56. | Westhampton Beach | 57.9% | 38.1%(+19.8)#56 | 33.4%(+24.5)#1,170 |
| 57. | Menands | 57.7% | 38.1%(+19.6)#57 | 33.4%(+24.3)#1,193 |
| 58. | Commack | 57.6% | 38.1%(+19.5)#58 | 33.4%(+24.2)#1,201 |
| 59. | Islandia | 57.6% | 38.1%(+19.5)#59 | 33.4%(+24.2)#1,206 |
| 60. | Oxford | 57.6% | 38.1%(+19.5)#60 | 33.4%(+24.2)#1,213 |
| 61. | Port Leyden | 57.5% | 38.1%(+19.4)#61 | 33.4%(+24.1)#1,234 |
| 62. | Chatham | 57.4% | 38.1%(+19.3)#62 | 33.4%(+24.0)#1,248 |
| 63. | Clayton | 57.3% | 38.1%(+19.2)#63 | 33.4%(+23.9)#1,263 |
| 64. | Naples | 57.3% | 38.1%(+19.2)#64 | 33.4%(+23.9)#1,267 |
| 65. | Newark Valley | 57.2% | 38.1%(+19.1)#65 | 33.4%(+23.8)#1,297 |
| 66. | Southampton | 57.1% | 38.1%(+19.0)#66 | 33.4%(+23.7)#1,307 |
| 67. | East Hampton North | 56.7% | 38.1%(+18.6)#67 | 33.4%(+23.3)#1,349 |
| 68. | Thornwood | 56.5% | 38.1%(+18.4)#68 | 33.4%(+23.1)#1,389 |
| 69. | Warrensburg | 56.4% | 38.1%(+18.3)#69 | 33.4%(+23.0)#1,426 |
| 70. | Shirley | 56.3% | 38.1%(+18.2)#70 | 33.4%(+22.9)#1,441 |
| 71. | Akron | 56.3% | 38.1%(+18.2)#71 | 33.4%(+22.9)#1,448 |
| 72. | Thiells | 56.2% | 38.1%(+18.1)#72 | 33.4%(+22.8)#1,470 |
| 73. | Chestertown | 55.9% | 38.1%(+17.8)#73 | 33.4%(+22.5)#1,508 |
| 74. | Brocton | 55.8% | 38.1%(+17.7)#74 | 33.4%(+22.4)#1,516 |
| 75. | Oyster Bay Cove | 55.6% | 38.1%(+17.5)#75 | 33.4%(+22.2)#1,544 |
| 76. | Sunset Bay | 55.6% | 38.1%(+17.5)#76 | 33.4%(+22.2)#1,548 |
| 77. | Hudson Falls | 55.4% | 38.1%(+17.3)#77 | 33.4%(+22.0)#1,589 |
| 78. | Plandome Manor | 55.4% | 38.1%(+17.3)#78 | 33.4%(+22.0)#1,605 |
| 79. | Lloyd Harbor | 55.3% | 38.1%(+17.2)#79 | 33.4%(+21.9)#1,618 |
| 80. | Millbrook | 55.3% | 38.1%(+17.2)#80 | 33.4%(+21.9)#1,624 |
| 81. | Firthcliffe | 55.2% | 38.1%(+17.1)#81 | 33.4%(+21.8)#1,645 |
| 82. | Hobart | 55.2% | 38.1%(+17.1)#82 | 33.4%(+21.8)#1,652 |
| 83. | Woodstock | 55.1% | 38.1%(+17.0)#83 | 33.4%(+21.7)#1,665 |
| 84. | Milford | 55.1% | 38.1%(+17.0)#84 | 33.4%(+21.7)#1,672 |
| 85. | Dannemora | 54.8% | 38.1%(+16.7)#85 | 33.4%(+21.4)#1,705 |
| 86. | Lindenhurst | 54.5% | 38.1%(+16.4)#86 | 33.4%(+21.1)#1,735 |
| 87. | Selden | 54.5% | 38.1%(+16.4)#87 | 33.4%(+21.1)#1,737 |
| 88. | Eastchester | 54.5% | 38.1%(+16.4)#88 | 33.4%(+21.1)#1,738 |
| 89. | Frankfort | 54.5% | 38.1%(+16.4)#89 | 33.4%(+21.1)#1,745 |
| 90. | Earlville | 54.5% | 38.1%(+16.4)#90 | 33.4%(+21.1)#1,760 |
| 91. | East Hills | 54.3% | 38.1%(+16.2)#91 | 33.4%(+20.9)#1,783 |
| 92. | Saugerties | 54.3% | 38.1%(+16.2)#92 | 33.4%(+20.9)#1,788 |
| 93. | Carthage | 54.3% | 38.1%(+16.2)#93 | 33.4%(+20.9)#1,789 |
| 94. | Prattsburgh | 54.1% | 38.1%(+16.0)#94 | 33.4%(+20.7)#1,841 |
| 95. | Farmingdale | 54.0% | 38.1%(+15.9)#95 | 33.4%(+20.6)#1,846 |
| 96. | Bellport | 54.0% | 38.1%(+15.9)#96 | 33.4%(+20.6)#1,848 |
| 97. | Bethpage | 53.8% | 38.1%(+15.7)#97 | 33.4%(+20.4)#1,861 |
| 98. | Bayport | 53.7% | 38.1%(+15.6)#98 | 33.4%(+20.3)#1,884 |
| 99. | Thomaston | 53.6% | 38.1%(+15.5)#99 | 33.4%(+20.2)#1,907 |
| 100. | Boonville | 53.6% | 38.1%(+15.5)#100 | 33.4%(+20.2)#1,908 |
Common Questions
What are the Top 10 Cities with the Highest Percentage of Population Walking to Work in New York?
Top 10 Cities with the Highest Percentage of Population Walking to Work in New York are:
#1
78.1%
#2
75.2%
#3
71.4%
#4
71.3%
#5
70.3%
#6
69.3%
#7
69.1%
#8
69.1%
#9
68.8%
#10
68.1%
What city has the Highest Percentage of Population Walking to Work in New York?
Skaneateles has the Highest Percentage of Population Walking to Work in New York with 78.1%.
What is the Percentage of Population Walking to Work in the State of New York?
Percentage of Population Walking to Work in New York is 38.1%.
What is the Percentage of Population Walking to Work in the United States?
Percentage of Population Walking to Work in the United States is 33.4%.