Galt, CA Map & Demographics
Galt Map
Galt Overview
$34,857
PER CAPITA INCOME
$103,261
AVG FAMILY INCOME
$85,069
AVG HOUSEHOLD INCOME
30.5%
WAGE / INCOME GAP [ % ]
69.5¢/ $1
WAGE / INCOME GAP [ $ ]
0.41
INEQUALITY / GINI INDEX
25,350
TOTAL POPULATION
12,943
MALE POPULATION
12,407
FEMALE POPULATION
104.32
MALES / 100 FEMALES
95.86
FEMALES / 100 MALES
38.5
MEDIAN AGE
3.5
AVG FAMILY SIZE
3.1
AVG HOUSEHOLD SIZE
12,869
LABOR FORCE [ PEOPLE ]
64.6%
PERCENT IN LABOR FORCE
6.0%
UNEMPLOYMENT RATE
Galt Zip Codes
Galt Area Codes
Income in Galt
Income Overview in Galt
Per Capita Income in Galt is $34,857, while median incomes of families and households are $103,261 and $85,069 respectively.
| Characteristic | Number | Measure |
| Per Capita Income | 25,350 | $34,857 |
| Median Family Income | 6,478 | $103,261 |
| Mean Family Income | 6,478 | $119,189 |
| Median Household Income | 8,133 | $85,069 |
| Mean Household Income | 8,133 | $106,170 |
| Income Deficit | 6,478 | $0 |
| Wage / Income Gap (%) | 25,350 | 30.49% |
| Wage / Income Gap ($) | 25,350 | 69.51¢ per $1 |
| Gini / Inequality Index | 25,350 | 0.41 |
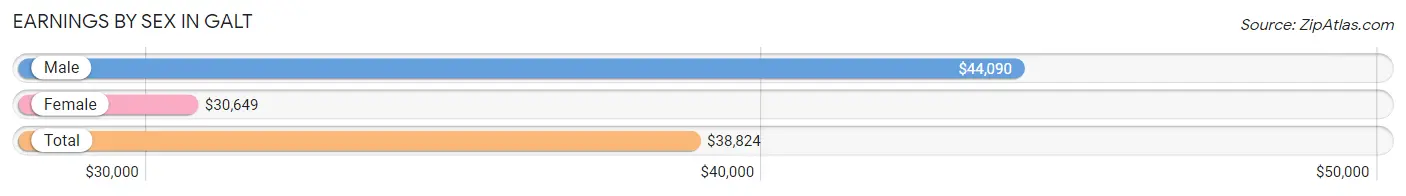
Earnings by Sex in Galt
Average Earnings in Galt are $38,824, $44,090 for men and $30,649 for women, a difference of 30.5%.
| Sex | Number | Average Earnings |
| Male | 7,341 (56.1%) | $44,090 |
| Female | 5,753 (43.9%) | $30,649 |
| Total | 13,094 (100.0%) | $38,824 |
Earnings by Sex by Income Bracket in Galt
The most common earnings brackets in Galt are $100,000+ for men (1,057 | 14.4%) and $55,000 to $64,999 for women (613 | 10.7%).
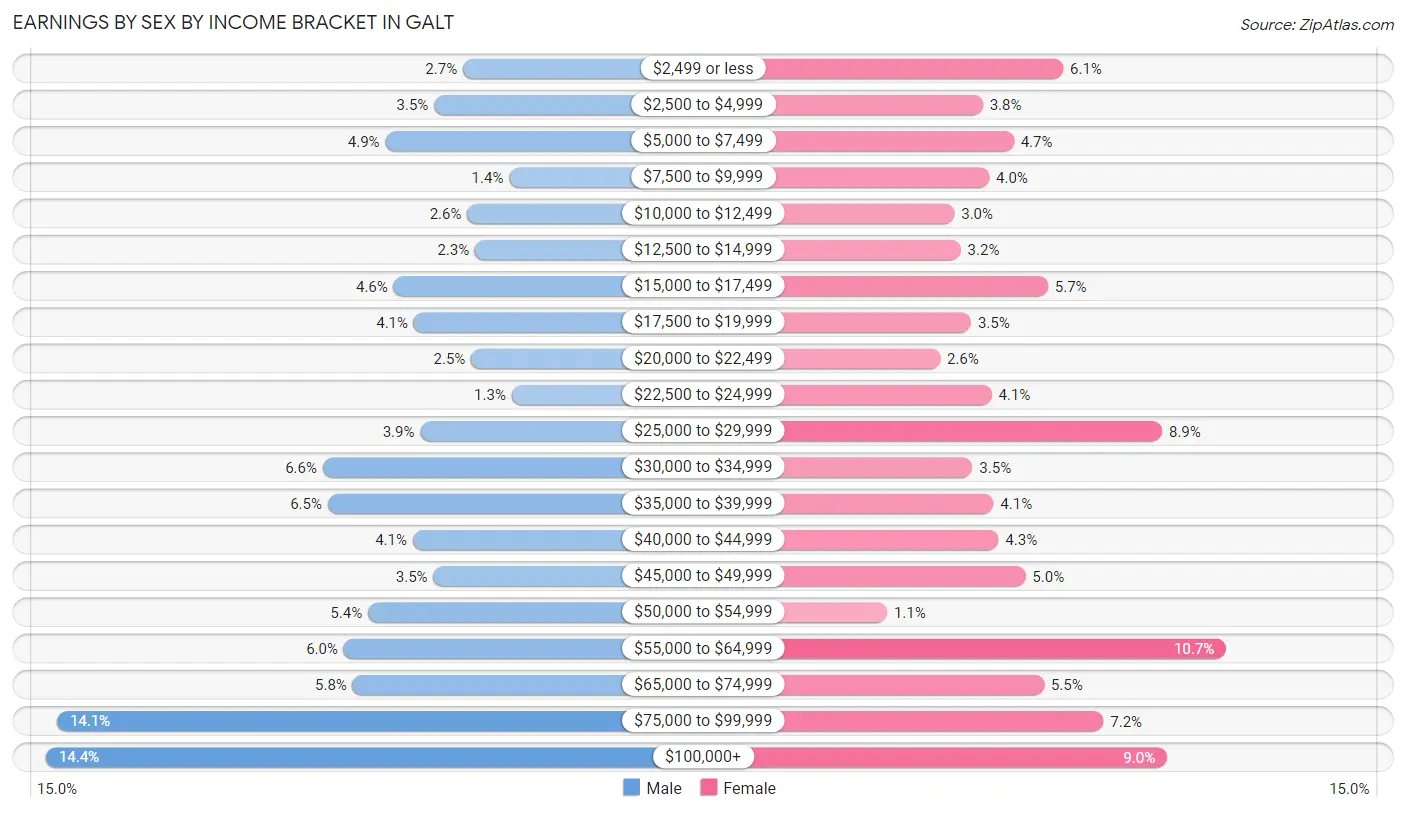
| Income | Male | Female |
| $2,499 or less | 197 (2.7%) | 350 (6.1%) |
| $2,500 to $4,999 | 256 (3.5%) | 220 (3.8%) |
| $5,000 to $7,499 | 357 (4.9%) | 270 (4.7%) |
| $7,500 to $9,999 | 101 (1.4%) | 230 (4.0%) |
| $10,000 to $12,499 | 188 (2.6%) | 174 (3.0%) |
| $12,500 to $14,999 | 172 (2.3%) | 184 (3.2%) |
| $15,000 to $17,499 | 340 (4.6%) | 325 (5.7%) |
| $17,500 to $19,999 | 298 (4.1%) | 201 (3.5%) |
| $20,000 to $22,499 | 180 (2.5%) | 151 (2.6%) |
| $22,500 to $24,999 | 96 (1.3%) | 234 (4.1%) |
| $25,000 to $29,999 | 285 (3.9%) | 510 (8.9%) |
| $30,000 to $34,999 | 486 (6.6%) | 203 (3.5%) |
| $35,000 to $39,999 | 476 (6.5%) | 237 (4.1%) |
| $40,000 to $44,999 | 300 (4.1%) | 245 (4.3%) |
| $45,000 to $49,999 | 258 (3.5%) | 289 (5.0%) |
| $50,000 to $54,999 | 393 (5.3%) | 65 (1.1%) |
| $55,000 to $64,999 | 443 (6.0%) | 613 (10.7%) |
| $65,000 to $74,999 | 424 (5.8%) | 319 (5.5%) |
| $75,000 to $99,999 | 1,034 (14.1%) | 415 (7.2%) |
| $100,000+ | 1,057 (14.4%) | 518 (9.0%) |
| Total | 7,341 (100.0%) | 5,753 (100.0%) |
Earnings by Sex by Educational Attainment in Galt
Average earnings in Galt are $50,500 for men and $40,837 for women, a difference of 19.1%. Men with an educational attainment of college or associate's degree enjoy the highest average annual earnings of $64,842, while those with less than high school education earn the least with $35,250. Women with an educational attainment of graduate degree earn the most with the average annual earnings of $82,143, while those with less than high school education have the smallest earnings of $17,443.
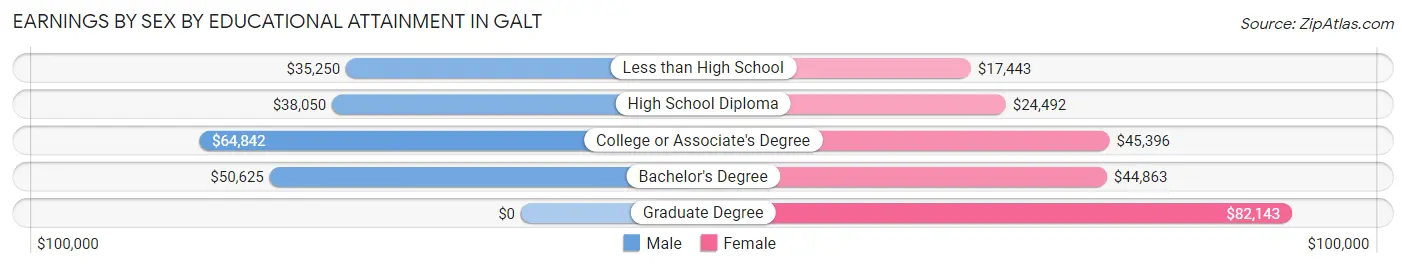
| Educational Attainment | Male Income | Female Income |
| Less than High School | $35,250 | $17,443 |
| High School Diploma | $38,050 | $24,492 |
| College or Associate's Degree | $64,842 | $45,396 |
| Bachelor's Degree | $50,625 | $44,863 |
| Graduate Degree | - | - |
| Total | $50,500 | $40,837 |
Family Income in Galt
Family Income Brackets in Galt
According to the Galt family income data, there are 1,710 families falling into the $100,000 to $149,999 income range, which is the most common income bracket and makes up 26.4% of all families. Conversely, the less than $10,000 income bracket is the least frequent group with only 39 families (0.6%) belonging to this category.
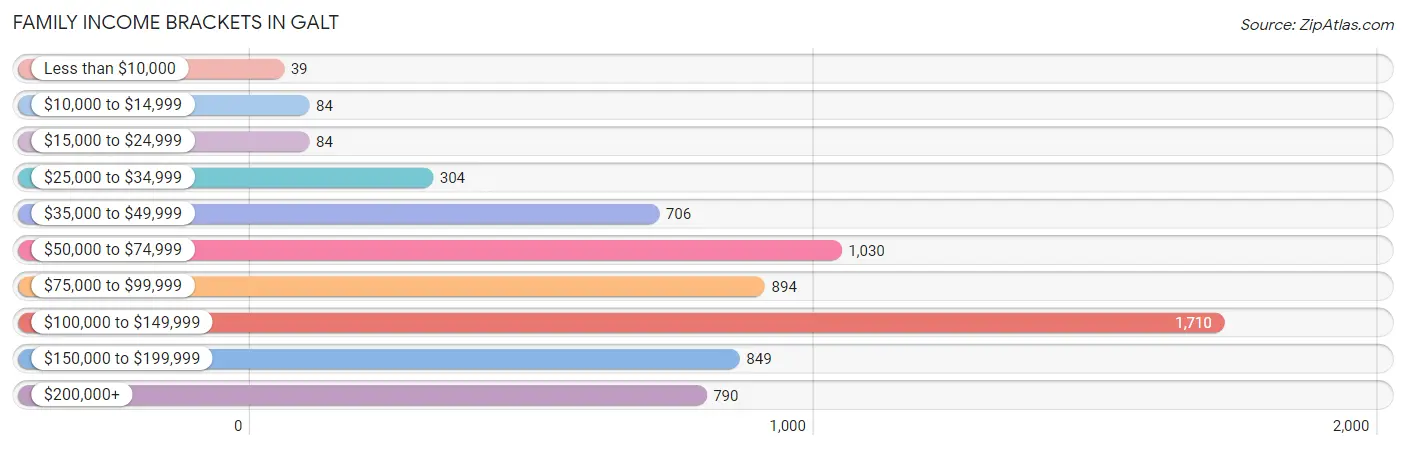
| Income Bracket | # Families | % Families |
| Less than $10,000 | 39 | 0.6% |
| $10,000 to $14,999 | 84 | 1.3% |
| $15,000 to $24,999 | 84 | 1.3% |
| $25,000 to $34,999 | 304 | 4.7% |
| $35,000 to $49,999 | 706 | 10.9% |
| $50,000 to $74,999 | 1,030 | 15.9% |
| $75,000 to $99,999 | 894 | 13.8% |
| $100,000 to $149,999 | 1,710 | 26.4% |
| $150,000 to $199,999 | 849 | 13.1% |
| $200,000+ | 790 | 12.2% |
Family Income by Famaliy Size in Galt
7+ person families (237 | 3.7%) account for the highest median family income in Galt with $134,625 per family, while 2-person families (2,131 | 32.9%) have the highest median income of $42,634 per family member.
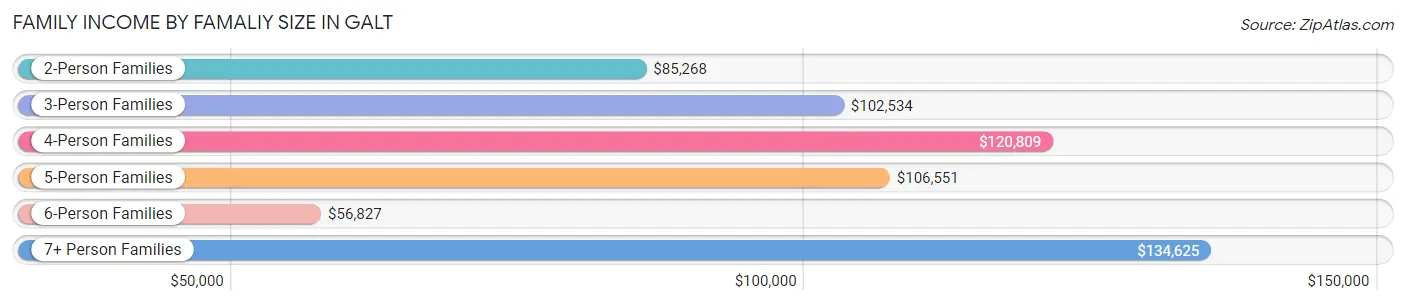
| Income Bracket | # Families | Median Income |
| 2-Person Families | 2,131 (32.9%) | $85,268 |
| 3-Person Families | 1,764 (27.2%) | $102,534 |
| 4-Person Families | 1,322 (20.4%) | $120,809 |
| 5-Person Families | 763 (11.8%) | $106,551 |
| 6-Person Families | 261 (4.0%) | $56,827 |
| 7+ Person Families | 237 (3.7%) | $134,625 |
| Total | 6,478 (100.0%) | $103,261 |
Family Income by Number of Earners in Galt
The median family income in Galt is $103,261, with families comprising 3+ earners (1,298) having the highest median family income of $146,800, while families with no earners (625) have the lowest median family income of $63,250, accounting for 20.0% and 9.7% of families, respectively.
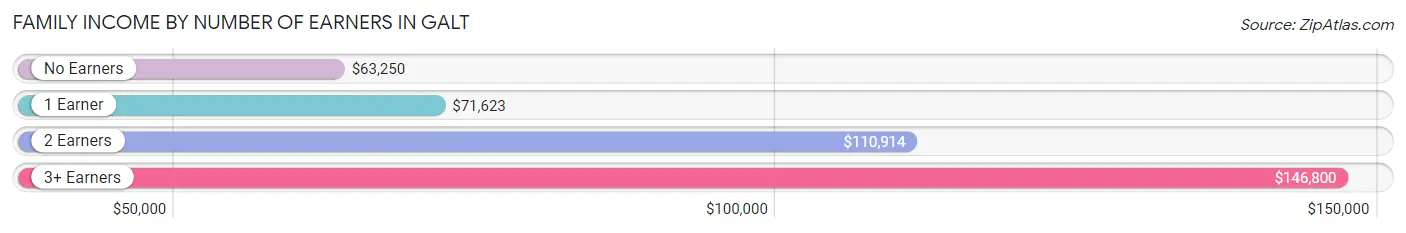
| Number of Earners | # Families | Median Income |
| No Earners | 625 (9.7%) | $63,250 |
| 1 Earner | 1,886 (29.1%) | $71,623 |
| 2 Earners | 2,669 (41.2%) | $110,914 |
| 3+ Earners | 1,298 (20.0%) | $146,800 |
| Total | 6,478 (100.0%) | $103,261 |
Household Income in Galt
Household Income Brackets in Galt
With 1,822 households falling in the category, the $100,000 to $149,999 income range is the most frequent in Galt, accounting for 22.4% of all households. In contrast, only 171 households (2.1%) fall into the $10,000 to $14,999 income bracket, making it the least populous group.
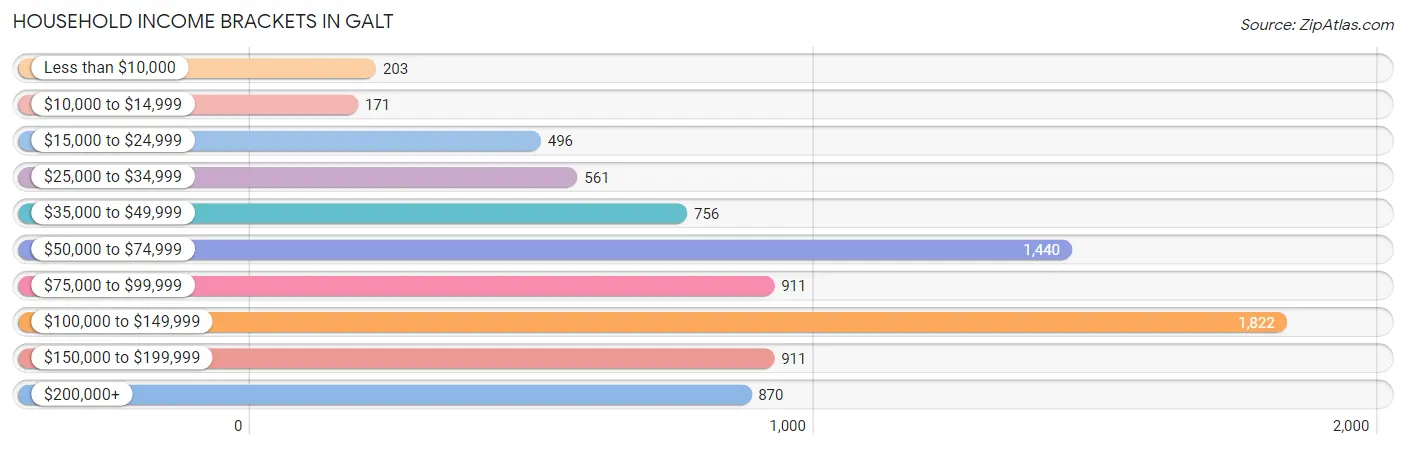
| Income Bracket | # Households | % Households |
| Less than $10,000 | 203 | 2.5% |
| $10,000 to $14,999 | 171 | 2.1% |
| $15,000 to $24,999 | 496 | 6.1% |
| $25,000 to $34,999 | 561 | 6.9% |
| $35,000 to $49,999 | 756 | 9.3% |
| $50,000 to $74,999 | 1,440 | 17.7% |
| $75,000 to $99,999 | 911 | 11.2% |
| $100,000 to $149,999 | 1,822 | 22.4% |
| $150,000 to $199,999 | 911 | 11.2% |
| $200,000+ | 870 | 10.7% |
Household Income by Householder Age in Galt
The median household income in Galt is $85,069, with the highest median household income of $105,946 found in the 45 to 64 years age bracket for the primary householder. A total of 3,598 households (44.2%) fall into this category. Meanwhile, the 15 to 24 years age bracket for the primary householder has the lowest median household income of $0, with 66 households (0.8%) in this group.
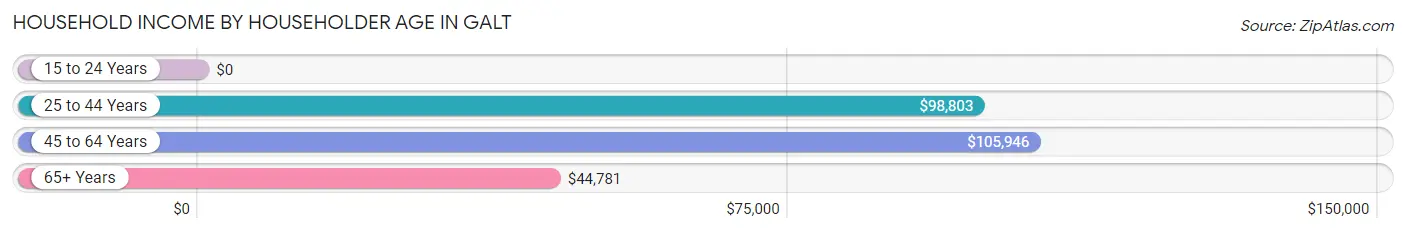
| Income Bracket | # Households | Median Income |
| 15 to 24 Years | 66 (0.8%) | $0 |
| 25 to 44 Years | 2,468 (30.3%) | $98,803 |
| 45 to 64 Years | 3,598 (44.2%) | $105,946 |
| 65+ Years | 2,001 (24.6%) | $44,781 |
| Total | 8,133 (100.0%) | $85,069 |
Poverty in Galt
Income Below Poverty by Sex and Age in Galt
With 7.2% poverty level for males and 7.3% for females among the residents of Galt, 5 year old males and 6 to 11 year old females are the most vulnerable to poverty, with 21 males (13.7%) and 154 females (14.6%) in their respective age groups living below the poverty level.
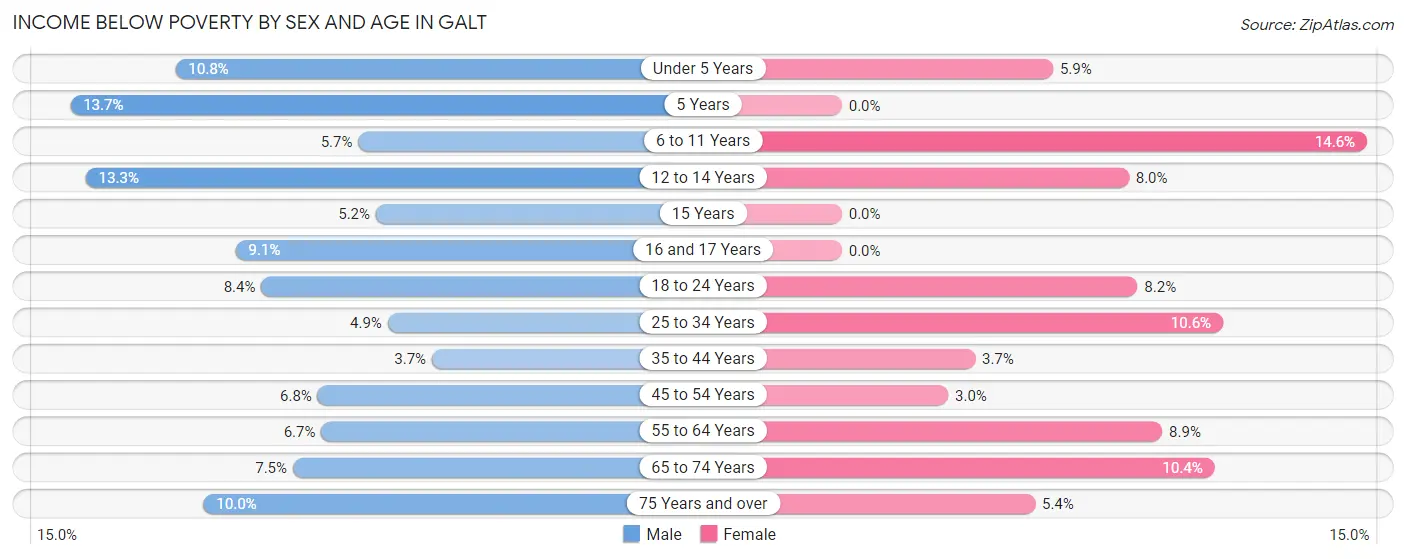
| Age Bracket | Male | Female |
| Under 5 Years | 94 (10.8%) | 30 (5.9%) |
| 5 Years | 21 (13.7%) | 0 (0.0%) |
| 6 to 11 Years | 53 (5.7%) | 154 (14.6%) |
| 12 to 14 Years | 102 (13.3%) | 46 (8.0%) |
| 15 Years | 6 (5.2%) | 0 (0.0%) |
| 16 and 17 Years | 44 (9.1%) | 0 (0.0%) |
| 18 to 24 Years | 86 (8.4%) | 74 (8.2%) |
| 25 to 34 Years | 79 (4.9%) | 182 (10.6%) |
| 35 to 44 Years | 68 (3.7%) | 60 (3.7%) |
| 45 to 54 Years | 122 (6.8%) | 52 (3.0%) |
| 55 to 64 Years | 119 (6.7%) | 123 (8.9%) |
| 65 to 74 Years | 70 (7.5%) | 146 (10.4%) |
| 75 Years and over | 58 (10.0%) | 35 (5.4%) |
| Total | 922 (7.2%) | 902 (7.3%) |
Income Above Poverty by Sex and Age in Galt
According to the poverty statistics in Galt, males aged 35 to 44 years and females aged 5 years are the age groups that are most secure financially, with 96.3% of males and 100.0% of females in these age groups living above the poverty line.
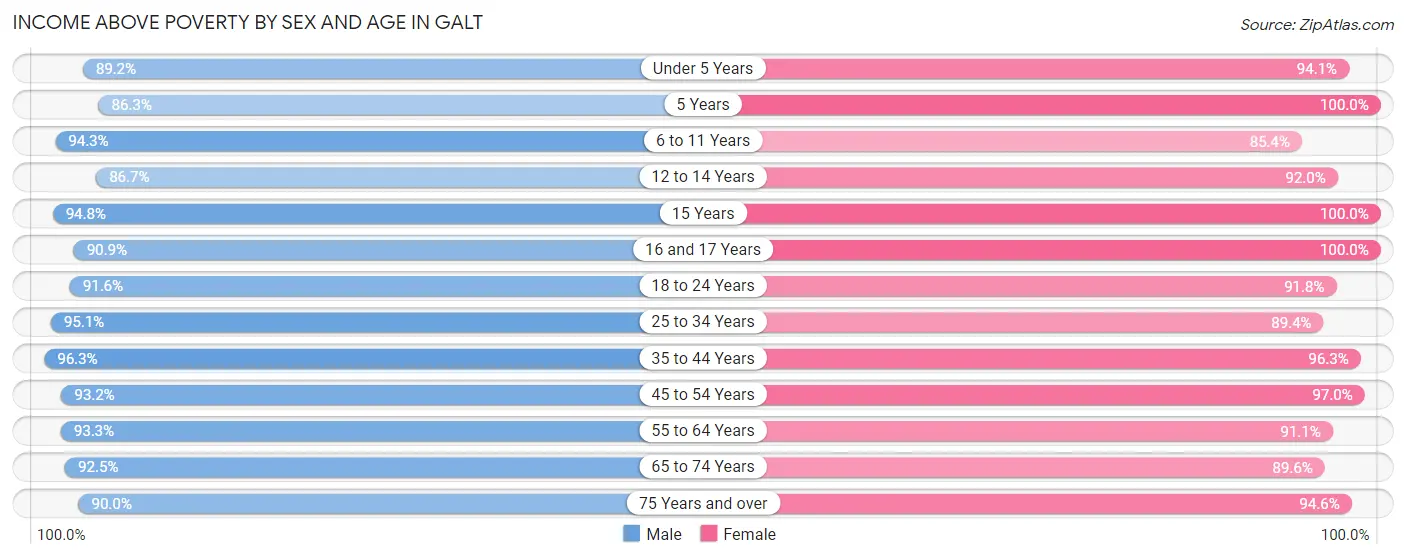
| Age Bracket | Male | Female |
| Under 5 Years | 776 (89.2%) | 480 (94.1%) |
| 5 Years | 132 (86.3%) | 355 (100.0%) |
| 6 to 11 Years | 875 (94.3%) | 899 (85.4%) |
| 12 to 14 Years | 665 (86.7%) | 530 (92.0%) |
| 15 Years | 109 (94.8%) | 85 (100.0%) |
| 16 and 17 Years | 438 (90.9%) | 316 (100.0%) |
| 18 to 24 Years | 937 (91.6%) | 825 (91.8%) |
| 25 to 34 Years | 1,536 (95.1%) | 1,533 (89.4%) |
| 35 to 44 Years | 1,789 (96.3%) | 1,556 (96.3%) |
| 45 to 54 Years | 1,662 (93.2%) | 1,706 (97.0%) |
| 55 to 64 Years | 1,647 (93.3%) | 1,256 (91.1%) |
| 65 to 74 Years | 860 (92.5%) | 1,261 (89.6%) |
| 75 Years and over | 521 (90.0%) | 616 (94.6%) |
| Total | 11,947 (92.8%) | 11,418 (92.7%) |
Income Below Poverty Among Married-Couple Families in Galt
The poverty statistics for married-couple families in Galt show that 2.7% or 127 of the total 4,706 families live below the poverty line. Families with 3 or 4 children have the highest poverty rate of 12.7%, comprising of 49 families. On the other hand, families with 5 or more children have the lowest poverty rate of 0.0%, which includes 0 families.
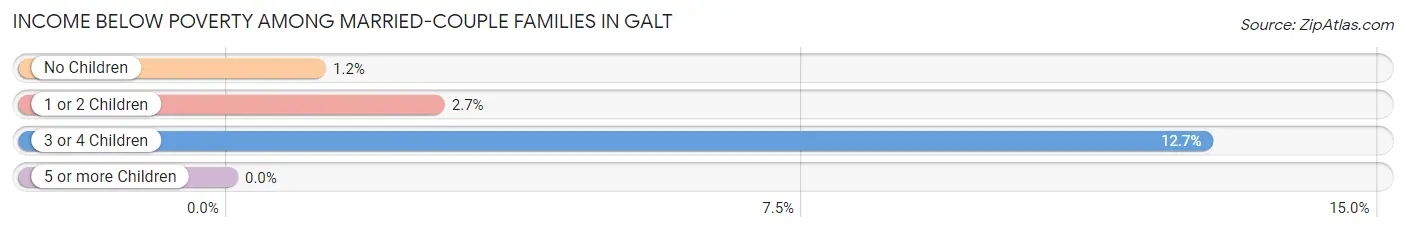
| Children | Above Poverty | Below Poverty |
| No Children | 2,397 (98.9%) | 28 (1.1%) |
| 1 or 2 Children | 1,803 (97.3%) | 50 (2.7%) |
| 3 or 4 Children | 336 (87.3%) | 49 (12.7%) |
| 5 or more Children | 43 (100.0%) | 0 (0.0%) |
| Total | 4,579 (97.3%) | 127 (2.7%) |
Income Below Poverty Among Single-Parent Households in Galt
According to the poverty data in Galt, 5.1% or 30 single-father households and 9.4% or 111 single-mother households are living below the poverty line. Among single-father households, those with 3 or 4 children have the highest poverty rate, with 13 households (46.4%) experiencing poverty. Likewise, among single-mother households, those with 3 or 4 children have the highest poverty rate, with 27 households (23.9%) falling below the poverty line.
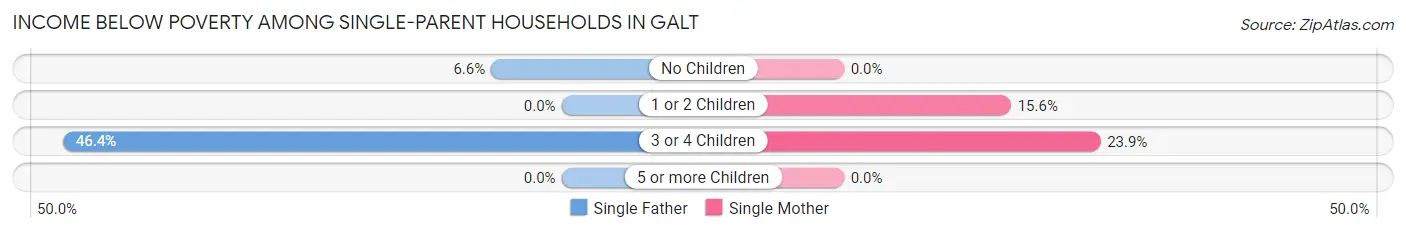
| Children | Single Father | Single Mother |
| No Children | 17 (6.6%) | 0 (0.0%) |
| 1 or 2 Children | 0 (0.0%) | 84 (15.6%) |
| 3 or 4 Children | 13 (46.4%) | 27 (23.9%) |
| 5 or more Children | 0 (0.0%) | 0 (0.0%) |
| Total | 30 (5.1%) | 111 (9.4%) |
Income Below Poverty Among Married-Couple vs Single-Parent Households in Galt
The poverty data for Galt shows that 127 of the married-couple family households (2.7%) and 141 of the single-parent households (8.0%) are living below the poverty level. Within the married-couple family households, those with 3 or 4 children have the highest poverty rate, with 49 households (12.7%) falling below the poverty line. Among the single-parent households, those with 3 or 4 children have the highest poverty rate, with 40 household (28.4%) living below poverty.
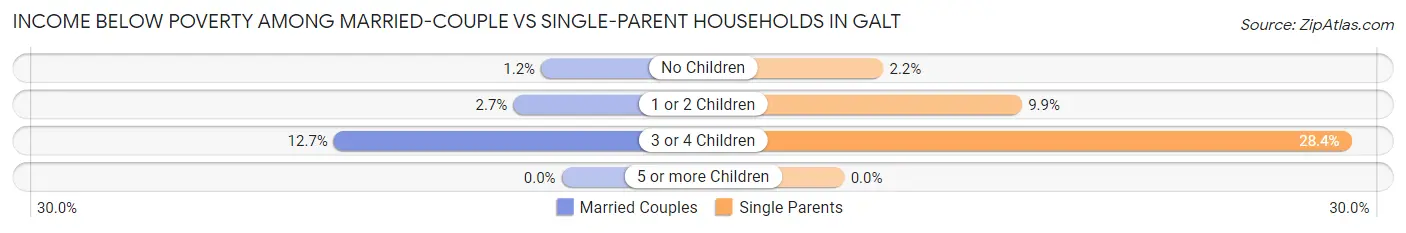
| Children | Married-Couple Families | Single-Parent Households |
| No Children | 28 (1.1%) | 17 (2.2%) |
| 1 or 2 Children | 50 (2.7%) | 84 (9.9%) |
| 3 or 4 Children | 49 (12.7%) | 40 (28.4%) |
| 5 or more Children | 0 (0.0%) | 0 (0.0%) |
| Total | 127 (2.7%) | 141 (8.0%) |
Race in Galt
The most populous races in Galt are White / Caucasian (16,097 | 63.5%), Hispanic or Latino (10,838 | 42.7%), and Some other Race (4,049 | 16.0%).
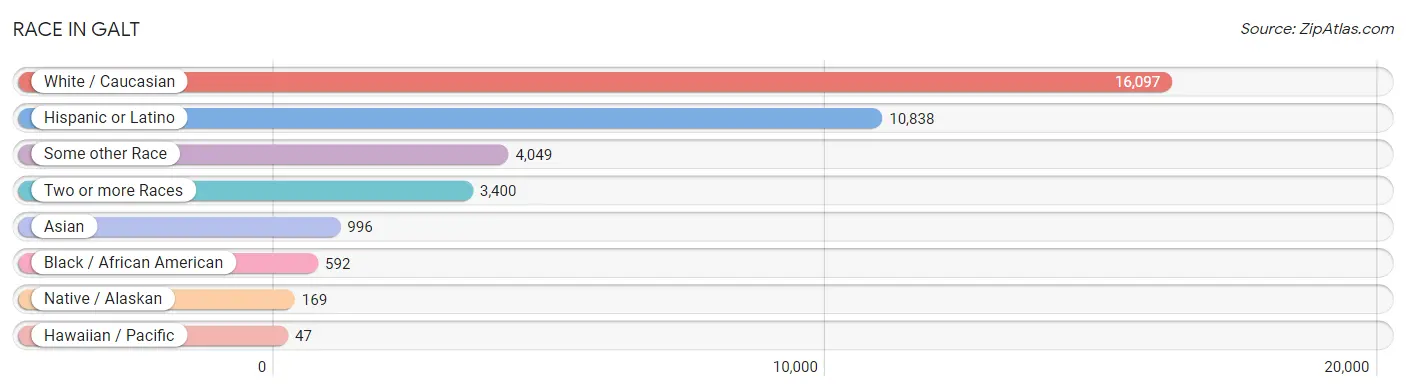
| Race | # Population | % Population |
| Asian | 996 | 3.9% |
| Black / African American | 592 | 2.3% |
| Hawaiian / Pacific | 47 | 0.2% |
| Hispanic or Latino | 10,838 | 42.7% |
| Native / Alaskan | 169 | 0.7% |
| White / Caucasian | 16,097 | 63.5% |
| Two or more Races | 3,400 | 13.4% |
| Some other Race | 4,049 | 16.0% |
| Total | 25,350 | 100.0% |
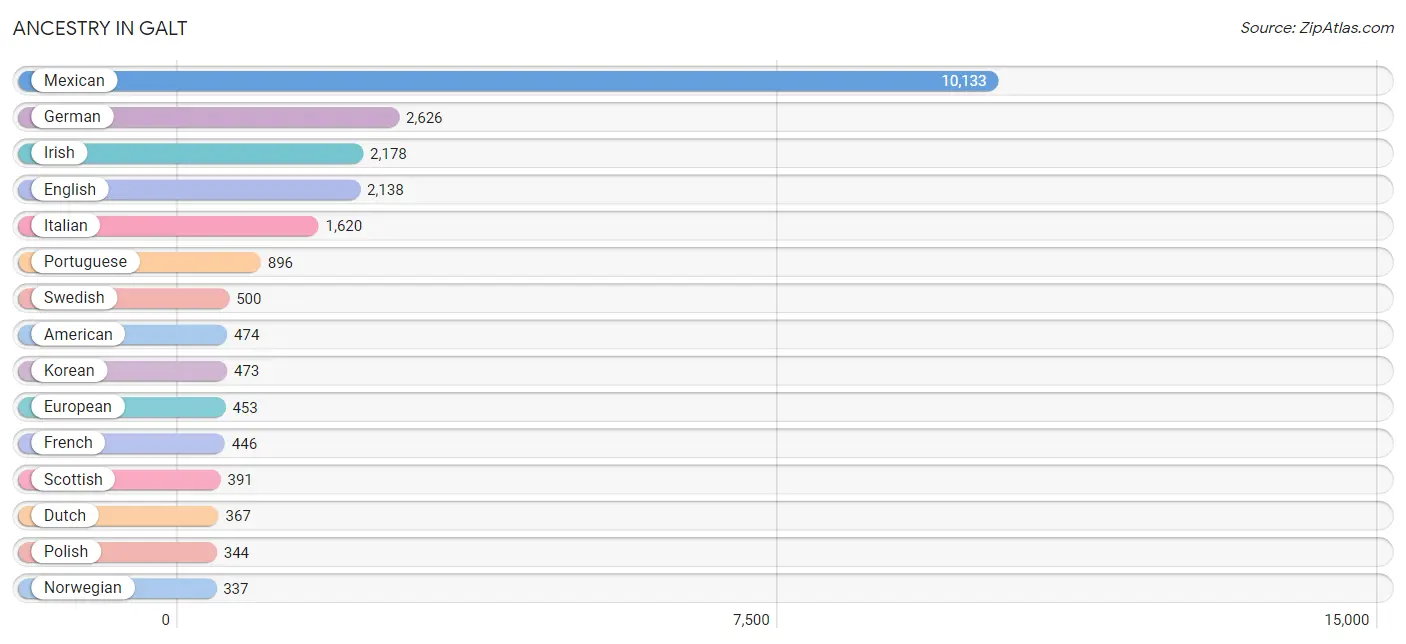
Ancestry in Galt
The most populous ancestries reported in Galt are Mexican (10,133 | 40.0%), German (2,626 | 10.4%), Irish (2,178 | 8.6%), English (2,138 | 8.4%), and Italian (1,620 | 6.4%), together accounting for 73.7% of all Galt residents.
| Ancestry | # Population | % Population |
| African | 96 | 0.4% |
| American | 474 | 1.9% |
| Apache | 12 | 0.1% |
| Arab | 70 | 0.3% |
| Bangladeshi | 137 | 0.5% |
| Basque | 20 | 0.1% |
| Bhutanese | 293 | 1.2% |
| Blackfeet | 19 | 0.1% |
| British | 145 | 0.6% |
| Burmese | 104 | 0.4% |
| Canadian | 48 | 0.2% |
| Central American | 155 | 0.6% |
| Cherokee | 34 | 0.1% |
| Chilean | 16 | 0.1% |
| Colombian | 15 | 0.1% |
| Comanche | 12 | 0.1% |
| Costa Rican | 6 | 0.0% |
| Cuban | 9 | 0.0% |
| Czech | 64 | 0.3% |
| Danish | 74 | 0.3% |
| Dutch | 367 | 1.5% |
| Eastern European | 12 | 0.1% |
| English | 2,138 | 8.4% |
| Ethiopian | 4 | 0.0% |
| European | 453 | 1.8% |
| Filipino | 44 | 0.2% |
| French | 446 | 1.8% |
| German | 2,626 | 10.4% |
| Greek | 125 | 0.5% |
| Guamanian / Chamorro | 111 | 0.4% |
| Guyanese | 23 | 0.1% |
| Honduran | 24 | 0.1% |
| Hungarian | 79 | 0.3% |
| Indian (Asian) | 128 | 0.5% |
| Irish | 2,178 | 8.6% |
| Italian | 1,620 | 6.4% |
| Korean | 473 | 1.9% |
| Lebanese | 21 | 0.1% |
| Lithuanian | 64 | 0.3% |
| Macedonian | 17 | 0.1% |
| Malaysian | 126 | 0.5% |
| Mexican | 10,133 | 40.0% |
| Mexican American Indian | 85 | 0.3% |
| Native Hawaiian | 41 | 0.2% |
| Navajo | 41 | 0.2% |
| Nepalese | 9 | 0.0% |
| Nicaraguan | 94 | 0.4% |
| Norwegian | 337 | 1.3% |
| Pakistani | 26 | 0.1% |
| Palestinian | 49 | 0.2% |
| Polish | 344 | 1.4% |
| Portuguese | 896 | 3.5% |
| Potawatomi | 11 | 0.0% |
| Puerto Rican | 98 | 0.4% |
| Russian | 129 | 0.5% |
| Salvadoran | 31 | 0.1% |
| Scandinavian | 47 | 0.2% |
| Scotch-Irish | 114 | 0.4% |
| Scottish | 391 | 1.5% |
| Serbian | 10 | 0.0% |
| Sioux | 3 | 0.0% |
| Slavic | 13 | 0.1% |
| South American | 31 | 0.1% |
| South American Indian | 15 | 0.1% |
| Spaniard | 100 | 0.4% |
| Spanish | 70 | 0.3% |
| Sri Lankan | 54 | 0.2% |
| Subsaharan African | 100 | 0.4% |
| Swedish | 500 | 2.0% |
| Swiss | 53 | 0.2% |
| Thai | 94 | 0.4% |
| Tongan | 15 | 0.1% |
| Ute | 33 | 0.1% |
| Welsh | 163 | 0.6% | View All 74 Rows |
Immigrants in Galt
The most numerous immigrant groups reported in Galt came from Latin America (3,755 | 14.8%), Central America (3,718 | 14.7%), Mexico (3,640 | 14.4%), Asia (511 | 2.0%), and Europe (268 | 1.1%), together accounting for 46.9% of all Galt residents.
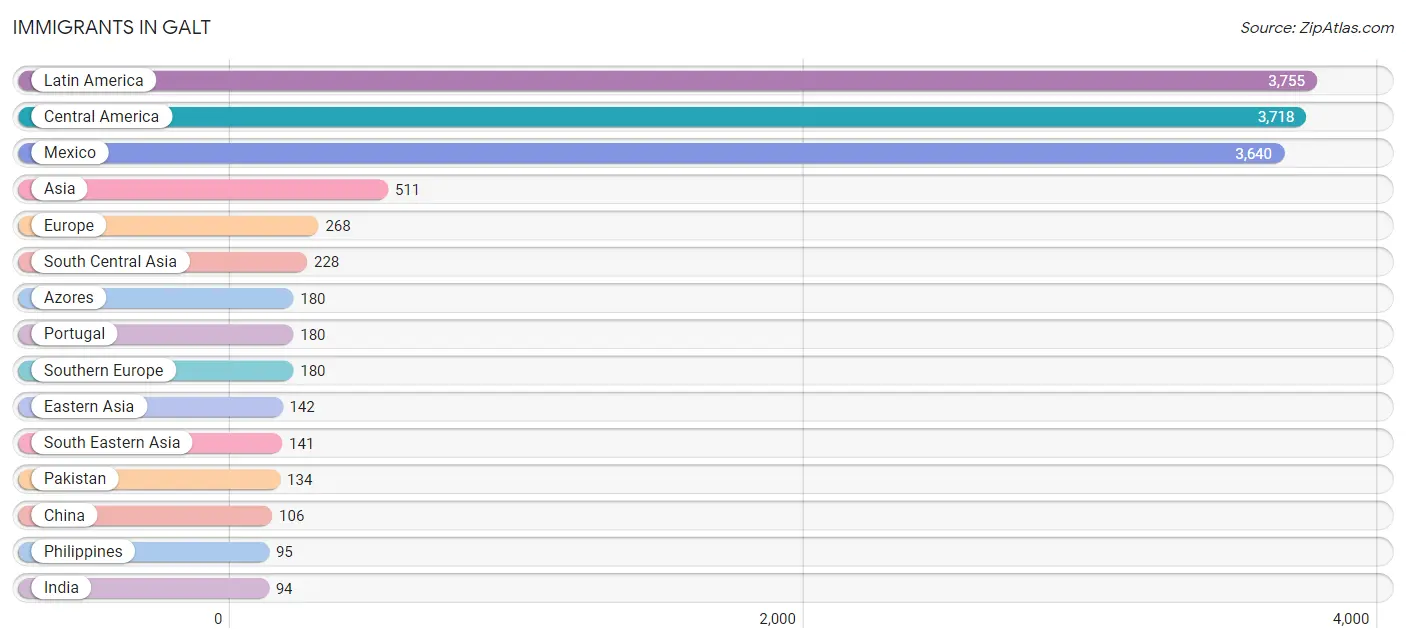
| Immigration Origin | # Population | % Population |
| Africa | 8 | 0.0% |
| Asia | 511 | 2.0% |
| Azores | 180 | 0.7% |
| Brazil | 13 | 0.1% |
| Canada | 5 | 0.0% |
| Caribbean | 9 | 0.0% |
| Central America | 3,718 | 14.7% |
| China | 106 | 0.4% |
| Colombia | 15 | 0.1% |
| Cuba | 9 | 0.0% |
| Eastern Asia | 142 | 0.6% |
| Eastern Europe | 40 | 0.2% |
| El Salvador | 31 | 0.1% |
| England | 41 | 0.2% |
| Europe | 268 | 1.1% |
| Honduras | 8 | 0.0% |
| India | 94 | 0.4% |
| Japan | 8 | 0.0% |
| Korea | 28 | 0.1% |
| Latin America | 3,755 | 14.8% |
| Mexico | 3,640 | 14.4% |
| Nicaragua | 39 | 0.2% |
| Northern Europe | 48 | 0.2% |
| Pakistan | 134 | 0.5% |
| Philippines | 95 | 0.4% |
| Portugal | 180 | 0.7% |
| Romania | 19 | 0.1% |
| Russia | 21 | 0.1% |
| Scotland | 7 | 0.0% |
| South Africa | 8 | 0.0% |
| South America | 28 | 0.1% |
| South Central Asia | 228 | 0.9% |
| South Eastern Asia | 141 | 0.6% |
| Southern Europe | 180 | 0.7% |
| Taiwan | 44 | 0.2% |
| Vietnam | 46 | 0.2% | View All 36 Rows |
Sex and Age in Galt
Sex and Age in Galt
The most populous age groups in Galt are 10 to 14 Years (1,093 | 8.4%) for men and 5 to 9 Years (1,072 | 8.6%) for women.
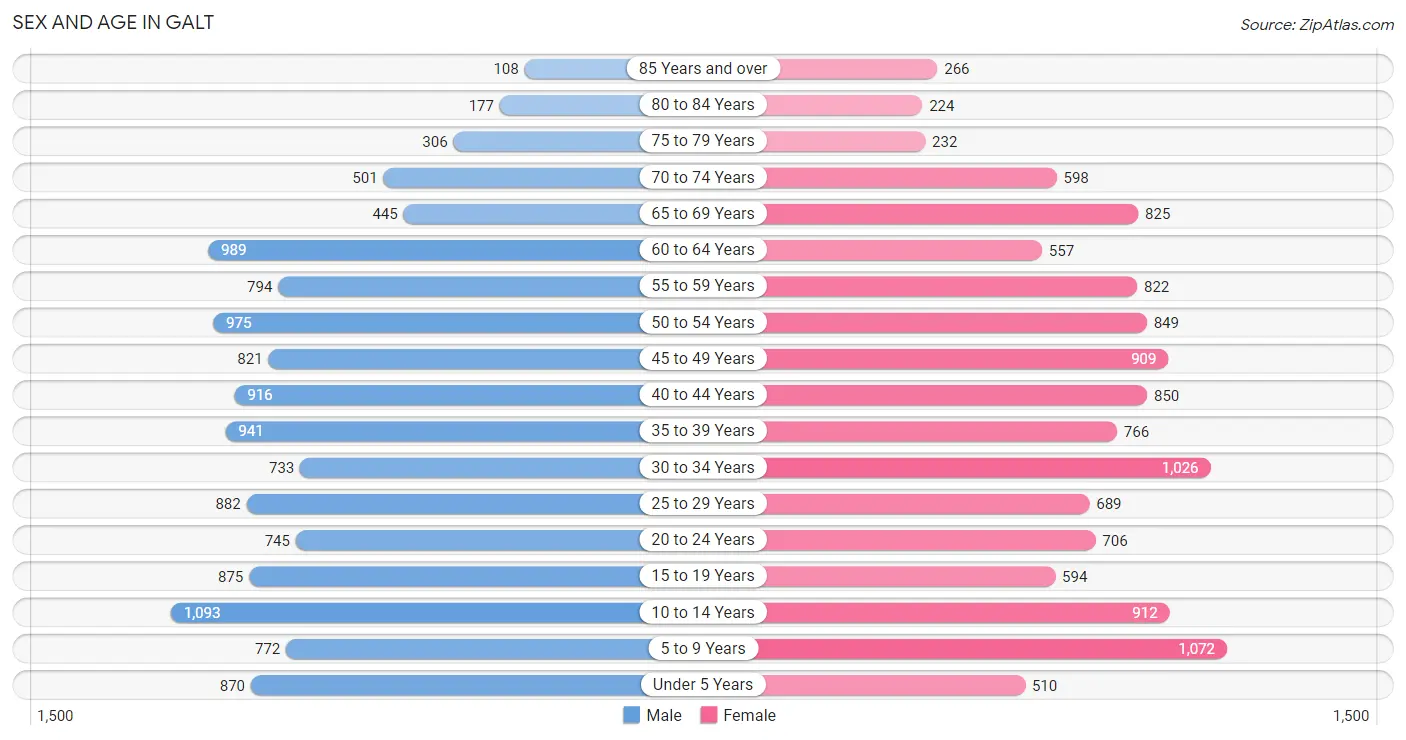
| Age Bracket | Male | Female |
| Under 5 Years | 870 (6.7%) | 510 (4.1%) |
| 5 to 9 Years | 772 (6.0%) | 1,072 (8.6%) |
| 10 to 14 Years | 1,093 (8.4%) | 912 (7.3%) |
| 15 to 19 Years | 875 (6.8%) | 594 (4.8%) |
| 20 to 24 Years | 745 (5.8%) | 706 (5.7%) |
| 25 to 29 Years | 882 (6.8%) | 689 (5.6%) |
| 30 to 34 Years | 733 (5.7%) | 1,026 (8.3%) |
| 35 to 39 Years | 941 (7.3%) | 766 (6.2%) |
| 40 to 44 Years | 916 (7.1%) | 850 (6.9%) |
| 45 to 49 Years | 821 (6.3%) | 909 (7.3%) |
| 50 to 54 Years | 975 (7.5%) | 849 (6.8%) |
| 55 to 59 Years | 794 (6.1%) | 822 (6.6%) |
| 60 to 64 Years | 989 (7.6%) | 557 (4.5%) |
| 65 to 69 Years | 445 (3.4%) | 825 (6.7%) |
| 70 to 74 Years | 501 (3.9%) | 598 (4.8%) |
| 75 to 79 Years | 306 (2.4%) | 232 (1.9%) |
| 80 to 84 Years | 177 (1.4%) | 224 (1.8%) |
| 85 Years and over | 108 (0.8%) | 266 (2.1%) |
| Total | 12,943 (100.0%) | 12,407 (100.0%) |
Families and Households in Galt
Median Family Size in Galt
The median family size in Galt is 3.49 persons per family, with single female/mother families (1,178 | 18.2%) accounting for the largest median family size of 3.6 persons per family. On the other hand, single male/father families (594 | 9.2%) represent the smallest median family size with 3.18 persons per family.
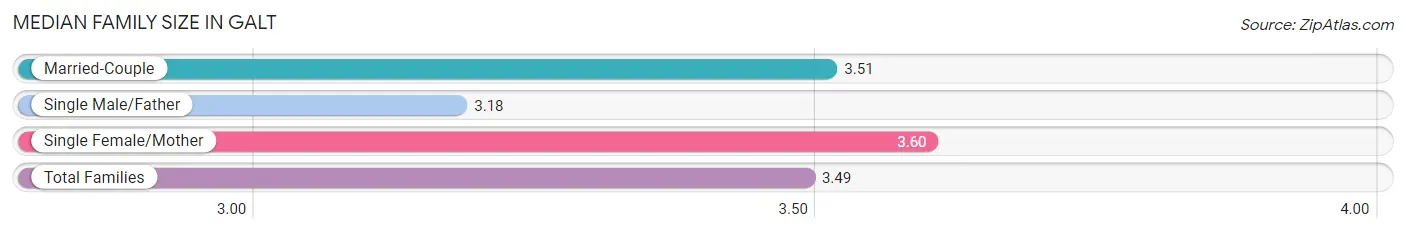
| Family Type | # Families | Family Size |
| Married-Couple | 4,706 (72.7%) | 3.51 |
| Single Male/Father | 594 (9.2%) | 3.18 |
| Single Female/Mother | 1,178 (18.2%) | 3.60 |
| Total Families | 6,478 (100.0%) | 3.49 |
Median Household Size in Galt
The median household size in Galt is 3.09 persons per household, with single female/mother households (1,178 | 14.5%) accounting for the largest median household size of 3.86 persons per household. non-family households (1,655 | 20.3%) represent the smallest median household size with 1.25 persons per household.
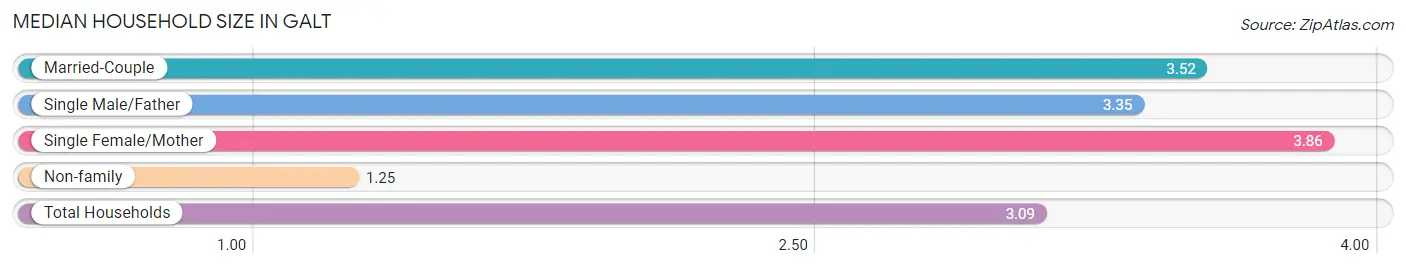
| Household Type | # Households | Household Size |
| Married-Couple | 4,706 (57.9%) | 3.52 |
| Single Male/Father | 594 (7.3%) | 3.35 |
| Single Female/Mother | 1,178 (14.5%) | 3.86 |
| Non-family | 1,655 (20.3%) | 1.25 |
| Total Households | 8,133 (100.0%) | 3.09 |
Household Size by Marriage Status in Galt
Out of a total of 8,133 households in Galt, 6,478 (79.6%) are family households, while 1,655 (20.3%) are nonfamily households. The most numerous type of family households are 2-person households, comprising 1,992, and the most common type of nonfamily households are 1-person households, comprising 1,331.
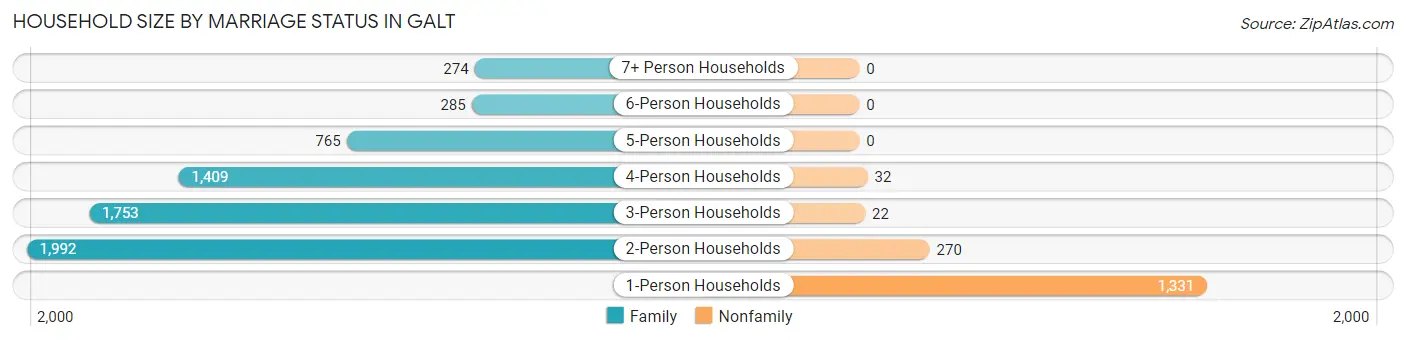
| Household Size | Family Households | Nonfamily Households |
| 1-Person Households | - | 1,331 (16.4%) |
| 2-Person Households | 1,992 (24.5%) | 270 (3.3%) |
| 3-Person Households | 1,753 (21.5%) | 22 (0.3%) |
| 4-Person Households | 1,409 (17.3%) | 32 (0.4%) |
| 5-Person Households | 765 (9.4%) | 0 (0.0%) |
| 6-Person Households | 285 (3.5%) | 0 (0.0%) |
| 7+ Person Households | 274 (3.4%) | 0 (0.0%) |
| Total | 6,478 (79.6%) | 1,655 (20.3%) |
Female Fertility in Galt
Fertility by Age in Galt
Average fertility rate in Galt is 30.0 births per 1,000 women. Women in the age bracket of 20 to 34 years have the highest fertility rate with 55.0 births per 1,000 women. Women in the age bracket of 20 to 34 years acount for 77.5% of all women with births.
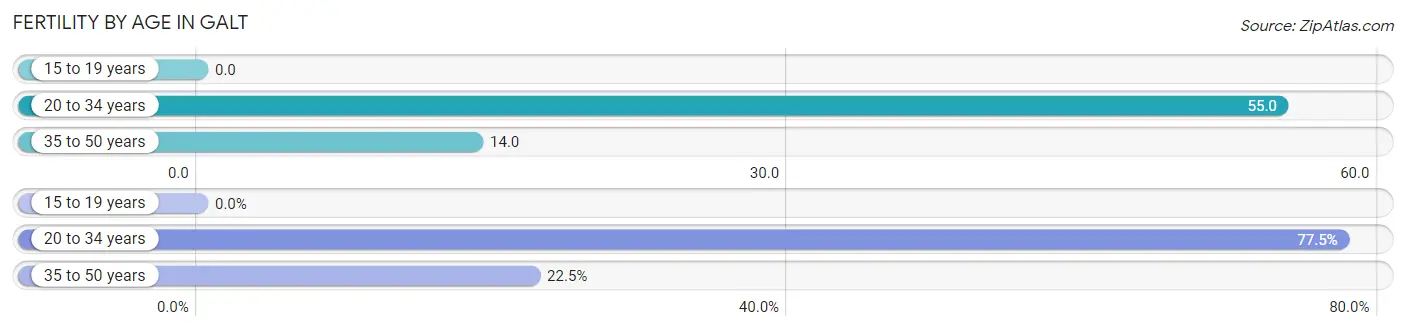
| Age Bracket | Women with Births | Births / 1,000 Women |
| 15 to 19 years | 0 (0.0%) | 0.0 |
| 20 to 34 years | 134 (77.5%) | 55.0 |
| 35 to 50 years | 39 (22.5%) | 14.0 |
| Total | 173 (100.0%) | 30.0 |
Fertility by Age by Marriage Status in Galt
80.3% of women with births (173) in Galt are married. The highest percentage of unmarried women with births falls into 20 to 34 years age bracket with 25.4% of them unmarried at the time of birth, while the lowest percentage of unmarried women with births belong to 35 to 50 years age bracket with 0.0% of them unmarried.
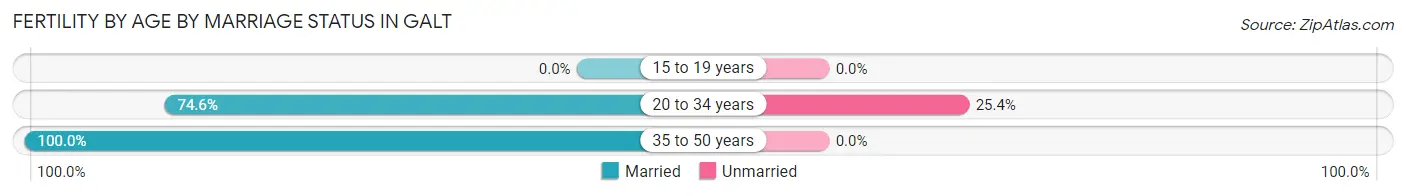
| Age Bracket | Married | Unmarried |
| 15 to 19 years | 0 (0.0%) | 0 (0.0%) |
| 20 to 34 years | 100 (74.6%) | 34 (25.4%) |
| 35 to 50 years | 39 (100.0%) | 0 (0.0%) |
| Total | 139 (80.3%) | 34 (19.7%) |
Fertility by Education in Galt
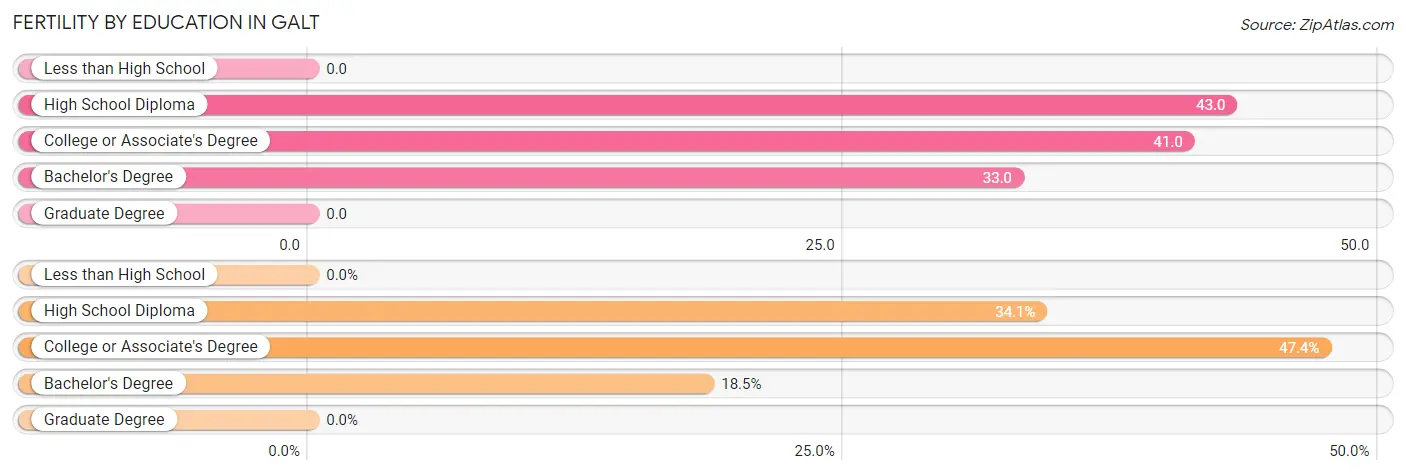
| Educational Attainment | Women with Births | Births / 1,000 Women |
| Less than High School | 0 (0.0%) | 0.0 |
| High School Diploma | 59 (34.1%) | 43.0 |
| College or Associate's Degree | 82 (47.4%) | 41.0 |
| Bachelor's Degree | 32 (18.5%) | 33.0 |
| Graduate Degree | 0 (0.0%) | 0.0 |
| Total | 173 (100.0%) | 30.0 |
Fertility by Education by Marriage Status in Galt
19.7% of women with births in Galt are unmarried. Women with the educational attainment of bachelor's degree are most likely to be married with 100.0% of them married at childbirth, while women with the educational attainment of college or associate's degree are least likely to be married with 24.4% of them unmarried at childbirth.
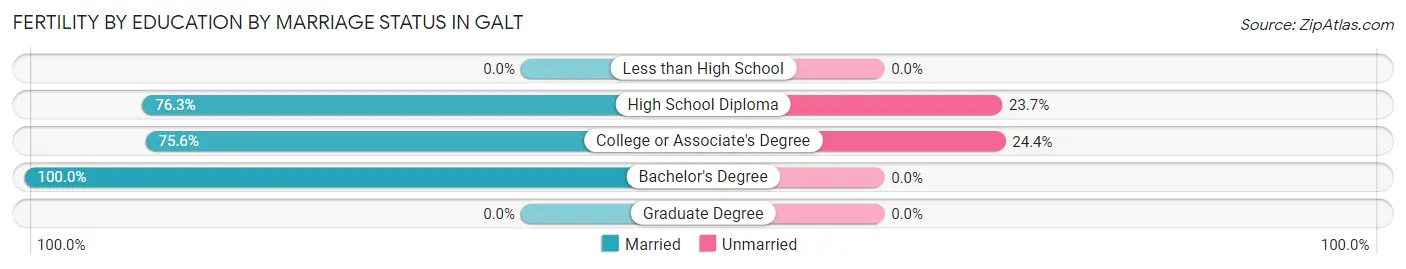
| Educational Attainment | Married | Unmarried |
| Less than High School | 0 (0.0%) | 0 (0.0%) |
| High School Diploma | 45 (76.3%) | 14 (23.7%) |
| College or Associate's Degree | 62 (75.6%) | 20 (24.4%) |
| Bachelor's Degree | 32 (100.0%) | 0 (0.0%) |
| Graduate Degree | 0 (0.0%) | 0 (0.0%) |
| Total | 139 (80.3%) | 34 (19.7%) |
Employment Characteristics in Galt
Employment by Class of Employer in Galt
Among the 11,520 employed individuals in Galt, private company employees (6,385 | 55.4%), state government employees (1,523 | 13.2%), and local government employees (1,443 | 12.5%) make up the most common classes of employment.
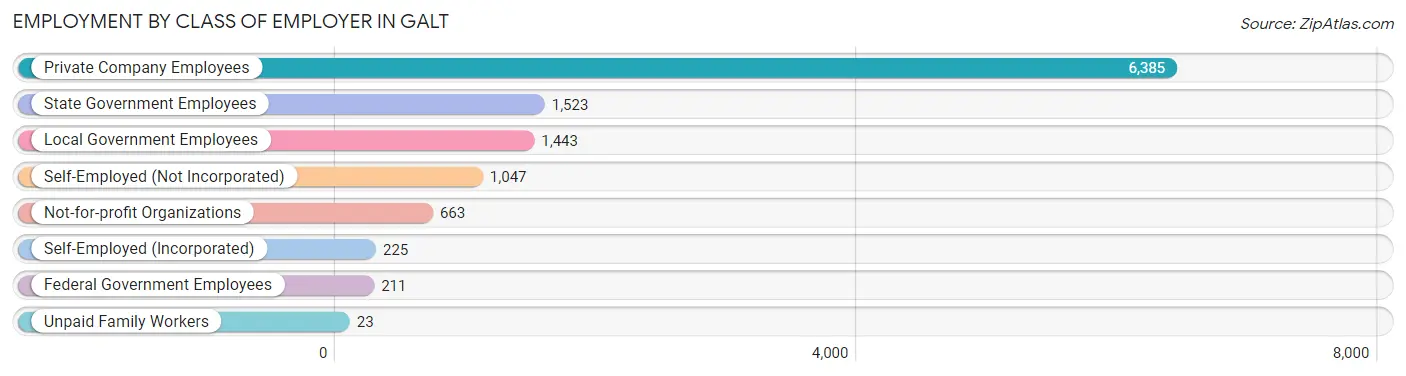
| Employer Class | # Employees | % Employees |
| Private Company Employees | 6,385 | 55.4% |
| Self-Employed (Incorporated) | 225 | 1.9% |
| Self-Employed (Not Incorporated) | 1,047 | 9.1% |
| Not-for-profit Organizations | 663 | 5.8% |
| Local Government Employees | 1,443 | 12.5% |
| State Government Employees | 1,523 | 13.2% |
| Federal Government Employees | 211 | 1.8% |
| Unpaid Family Workers | 23 | 0.2% |
| Total | 11,520 | 100.0% |
Employment Status by Age in Galt
According to the labor force statistics for Galt, out of the total population over 16 years of age (19,921), 64.6% or 12,869 individuals are in the labor force, with 6.0% or 772 of them unemployed. The age group with the highest labor force participation rate is 20 to 24 years, with 85.3% or 1,238 individuals in the labor force. Within the labor force, the 16 to 19 years age range has the highest percentage of unemployed individuals, with 19.7% or 95 of them being unemployed.
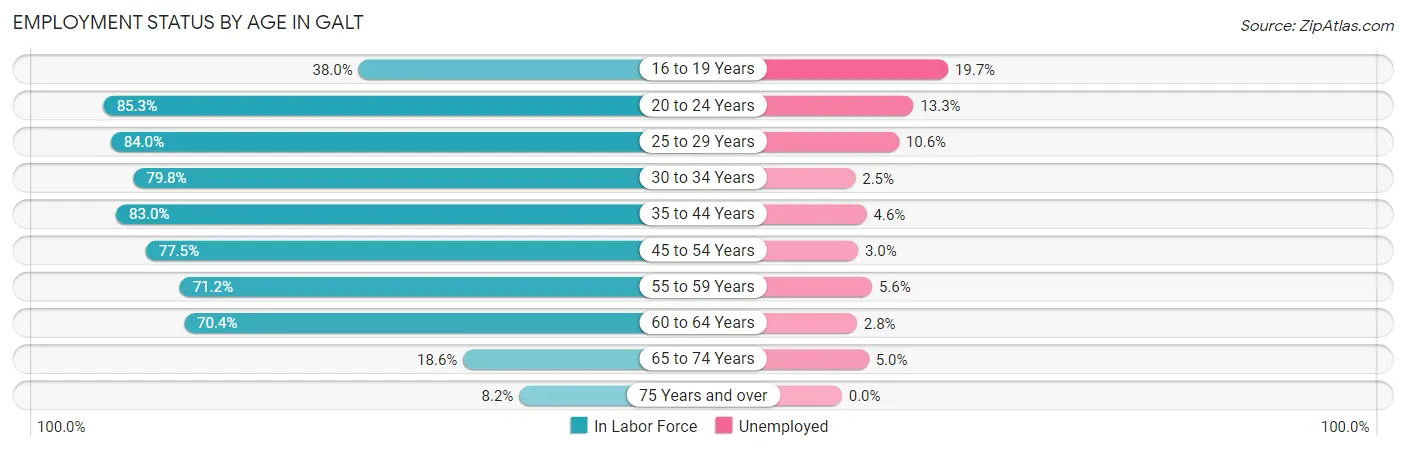
| Age Bracket | In Labor Force | Unemployed |
| 16 to 19 Years | 482 (38.0%) | 95 (19.7%) |
| 20 to 24 Years | 1,238 (85.3%) | 165 (13.3%) |
| 25 to 29 Years | 1,320 (84.0%) | 140 (10.6%) |
| 30 to 34 Years | 1,404 (79.8%) | 35 (2.5%) |
| 35 to 44 Years | 2,883 (83.0%) | 133 (4.6%) |
| 45 to 54 Years | 2,754 (77.5%) | 83 (3.0%) |
| 55 to 59 Years | 1,151 (71.2%) | 64 (5.6%) |
| 60 to 64 Years | 1,088 (70.4%) | 30 (2.8%) |
| 65 to 74 Years | 441 (18.6%) | 22 (5.0%) |
| 75 Years and over | 108 (8.2%) | 0 (0.0%) |
| Total | 12,869 (64.6%) | 772 (6.0%) |
Employment Status by Educational Attainment in Galt
According to labor force statistics for Galt, 78.4% of individuals (10,599) out of the total population between 25 and 64 years of age (13,519) are in the labor force, with 4.6% or 488 of them being unemployed. The group with the highest labor force participation rate are those with the educational attainment of bachelor's degree or higher, with 86.4% or 2,375 individuals in the labor force. Within the labor force, individuals with less than high school education have the highest percentage of unemployment, with 13.8% or 217 of them being unemployed.
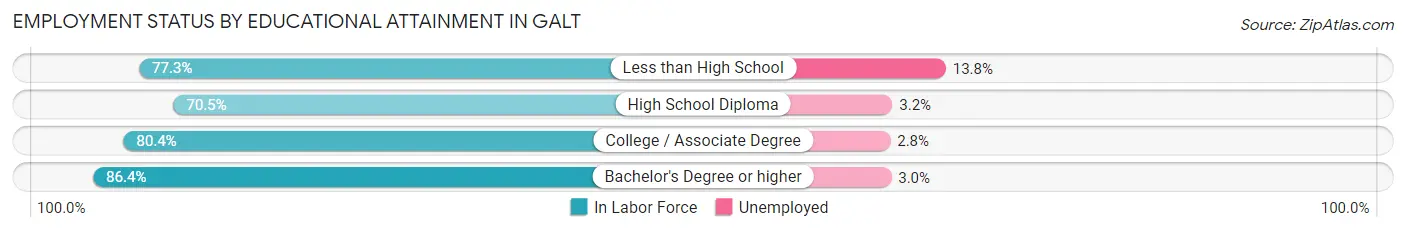
| Educational Attainment | In Labor Force | Unemployed |
| Less than High School | 1,575 (77.3%) | 281 (13.8%) |
| High School Diploma | 2,623 (70.5%) | 119 (3.2%) |
| College / Associate Degree | 4,029 (80.4%) | 140 (2.8%) |
| Bachelor's Degree or higher | 2,375 (86.4%) | 82 (3.0%) |
| Total | 10,599 (78.4%) | 622 (4.6%) |
Employment Occupations by Sex in Galt
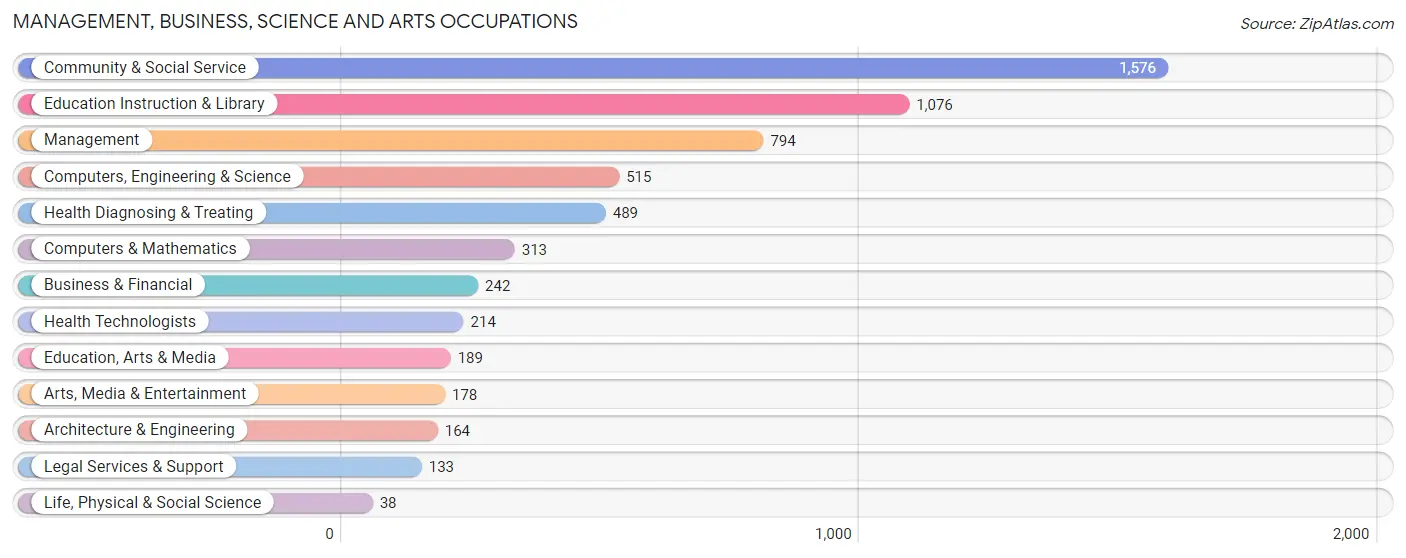
Management, Business, Science and Arts Occupations
The most common Management, Business, Science and Arts occupations in Galt are Community & Social Service (1,576 | 13.0%), Education Instruction & Library (1,076 | 8.9%), Management (794 | 6.6%), Computers, Engineering & Science (515 | 4.3%), and Health Diagnosing & Treating (489 | 4.0%).
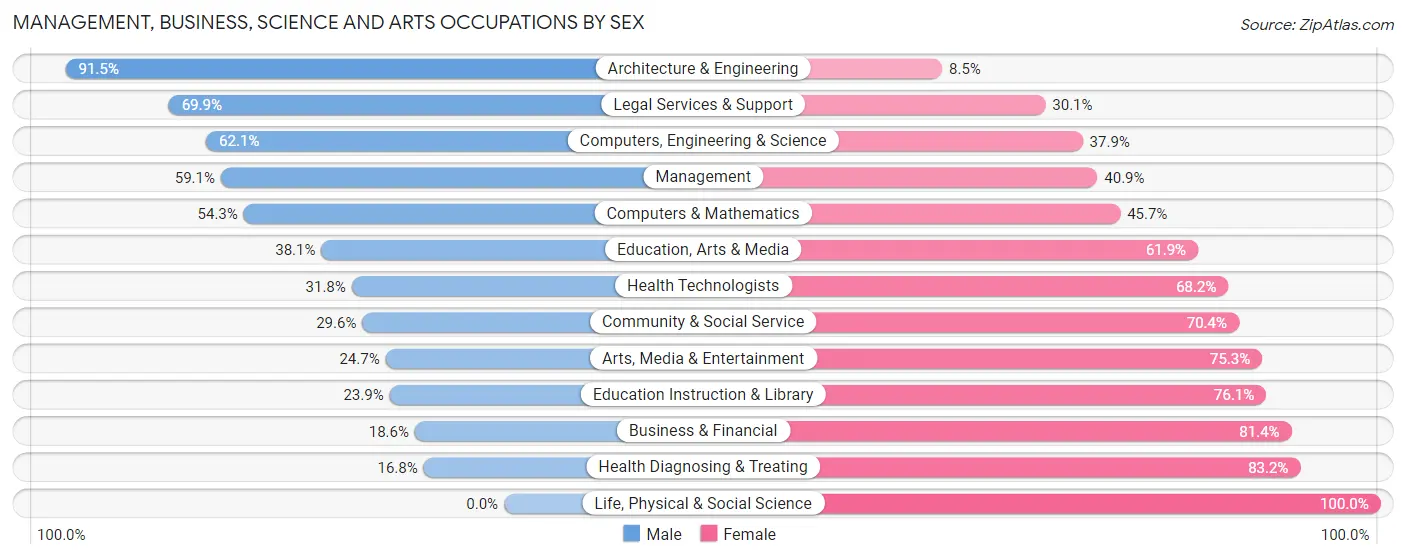
Management, Business, Science and Arts Occupations by Sex
Within the Management, Business, Science and Arts occupations in Galt, the most male-oriented occupations are Architecture & Engineering (91.5%), Legal Services & Support (69.9%), and Computers, Engineering & Science (62.1%), while the most female-oriented occupations are Life, Physical & Social Science (100.0%), Health Diagnosing & Treating (83.2%), and Business & Financial (81.4%).
| Occupation | Male | Female |
| Management | 469 (59.1%) | 325 (40.9%) |
| Business & Financial | 45 (18.6%) | 197 (81.4%) |
| Computers, Engineering & Science | 320 (62.1%) | 195 (37.9%) |
| Computers & Mathematics | 170 (54.3%) | 143 (45.7%) |
| Architecture & Engineering | 150 (91.5%) | 14 (8.5%) |
| Life, Physical & Social Science | 0 (0.0%) | 38 (100.0%) |
| Community & Social Service | 466 (29.6%) | 1,110 (70.4%) |
| Education, Arts & Media | 72 (38.1%) | 117 (61.9%) |
| Legal Services & Support | 93 (69.9%) | 40 (30.1%) |
| Education Instruction & Library | 257 (23.9%) | 819 (76.1%) |
| Arts, Media & Entertainment | 44 (24.7%) | 134 (75.3%) |
| Health Diagnosing & Treating | 82 (16.8%) | 407 (83.2%) |
| Health Technologists | 68 (31.8%) | 146 (68.2%) |
| Total (Category) | 1,382 (38.2%) | 2,234 (61.8%) |
| Total (Overall) | 6,726 (55.6%) | 5,376 (44.4%) |
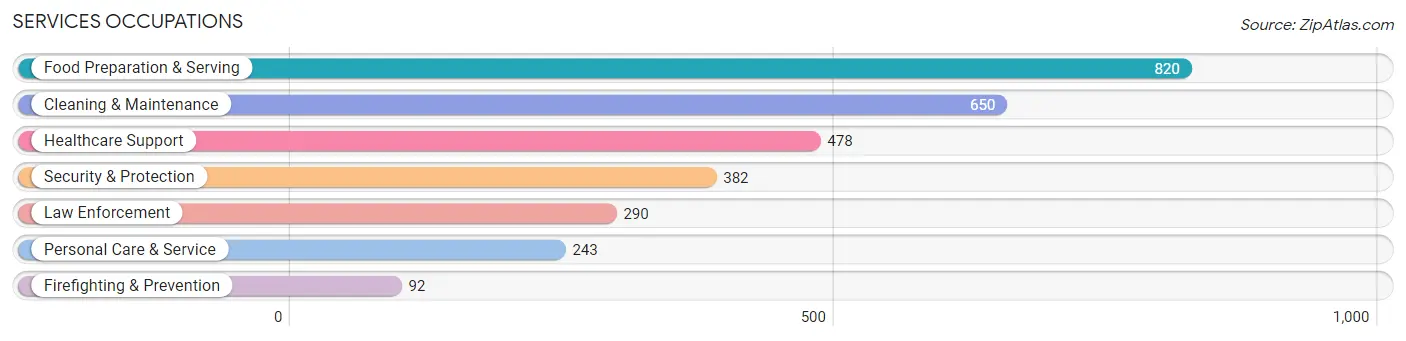
Services Occupations
The most common Services occupations in Galt are Food Preparation & Serving (820 | 6.8%), Cleaning & Maintenance (650 | 5.4%), Healthcare Support (478 | 4.0%), Security & Protection (382 | 3.2%), and Law Enforcement (290 | 2.4%).
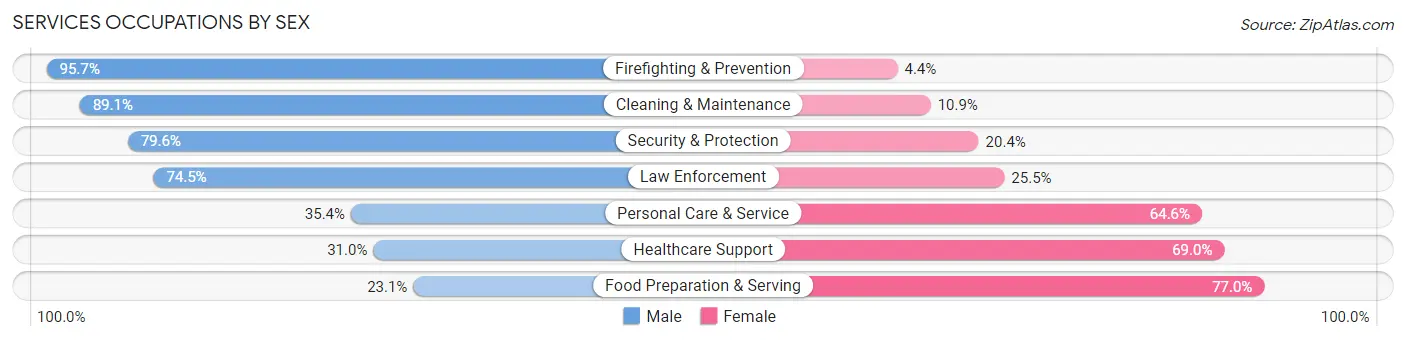
Services Occupations by Sex
Within the Services occupations in Galt, the most male-oriented occupations are Firefighting & Prevention (95.7%), Cleaning & Maintenance (89.1%), and Security & Protection (79.6%), while the most female-oriented occupations are Food Preparation & Serving (76.9%), Healthcare Support (69.0%), and Personal Care & Service (64.6%).
| Occupation | Male | Female |
| Healthcare Support | 148 (31.0%) | 330 (69.0%) |
| Security & Protection | 304 (79.6%) | 78 (20.4%) |
| Firefighting & Prevention | 88 (95.7%) | 4 (4.3%) |
| Law Enforcement | 216 (74.5%) | 74 (25.5%) |
| Food Preparation & Serving | 189 (23.1%) | 631 (76.9%) |
| Cleaning & Maintenance | 579 (89.1%) | 71 (10.9%) |
| Personal Care & Service | 86 (35.4%) | 157 (64.6%) |
| Total (Category) | 1,306 (50.8%) | 1,267 (49.2%) |
| Total (Overall) | 6,726 (55.6%) | 5,376 (44.4%) |
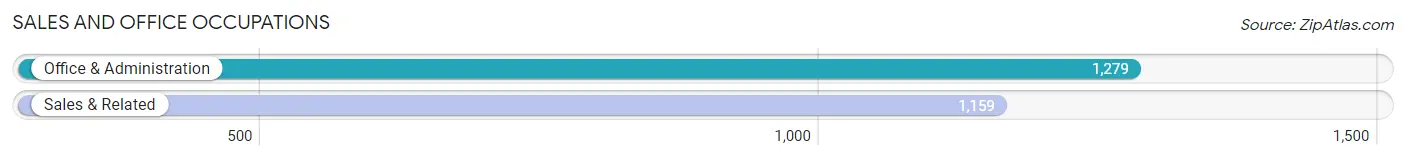
Sales and Office Occupations
The most common Sales and Office occupations in Galt are Office & Administration (1,279 | 10.6%), and Sales & Related (1,159 | 9.6%).
Sales and Office Occupations by Sex
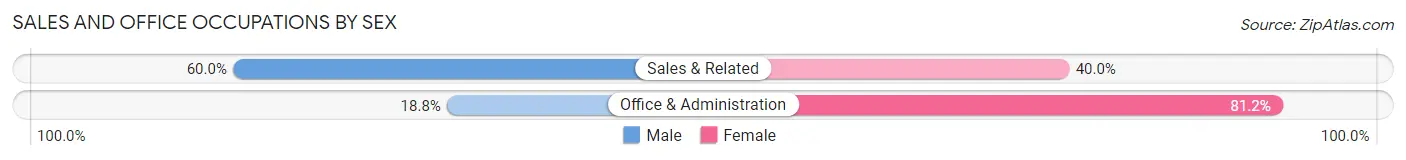
| Occupation | Male | Female |
| Sales & Related | 695 (60.0%) | 464 (40.0%) |
| Office & Administration | 241 (18.8%) | 1,038 (81.2%) |
| Total (Category) | 936 (38.4%) | 1,502 (61.6%) |
| Total (Overall) | 6,726 (55.6%) | 5,376 (44.4%) |
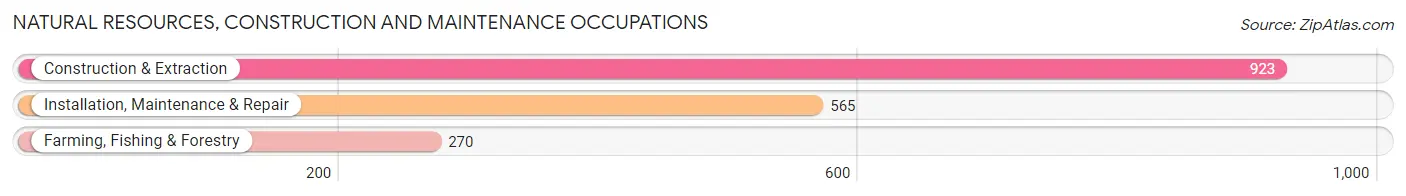
Natural Resources, Construction and Maintenance Occupations
The most common Natural Resources, Construction and Maintenance occupations in Galt are Construction & Extraction (923 | 7.6%), Installation, Maintenance & Repair (565 | 4.7%), and Farming, Fishing & Forestry (270 | 2.2%).
Natural Resources, Construction and Maintenance Occupations by Sex
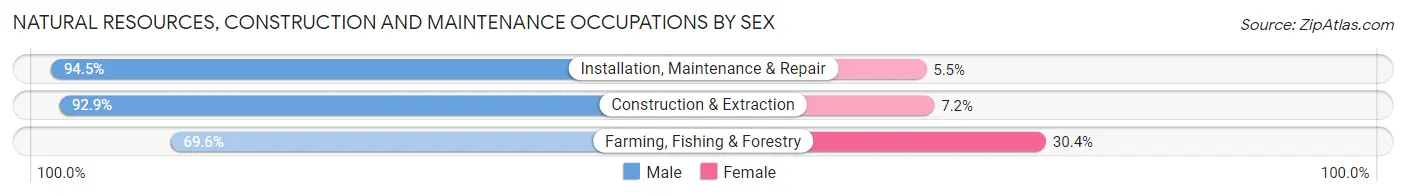
| Occupation | Male | Female |
| Farming, Fishing & Forestry | 188 (69.6%) | 82 (30.4%) |
| Construction & Extraction | 857 (92.8%) | 66 (7.1%) |
| Installation, Maintenance & Repair | 534 (94.5%) | 31 (5.5%) |
| Total (Category) | 1,579 (89.8%) | 179 (10.2%) |
| Total (Overall) | 6,726 (55.6%) | 5,376 (44.4%) |
Production, Transportation and Moving Occupations
The most common Production, Transportation and Moving occupations in Galt are Material Moving (697 | 5.8%), Production (576 | 4.8%), and Transportation (444 | 3.7%).
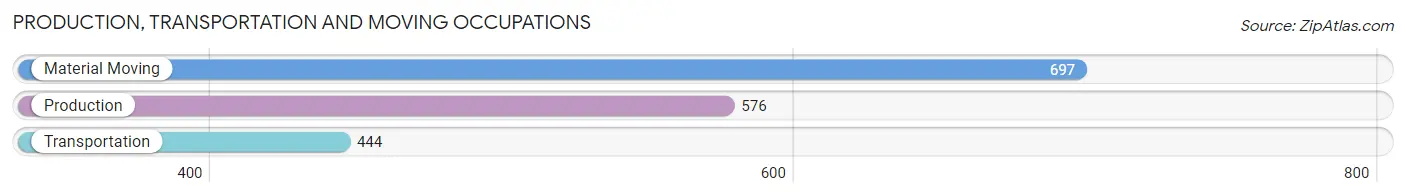
Production, Transportation and Moving Occupations by Sex
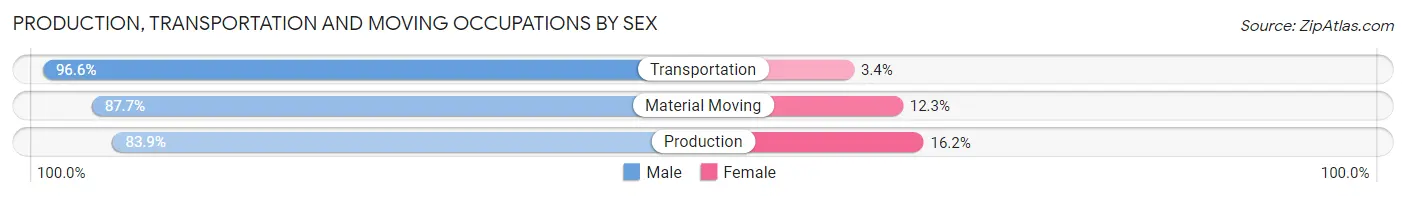
| Occupation | Male | Female |
| Production | 483 (83.9%) | 93 (16.2%) |
| Transportation | 429 (96.6%) | 15 (3.4%) |
| Material Moving | 611 (87.7%) | 86 (12.3%) |
| Total (Category) | 1,523 (88.7%) | 194 (11.3%) |
| Total (Overall) | 6,726 (55.6%) | 5,376 (44.4%) |
Employment Industries by Sex in Galt
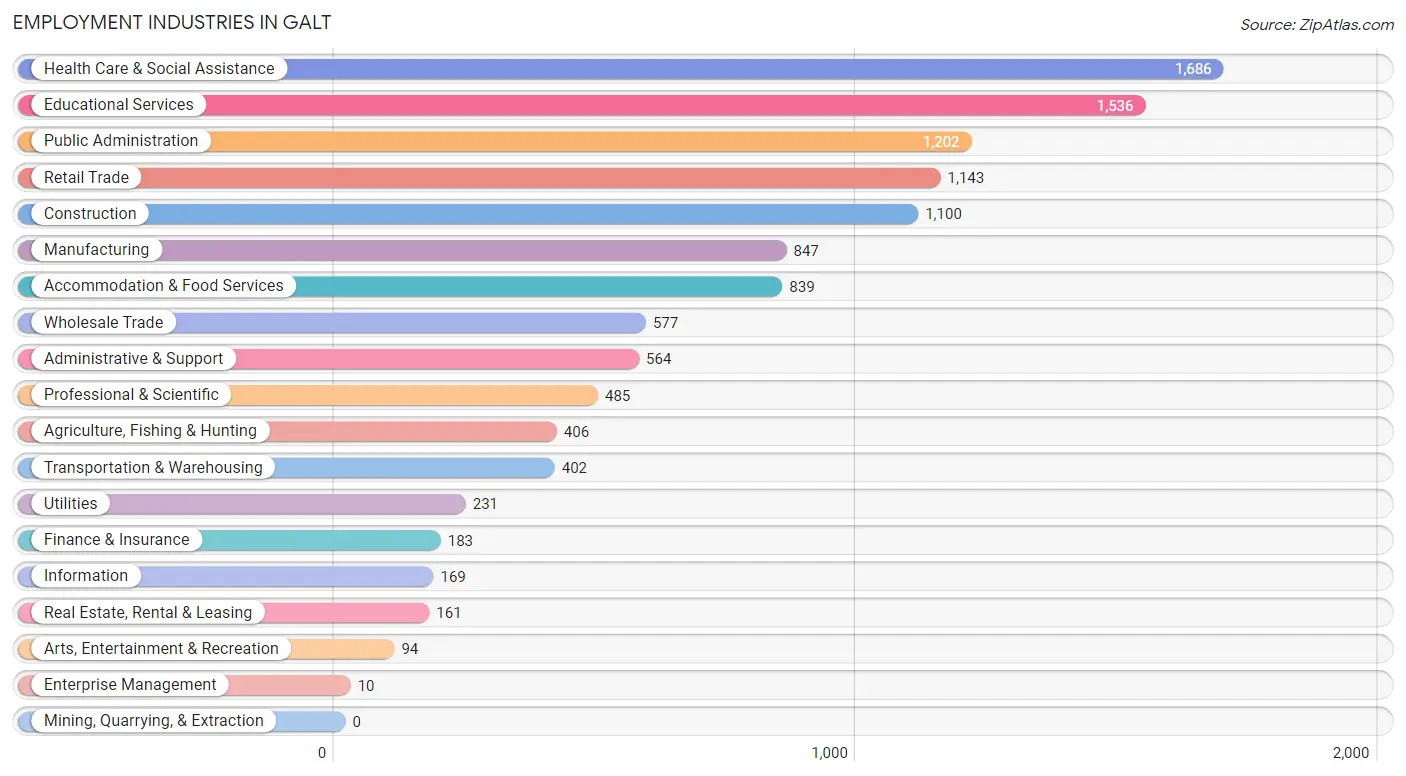
Employment Industries in Galt
The major employment industries in Galt include Health Care & Social Assistance (1,686 | 13.9%), Educational Services (1,536 | 12.7%), Public Administration (1,202 | 9.9%), Retail Trade (1,143 | 9.4%), and Construction (1,100 | 9.1%).
Employment Industries by Sex in Galt
The Galt industries that see more men than women are Enterprise Management (100.0%), Utilities (89.2%), and Construction (88.2%), whereas the industries that tend to have a higher number of women are Health Care & Social Assistance (76.0%), Finance & Insurance (74.3%), and Educational Services (69.5%).
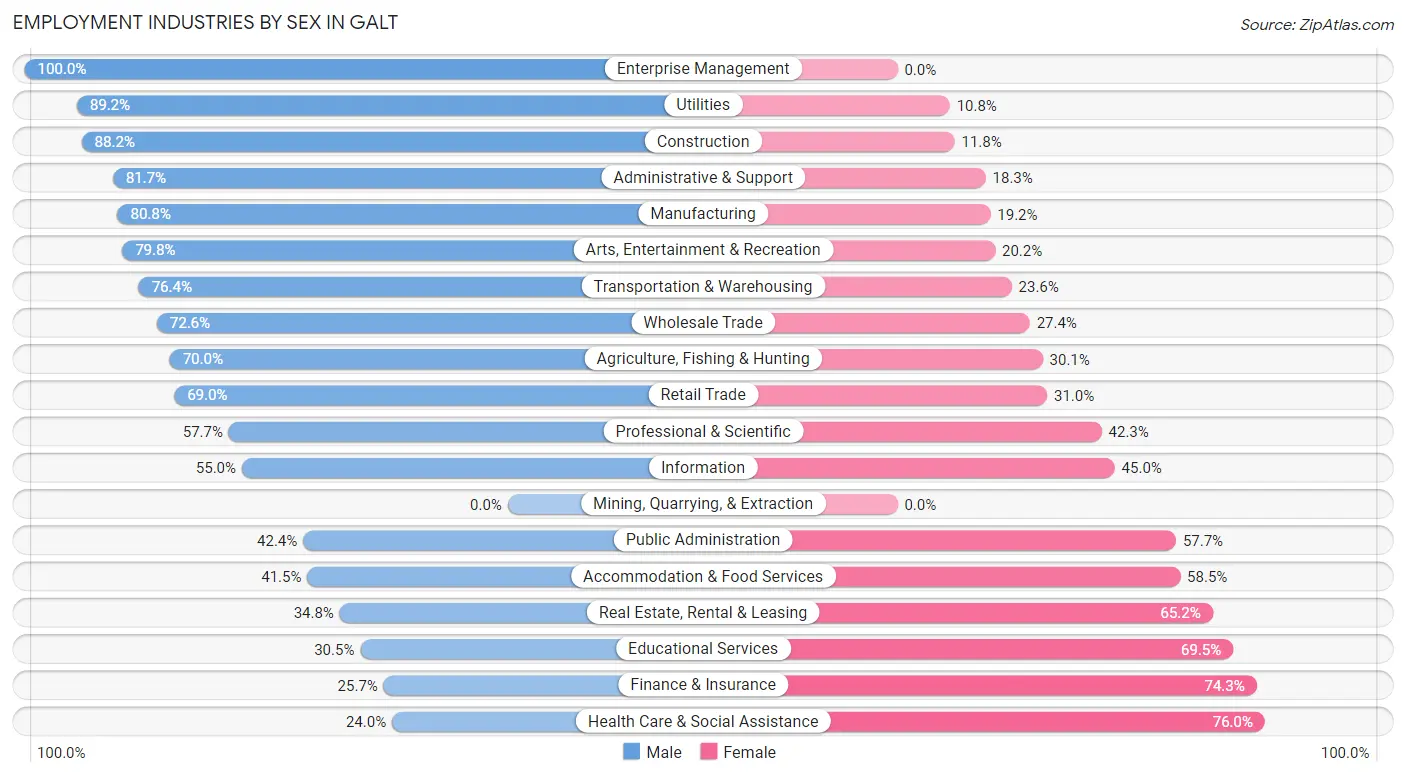
| Industry | Male | Female |
| Agriculture, Fishing & Hunting | 284 (70.0%) | 122 (30.0%) |
| Mining, Quarrying, & Extraction | 0 (0.0%) | 0 (0.0%) |
| Construction | 970 (88.2%) | 130 (11.8%) |
| Manufacturing | 684 (80.8%) | 163 (19.2%) |
| Wholesale Trade | 419 (72.6%) | 158 (27.4%) |
| Retail Trade | 789 (69.0%) | 354 (31.0%) |
| Transportation & Warehousing | 307 (76.4%) | 95 (23.6%) |
| Utilities | 206 (89.2%) | 25 (10.8%) |
| Information | 93 (55.0%) | 76 (45.0%) |
| Finance & Insurance | 47 (25.7%) | 136 (74.3%) |
| Real Estate, Rental & Leasing | 56 (34.8%) | 105 (65.2%) |
| Professional & Scientific | 280 (57.7%) | 205 (42.3%) |
| Enterprise Management | 10 (100.0%) | 0 (0.0%) |
| Administrative & Support | 461 (81.7%) | 103 (18.3%) |
| Educational Services | 469 (30.5%) | 1,067 (69.5%) |
| Health Care & Social Assistance | 404 (24.0%) | 1,282 (76.0%) |
| Arts, Entertainment & Recreation | 75 (79.8%) | 19 (20.2%) |
| Accommodation & Food Services | 348 (41.5%) | 491 (58.5%) |
| Public Administration | 509 (42.3%) | 693 (57.7%) |
| Total | 6,726 (55.6%) | 5,376 (44.4%) |
Education in Galt
School Enrollment in Galt
The most common levels of schooling among the 6,462 students in Galt are middle school (1,662 | 25.7%), high school (1,433 | 22.2%), and college / undergraduate (1,175 | 18.2%).
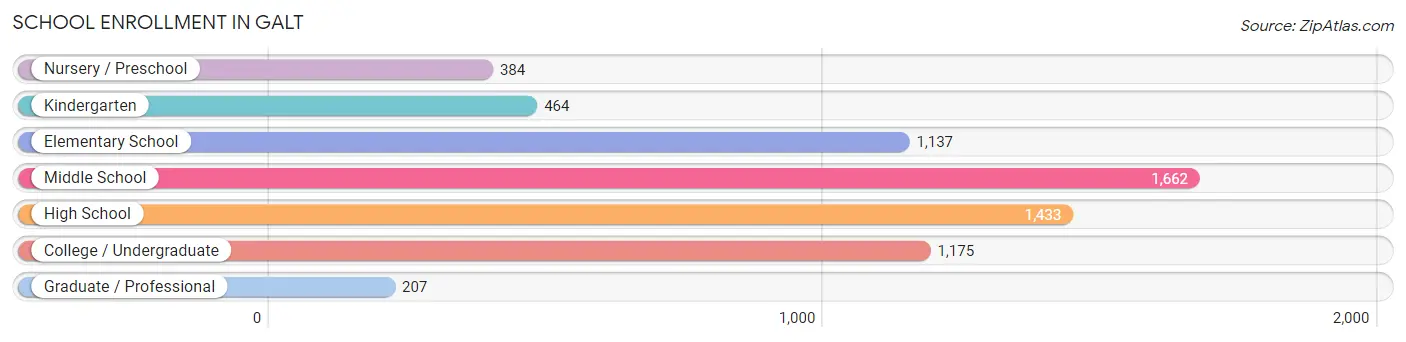
| School Level | # Students | % Students |
| Nursery / Preschool | 384 | 5.9% |
| Kindergarten | 464 | 7.2% |
| Elementary School | 1,137 | 17.6% |
| Middle School | 1,662 | 25.7% |
| High School | 1,433 | 22.2% |
| College / Undergraduate | 1,175 | 18.2% |
| Graduate / Professional | 207 | 3.2% |
| Total | 6,462 | 100.0% |
School Enrollment by Age by Funding Source in Galt
Out of a total of 6,462 students who are enrolled in schools in Galt, 517 (8.0%) attend a private institution, while the remaining 5,945 (92.0%) are enrolled in public schools. The age group of 25 to 34 year olds has the highest likelihood of being enrolled in private schools, with 65 (23.7% in the age bracket) enrolled. Conversely, the age group of 20 to 24 year olds has the lowest likelihood of being enrolled in a private school, with 656 (97.8% in the age bracket) attending a public institution.
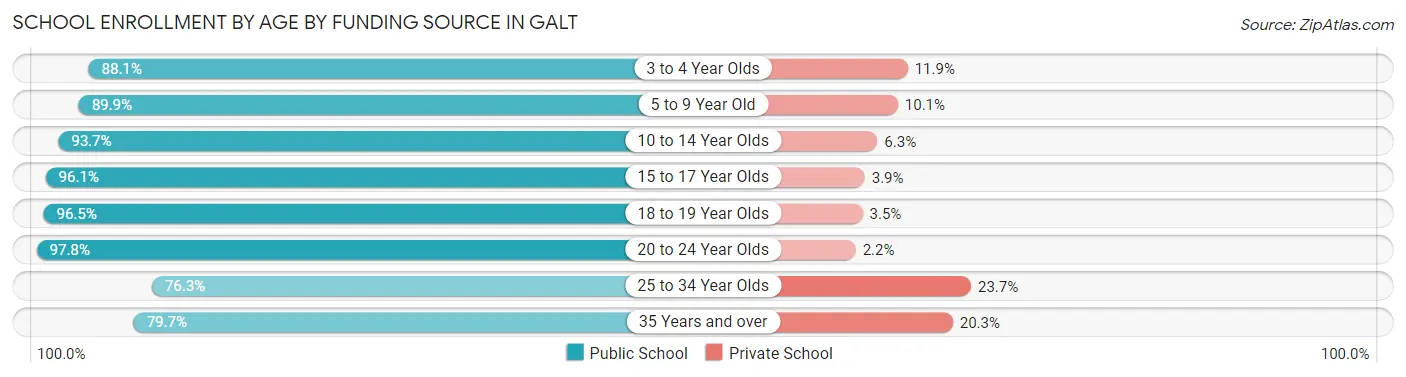
| Age Bracket | Public School | Private School |
| 3 to 4 Year Olds | 214 (88.1%) | 29 (11.9%) |
| 5 to 9 Year Old | 1,524 (89.9%) | 171 (10.1%) |
| 10 to 14 Year Olds | 1,851 (93.7%) | 124 (6.3%) |
| 15 to 17 Year Olds | 953 (96.1%) | 39 (3.9%) |
| 18 to 19 Year Olds | 301 (96.5%) | 11 (3.5%) |
| 20 to 24 Year Olds | 656 (97.8%) | 15 (2.2%) |
| 25 to 34 Year Olds | 209 (76.3%) | 65 (23.7%) |
| 35 Years and over | 239 (79.7%) | 61 (20.3%) |
| Total | 5,945 (92.0%) | 517 (8.0%) |
Educational Attainment by Field of Study in Galt
Science & technology (493 | 13.7%), business (450 | 12.5%), arts & humanities (438 | 12.2%), bio, nature & agricultural (361 | 10.0%), and education (330 | 9.2%) are the most common fields of study among 3,601 individuals in Galt who have obtained a bachelor's degree or higher.
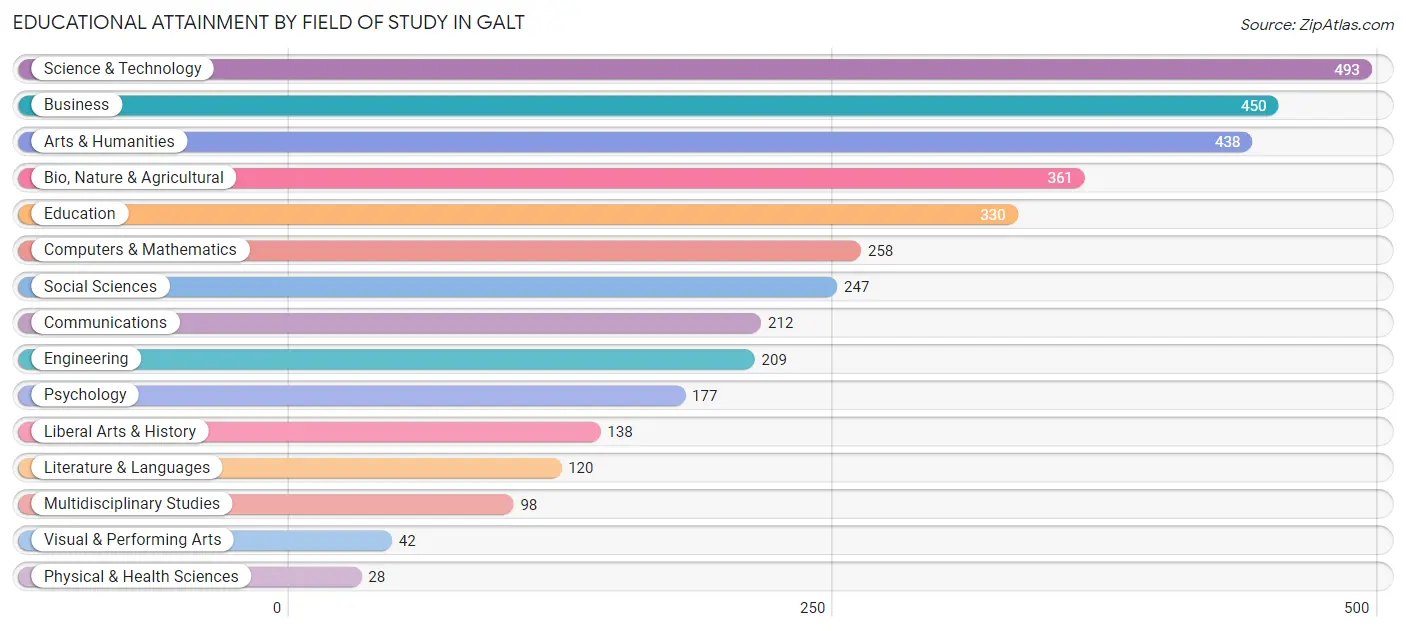
| Field of Study | # Graduates | % Graduates |
| Computers & Mathematics | 258 | 7.2% |
| Bio, Nature & Agricultural | 361 | 10.0% |
| Physical & Health Sciences | 28 | 0.8% |
| Psychology | 177 | 4.9% |
| Social Sciences | 247 | 6.9% |
| Engineering | 209 | 5.8% |
| Multidisciplinary Studies | 98 | 2.7% |
| Science & Technology | 493 | 13.7% |
| Business | 450 | 12.5% |
| Education | 330 | 9.2% |
| Literature & Languages | 120 | 3.3% |
| Liberal Arts & History | 138 | 3.8% |
| Visual & Performing Arts | 42 | 1.2% |
| Communications | 212 | 5.9% |
| Arts & Humanities | 438 | 12.2% |
| Total | 3,601 | 100.0% |
Transportation & Commute in Galt
Vehicle Availability by Sex in Galt
The most prevalent vehicle ownership categories in Galt are males with 3 vehicles (2,189, accounting for 34.7%) and females with 3 vehicles (1,939, making up 42.1%).
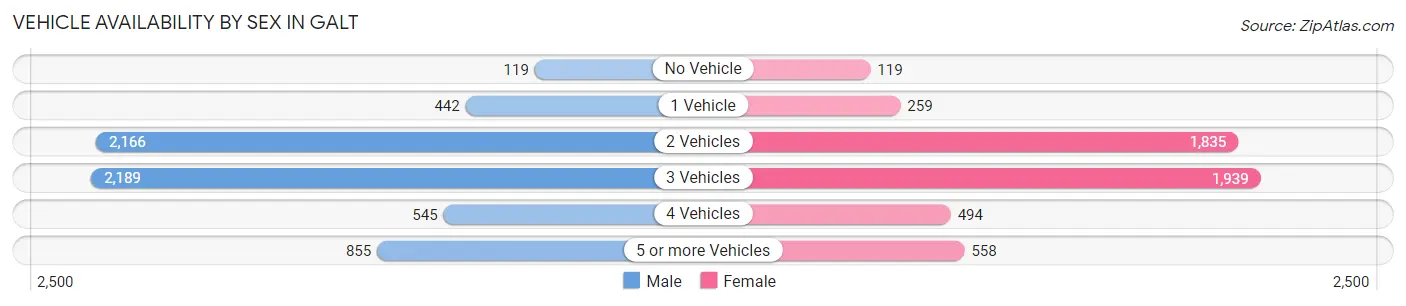
| Vehicles Available | Male | Female |
| No Vehicle | 119 (1.9%) | 119 (2.3%) |
| 1 Vehicle | 442 (7.0%) | 259 (5.0%) |
| 2 Vehicles | 2,166 (34.3%) | 1,835 (35.3%) |
| 3 Vehicles | 2,189 (34.7%) | 1,939 (37.3%) |
| 4 Vehicles | 545 (8.6%) | 494 (9.5%) |
| 5 or more Vehicles | 855 (13.5%) | 558 (10.7%) |
| Total | 6,316 (100.0%) | 5,204 (100.0%) |
Commute Time in Galt
The most frequently occuring commute durations in Galt are 30 to 34 minutes (1,681 commuters, 16.1%), 20 to 24 minutes (1,507 commuters, 14.4%), and 45 to 59 minutes (1,125 commuters, 10.7%).
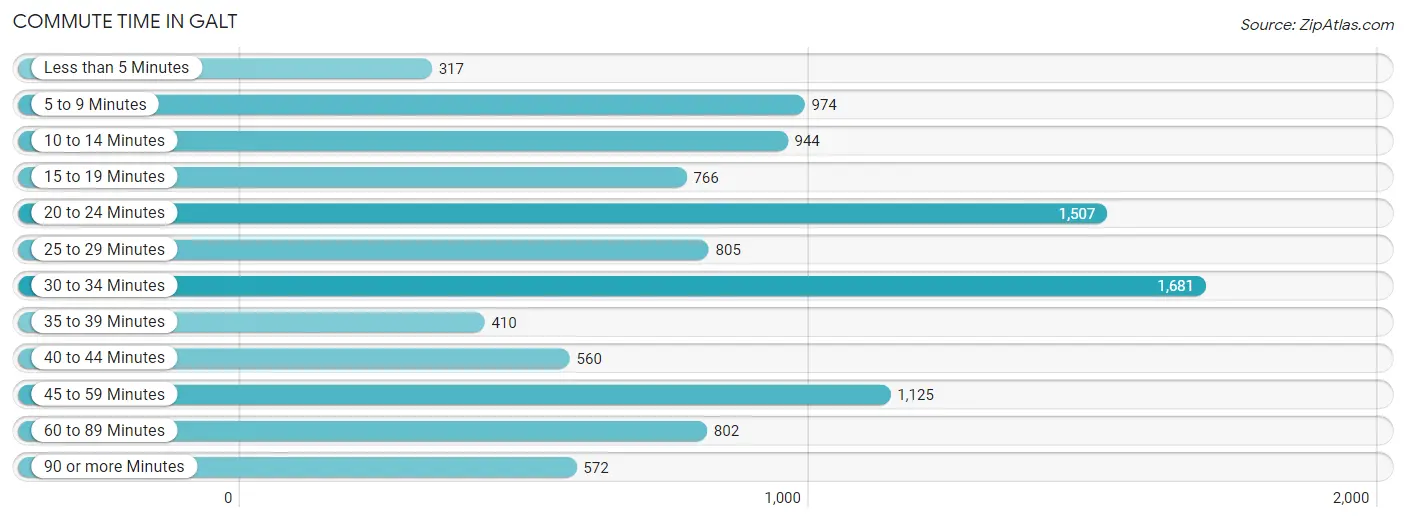
| Commute Time | # Commuters | % Commuters |
| Less than 5 Minutes | 317 | 3.0% |
| 5 to 9 Minutes | 974 | 9.3% |
| 10 to 14 Minutes | 944 | 9.0% |
| 15 to 19 Minutes | 766 | 7.3% |
| 20 to 24 Minutes | 1,507 | 14.4% |
| 25 to 29 Minutes | 805 | 7.7% |
| 30 to 34 Minutes | 1,681 | 16.1% |
| 35 to 39 Minutes | 410 | 3.9% |
| 40 to 44 Minutes | 560 | 5.3% |
| 45 to 59 Minutes | 1,125 | 10.7% |
| 60 to 89 Minutes | 802 | 7.7% |
| 90 or more Minutes | 572 | 5.5% |
Commute Time by Sex in Galt
The most common commute times in Galt are 20 to 24 minutes (960 commuters, 16.5%) for males and 30 to 34 minutes (852 commuters, 18.4%) for females.
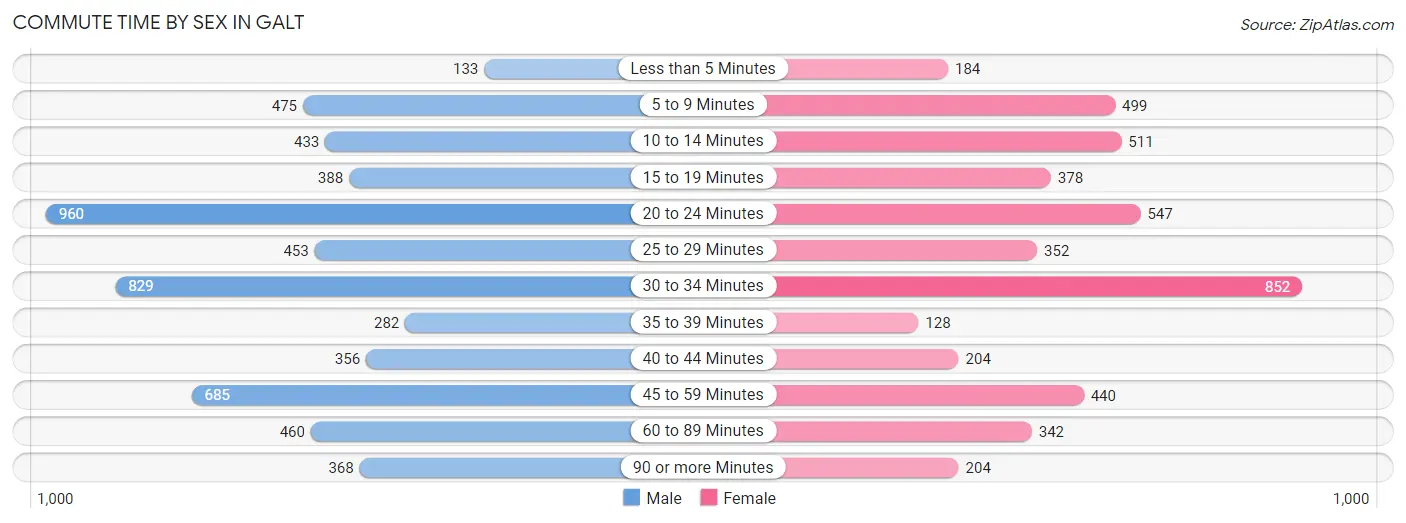
| Commute Time | Male | Female |
| Less than 5 Minutes | 133 (2.3%) | 184 (4.0%) |
| 5 to 9 Minutes | 475 (8.2%) | 499 (10.7%) |
| 10 to 14 Minutes | 433 (7.4%) | 511 (11.0%) |
| 15 to 19 Minutes | 388 (6.7%) | 378 (8.1%) |
| 20 to 24 Minutes | 960 (16.5%) | 547 (11.8%) |
| 25 to 29 Minutes | 453 (7.8%) | 352 (7.6%) |
| 30 to 34 Minutes | 829 (14.2%) | 852 (18.4%) |
| 35 to 39 Minutes | 282 (4.8%) | 128 (2.8%) |
| 40 to 44 Minutes | 356 (6.1%) | 204 (4.4%) |
| 45 to 59 Minutes | 685 (11.8%) | 440 (9.5%) |
| 60 to 89 Minutes | 460 (7.9%) | 342 (7.4%) |
| 90 or more Minutes | 368 (6.3%) | 204 (4.4%) |
Time of Departure to Work by Sex in Galt
The most frequent times of departure to work in Galt are 6:00 AM to 6:29 AM (945, 16.2%) for males and 7:30 AM to 7:59 AM (885, 19.1%) for females.
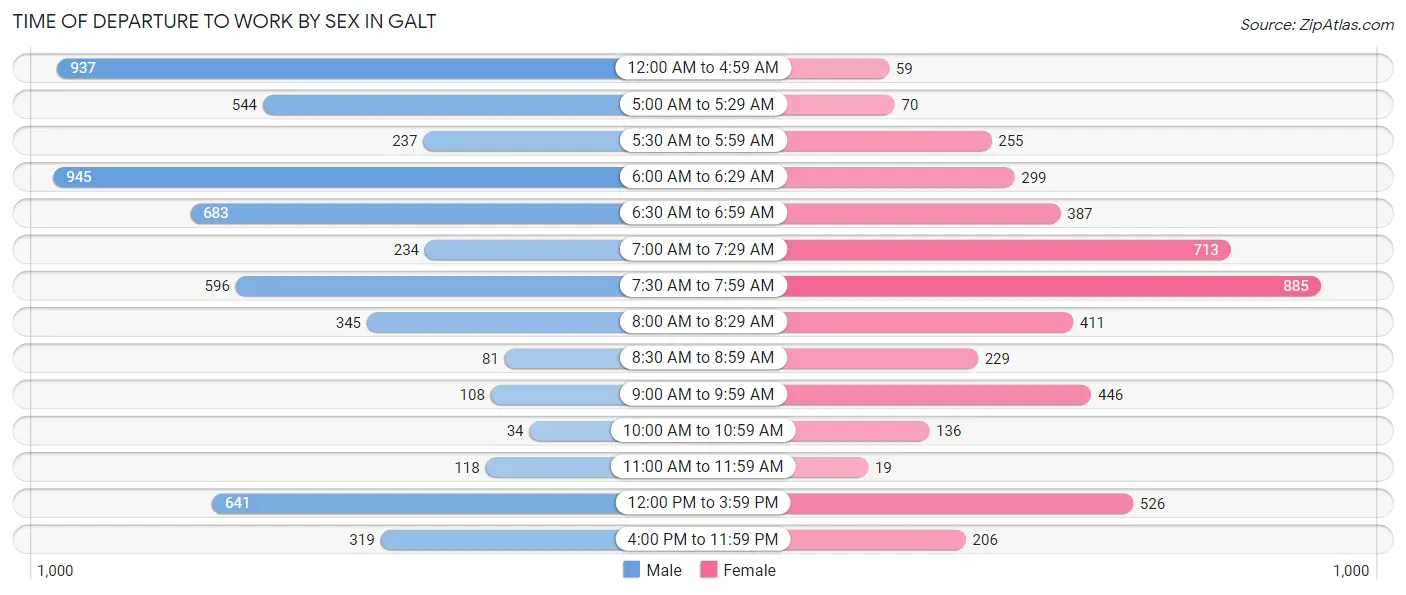
| Time of Departure | Male | Female |
| 12:00 AM to 4:59 AM | 937 (16.1%) | 59 (1.3%) |
| 5:00 AM to 5:29 AM | 544 (9.3%) | 70 (1.5%) |
| 5:30 AM to 5:59 AM | 237 (4.1%) | 255 (5.5%) |
| 6:00 AM to 6:29 AM | 945 (16.2%) | 299 (6.4%) |
| 6:30 AM to 6:59 AM | 683 (11.7%) | 387 (8.3%) |
| 7:00 AM to 7:29 AM | 234 (4.0%) | 713 (15.4%) |
| 7:30 AM to 7:59 AM | 596 (10.2%) | 885 (19.1%) |
| 8:00 AM to 8:29 AM | 345 (5.9%) | 411 (8.9%) |
| 8:30 AM to 8:59 AM | 81 (1.4%) | 229 (4.9%) |
| 9:00 AM to 9:59 AM | 108 (1.9%) | 446 (9.6%) |
| 10:00 AM to 10:59 AM | 34 (0.6%) | 136 (2.9%) |
| 11:00 AM to 11:59 AM | 118 (2.0%) | 19 (0.4%) |
| 12:00 PM to 3:59 PM | 641 (11.0%) | 526 (11.3%) |
| 4:00 PM to 11:59 PM | 319 (5.5%) | 206 (4.4%) |
| Total | 5,822 (100.0%) | 4,641 (100.0%) |
Housing Occupancy in Galt
Occupancy by Ownership in Galt
Of the total 8,133 dwellings in Galt, owner-occupied units account for 6,152 (75.6%), while renter-occupied units make up 1,981 (24.4%).
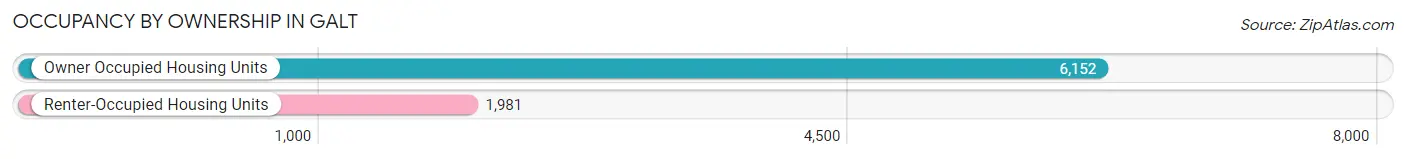
| Occupancy | # Housing Units | % Housing Units |
| Owner Occupied Housing Units | 6,152 | 75.6% |
| Renter-Occupied Housing Units | 1,981 | 24.4% |
| Total Occupied Housing Units | 8,133 | 100.0% |
Occupancy by Household Size in Galt
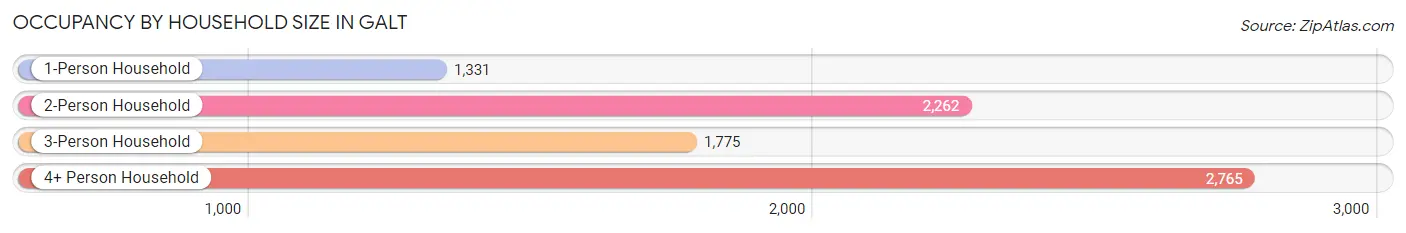
| Household Size | # Housing Units | % Housing Units |
| 1-Person Household | 1,331 | 16.4% |
| 2-Person Household | 2,262 | 27.8% |
| 3-Person Household | 1,775 | 21.8% |
| 4+ Person Household | 2,765 | 34.0% |
| Total Housing Units | 8,133 | 100.0% |
Occupancy by Ownership by Household Size in Galt
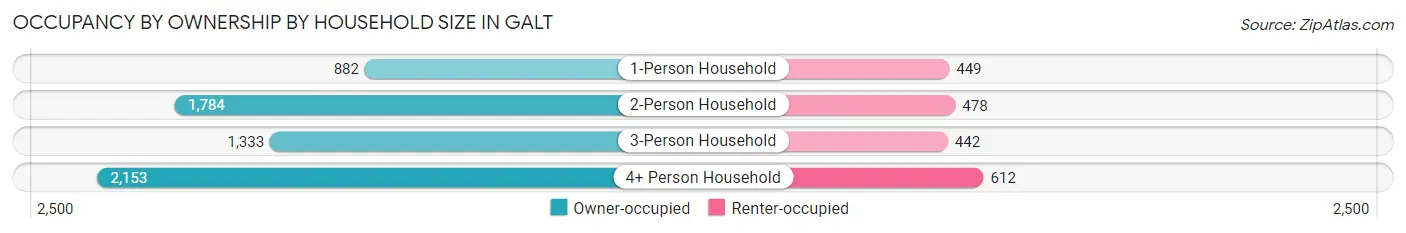
| Household Size | Owner-occupied | Renter-occupied |
| 1-Person Household | 882 (66.3%) | 449 (33.7%) |
| 2-Person Household | 1,784 (78.9%) | 478 (21.1%) |
| 3-Person Household | 1,333 (75.1%) | 442 (24.9%) |
| 4+ Person Household | 2,153 (77.9%) | 612 (22.1%) |
| Total Housing Units | 6,152 (75.6%) | 1,981 (24.4%) |
Occupancy by Educational Attainment in Galt
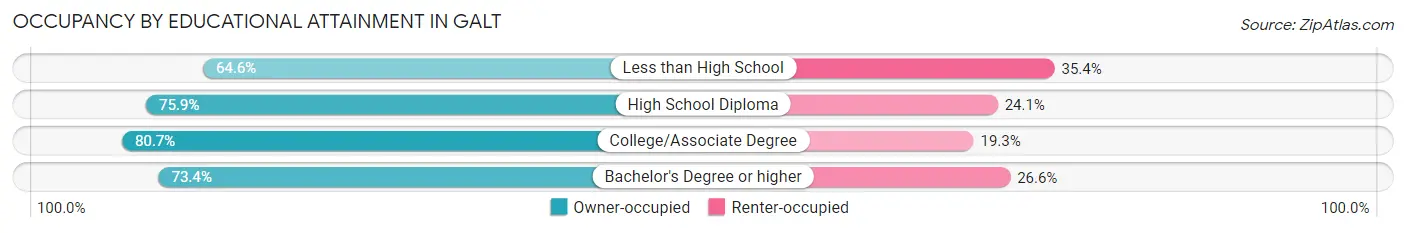
| Household Size | Owner-occupied | Renter-occupied |
| Less than High School | 718 (64.6%) | 393 (35.4%) |
| High School Diploma | 1,506 (75.9%) | 478 (24.1%) |
| College/Associate Degree | 2,541 (80.7%) | 608 (19.3%) |
| Bachelor's Degree or higher | 1,387 (73.4%) | 502 (26.6%) |
Occupancy by Age of Householder in Galt
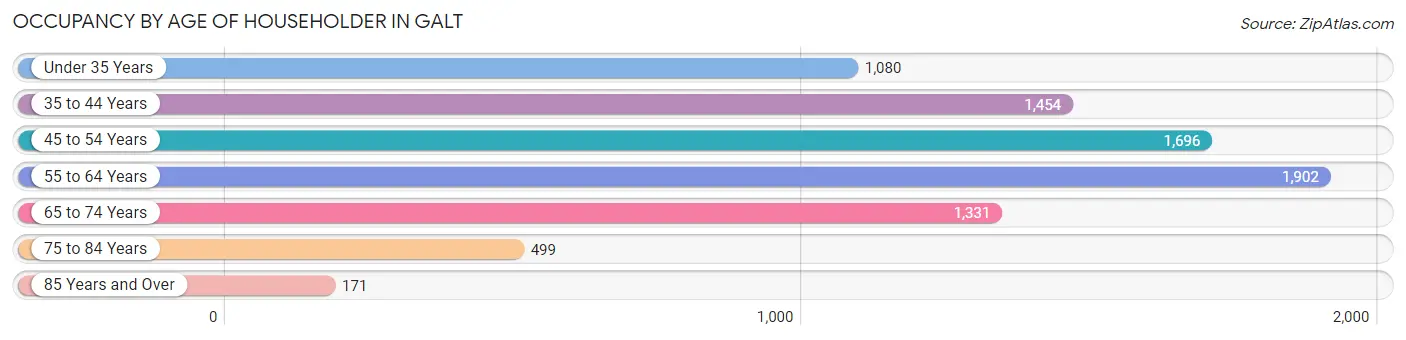
| Age Bracket | # Households | % Households |
| Under 35 Years | 1,080 | 13.3% |
| 35 to 44 Years | 1,454 | 17.9% |
| 45 to 54 Years | 1,696 | 20.8% |
| 55 to 64 Years | 1,902 | 23.4% |
| 65 to 74 Years | 1,331 | 16.4% |
| 75 to 84 Years | 499 | 6.1% |
| 85 Years and Over | 171 | 2.1% |
| Total | 8,133 | 100.0% |
Housing Finances in Galt
Median Income by Occupancy in Galt
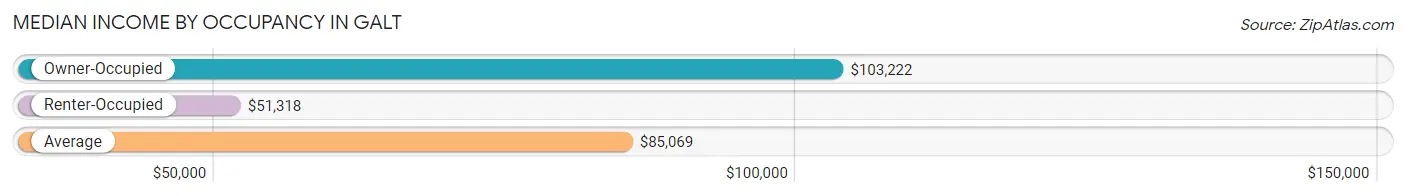
| Occupancy Type | # Households | Median Income |
| Owner-Occupied | 6,152 (75.6%) | $103,222 |
| Renter-Occupied | 1,981 (24.4%) | $51,318 |
| Average | 8,133 (100.0%) | $85,069 |
Occupancy by Householder Income Bracket in Galt
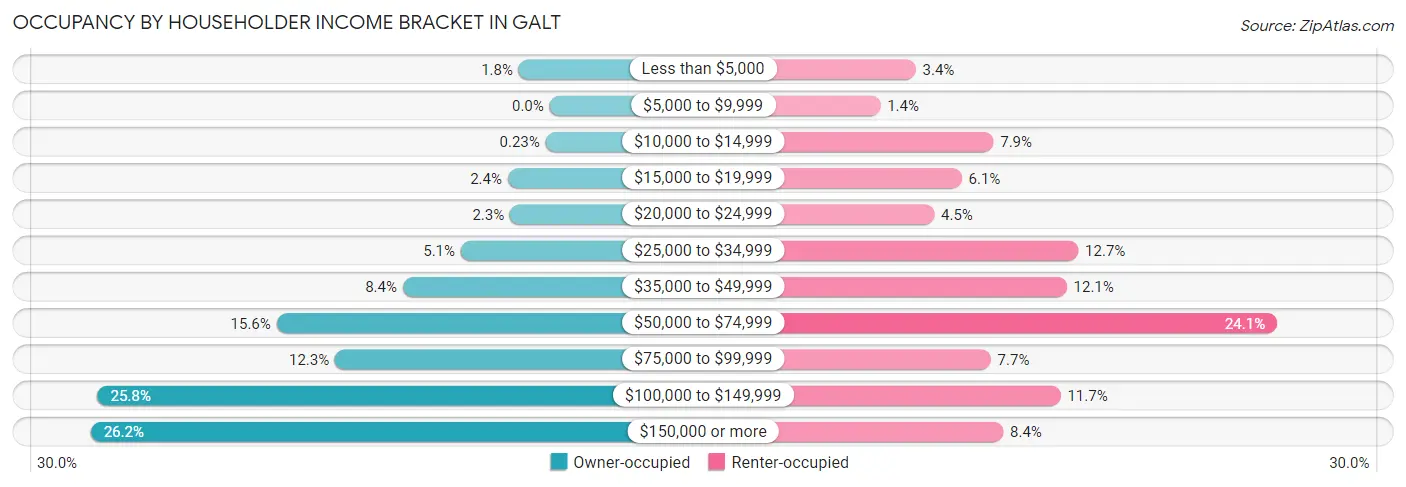
| Income Bracket | Owner-occupied | Renter-occupied |
| Less than $5,000 | 108 (1.8%) | 68 (3.4%) |
| $5,000 to $9,999 | 0 (0.0%) | 28 (1.4%) |
| $10,000 to $14,999 | 14 (0.2%) | 156 (7.9%) |
| $15,000 to $19,999 | 147 (2.4%) | 120 (6.1%) |
| $20,000 to $24,999 | 139 (2.3%) | 89 (4.5%) |
| $25,000 to $34,999 | 312 (5.1%) | 252 (12.7%) |
| $35,000 to $49,999 | 516 (8.4%) | 239 (12.1%) |
| $50,000 to $74,999 | 960 (15.6%) | 477 (24.1%) |
| $75,000 to $99,999 | 754 (12.3%) | 153 (7.7%) |
| $100,000 to $149,999 | 1,589 (25.8%) | 232 (11.7%) |
| $150,000 or more | 1,613 (26.2%) | 167 (8.4%) |
| Total | 6,152 (100.0%) | 1,981 (100.0%) |
Monthly Housing Cost Tiers in Galt
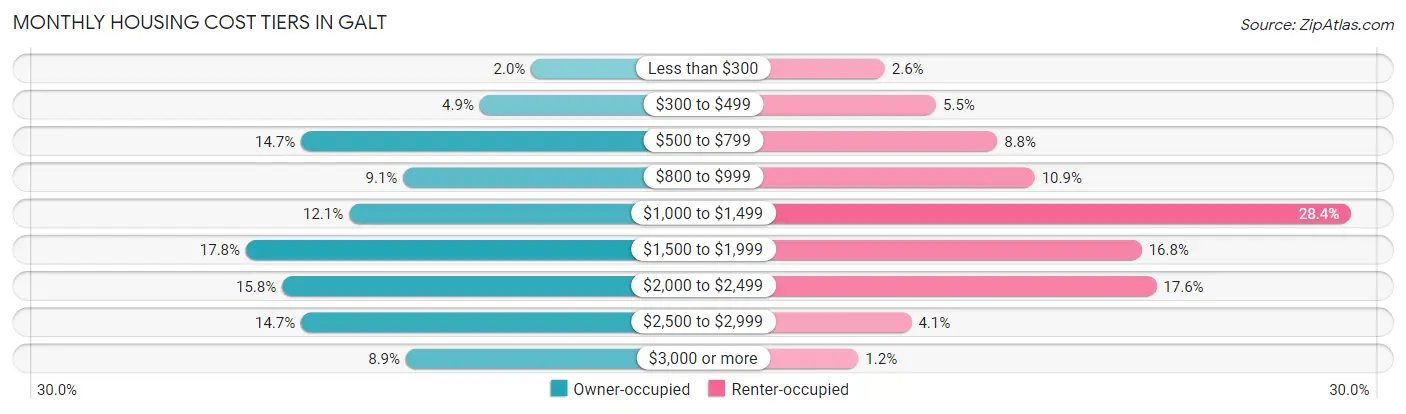
| Monthly Cost | Owner-occupied | Renter-occupied |
| Less than $300 | 124 (2.0%) | 52 (2.6%) |
| $300 to $499 | 299 (4.9%) | 108 (5.4%) |
| $500 to $799 | 906 (14.7%) | 175 (8.8%) |
| $800 to $999 | 559 (9.1%) | 216 (10.9%) |
| $1,000 to $1,499 | 743 (12.1%) | 562 (28.4%) |
| $1,500 to $1,999 | 1,094 (17.8%) | 333 (16.8%) |
| $2,000 to $2,499 | 971 (15.8%) | 349 (17.6%) |
| $2,500 to $2,999 | 906 (14.7%) | 81 (4.1%) |
| $3,000 or more | 550 (8.9%) | 23 (1.2%) |
| Total | 6,152 (100.0%) | 1,981 (100.0%) |
Physical Housing Characteristics in Galt
Housing Structures in Galt
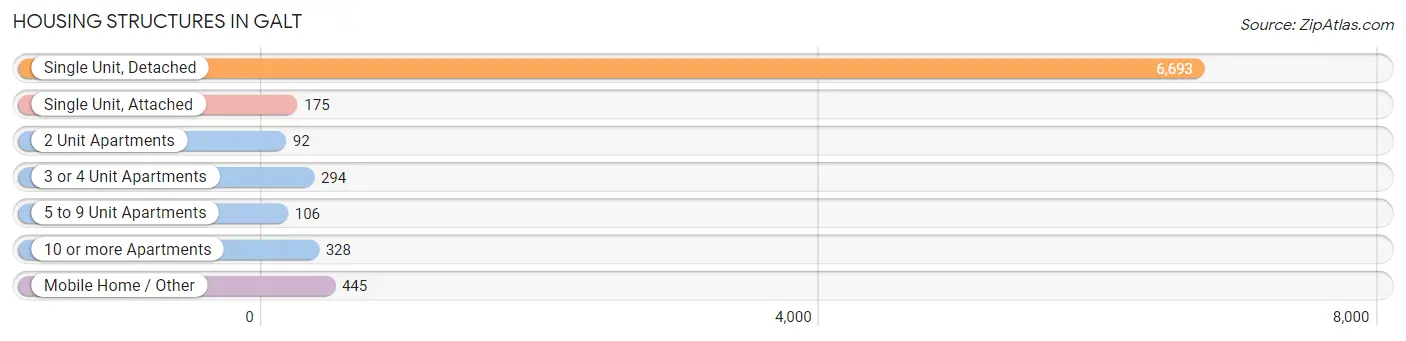
| Structure Type | # Housing Units | % Housing Units |
| Single Unit, Detached | 6,693 | 82.3% |
| Single Unit, Attached | 175 | 2.1% |
| 2 Unit Apartments | 92 | 1.1% |
| 3 or 4 Unit Apartments | 294 | 3.6% |
| 5 to 9 Unit Apartments | 106 | 1.3% |
| 10 or more Apartments | 328 | 4.0% |
| Mobile Home / Other | 445 | 5.5% |
| Total | 8,133 | 100.0% |
Housing Structures by Occupancy in Galt
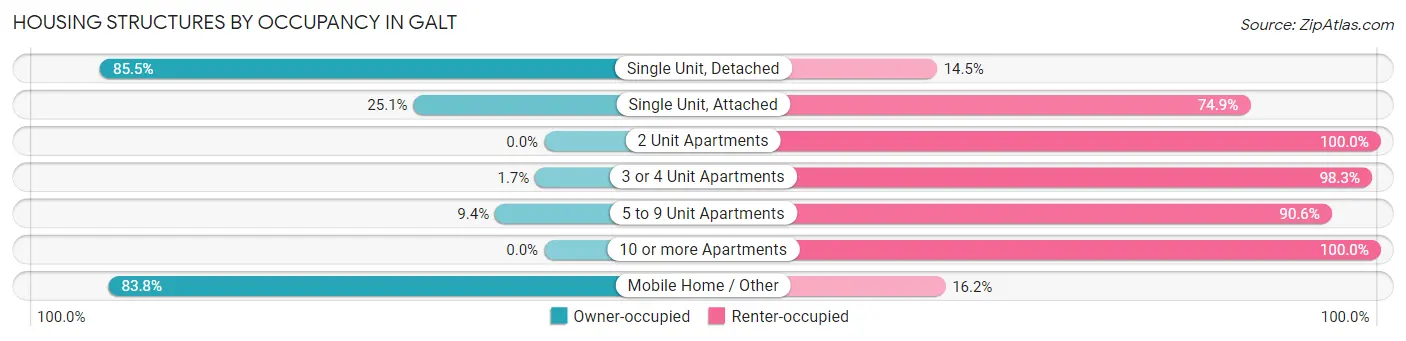
| Structure Type | Owner-occupied | Renter-occupied |
| Single Unit, Detached | 5,720 (85.5%) | 973 (14.5%) |
| Single Unit, Attached | 44 (25.1%) | 131 (74.9%) |
| 2 Unit Apartments | 0 (0.0%) | 92 (100.0%) |
| 3 or 4 Unit Apartments | 5 (1.7%) | 289 (98.3%) |
| 5 to 9 Unit Apartments | 10 (9.4%) | 96 (90.6%) |
| 10 or more Apartments | 0 (0.0%) | 328 (100.0%) |
| Mobile Home / Other | 373 (83.8%) | 72 (16.2%) |
| Total | 6,152 (75.6%) | 1,981 (24.4%) |
Housing Structures by Number of Rooms in Galt
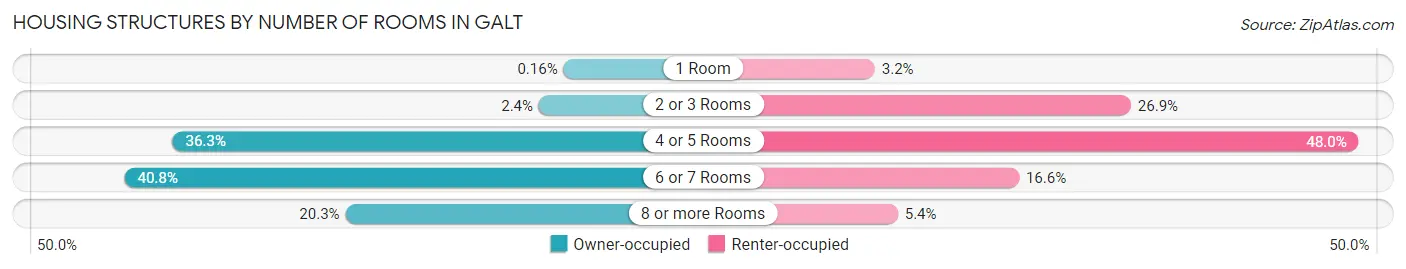
| Number of Rooms | Owner-occupied | Renter-occupied |
| 1 Room | 10 (0.2%) | 64 (3.2%) |
| 2 or 3 Rooms | 150 (2.4%) | 533 (26.9%) |
| 4 or 5 Rooms | 2,234 (36.3%) | 950 (48.0%) |
| 6 or 7 Rooms | 2,507 (40.7%) | 328 (16.6%) |
| 8 or more Rooms | 1,251 (20.3%) | 106 (5.3%) |
| Total | 6,152 (100.0%) | 1,981 (100.0%) |
Housing Structure by Heating Type in Galt
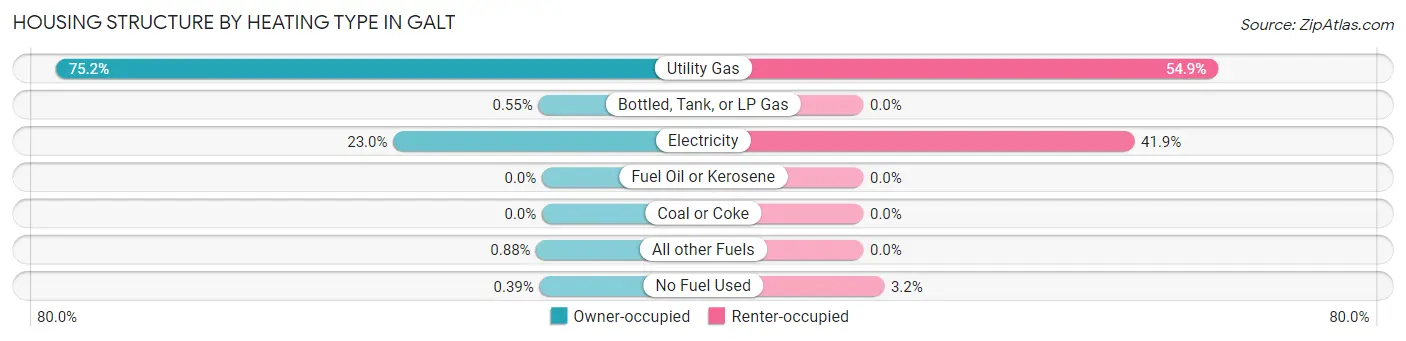
| Heating Type | Owner-occupied | Renter-occupied |
| Utility Gas | 4,625 (75.2%) | 1,087 (54.9%) |
| Bottled, Tank, or LP Gas | 34 (0.5%) | 0 (0.0%) |
| Electricity | 1,415 (23.0%) | 830 (41.9%) |
| Fuel Oil or Kerosene | 0 (0.0%) | 0 (0.0%) |
| Coal or Coke | 0 (0.0%) | 0 (0.0%) |
| All other Fuels | 54 (0.9%) | 0 (0.0%) |
| No Fuel Used | 24 (0.4%) | 64 (3.2%) |
| Total | 6,152 (100.0%) | 1,981 (100.0%) |
Household Vehicle Usage in Galt
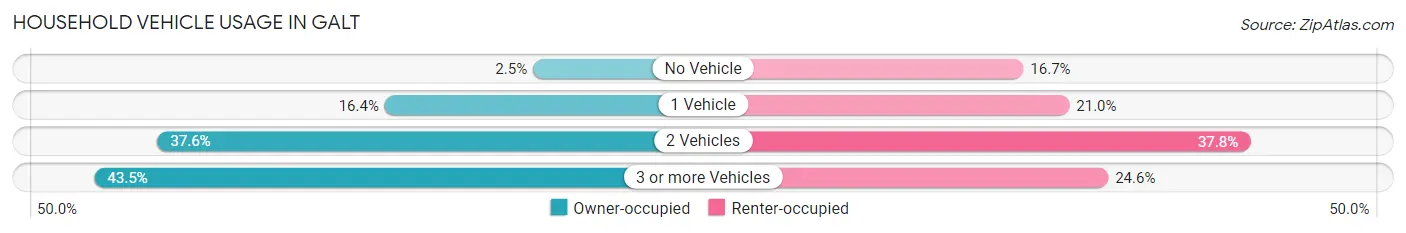
| Vehicles per Household | Owner-occupied | Renter-occupied |
| No Vehicle | 156 (2.5%) | 330 (16.7%) |
| 1 Vehicle | 1,008 (16.4%) | 415 (20.9%) |
| 2 Vehicles | 2,313 (37.6%) | 749 (37.8%) |
| 3 or more Vehicles | 2,675 (43.5%) | 487 (24.6%) |
| Total | 6,152 (100.0%) | 1,981 (100.0%) |
Real Estate & Mortgages in Galt
Real Estate and Mortgage Overview in Galt
| Characteristic | Without Mortgage | With Mortgage |
| Housing Units | 1,753 | 4,399 |
| Median Property Value | $404,700 | $461,600 |
| Median Household Income | $75,189 | $1,394 |
| Monthly Housing Costs | $645 | $550 |
| Real Estate Taxes | $2,577 | $63 |
Property Value by Mortgage Status in Galt
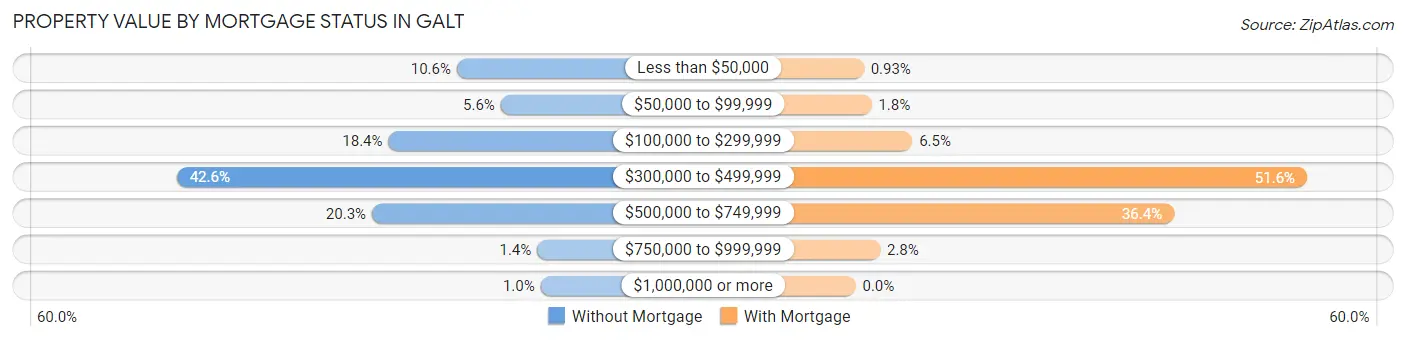
| Property Value | Without Mortgage | With Mortgage |
| Less than $50,000 | 186 (10.6%) | 41 (0.9%) |
| $50,000 to $99,999 | 98 (5.6%) | 80 (1.8%) |
| $100,000 to $299,999 | 323 (18.4%) | 285 (6.5%) |
| $300,000 to $499,999 | 747 (42.6%) | 2,269 (51.6%) |
| $500,000 to $749,999 | 356 (20.3%) | 1,601 (36.4%) |
| $750,000 to $999,999 | 25 (1.4%) | 123 (2.8%) |
| $1,000,000 or more | 18 (1.0%) | 0 (0.0%) |
| Total | 1,753 (100.0%) | 4,399 (100.0%) |
Household Income by Mortgage Status in Galt
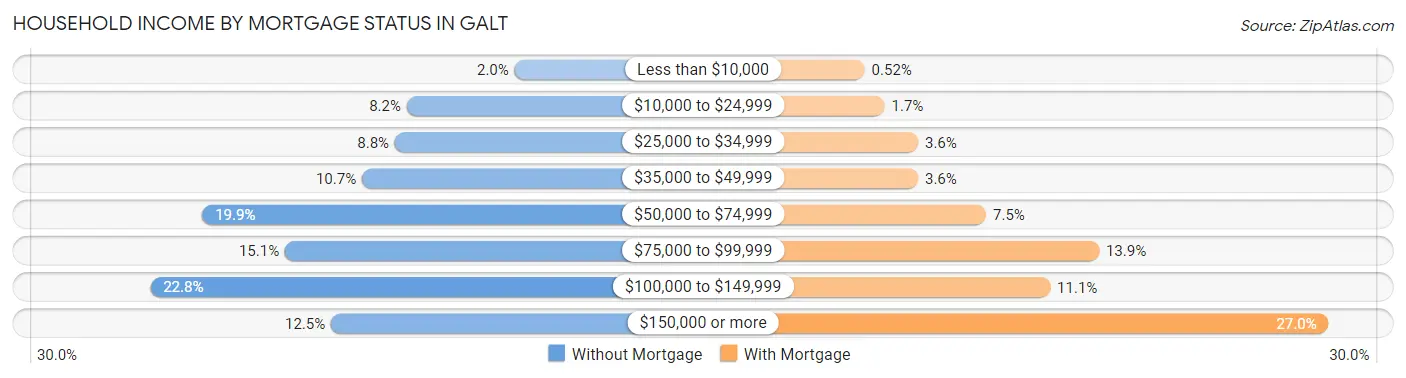
| Household Income | Without Mortgage | With Mortgage |
| Less than $10,000 | 35 (2.0%) | 23 (0.5%) |
| $10,000 to $24,999 | 143 (8.2%) | 73 (1.7%) |
| $25,000 to $34,999 | 155 (8.8%) | 157 (3.6%) |
| $35,000 to $49,999 | 188 (10.7%) | 157 (3.6%) |
| $50,000 to $74,999 | 348 (19.9%) | 328 (7.5%) |
| $75,000 to $99,999 | 265 (15.1%) | 612 (13.9%) |
| $100,000 to $149,999 | 400 (22.8%) | 489 (11.1%) |
| $150,000 or more | 219 (12.5%) | 1,189 (27.0%) |
| Total | 1,753 (100.0%) | 4,399 (100.0%) |
Property Value to Household Income Ratio in Galt
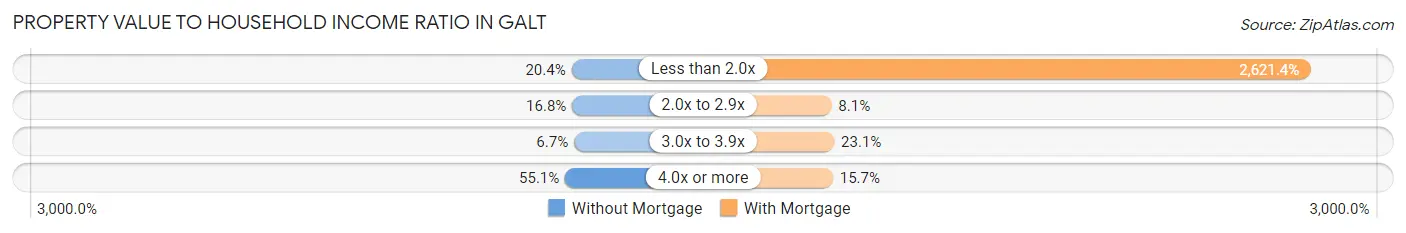
| Value-to-Income Ratio | Without Mortgage | With Mortgage |
| Less than 2.0x | 358 (20.4%) | 115,317 (2,621.4%) |
| 2.0x to 2.9x | 294 (16.8%) | 357 (8.1%) |
| 3.0x to 3.9x | 118 (6.7%) | 1,015 (23.1%) |
| 4.0x or more | 965 (55.0%) | 691 (15.7%) |
| Total | 1,753 (100.0%) | 4,399 (100.0%) |
Real Estate Taxes by Mortgage Status in Galt
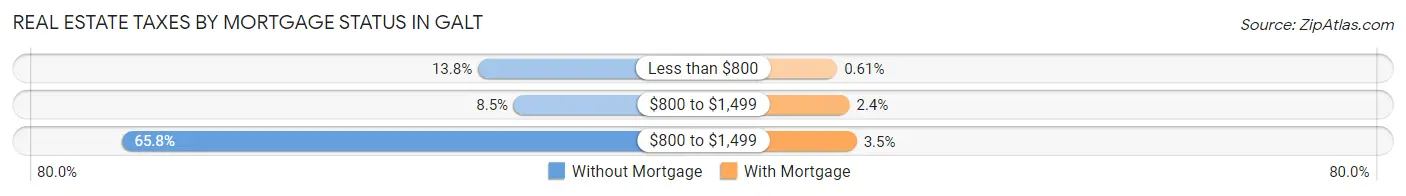
| Property Taxes | Without Mortgage | With Mortgage |
| Less than $800 | 241 (13.8%) | 27 (0.6%) |
| $800 to $1,499 | 149 (8.5%) | 106 (2.4%) |
| $800 to $1,499 | 1,154 (65.8%) | 152 (3.5%) |
| Total | 1,753 (100.0%) | 4,399 (100.0%) |
Health & Disability in Galt
Health Insurance Coverage by Age in Galt
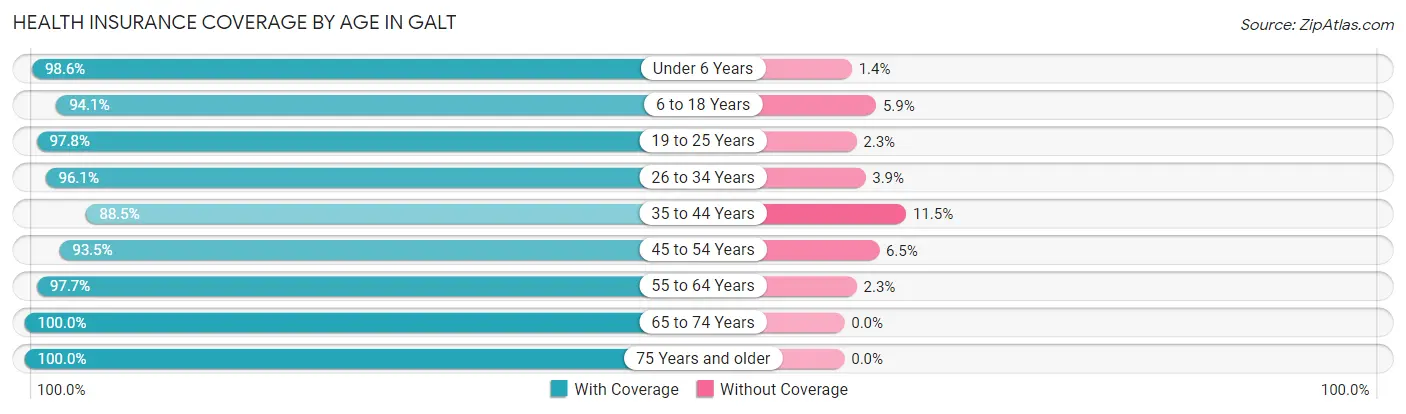
| Age Bracket | With Coverage | Without Coverage |
| Under 6 Years | 1,862 (98.6%) | 26 (1.4%) |
| 6 to 18 Years | 4,334 (94.1%) | 272 (5.9%) |
| 19 to 25 Years | 1,826 (97.8%) | 42 (2.2%) |
| 26 to 34 Years | 2,995 (96.1%) | 122 (3.9%) |
| 35 to 44 Years | 3,073 (88.5%) | 400 (11.5%) |
| 45 to 54 Years | 3,313 (93.5%) | 229 (6.5%) |
| 55 to 64 Years | 3,073 (97.7%) | 72 (2.3%) |
| 65 to 74 Years | 2,337 (100.0%) | 0 (0.0%) |
| 75 Years and older | 1,230 (100.0%) | 0 (0.0%) |
| Total | 24,043 (95.4%) | 1,163 (4.6%) |
Health Insurance Coverage by Citizenship Status in Galt
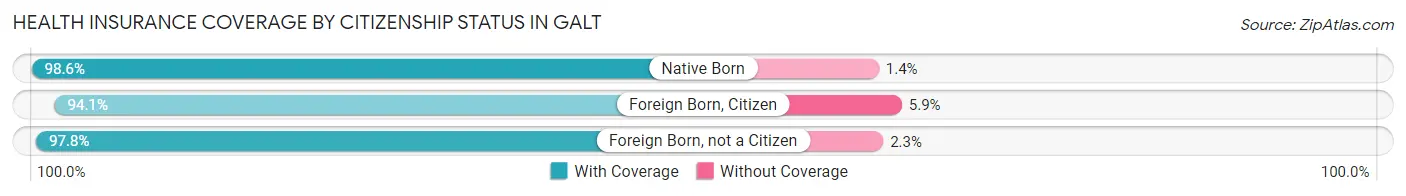
| Citizenship Status | With Coverage | Without Coverage |
| Native Born | 1,862 (98.6%) | 26 (1.4%) |
| Foreign Born, Citizen | 4,334 (94.1%) | 272 (5.9%) |
| Foreign Born, not a Citizen | 1,826 (97.8%) | 42 (2.2%) |
Health Insurance Coverage by Household Income in Galt
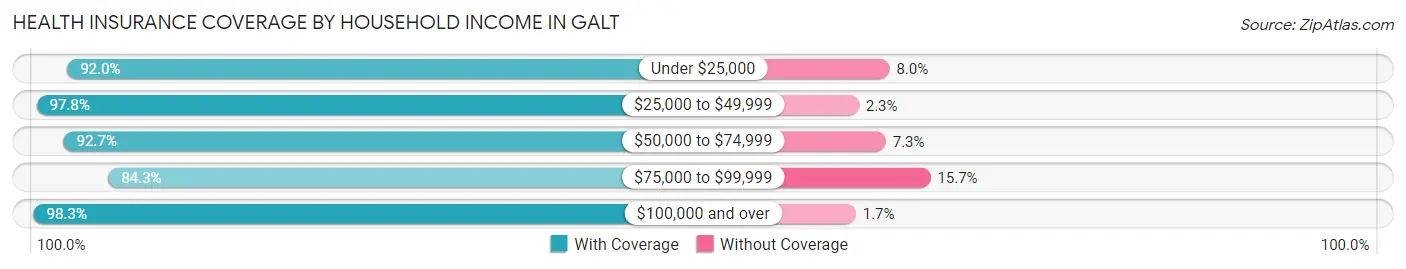
| Household Income | With Coverage | Without Coverage |
| Under $25,000 | 1,370 (92.0%) | 119 (8.0%) |
| $25,000 to $49,999 | 3,612 (97.8%) | 83 (2.2%) |
| $50,000 to $74,999 | 3,574 (92.7%) | 282 (7.3%) |
| $75,000 to $99,999 | 2,460 (84.3%) | 457 (15.7%) |
| $100,000 and over | 12,987 (98.3%) | 222 (1.7%) |
Public vs Private Health Insurance Coverage by Age in Galt
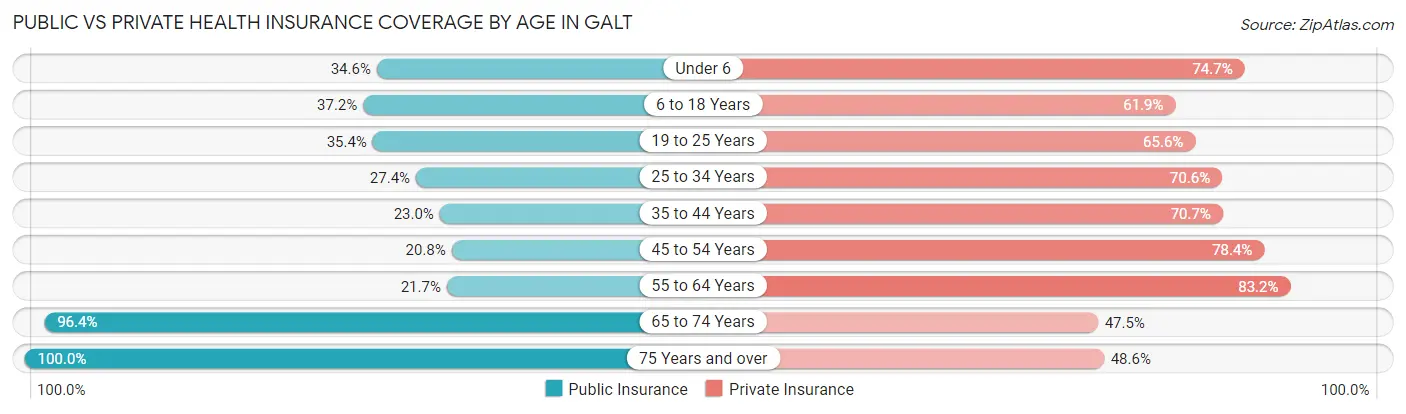
| Age Bracket | Public Insurance | Private Insurance |
| Under 6 | 654 (34.6%) | 1,411 (74.7%) |
| 6 to 18 Years | 1,712 (37.2%) | 2,851 (61.9%) |
| 19 to 25 Years | 661 (35.4%) | 1,225 (65.6%) |
| 25 to 34 Years | 853 (27.4%) | 2,200 (70.6%) |
| 35 to 44 Years | 797 (23.0%) | 2,455 (70.7%) |
| 45 to 54 Years | 735 (20.7%) | 2,777 (78.4%) |
| 55 to 64 Years | 681 (21.6%) | 2,618 (83.2%) |
| 65 to 74 Years | 2,252 (96.4%) | 1,110 (47.5%) |
| 75 Years and over | 1,230 (100.0%) | 598 (48.6%) |
| Total | 9,575 (38.0%) | 17,245 (68.4%) |
Disability Status by Sex by Age in Galt
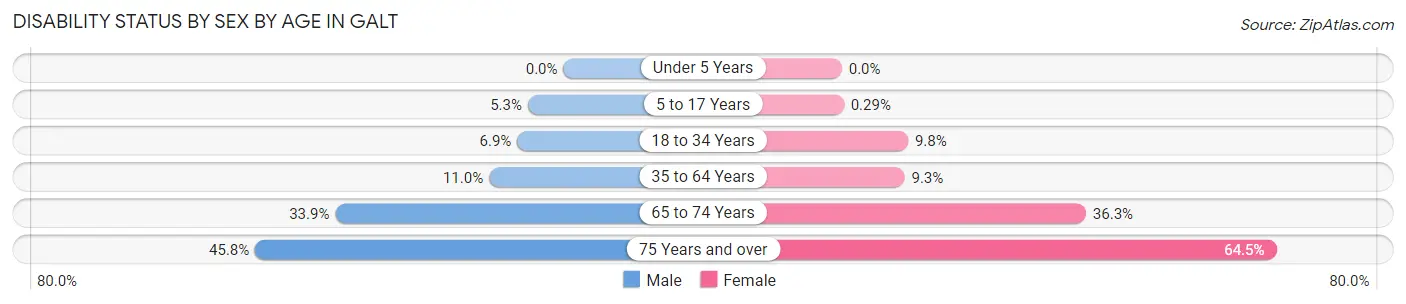
| Age Bracket | Male | Female |
| Under 5 Years | 0 (0.0%) | 0 (0.0%) |
| 5 to 17 Years | 130 (5.3%) | 7 (0.3%) |
| 18 to 34 Years | 181 (6.9%) | 257 (9.8%) |
| 35 to 64 Years | 597 (11.0%) | 443 (9.3%) |
| 65 to 74 Years | 315 (33.9%) | 510 (36.2%) |
| 75 Years and over | 265 (45.8%) | 420 (64.5%) |
Disability Class by Sex by Age in Galt
Disability Class: Hearing Difficulty
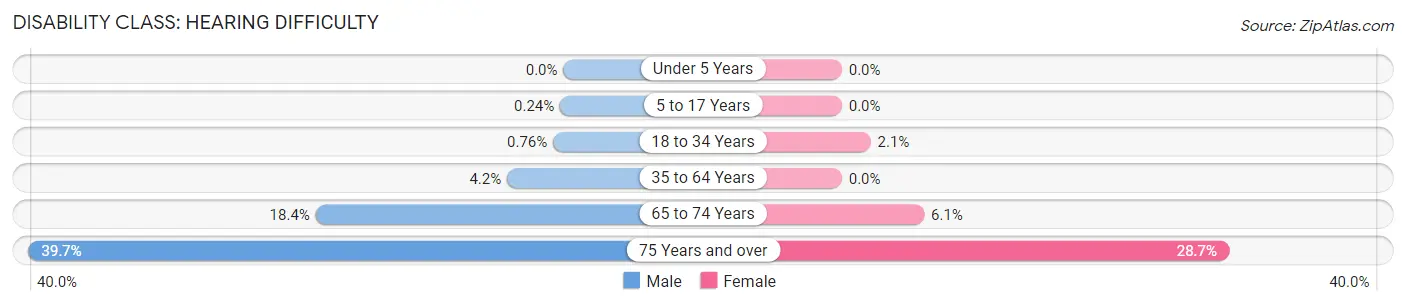
| Age Bracket | Male | Female |
| Under 5 Years | 0 (0.0%) | 0 (0.0%) |
| 5 to 17 Years | 6 (0.2%) | 0 (0.0%) |
| 18 to 34 Years | 20 (0.8%) | 56 (2.1%) |
| 35 to 64 Years | 226 (4.2%) | 0 (0.0%) |
| 65 to 74 Years | 171 (18.4%) | 86 (6.1%) |
| 75 Years and over | 230 (39.7%) | 187 (28.7%) |
Disability Class: Vision Difficulty
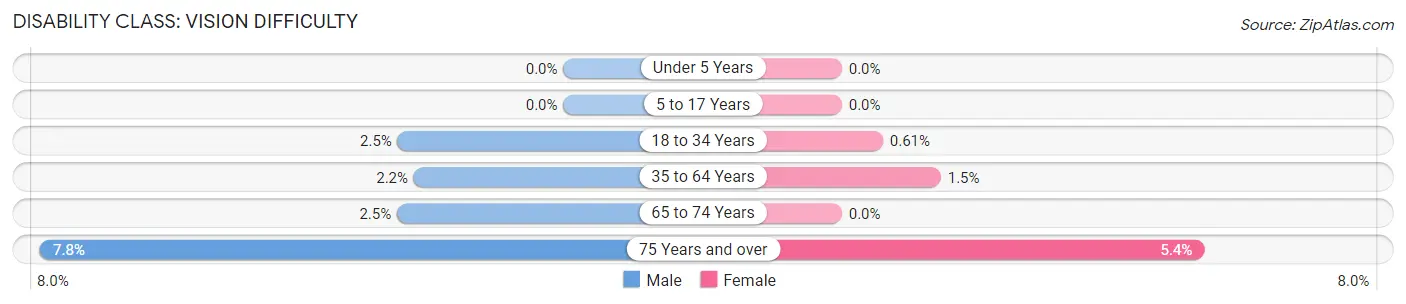
| Age Bracket | Male | Female |
| Under 5 Years | 0 (0.0%) | 0 (0.0%) |
| 5 to 17 Years | 0 (0.0%) | 0 (0.0%) |
| 18 to 34 Years | 65 (2.5%) | 16 (0.6%) |
| 35 to 64 Years | 120 (2.2%) | 70 (1.5%) |
| 65 to 74 Years | 23 (2.5%) | 0 (0.0%) |
| 75 Years and over | 45 (7.8%) | 35 (5.4%) |
Disability Class: Cognitive Difficulty
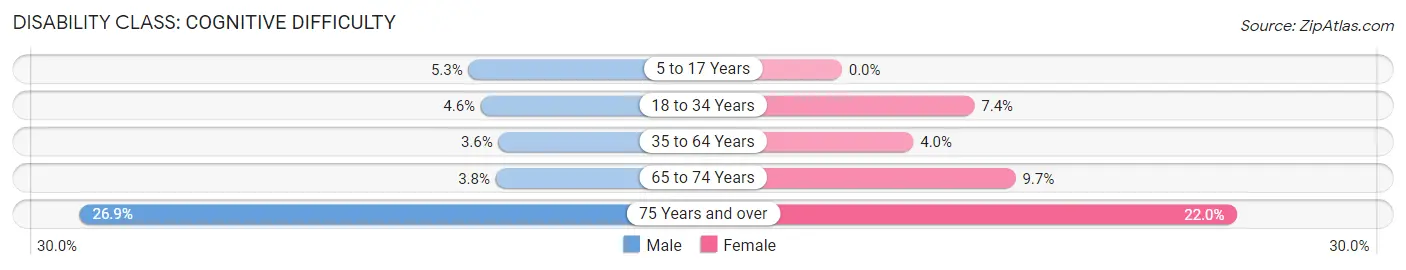
| Age Bracket | Male | Female |
| 5 to 17 Years | 130 (5.3%) | 0 (0.0%) |
| 18 to 34 Years | 121 (4.6%) | 193 (7.4%) |
| 35 to 64 Years | 195 (3.6%) | 189 (4.0%) |
| 65 to 74 Years | 35 (3.8%) | 136 (9.7%) |
| 75 Years and over | 156 (26.9%) | 143 (22.0%) |
Disability Class: Ambulatory Difficulty
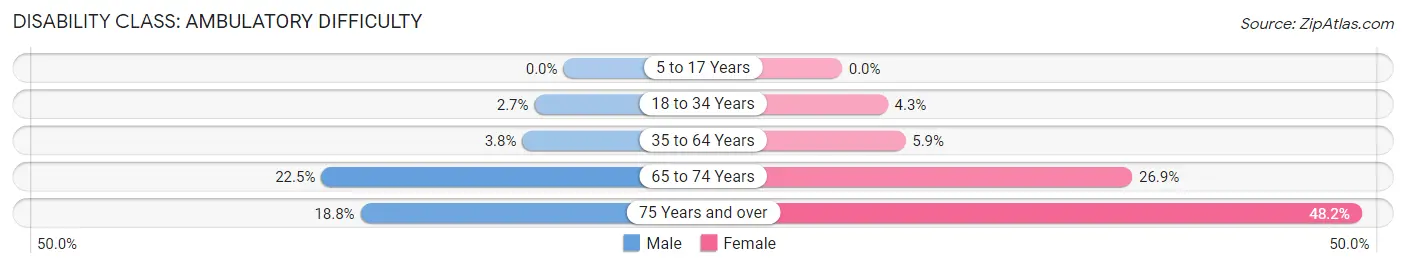
| Age Bracket | Male | Female |
| 5 to 17 Years | 0 (0.0%) | 0 (0.0%) |
| 18 to 34 Years | 71 (2.7%) | 111 (4.3%) |
| 35 to 64 Years | 206 (3.8%) | 280 (5.9%) |
| 65 to 74 Years | 209 (22.5%) | 379 (26.9%) |
| 75 Years and over | 109 (18.8%) | 314 (48.2%) |
Disability Class: Self-Care Difficulty
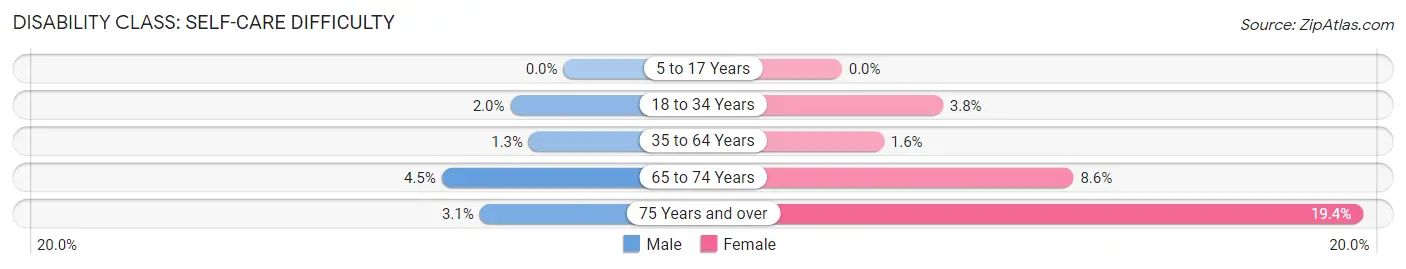
| Age Bracket | Male | Female |
| 5 to 17 Years | 0 (0.0%) | 0 (0.0%) |
| 18 to 34 Years | 52 (2.0%) | 98 (3.7%) |
| 35 to 64 Years | 69 (1.3%) | 74 (1.6%) |
| 65 to 74 Years | 42 (4.5%) | 121 (8.6%) |
| 75 Years and over | 18 (3.1%) | 126 (19.4%) |
Technology Access in Galt
Computing Device Access in Galt
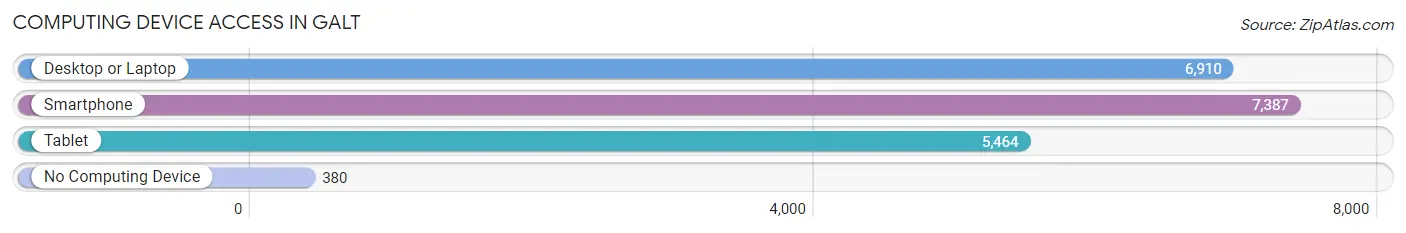
| Device Type | # Households | % Households |
| Desktop or Laptop | 6,910 | 85.0% |
| Smartphone | 7,387 | 90.8% |
| Tablet | 5,464 | 67.2% |
| No Computing Device | 380 | 4.7% |
| Total | 8,133 | 100.0% |
Internet Access in Galt
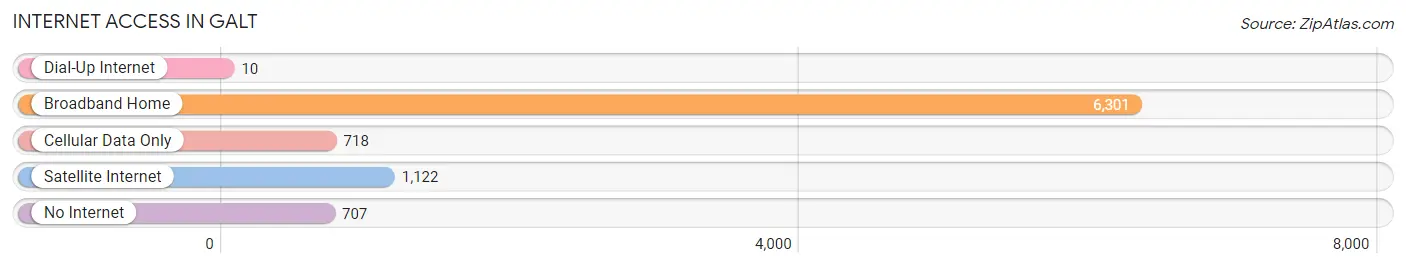
| Internet Type | # Households | % Households |
| Dial-Up Internet | 10 | 0.1% |
| Broadband Home | 6,301 | 77.5% |
| Cellular Data Only | 718 | 8.8% |
| Satellite Internet | 1,122 | 13.8% |
| No Internet | 707 | 8.7% |
| Total | 8,133 | 100.0% |
Galt Summary
Galt is a small city located in Sacramento County, California. It is situated in the Central Valley, about 20 miles south of Sacramento. The city was founded in 1869 and incorporated in 1946. As of the 2010 census, the population of Galt was 23,647.
Geography
Galt is located at 38°17'N 121°18'W. It is situated in the Central Valley, about 20 miles south of Sacramento. The city is bordered by the cities of Lodi to the north, Stockton to the east, and Elk Grove to the south. The city is located on the Mokelumne River, which flows through the city and provides a source of recreation for the residents.
The city has a total area of 5.3 square miles, all of which is land. The terrain is mostly flat, with some rolling hills in the northern part of the city. The climate is Mediterranean, with hot, dry summers and mild, wet winters.
Economy
Galt is a small city with a diverse economy. The city is home to a variety of businesses, including manufacturing, retail, and service industries. The city is also home to a number of agricultural businesses, including dairy farms, vineyards, and orchards.
The city is home to several large employers, including the Galt Joint Union High School District, the Galt Unified School District, and the Galt Medical Center. The city is also home to a number of small businesses, including restaurants, retail stores, and professional services.
Demographics
As of the 2010 census, the population of Galt was 23,647. The racial makeup of the city was 68.3% White, 1.3% African American, 0.7% Native American, 1.7% Asian, 0.2% Pacific Islander, 24.3% from other races, and 3.7% from two or more races. Hispanic or Latino of any race were 44.2% of the population.
The median income for a household in the city was $50,945, and the median income for a family was $58,945. The per capita income for the city was $20,945. About 11.3% of families and 14.2% of the population were below the poverty line, including 19.2% of those under age 18 and 8.2% of those age 65 or over.
Conclusion
Galt is a small city located in Sacramento County, California. It is situated in the Central Valley, about 20 miles south of Sacramento. The city was founded in 1869 and incorporated in 1946. As of the 2010 census, the population of Galt was 23,647. The city has a diverse economy, with a variety of businesses, including manufacturing, retail, and service industries. The city is also home to a number of agricultural businesses, including dairy farms, vineyards, and orchards. The racial makeup of the city was 68.3% White, 1.3% African American, 0.7% Native American, 1.7% Asian, 0.2% Pacific Islander, 24.3% from other races, and 3.7% from two or more races. The median income for a household in the city was $50,945, and the median income for a family was $58,945. Galt is a small city with a diverse economy and a variety of businesses, making it an attractive place to live and work.
Common Questions
What is Per Capita Income in Galt?
Per Capita income in Galt is $34,857.
What is the Median Family Income in Galt?
Median Family Income in Galt is $103,261.
What is the Median Household income in Galt?
Median Household Income in Galt is $85,069.
What is Income or Wage Gap in Galt?
Income or Wage Gap in Galt is 30.5%.
Women in Galt earn 69.5 cents for every dollar earned by a man.
What is Inequality or Gini Index in Galt?
Inequality or Gini Index in Galt is 0.41.
What is the Total Population of Galt?
Total Population of Galt is 25,350.
What is the Total Male Population of Galt?
Total Male Population of Galt is 12,943.
What is the Total Female Population of Galt?
Total Female Population of Galt is 12,407.
What is the Ratio of Males per 100 Females in Galt?
There are 104.32 Males per 100 Females in Galt.
What is the Ratio of Females per 100 Males in Galt?
There are 95.86 Females per 100 Males in Galt.
What is the Median Population Age in Galt?
Median Population Age in Galt is 38.5 Years.
What is the Average Family Size in Galt
Average Family Size in Galt is 3.5 People.
What is the Average Household Size in Galt
Average Household Size in Galt is 3.1 People.
How Large is the Labor Force in Galt?
There are 12,869 People in the Labor Forcein in Galt.
What is the Percentage of People in the Labor Force in Galt?
64.6% of People are in the Labor Force in Galt.
What is the Unemployment Rate in Galt?
Unemployment Rate in Galt is 6.0%.