Clovis, CA Map & Demographics
Clovis Map
Clovis Overview
$41,909
PER CAPITA INCOME
$111,257
AVG FAMILY INCOME
$98,554
AVG HOUSEHOLD INCOME
23.4%
WAGE / INCOME GAP [ % ]
76.6¢/ $1
WAGE / INCOME GAP [ $ ]
$10,508
FAMILY INCOME DEFICIT
0.42
INEQUALITY / GINI INDEX
120,607
TOTAL POPULATION
58,694
MALE POPULATION
61,913
FEMALE POPULATION
94.80
MALES / 100 FEMALES
105.48
FEMALES / 100 MALES
34.8
MEDIAN AGE
3.4
AVG FAMILY SIZE
3.0
AVG HOUSEHOLD SIZE
59,769
LABOR FORCE [ PEOPLE ]
66.7%
PERCENT IN LABOR FORCE
6.3%
UNEMPLOYMENT RATE
Clovis Area Codes
Income in Clovis
Income Overview in Clovis
Per Capita Income in Clovis is $41,909, while median incomes of families and households are $111,257 and $98,554 respectively.
| Characteristic | Number | Measure |
| Per Capita Income | 120,607 | $41,909 |
| Median Family Income | 30,421 | $111,257 |
| Mean Family Income | 30,421 | $137,526 |
| Median Household Income | 40,135 | $98,554 |
| Mean Household Income | 40,135 | $123,212 |
| Income Deficit | 30,421 | $10,508 |
| Wage / Income Gap (%) | 120,607 | 23.45% |
| Wage / Income Gap ($) | 120,607 | 76.55¢ per $1 |
| Gini / Inequality Index | 120,607 | 0.42 |
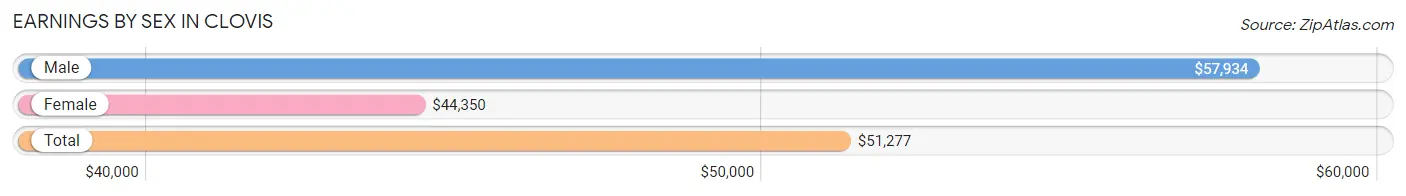
Earnings by Sex in Clovis
Average Earnings in Clovis are $51,277, $57,934 for men and $44,350 for women, a difference of 23.4%.
| Sex | Number | Average Earnings |
| Male | 31,185 (51.4%) | $57,934 |
| Female | 29,508 (48.6%) | $44,350 |
| Total | 60,693 (100.0%) | $51,277 |
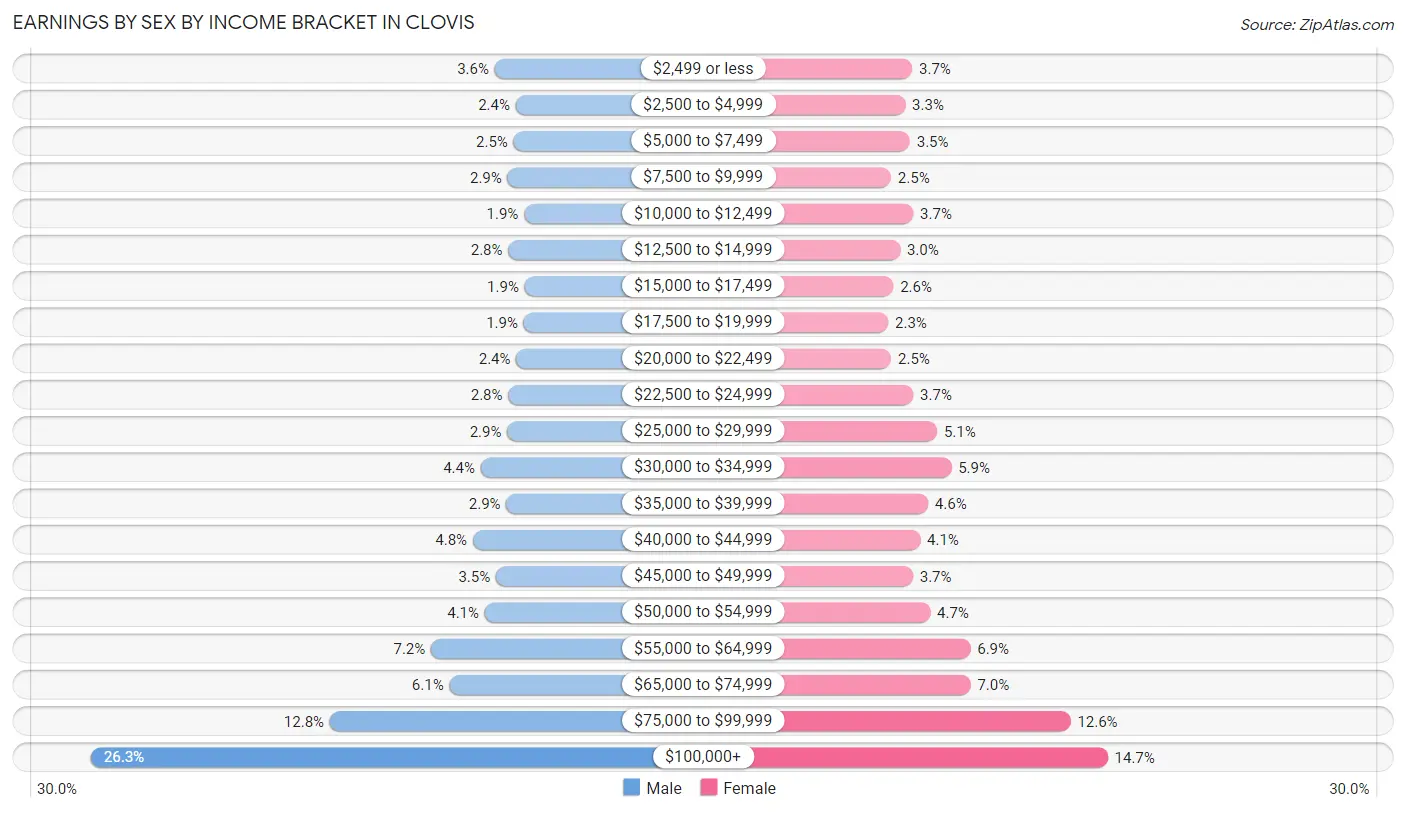
Earnings by Sex by Income Bracket in Clovis
The most common earnings brackets in Clovis are $100,000+ for men (8,192 | 26.3%) and $100,000+ for women (4,327 | 14.7%).
| Income | Male | Female |
| $2,499 or less | 1,113 (3.6%) | 1,082 (3.7%) |
| $2,500 to $4,999 | 744 (2.4%) | 968 (3.3%) |
| $5,000 to $7,499 | 782 (2.5%) | 1,044 (3.5%) |
| $7,500 to $9,999 | 889 (2.9%) | 733 (2.5%) |
| $10,000 to $12,499 | 598 (1.9%) | 1,101 (3.7%) |
| $12,500 to $14,999 | 876 (2.8%) | 882 (3.0%) |
| $15,000 to $17,499 | 590 (1.9%) | 769 (2.6%) |
| $17,500 to $19,999 | 606 (1.9%) | 686 (2.3%) |
| $20,000 to $22,499 | 736 (2.4%) | 736 (2.5%) |
| $22,500 to $24,999 | 877 (2.8%) | 1,101 (3.7%) |
| $25,000 to $29,999 | 895 (2.9%) | 1,496 (5.1%) |
| $30,000 to $34,999 | 1,360 (4.4%) | 1,733 (5.9%) |
| $35,000 to $39,999 | 912 (2.9%) | 1,347 (4.6%) |
| $40,000 to $44,999 | 1,496 (4.8%) | 1,217 (4.1%) |
| $45,000 to $49,999 | 1,090 (3.5%) | 1,095 (3.7%) |
| $50,000 to $54,999 | 1,288 (4.1%) | 1,381 (4.7%) |
| $55,000 to $64,999 | 2,230 (7.1%) | 2,049 (6.9%) |
| $65,000 to $74,999 | 1,908 (6.1%) | 2,052 (7.0%) |
| $75,000 to $99,999 | 4,003 (12.8%) | 3,709 (12.6%) |
| $100,000+ | 8,192 (26.3%) | 4,327 (14.7%) |
| Total | 31,185 (100.0%) | 29,508 (100.0%) |
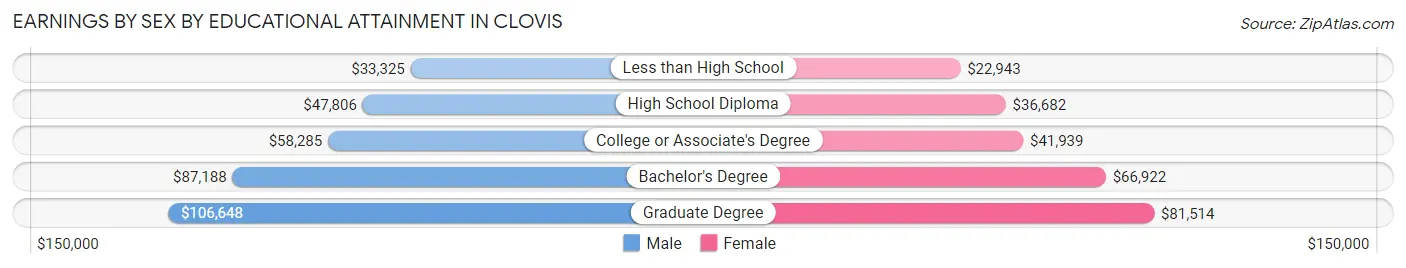
Earnings by Sex by Educational Attainment in Clovis
Average earnings in Clovis are $65,685 for men and $50,874 for women, a difference of 22.6%. Men with an educational attainment of graduate degree enjoy the highest average annual earnings of $106,648, while those with less than high school education earn the least with $33,325. Women with an educational attainment of graduate degree earn the most with the average annual earnings of $81,514, while those with less than high school education have the smallest earnings of $22,943.
| Educational Attainment | Male Income | Female Income |
| Less than High School | $33,325 | $22,943 |
| High School Diploma | $47,806 | $36,682 |
| College or Associate's Degree | $58,285 | $41,939 |
| Bachelor's Degree | $87,188 | $66,922 |
| Graduate Degree | $106,648 | $81,514 |
| Total | $65,685 | $50,874 |
Family Income in Clovis
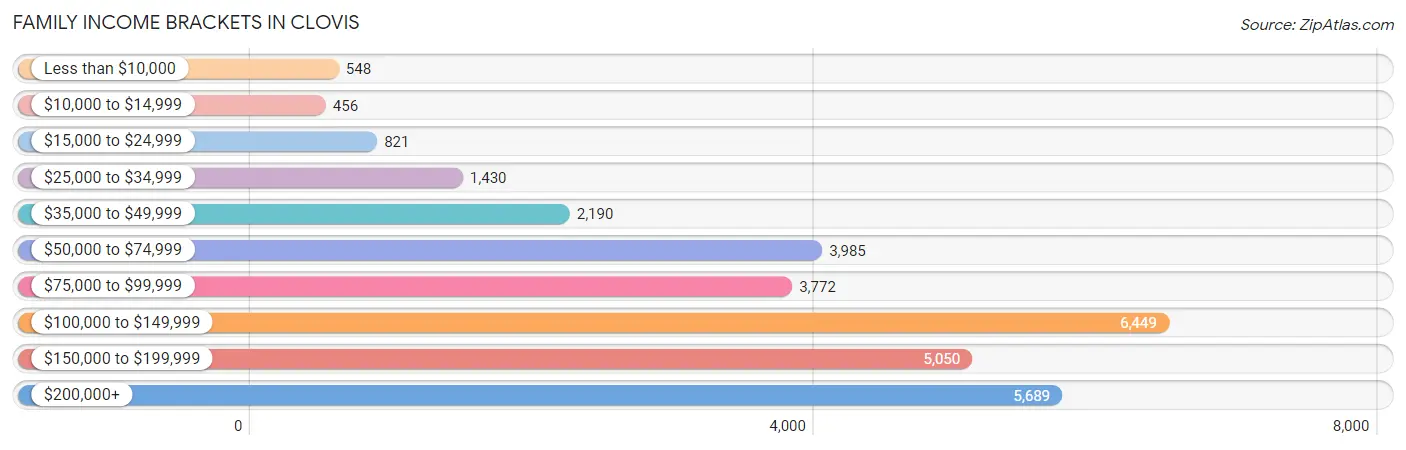
Family Income Brackets in Clovis
According to the Clovis family income data, there are 6,449 families falling into the $100,000 to $149,999 income range, which is the most common income bracket and makes up 21.2% of all families. Conversely, the $10,000 to $14,999 income bracket is the least frequent group with only 456 families (1.5%) belonging to this category.
| Income Bracket | # Families | % Families |
| Less than $10,000 | 548 | 1.8% |
| $10,000 to $14,999 | 456 | 1.5% |
| $15,000 to $24,999 | 821 | 2.7% |
| $25,000 to $34,999 | 1,430 | 4.7% |
| $35,000 to $49,999 | 2,190 | 7.2% |
| $50,000 to $74,999 | 3,985 | 13.1% |
| $75,000 to $99,999 | 3,772 | 12.4% |
| $100,000 to $149,999 | 6,449 | 21.2% |
| $150,000 to $199,999 | 5,050 | 16.6% |
| $200,000+ | 5,689 | 18.7% |
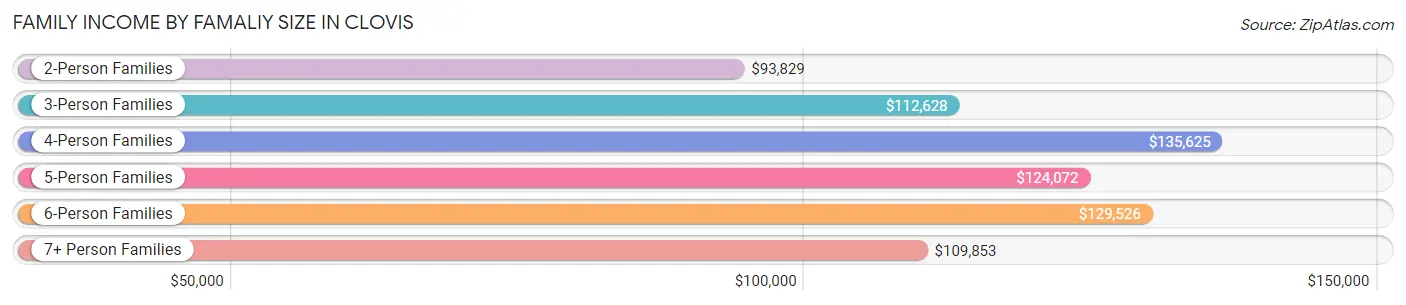
Family Income by Famaliy Size in Clovis
4-person families (6,397 | 21.0%) account for the highest median family income in Clovis with $135,625 per family, while 2-person families (11,870 | 39.0%) have the highest median income of $46,914 per family member.
| Income Bracket | # Families | Median Income |
| 2-Person Families | 11,870 (39.0%) | $93,829 |
| 3-Person Families | 6,904 (22.7%) | $112,628 |
| 4-Person Families | 6,397 (21.0%) | $135,625 |
| 5-Person Families | 3,299 (10.8%) | $124,072 |
| 6-Person Families | 1,421 (4.7%) | $129,526 |
| 7+ Person Families | 530 (1.7%) | $109,853 |
| Total | 30,421 (100.0%) | $111,257 |
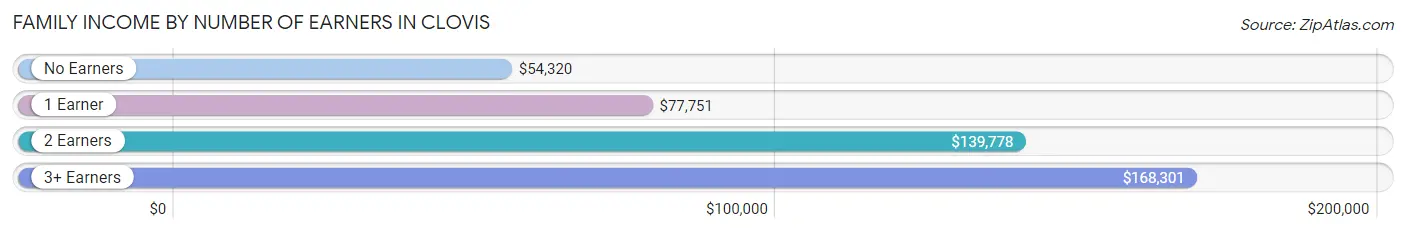
Family Income by Number of Earners in Clovis
The median family income in Clovis is $111,257, with families comprising 3+ earners (3,870) having the highest median family income of $168,301, while families with no earners (3,359) have the lowest median family income of $54,320, accounting for 12.7% and 11.0% of families, respectively.
| Number of Earners | # Families | Median Income |
| No Earners | 3,359 (11.0%) | $54,320 |
| 1 Earner | 10,074 (33.1%) | $77,751 |
| 2 Earners | 13,118 (43.1%) | $139,778 |
| 3+ Earners | 3,870 (12.7%) | $168,301 |
| Total | 30,421 (100.0%) | $111,257 |
Household Income in Clovis
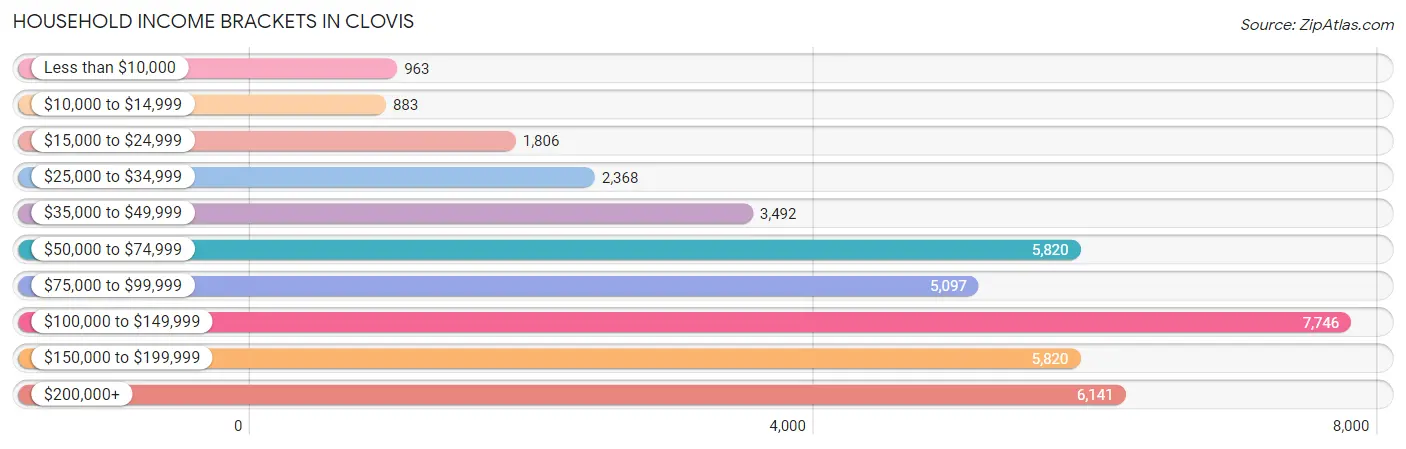
Household Income Brackets in Clovis
With 7,746 households falling in the category, the $100,000 to $149,999 income range is the most frequent in Clovis, accounting for 19.3% of all households. In contrast, only 883 households (2.2%) fall into the $10,000 to $14,999 income bracket, making it the least populous group.
| Income Bracket | # Households | % Households |
| Less than $10,000 | 963 | 2.4% |
| $10,000 to $14,999 | 883 | 2.2% |
| $15,000 to $24,999 | 1,806 | 4.5% |
| $25,000 to $34,999 | 2,368 | 5.9% |
| $35,000 to $49,999 | 3,492 | 8.7% |
| $50,000 to $74,999 | 5,820 | 14.5% |
| $75,000 to $99,999 | 5,097 | 12.7% |
| $100,000 to $149,999 | 7,746 | 19.3% |
| $150,000 to $199,999 | 5,820 | 14.5% |
| $200,000+ | 6,141 | 15.3% |
Household Income by Householder Age in Clovis
The median household income in Clovis is $98,554, with the highest median household income of $121,146 found in the 45 to 64 years age bracket for the primary householder. A total of 14,389 households (35.8%) fall into this category. Meanwhile, the 15 to 24 years age bracket for the primary householder has the lowest median household income of $51,515, with 992 households (2.5%) in this group.
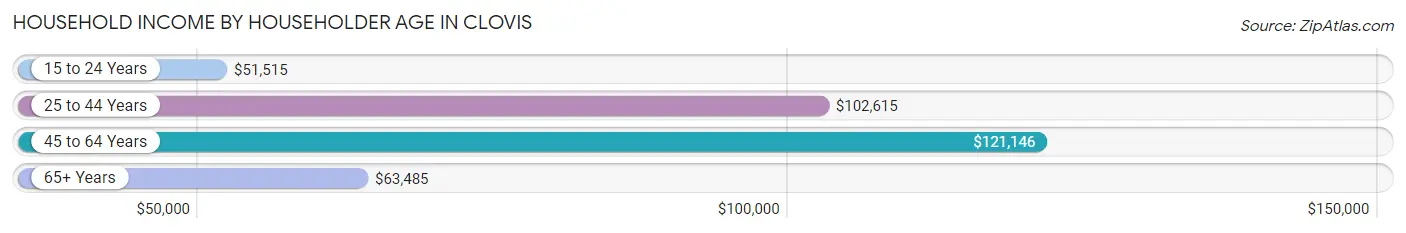
| Income Bracket | # Households | Median Income |
| 15 to 24 Years | 992 (2.5%) | $51,515 |
| 25 to 44 Years | 15,336 (38.2%) | $102,615 |
| 45 to 64 Years | 14,389 (35.8%) | $121,146 |
| 65+ Years | 9,418 (23.5%) | $63,485 |
| Total | 40,135 (100.0%) | $98,554 |
Poverty in Clovis
Income Below Poverty by Sex and Age in Clovis
With 8.4% poverty level for males and 8.5% for females among the residents of Clovis, under 5 year old males and 18 to 24 year old females are the most vulnerable to poverty, with 664 males (16.5%) and 797 females (17.0%) in their respective age groups living below the poverty level.
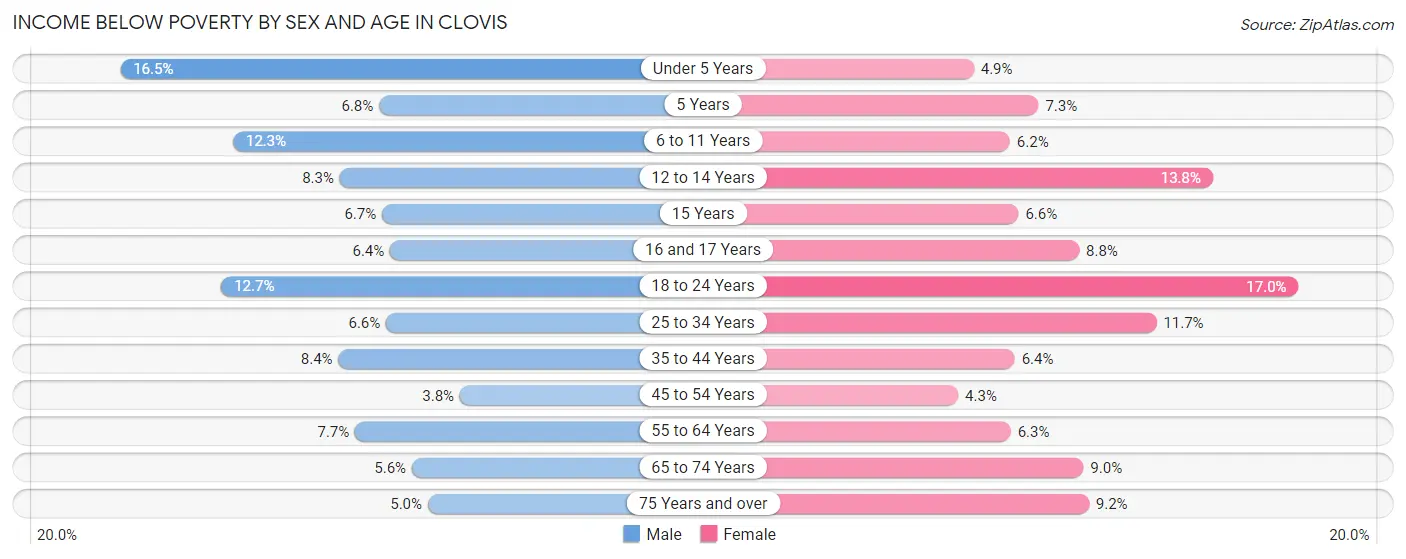
| Age Bracket | Male | Female |
| Under 5 Years | 664 (16.5%) | 194 (4.9%) |
| 5 Years | 51 (6.8%) | 69 (7.3%) |
| 6 to 11 Years | 837 (12.3%) | 346 (6.2%) |
| 12 to 14 Years | 233 (8.3%) | 442 (13.8%) |
| 15 Years | 59 (6.7%) | 68 (6.6%) |
| 16 and 17 Years | 126 (6.4%) | 166 (8.8%) |
| 18 to 24 Years | 543 (12.7%) | 797 (17.0%) |
| 25 to 34 Years | 544 (6.6%) | 1,030 (11.7%) |
| 35 to 44 Years | 683 (8.4%) | 566 (6.4%) |
| 45 to 54 Years | 284 (3.8%) | 273 (4.3%) |
| 55 to 64 Years | 456 (7.7%) | 454 (6.3%) |
| 65 to 74 Years | 239 (5.6%) | 462 (9.0%) |
| 75 Years and over | 125 (5.0%) | 338 (9.2%) |
| Total | 4,844 (8.4%) | 5,205 (8.5%) |
Income Above Poverty by Sex and Age in Clovis
According to the poverty statistics in Clovis, males aged 45 to 54 years and females aged 45 to 54 years are the age groups that are most secure financially, with 96.2% of males and 95.7% of females in these age groups living above the poverty line.
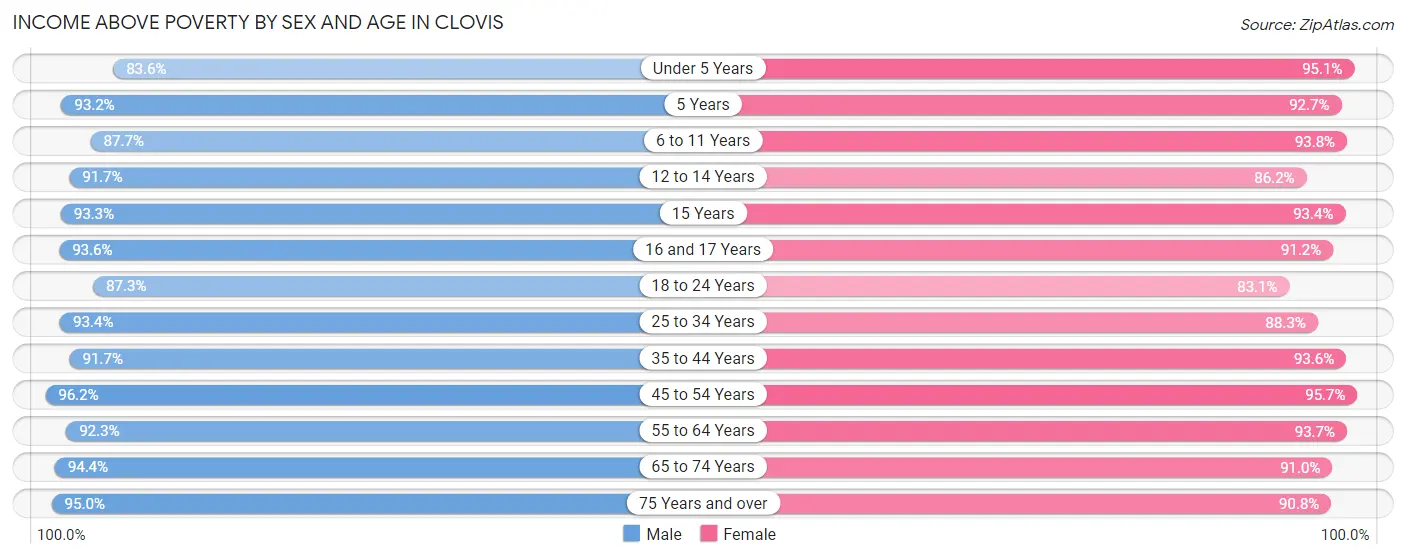
| Age Bracket | Male | Female |
| Under 5 Years | 3,372 (83.6%) | 3,766 (95.1%) |
| 5 Years | 695 (93.2%) | 876 (92.7%) |
| 6 to 11 Years | 5,982 (87.7%) | 5,196 (93.8%) |
| 12 to 14 Years | 2,573 (91.7%) | 2,768 (86.2%) |
| 15 Years | 818 (93.3%) | 968 (93.4%) |
| 16 and 17 Years | 1,833 (93.6%) | 1,719 (91.2%) |
| 18 to 24 Years | 3,732 (87.3%) | 3,904 (83.1%) |
| 25 to 34 Years | 7,727 (93.4%) | 7,788 (88.3%) |
| 35 to 44 Years | 7,496 (91.6%) | 8,254 (93.6%) |
| 45 to 54 Years | 7,114 (96.2%) | 6,049 (95.7%) |
| 55 to 64 Years | 5,446 (92.3%) | 6,787 (93.7%) |
| 65 to 74 Years | 4,010 (94.4%) | 4,689 (91.0%) |
| 75 Years and over | 2,361 (95.0%) | 3,346 (90.8%) |
| Total | 53,159 (91.6%) | 56,110 (91.5%) |
Income Below Poverty Among Married-Couple Families in Clovis
The poverty statistics for married-couple families in Clovis show that 3.3% or 752 of the total 22,645 families live below the poverty line. Families with 5 or more children have the highest poverty rate of 28.9%, comprising of 55 families. On the other hand, families with no children have the lowest poverty rate of 2.3%, which includes 273 families.
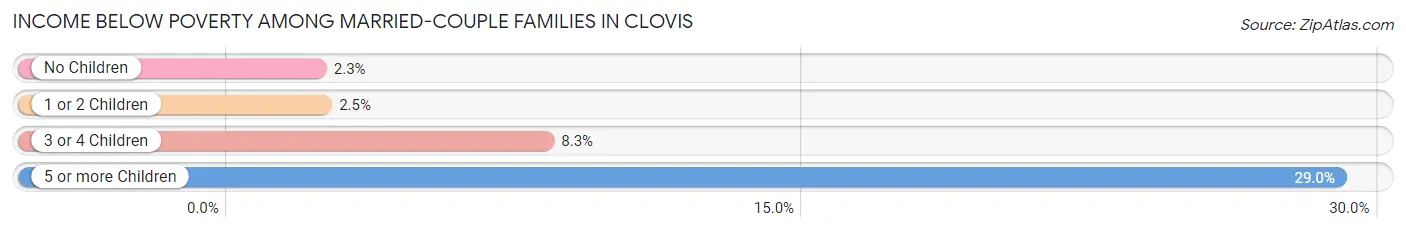
| Children | Above Poverty | Below Poverty |
| No Children | 11,477 (97.7%) | 273 (2.3%) |
| 1 or 2 Children | 7,737 (97.5%) | 195 (2.5%) |
| 3 or 4 Children | 2,544 (91.7%) | 229 (8.3%) |
| 5 or more Children | 135 (71.1%) | 55 (28.9%) |
| Total | 21,893 (96.7%) | 752 (3.3%) |
Income Below Poverty Among Single-Parent Households in Clovis
According to the poverty data in Clovis, 13.7% or 331 single-father households and 14.3% or 768 single-mother households are living below the poverty line. Among single-father households, those with 3 or 4 children have the highest poverty rate, with 93 households (31.2%) experiencing poverty. Likewise, among single-mother households, those with 1 or 2 children have the highest poverty rate, with 522 households (18.6%) falling below the poverty line.
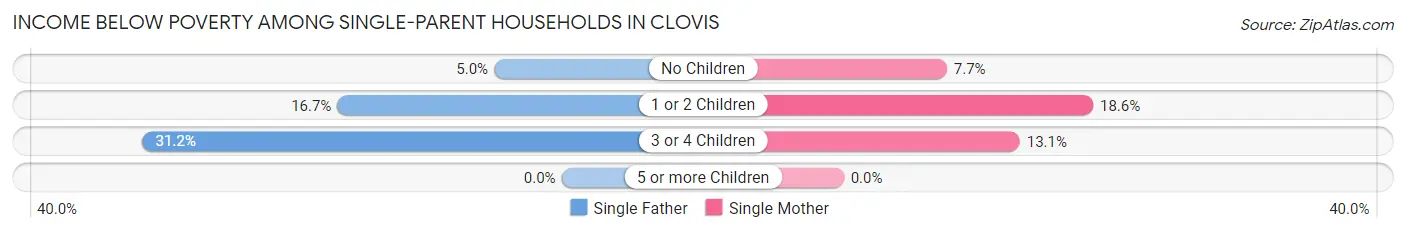
| Children | Single Father | Single Mother |
| No Children | 47 (5.0%) | 120 (7.7%) |
| 1 or 2 Children | 191 (16.7%) | 522 (18.6%) |
| 3 or 4 Children | 93 (31.2%) | 126 (13.1%) |
| 5 or more Children | 0 (0.0%) | 0 (0.0%) |
| Total | 331 (13.7%) | 768 (14.3%) |
Income Below Poverty Among Married-Couple vs Single-Parent Households in Clovis
The poverty data for Clovis shows that 752 of the married-couple family households (3.3%) and 1,099 of the single-parent households (14.1%) are living below the poverty level. Within the married-couple family households, those with 5 or more children have the highest poverty rate, with 55 households (28.9%) falling below the poverty line. Among the single-parent households, those with 1 or 2 children have the highest poverty rate, with 713 household (18.0%) living below poverty.
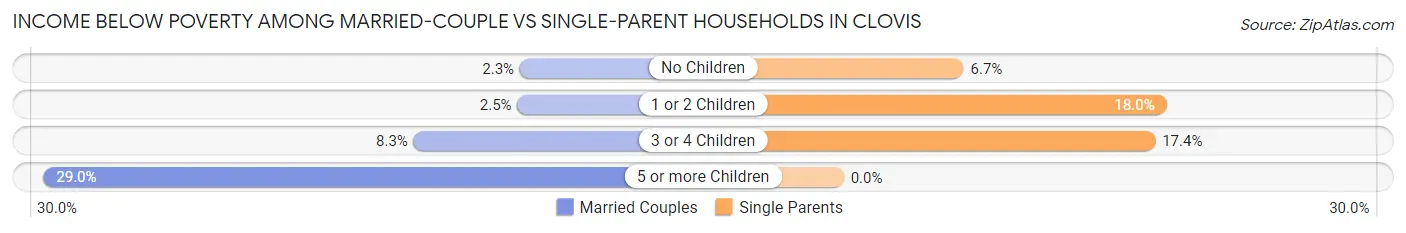
| Children | Married-Couple Families | Single-Parent Households |
| No Children | 273 (2.3%) | 167 (6.7%) |
| 1 or 2 Children | 195 (2.5%) | 713 (18.0%) |
| 3 or 4 Children | 229 (8.3%) | 219 (17.4%) |
| 5 or more Children | 55 (28.9%) | 0 (0.0%) |
| Total | 752 (3.3%) | 1,099 (14.1%) |
Race in Clovis
The most populous races in Clovis are White / Caucasian (71,512 | 59.3%), Hispanic or Latino (41,422 | 34.3%), and Two or more Races (17,963 | 14.9%).
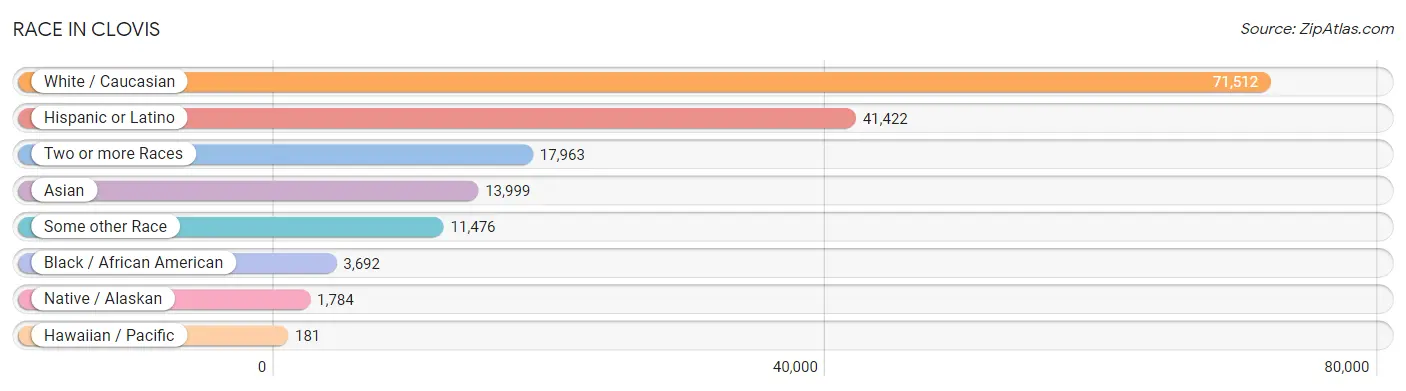
| Race | # Population | % Population |
| Asian | 13,999 | 11.6% |
| Black / African American | 3,692 | 3.1% |
| Hawaiian / Pacific | 181 | 0.2% |
| Hispanic or Latino | 41,422 | 34.3% |
| Native / Alaskan | 1,784 | 1.5% |
| White / Caucasian | 71,512 | 59.3% |
| Two or more Races | 17,963 | 14.9% |
| Some other Race | 11,476 | 9.5% |
| Total | 120,607 | 100.0% |
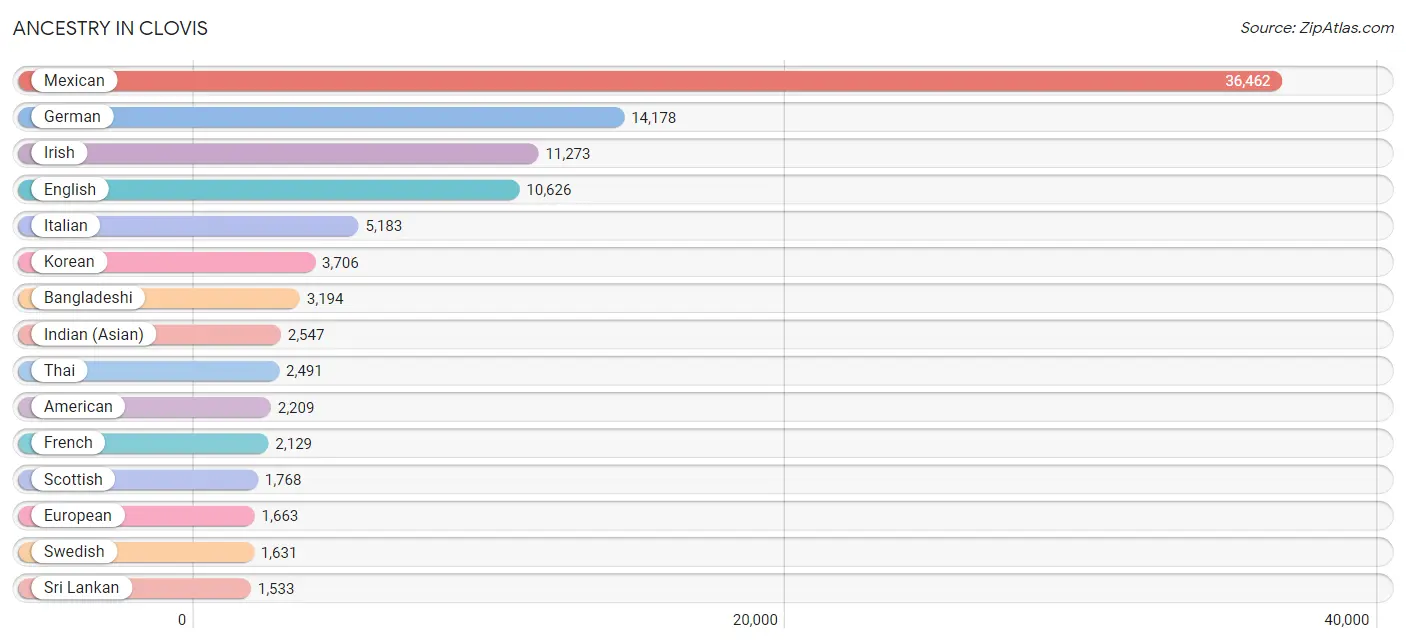
Ancestry in Clovis
The most populous ancestries reported in Clovis are Mexican (36,462 | 30.2%), German (14,178 | 11.8%), Irish (11,273 | 9.3%), English (10,626 | 8.8%), and Italian (5,183 | 4.3%), together accounting for 64.4% of all Clovis residents.
| Ancestry | # Population | % Population |
| African | 244 | 0.2% |
| American | 2,209 | 1.8% |
| Apache | 391 | 0.3% |
| Arab | 681 | 0.6% |
| Arapaho | 11 | 0.0% |
| Argentinean | 110 | 0.1% |
| Armenian | 1,163 | 1.0% |
| Assyrian / Chaldean / Syriac | 11 | 0.0% |
| Australian | 47 | 0.0% |
| Austrian | 108 | 0.1% |
| Bahamian | 11 | 0.0% |
| Bangladeshi | 3,194 | 2.6% |
| Basque | 140 | 0.1% |
| Belgian | 30 | 0.0% |
| Bhutanese | 1,038 | 0.9% |
| Blackfeet | 87 | 0.1% |
| Bolivian | 22 | 0.0% |
| Brazilian | 13 | 0.0% |
| British | 492 | 0.4% |
| Burmese | 593 | 0.5% |
| Canadian | 119 | 0.1% |
| Central American | 1,109 | 0.9% |
| Central American Indian | 138 | 0.1% |
| Cherokee | 580 | 0.5% |
| Chickasaw | 47 | 0.0% |
| Chilean | 9 | 0.0% |
| Chippewa | 31 | 0.0% |
| Choctaw | 62 | 0.1% |
| Colombian | 117 | 0.1% |
| Comanche | 39 | 0.0% |
| Costa Rican | 224 | 0.2% |
| Cree | 11 | 0.0% |
| Creek | 27 | 0.0% |
| Croatian | 132 | 0.1% |
| Cuban | 350 | 0.3% |
| Czech | 120 | 0.1% |
| Czechoslovakian | 140 | 0.1% |
| Danish | 950 | 0.8% |
| Dutch | 1,187 | 1.0% |
| Eastern European | 257 | 0.2% |
| Egyptian | 27 | 0.0% |
| English | 10,626 | 8.8% |
| Ethiopian | 191 | 0.2% |
| European | 1,663 | 1.4% |
| Filipino | 21 | 0.0% |
| Finnish | 108 | 0.1% |
| French | 2,129 | 1.8% |
| French American Indian | 44 | 0.0% |
| French Canadian | 239 | 0.2% |
| German | 14,178 | 11.8% |
| Ghanaian | 83 | 0.1% |
| Greek | 347 | 0.3% |
| Guamanian / Chamorro | 104 | 0.1% |
| Guatemalan | 212 | 0.2% |
| Haitian | 51 | 0.0% |
| Honduran | 149 | 0.1% |
| Hungarian | 271 | 0.2% |
| Indian (Asian) | 2,547 | 2.1% |
| Iranian | 164 | 0.1% |
| Iraqi | 94 | 0.1% |
| Irish | 11,273 | 9.3% |
| Iroquois | 63 | 0.1% |
| Israeli | 12 | 0.0% |
| Italian | 5,183 | 4.3% |
| Jamaican | 46 | 0.0% |
| Japanese | 1,310 | 1.1% |
| Jordanian | 136 | 0.1% |
| Kenyan | 16 | 0.0% |
| Korean | 3,706 | 3.1% |
| Laotian | 252 | 0.2% |
| Latvian | 37 | 0.0% |
| Lebanese | 330 | 0.3% |
| Lithuanian | 46 | 0.0% |
| Malaysian | 392 | 0.3% |
| Mexican | 36,462 | 30.2% |
| Mexican American Indian | 208 | 0.2% |
| Moroccan | 8 | 0.0% |
| Native Hawaiian | 160 | 0.1% |
| Nepalese | 47 | 0.0% |
| Nicaraguan | 20 | 0.0% |
| Nigerian | 382 | 0.3% |
| Northern European | 164 | 0.1% |
| Norwegian | 1,349 | 1.1% |
| Okinawan | 6 | 0.0% |
| Osage | 33 | 0.0% |
| Paiute | 6 | 0.0% |
| Pakistani | 337 | 0.3% |
| Panamanian | 7 | 0.0% |
| Peruvian | 120 | 0.1% |
| Polish | 747 | 0.6% |
| Portuguese | 1,529 | 1.3% |
| Pueblo | 7 | 0.0% |
| Puerto Rican | 699 | 0.6% |
| Puget Sound Salish | 553 | 0.5% |
| Romanian | 12 | 0.0% |
| Russian | 476 | 0.4% |
| Salvadoran | 475 | 0.4% |
| Samoan | 15 | 0.0% |
| Scandinavian | 566 | 0.5% |
| Scotch-Irish | 668 | 0.5% |
| Scottish | 1,768 | 1.5% |
| Serbian | 32 | 0.0% |
| Sierra Leonean | 25 | 0.0% |
| Sioux | 94 | 0.1% |
| Slovak | 22 | 0.0% |
| Slovene | 39 | 0.0% |
| South African | 77 | 0.1% |
| South American | 385 | 0.3% |
| Spaniard | 1,069 | 0.9% |
| Spanish | 322 | 0.3% |
| Spanish American | 23 | 0.0% |
| Spanish American Indian | 6 | 0.0% |
| Sri Lankan | 1,533 | 1.3% |
| Subsaharan African | 1,026 | 0.9% |
| Swedish | 1,631 | 1.3% |
| Swiss | 364 | 0.3% |
| Syrian | 74 | 0.1% |
| Thai | 2,491 | 2.1% |
| Tohono O'Odham | 10 | 0.0% |
| Tongan | 71 | 0.1% |
| Trinidadian and Tobagonian | 65 | 0.1% |
| Ugandan | 42 | 0.0% |
| Ukrainian | 183 | 0.2% |
| Venezuelan | 7 | 0.0% |
| Welsh | 487 | 0.4% |
| Yaqui | 146 | 0.1% |
| Yugoslavian | 93 | 0.1% | View All 127 Rows |
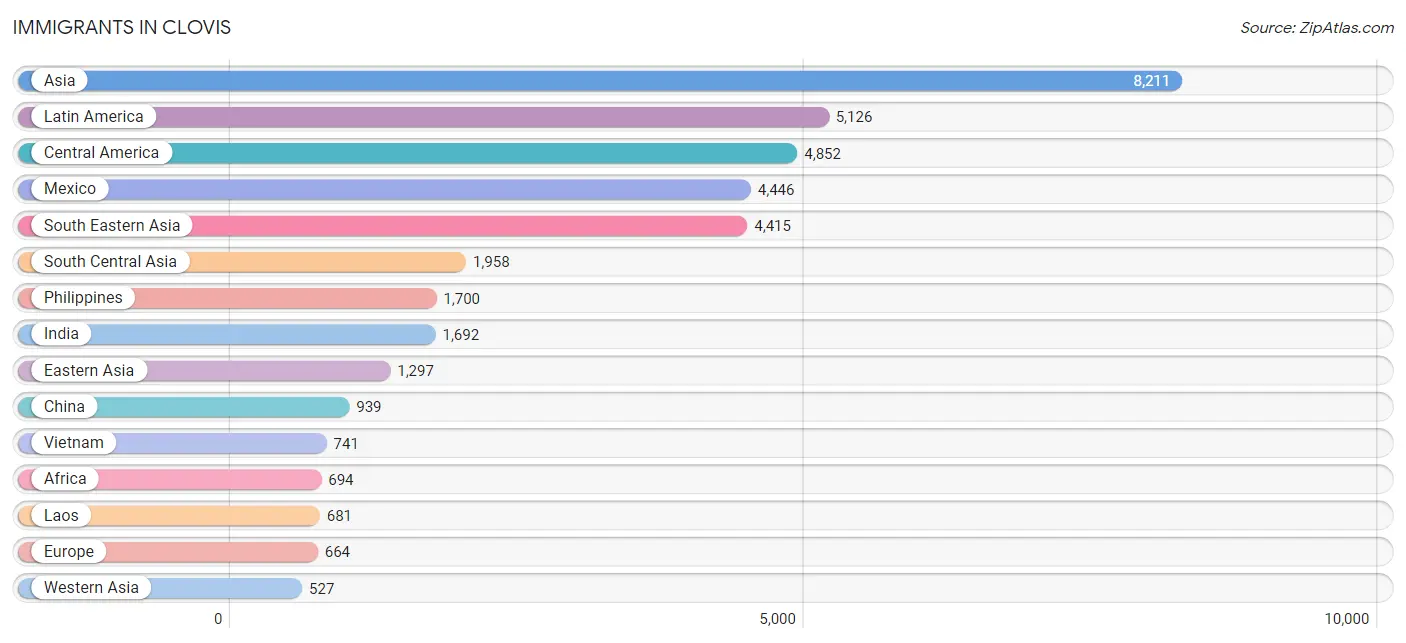
Immigrants in Clovis
The most numerous immigrant groups reported in Clovis came from Asia (8,211 | 6.8%), Latin America (5,126 | 4.3%), Central America (4,852 | 4.0%), Mexico (4,446 | 3.7%), and South Eastern Asia (4,415 | 3.7%), together accounting for 22.4% of all Clovis residents.
| Immigration Origin | # Population | % Population |
| Africa | 694 | 0.6% |
| Argentina | 89 | 0.1% |
| Armenia | 147 | 0.1% |
| Asia | 8,211 | 6.8% |
| Australia | 47 | 0.0% |
| Austria | 15 | 0.0% |
| Azores | 88 | 0.1% |
| Belgium | 19 | 0.0% |
| Belize | 8 | 0.0% |
| Bolivia | 22 | 0.0% |
| Brazil | 36 | 0.0% |
| Cambodia | 501 | 0.4% |
| Canada | 246 | 0.2% |
| Caribbean | 46 | 0.0% |
| Central America | 4,852 | 4.0% |
| Chile | 7 | 0.0% |
| China | 939 | 0.8% |
| Colombia | 7 | 0.0% |
| Costa Rica | 112 | 0.1% |
| Croatia | 8 | 0.0% |
| Eastern Africa | 205 | 0.2% |
| Eastern Asia | 1,297 | 1.1% |
| Eastern Europe | 85 | 0.1% |
| Egypt | 97 | 0.1% |
| El Salvador | 188 | 0.2% |
| England | 63 | 0.1% |
| Ethiopia | 156 | 0.1% |
| Europe | 664 | 0.5% |
| Fiji | 24 | 0.0% |
| France | 70 | 0.1% |
| Germany | 42 | 0.0% |
| Ghana | 66 | 0.1% |
| Greece | 24 | 0.0% |
| Guatemala | 76 | 0.1% |
| Honduras | 19 | 0.0% |
| Hong Kong | 39 | 0.0% |
| India | 1,692 | 1.4% |
| Indonesia | 258 | 0.2% |
| Iran | 33 | 0.0% |
| Iraq | 62 | 0.1% |
| Italy | 57 | 0.1% |
| Jamaica | 16 | 0.0% |
| Japan | 24 | 0.0% |
| Jordan | 57 | 0.1% |
| Kazakhstan | 6 | 0.0% |
| Kenya | 16 | 0.0% |
| Korea | 334 | 0.3% |
| Laos | 681 | 0.6% |
| Latin America | 5,126 | 4.3% |
| Lebanon | 131 | 0.1% |
| Liberia | 21 | 0.0% |
| Malaysia | 2 | 0.0% |
| Mexico | 4,446 | 3.7% |
| Netherlands | 44 | 0.0% |
| Nicaragua | 3 | 0.0% |
| Nigeria | 230 | 0.2% |
| Northern Africa | 97 | 0.1% |
| Northern Europe | 166 | 0.1% |
| Norway | 9 | 0.0% |
| Oceania | 153 | 0.1% |
| Pakistan | 179 | 0.2% |
| Peru | 67 | 0.1% |
| Philippines | 1,700 | 1.4% |
| Portugal | 88 | 0.1% |
| Russia | 16 | 0.0% |
| Saudi Arabia | 20 | 0.0% |
| Scotland | 28 | 0.0% |
| Sierra Leone | 44 | 0.0% |
| Singapore | 15 | 0.0% |
| South Africa | 31 | 0.0% |
| South America | 228 | 0.2% |
| South Central Asia | 1,958 | 1.6% |
| South Eastern Asia | 4,415 | 3.7% |
| Southern Europe | 180 | 0.2% |
| Spain | 11 | 0.0% |
| Sri Lanka | 48 | 0.0% |
| Sweden | 9 | 0.0% |
| Switzerland | 19 | 0.0% |
| Syria | 94 | 0.1% |
| Taiwan | 77 | 0.1% |
| Thailand | 455 | 0.4% |
| Trinidad and Tobago | 30 | 0.0% |
| Turkey | 5 | 0.0% |
| Uganda | 33 | 0.0% |
| Ukraine | 55 | 0.1% |
| Vietnam | 741 | 0.6% |
| Western Africa | 361 | 0.3% |
| Western Asia | 527 | 0.4% |
| Western Europe | 209 | 0.2% |
| Yemen | 11 | 0.0% | View All 90 Rows |
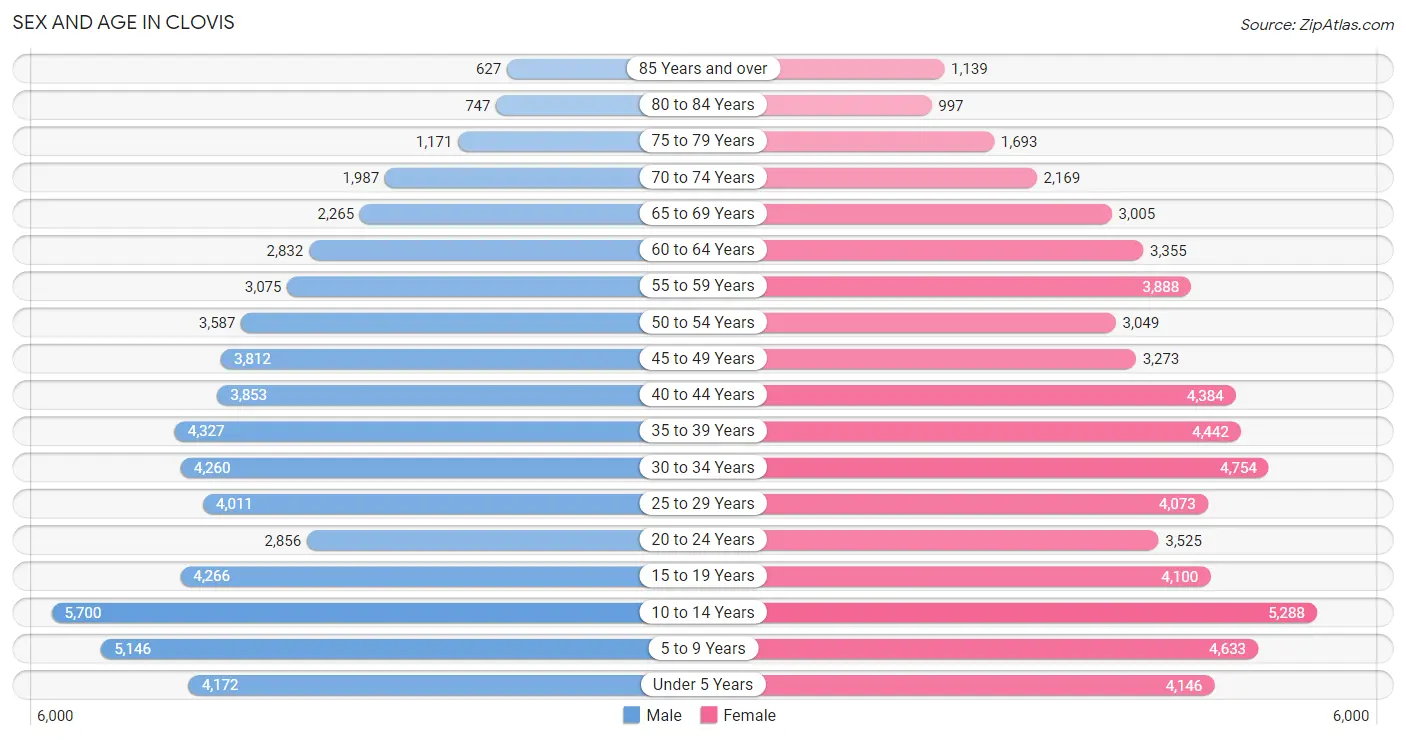
Sex and Age in Clovis
Sex and Age in Clovis
The most populous age groups in Clovis are 10 to 14 Years (5,700 | 9.7%) for men and 10 to 14 Years (5,288 | 8.5%) for women.
| Age Bracket | Male | Female |
| Under 5 Years | 4,172 (7.1%) | 4,146 (6.7%) |
| 5 to 9 Years | 5,146 (8.8%) | 4,633 (7.5%) |
| 10 to 14 Years | 5,700 (9.7%) | 5,288 (8.5%) |
| 15 to 19 Years | 4,266 (7.3%) | 4,100 (6.6%) |
| 20 to 24 Years | 2,856 (4.9%) | 3,525 (5.7%) |
| 25 to 29 Years | 4,011 (6.8%) | 4,073 (6.6%) |
| 30 to 34 Years | 4,260 (7.3%) | 4,754 (7.7%) |
| 35 to 39 Years | 4,327 (7.4%) | 4,442 (7.2%) |
| 40 to 44 Years | 3,853 (6.6%) | 4,384 (7.1%) |
| 45 to 49 Years | 3,812 (6.5%) | 3,273 (5.3%) |
| 50 to 54 Years | 3,587 (6.1%) | 3,049 (4.9%) |
| 55 to 59 Years | 3,075 (5.2%) | 3,888 (6.3%) |
| 60 to 64 Years | 2,832 (4.8%) | 3,355 (5.4%) |
| 65 to 69 Years | 2,265 (3.9%) | 3,005 (4.9%) |
| 70 to 74 Years | 1,987 (3.4%) | 2,169 (3.5%) |
| 75 to 79 Years | 1,171 (2.0%) | 1,693 (2.7%) |
| 80 to 84 Years | 747 (1.3%) | 997 (1.6%) |
| 85 Years and over | 627 (1.1%) | 1,139 (1.8%) |
| Total | 58,694 (100.0%) | 61,913 (100.0%) |
Families and Households in Clovis
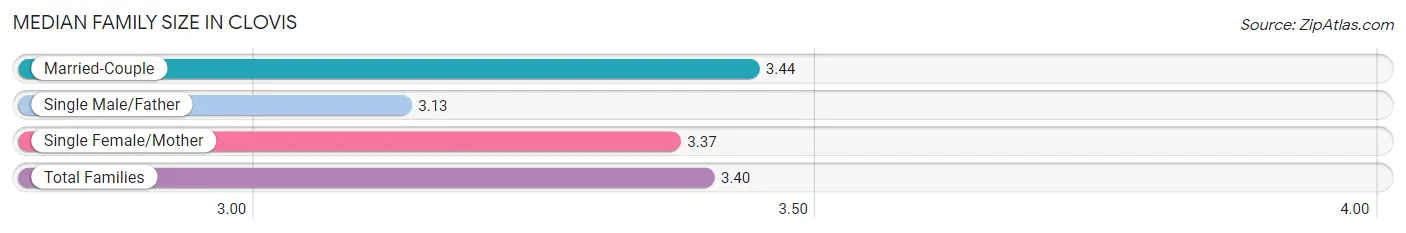
Median Family Size in Clovis
The median family size in Clovis is 3.40 persons per family, with married-couple families (22,645 | 74.4%) accounting for the largest median family size of 3.44 persons per family. On the other hand, single male/father families (2,413 | 7.9%) represent the smallest median family size with 3.13 persons per family.
| Family Type | # Families | Family Size |
| Married-Couple | 22,645 (74.4%) | 3.44 |
| Single Male/Father | 2,413 (7.9%) | 3.13 |
| Single Female/Mother | 5,363 (17.6%) | 3.37 |
| Total Families | 30,421 (100.0%) | 3.40 |
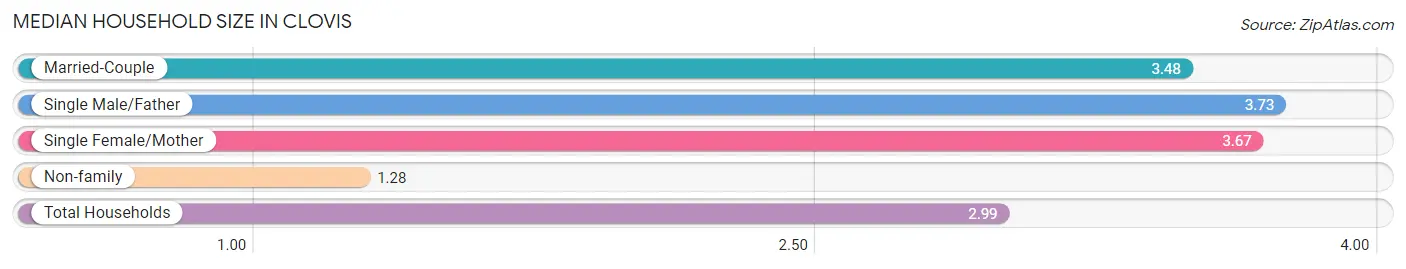
Median Household Size in Clovis
The median household size in Clovis is 2.99 persons per household, with single male/father households (2,413 | 6.0%) accounting for the largest median household size of 3.73 persons per household. non-family households (9,714 | 24.2%) represent the smallest median household size with 1.28 persons per household.
| Household Type | # Households | Household Size |
| Married-Couple | 22,645 (56.4%) | 3.48 |
| Single Male/Father | 2,413 (6.0%) | 3.73 |
| Single Female/Mother | 5,363 (13.4%) | 3.67 |
| Non-family | 9,714 (24.2%) | 1.28 |
| Total Households | 40,135 (100.0%) | 2.99 |
Household Size by Marriage Status in Clovis
Out of a total of 40,135 households in Clovis, 30,421 (75.8%) are family households, while 9,714 (24.2%) are nonfamily households. The most numerous type of family households are 2-person households, comprising 10,804, and the most common type of nonfamily households are 1-person households, comprising 8,035.
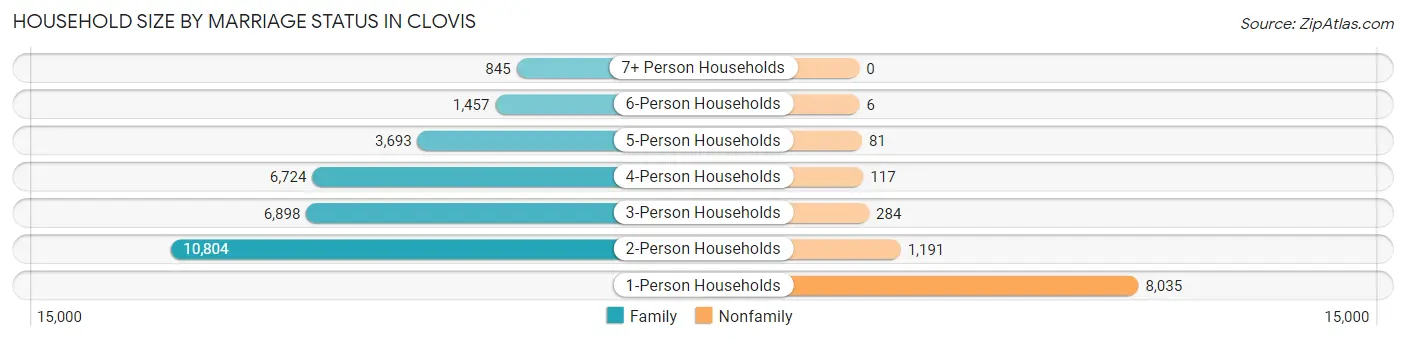
| Household Size | Family Households | Nonfamily Households |
| 1-Person Households | - | 8,035 (20.0%) |
| 2-Person Households | 10,804 (26.9%) | 1,191 (3.0%) |
| 3-Person Households | 6,898 (17.2%) | 284 (0.7%) |
| 4-Person Households | 6,724 (16.8%) | 117 (0.3%) |
| 5-Person Households | 3,693 (9.2%) | 81 (0.2%) |
| 6-Person Households | 1,457 (3.6%) | 6 (0.0%) |
| 7+ Person Households | 845 (2.1%) | 0 (0.0%) |
| Total | 30,421 (75.8%) | 9,714 (24.2%) |
Female Fertility in Clovis
Fertility by Age in Clovis
Average fertility rate in Clovis is 51.0 births per 1,000 women. Women in the age bracket of 20 to 34 years have the highest fertility rate with 80.0 births per 1,000 women. Women in the age bracket of 20 to 34 years acount for 66.3% of all women with births.
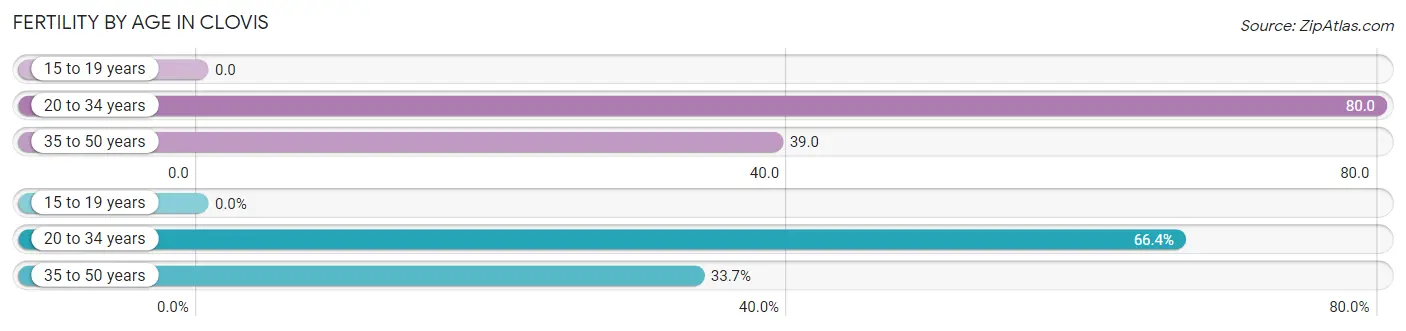
| Age Bracket | Women with Births | Births / 1,000 Women |
| 15 to 19 years | 0 (0.0%) | 0.0 |
| 20 to 34 years | 984 (66.3%) | 80.0 |
| 35 to 50 years | 499 (33.7%) | 39.0 |
| Total | 1,483 (100.0%) | 51.0 |
Fertility by Age by Marriage Status in Clovis
77.8% of women with births (1,483) in Clovis are married. The highest percentage of unmarried women with births falls into 35 to 50 years age bracket with 24.8% of them unmarried at the time of birth, while the lowest percentage of unmarried women with births belong to 20 to 34 years age bracket with 20.8% of them unmarried.
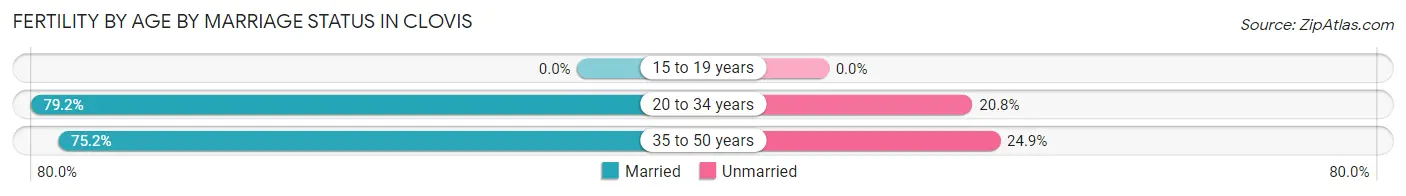
| Age Bracket | Married | Unmarried |
| 15 to 19 years | 0 (0.0%) | 0 (0.0%) |
| 20 to 34 years | 779 (79.2%) | 205 (20.8%) |
| 35 to 50 years | 375 (75.1%) | 124 (24.8%) |
| Total | 1,154 (77.8%) | 329 (22.2%) |
Fertility by Education in Clovis
Average fertility rate in Clovis is 51.0 births per 1,000 women. Women with the education attainment of high school diploma have the highest fertility rate of 77.0 births per 1,000 women, while women with the education attainment of less than high school have the lowest fertility at 1.0 births per 1,000 women. Women with the education attainment of bachelor's degree represent 35.3% of all women with births.
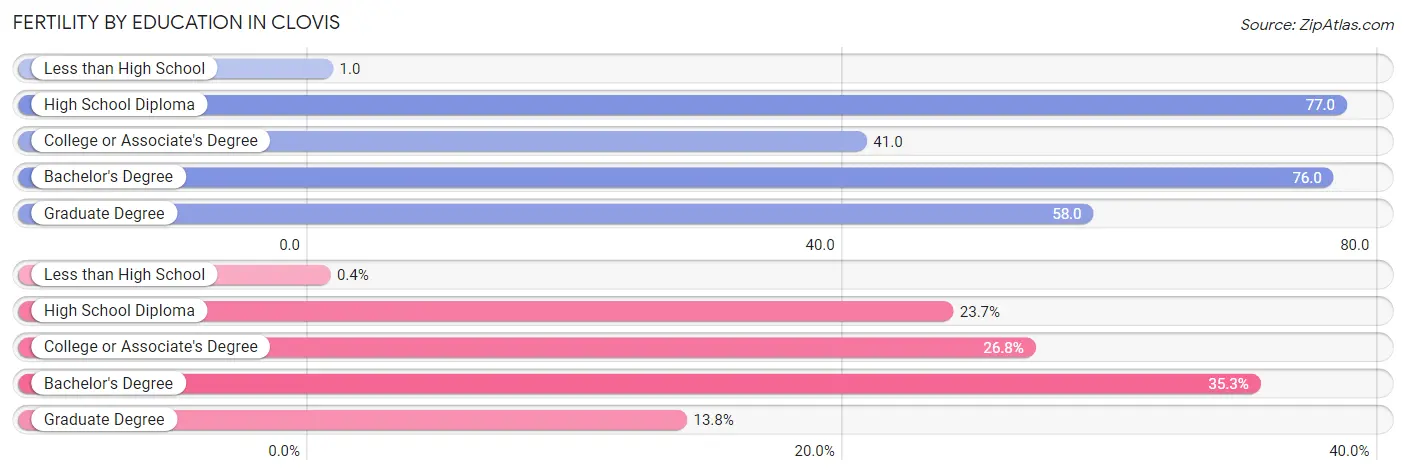
| Educational Attainment | Women with Births | Births / 1,000 Women |
| Less than High School | 6 (0.4%) | 1.0 |
| High School Diploma | 352 (23.7%) | 77.0 |
| College or Associate's Degree | 398 (26.8%) | 41.0 |
| Bachelor's Degree | 523 (35.3%) | 76.0 |
| Graduate Degree | 204 (13.8%) | 58.0 |
| Total | 1,483 (100.0%) | 51.0 |
Fertility by Education by Marriage Status in Clovis
22.2% of women with births in Clovis are unmarried. Women with the educational attainment of less than high school are most likely to be married with 100.0% of them married at childbirth, while women with the educational attainment of high school diploma are least likely to be married with 29.3% of them unmarried at childbirth.
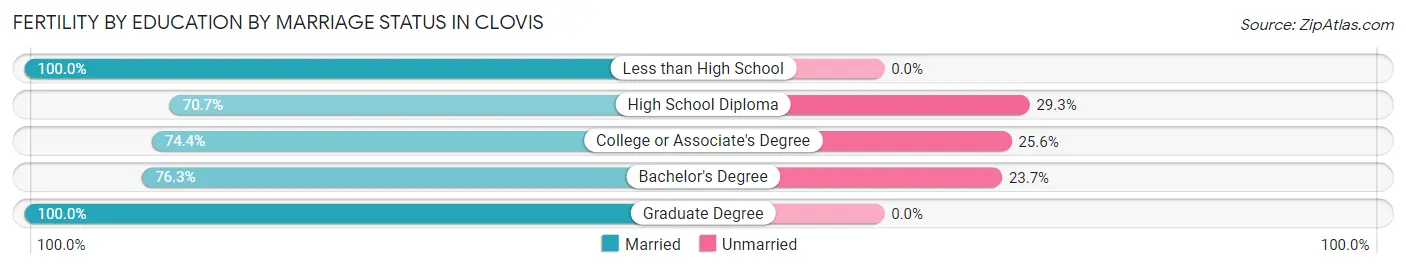
| Educational Attainment | Married | Unmarried |
| Less than High School | 6 (100.0%) | 0 (0.0%) |
| High School Diploma | 249 (70.7%) | 103 (29.3%) |
| College or Associate's Degree | 296 (74.4%) | 102 (25.6%) |
| Bachelor's Degree | 399 (76.3%) | 124 (23.7%) |
| Graduate Degree | 204 (100.0%) | 0 (0.0%) |
| Total | 1,154 (77.8%) | 329 (22.2%) |
Employment Characteristics in Clovis
Employment by Class of Employer in Clovis
Among the 54,546 employed individuals in Clovis, private company employees (32,297 | 59.2%), local government employees (7,712 | 14.1%), and not-for-profit organizations (3,867 | 7.1%) make up the most common classes of employment.
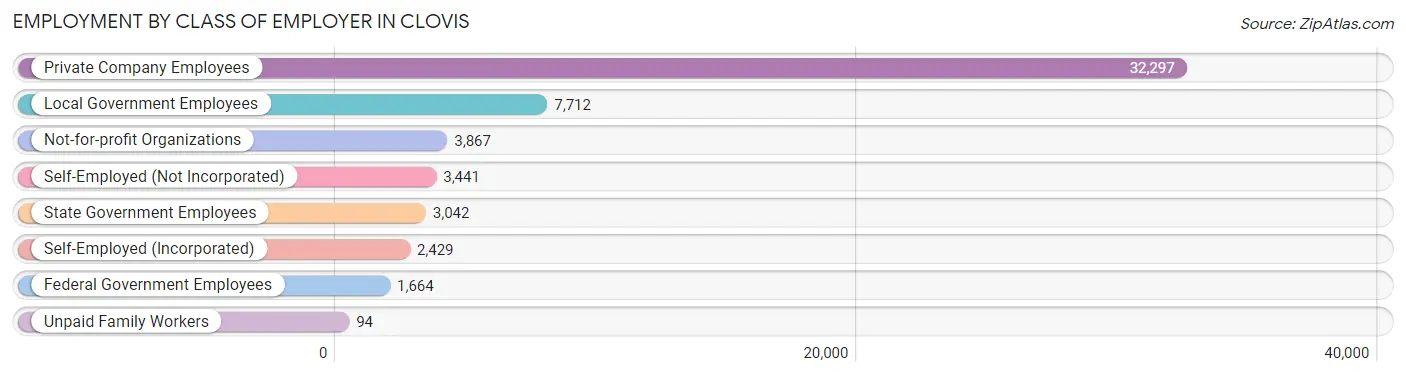
| Employer Class | # Employees | % Employees |
| Private Company Employees | 32,297 | 59.2% |
| Self-Employed (Incorporated) | 2,429 | 4.4% |
| Self-Employed (Not Incorporated) | 3,441 | 6.3% |
| Not-for-profit Organizations | 3,867 | 7.1% |
| Local Government Employees | 7,712 | 14.1% |
| State Government Employees | 3,042 | 5.6% |
| Federal Government Employees | 1,664 | 3.0% |
| Unpaid Family Workers | 94 | 0.2% |
| Total | 54,546 | 100.0% |
Employment Status by Age in Clovis
According to the labor force statistics for Clovis, out of the total population over 16 years of age (89,608), 66.7% or 59,769 individuals are in the labor force, with 6.3% or 3,765 of them unemployed. The age group with the highest labor force participation rate is 45 to 54 years, with 87.6% or 12,020 individuals in the labor force. Within the labor force, the 16 to 19 years age range has the highest percentage of unemployed individuals, with 20.8% or 413 of them being unemployed.
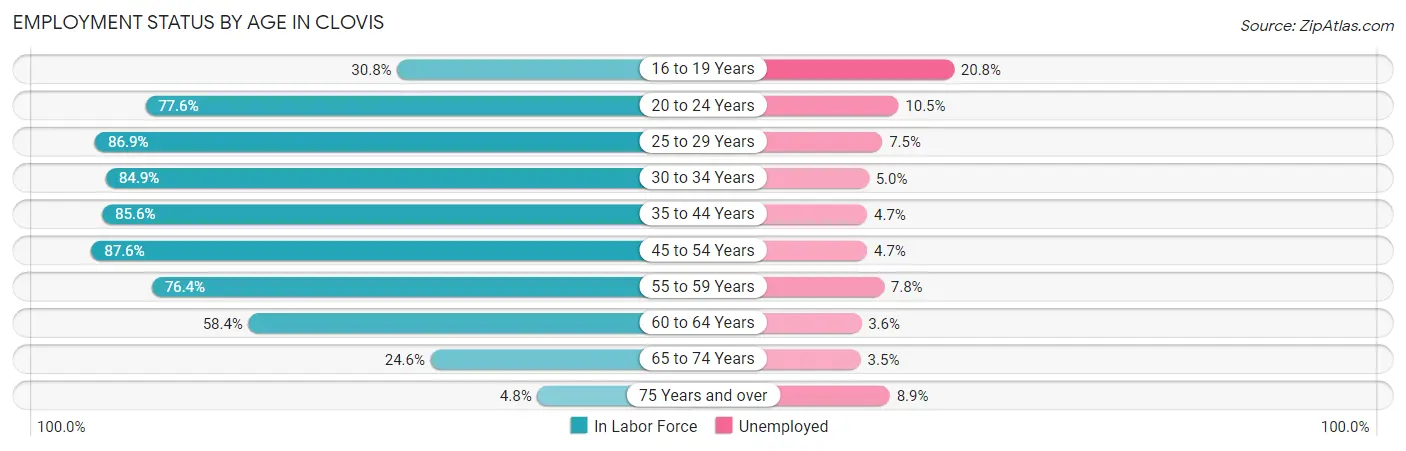
| Age Bracket | In Labor Force | Unemployed |
| 16 to 19 Years | 1,987 (30.8%) | 413 (20.8%) |
| 20 to 24 Years | 4,952 (77.6%) | 520 (10.5%) |
| 25 to 29 Years | 7,025 (86.9%) | 527 (7.5%) |
| 30 to 34 Years | 7,653 (84.9%) | 383 (5.0%) |
| 35 to 44 Years | 14,557 (85.6%) | 684 (4.7%) |
| 45 to 54 Years | 12,020 (87.6%) | 565 (4.7%) |
| 55 to 59 Years | 5,320 (76.4%) | 415 (7.8%) |
| 60 to 64 Years | 3,613 (58.4%) | 130 (3.6%) |
| 65 to 74 Years | 2,319 (24.6%) | 81 (3.5%) |
| 75 Years and over | 306 (4.8%) | 27 (8.9%) |
| Total | 59,769 (66.7%) | 3,765 (6.3%) |
Employment Status by Educational Attainment in Clovis
According to labor force statistics for Clovis, 82.3% of individuals (50,182) out of the total population between 25 and 64 years of age (60,975) are in the labor force, with 5.4% or 2,710 of them being unemployed. The group with the highest labor force participation rate are those with the educational attainment of bachelor's degree or higher, with 89.8% or 20,333 individuals in the labor force. Within the labor force, individuals with less than high school education have the highest percentage of unemployment, with 7.7% or 268 of them being unemployed.
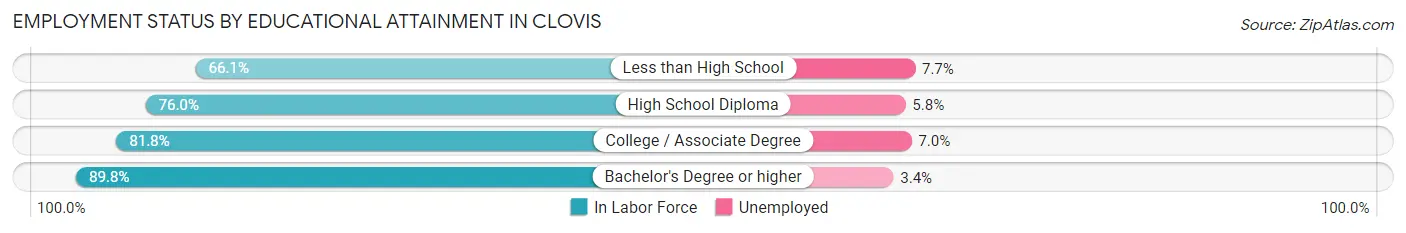
| Educational Attainment | In Labor Force | Unemployed |
| Less than High School | 3,485 (66.1%) | 406 (7.7%) |
| High School Diploma | 8,770 (76.0%) | 669 (5.8%) |
| College / Associate Degree | 17,605 (81.8%) | 1,507 (7.0%) |
| Bachelor's Degree or higher | 20,333 (89.8%) | 770 (3.4%) |
| Total | 50,182 (82.3%) | 3,293 (5.4%) |
Employment Occupations by Sex in Clovis
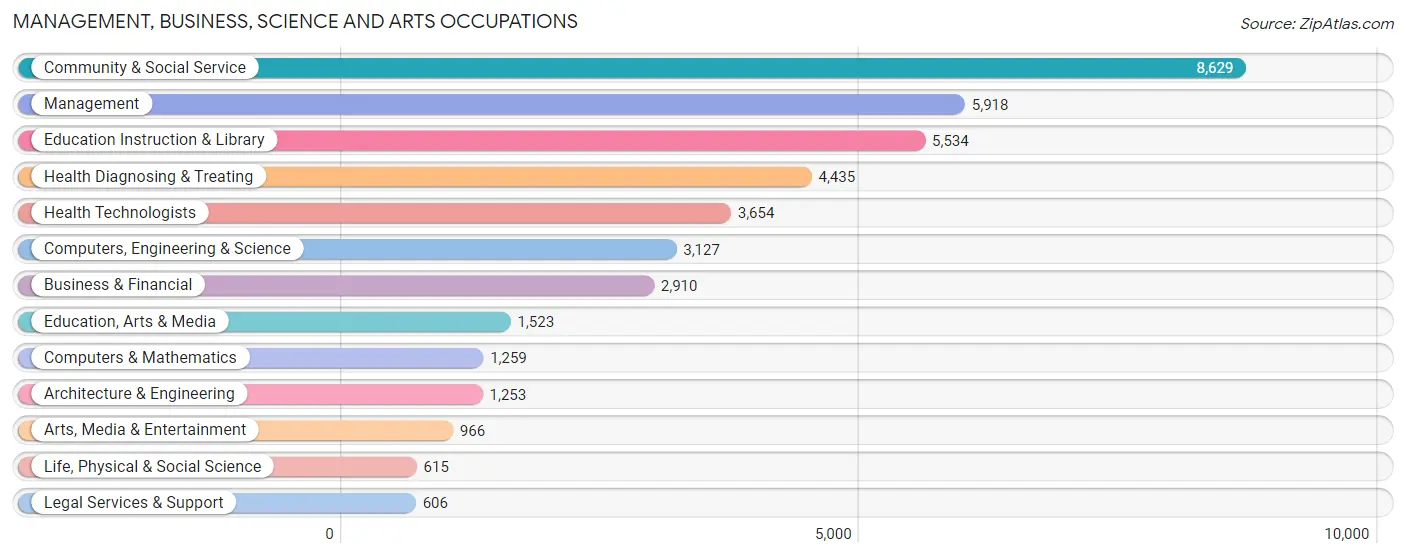
Management, Business, Science and Arts Occupations
The most common Management, Business, Science and Arts occupations in Clovis are Community & Social Service (8,629 | 15.5%), Management (5,918 | 10.6%), Education Instruction & Library (5,534 | 9.9%), Health Diagnosing & Treating (4,435 | 8.0%), and Health Technologists (3,654 | 6.6%).
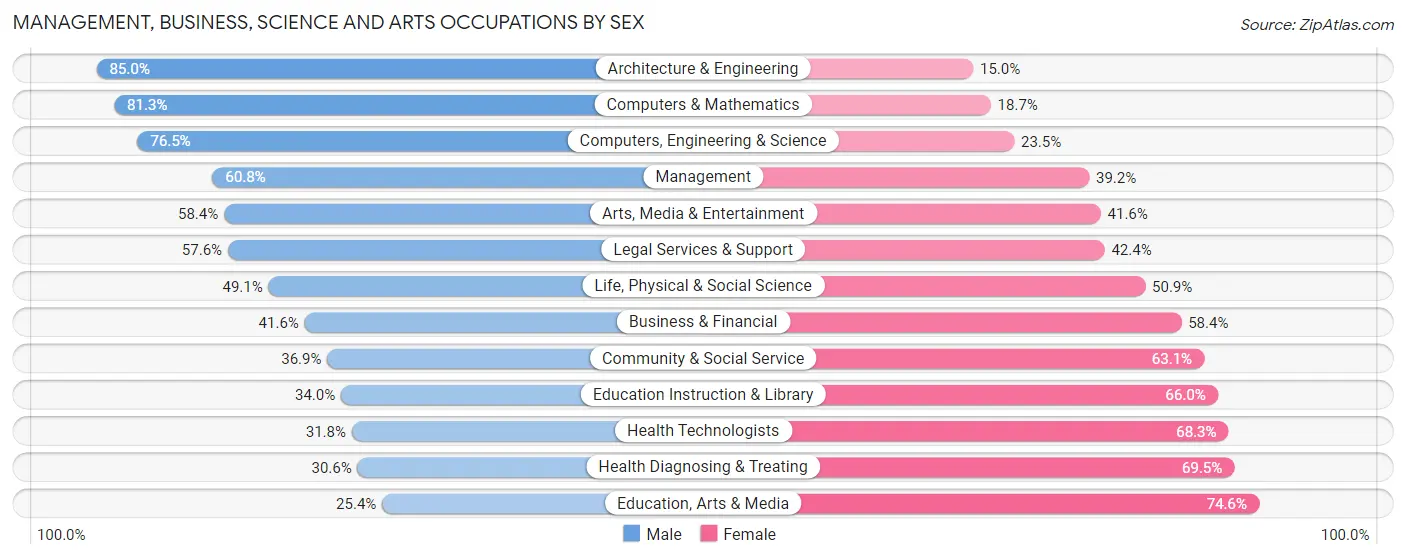
Management, Business, Science and Arts Occupations by Sex
Within the Management, Business, Science and Arts occupations in Clovis, the most male-oriented occupations are Architecture & Engineering (85.0%), Computers & Mathematics (81.3%), and Computers, Engineering & Science (76.5%), while the most female-oriented occupations are Education, Arts & Media (74.6%), Health Diagnosing & Treating (69.5%), and Health Technologists (68.2%).
| Occupation | Male | Female |
| Management | 3,599 (60.8%) | 2,319 (39.2%) |
| Business & Financial | 1,210 (41.6%) | 1,700 (58.4%) |
| Computers, Engineering & Science | 2,391 (76.5%) | 736 (23.5%) |
| Computers & Mathematics | 1,024 (81.3%) | 235 (18.7%) |
| Architecture & Engineering | 1,065 (85.0%) | 188 (15.0%) |
| Life, Physical & Social Science | 302 (49.1%) | 313 (50.9%) |
| Community & Social Service | 3,181 (36.9%) | 5,448 (63.1%) |
| Education, Arts & Media | 387 (25.4%) | 1,136 (74.6%) |
| Legal Services & Support | 349 (57.6%) | 257 (42.4%) |
| Education Instruction & Library | 1,881 (34.0%) | 3,653 (66.0%) |
| Arts, Media & Entertainment | 564 (58.4%) | 402 (41.6%) |
| Health Diagnosing & Treating | 1,355 (30.5%) | 3,080 (69.5%) |
| Health Technologists | 1,160 (31.8%) | 2,494 (68.2%) |
| Total (Category) | 11,736 (46.9%) | 13,283 (53.1%) |
| Total (Overall) | 28,518 (51.1%) | 27,234 (48.8%) |
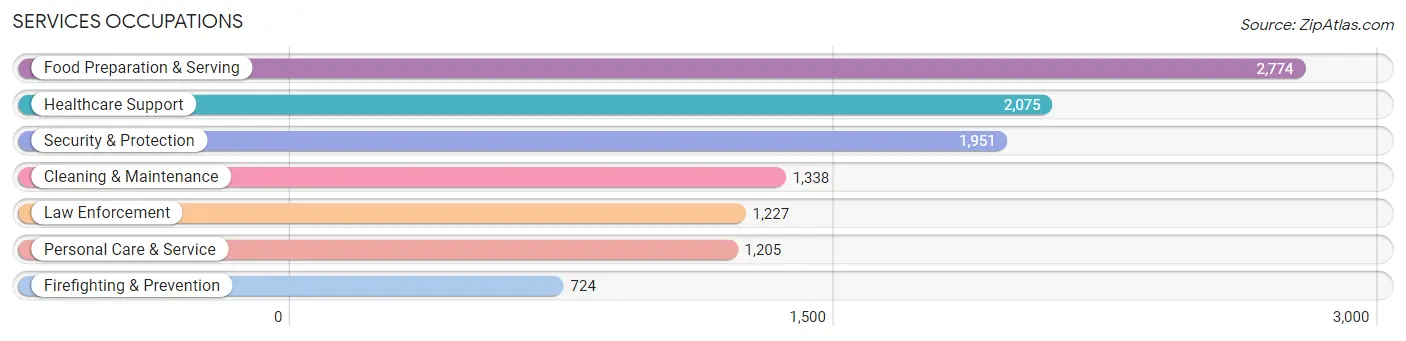
Services Occupations
The most common Services occupations in Clovis are Food Preparation & Serving (2,774 | 5.0%), Healthcare Support (2,075 | 3.7%), Security & Protection (1,951 | 3.5%), Cleaning & Maintenance (1,338 | 2.4%), and Law Enforcement (1,227 | 2.2%).
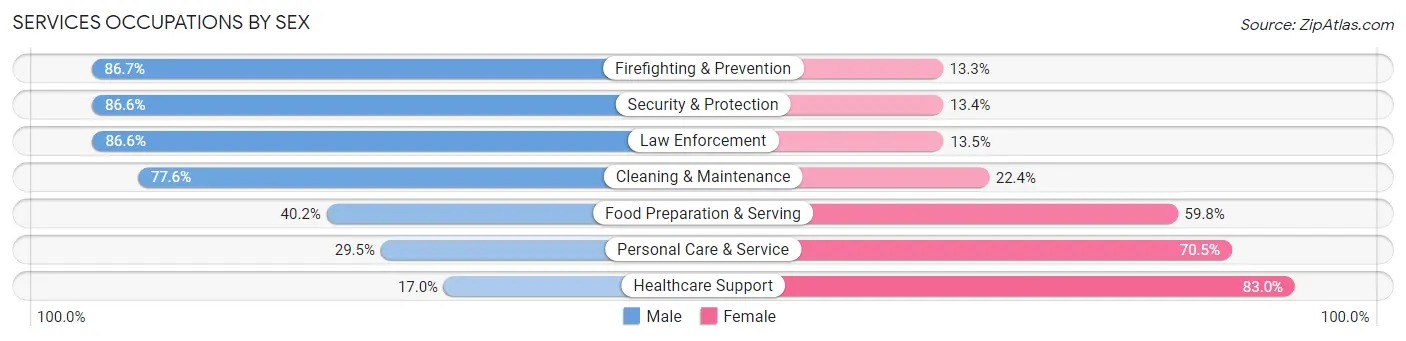
Services Occupations by Sex
Within the Services occupations in Clovis, the most male-oriented occupations are Firefighting & Prevention (86.7%), Security & Protection (86.6%), and Law Enforcement (86.6%), while the most female-oriented occupations are Healthcare Support (83.0%), Personal Care & Service (70.5%), and Food Preparation & Serving (59.8%).
| Occupation | Male | Female |
| Healthcare Support | 352 (17.0%) | 1,723 (83.0%) |
| Security & Protection | 1,690 (86.6%) | 261 (13.4%) |
| Firefighting & Prevention | 628 (86.7%) | 96 (13.3%) |
| Law Enforcement | 1,062 (86.6%) | 165 (13.5%) |
| Food Preparation & Serving | 1,115 (40.2%) | 1,659 (59.8%) |
| Cleaning & Maintenance | 1,038 (77.6%) | 300 (22.4%) |
| Personal Care & Service | 355 (29.5%) | 850 (70.5%) |
| Total (Category) | 4,550 (48.7%) | 4,793 (51.3%) |
| Total (Overall) | 28,518 (51.1%) | 27,234 (48.8%) |
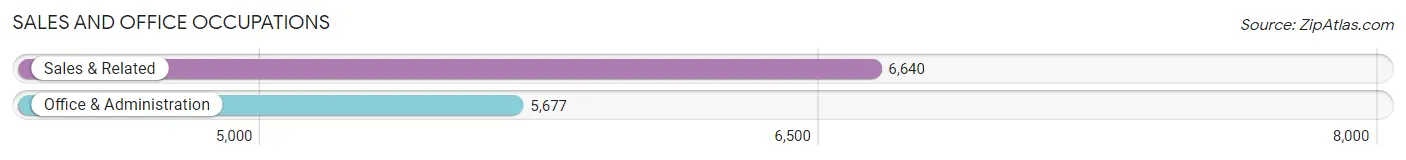
Sales and Office Occupations
The most common Sales and Office occupations in Clovis are Sales & Related (6,640 | 11.9%), and Office & Administration (5,677 | 10.2%).
Sales and Office Occupations by Sex
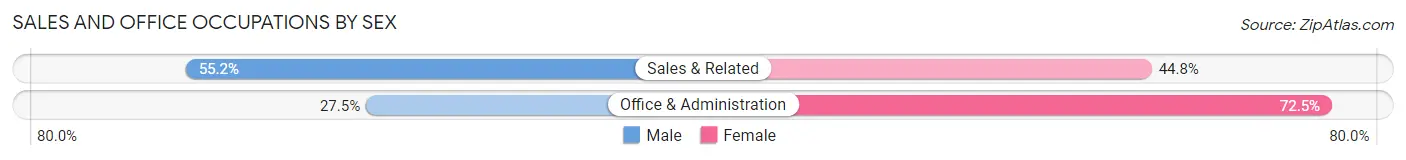
| Occupation | Male | Female |
| Sales & Related | 3,666 (55.2%) | 2,974 (44.8%) |
| Office & Administration | 1,560 (27.5%) | 4,117 (72.5%) |
| Total (Category) | 5,226 (42.4%) | 7,091 (57.6%) |
| Total (Overall) | 28,518 (51.1%) | 27,234 (48.8%) |
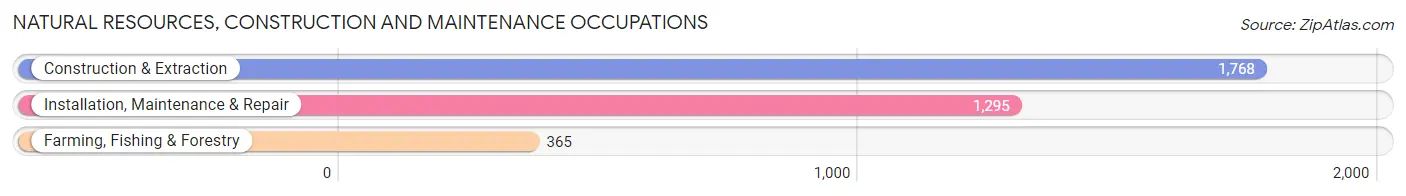
Natural Resources, Construction and Maintenance Occupations
The most common Natural Resources, Construction and Maintenance occupations in Clovis are Construction & Extraction (1,768 | 3.2%), Installation, Maintenance & Repair (1,295 | 2.3%), and Farming, Fishing & Forestry (365 | 0.6%).
Natural Resources, Construction and Maintenance Occupations by Sex
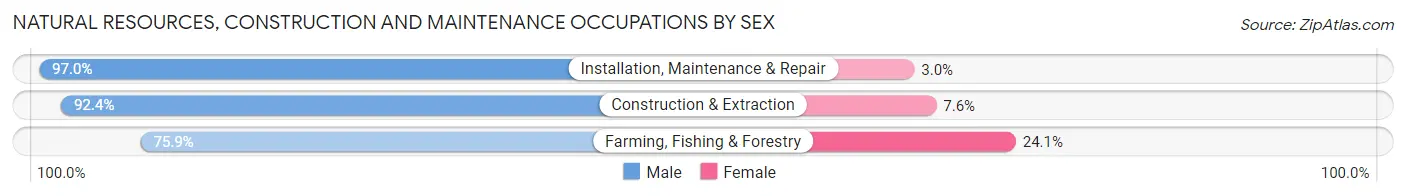
| Occupation | Male | Female |
| Farming, Fishing & Forestry | 277 (75.9%) | 88 (24.1%) |
| Construction & Extraction | 1,634 (92.4%) | 134 (7.6%) |
| Installation, Maintenance & Repair | 1,256 (97.0%) | 39 (3.0%) |
| Total (Category) | 3,167 (92.4%) | 261 (7.6%) |
| Total (Overall) | 28,518 (51.1%) | 27,234 (48.8%) |
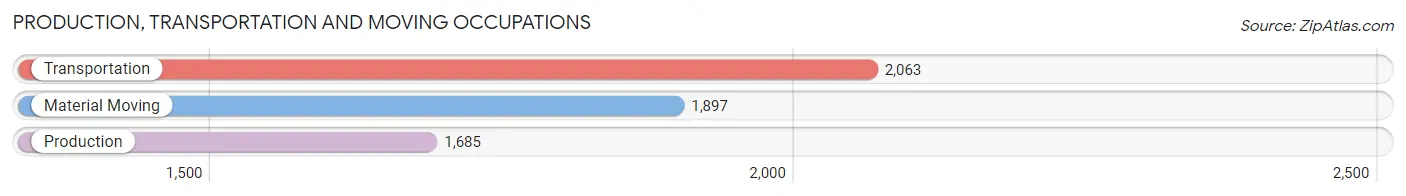
Production, Transportation and Moving Occupations
The most common Production, Transportation and Moving occupations in Clovis are Transportation (2,063 | 3.7%), Material Moving (1,897 | 3.4%), and Production (1,685 | 3.0%).
Production, Transportation and Moving Occupations by Sex
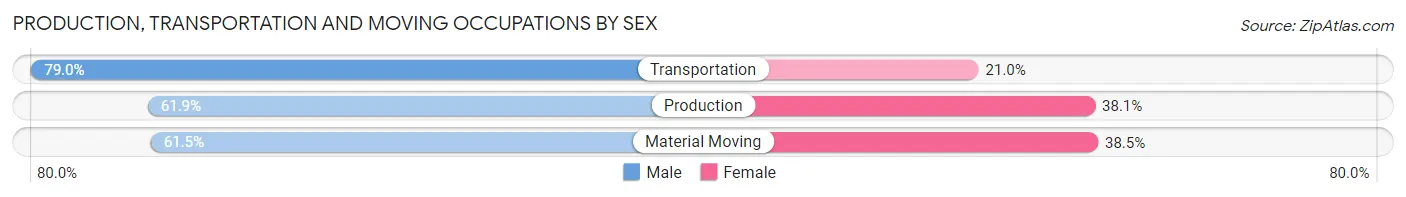
| Occupation | Male | Female |
| Production | 1,043 (61.9%) | 642 (38.1%) |
| Transportation | 1,630 (79.0%) | 433 (21.0%) |
| Material Moving | 1,166 (61.5%) | 731 (38.5%) |
| Total (Category) | 3,839 (68.0%) | 1,806 (32.0%) |
| Total (Overall) | 28,518 (51.1%) | 27,234 (48.8%) |
Employment Industries by Sex in Clovis
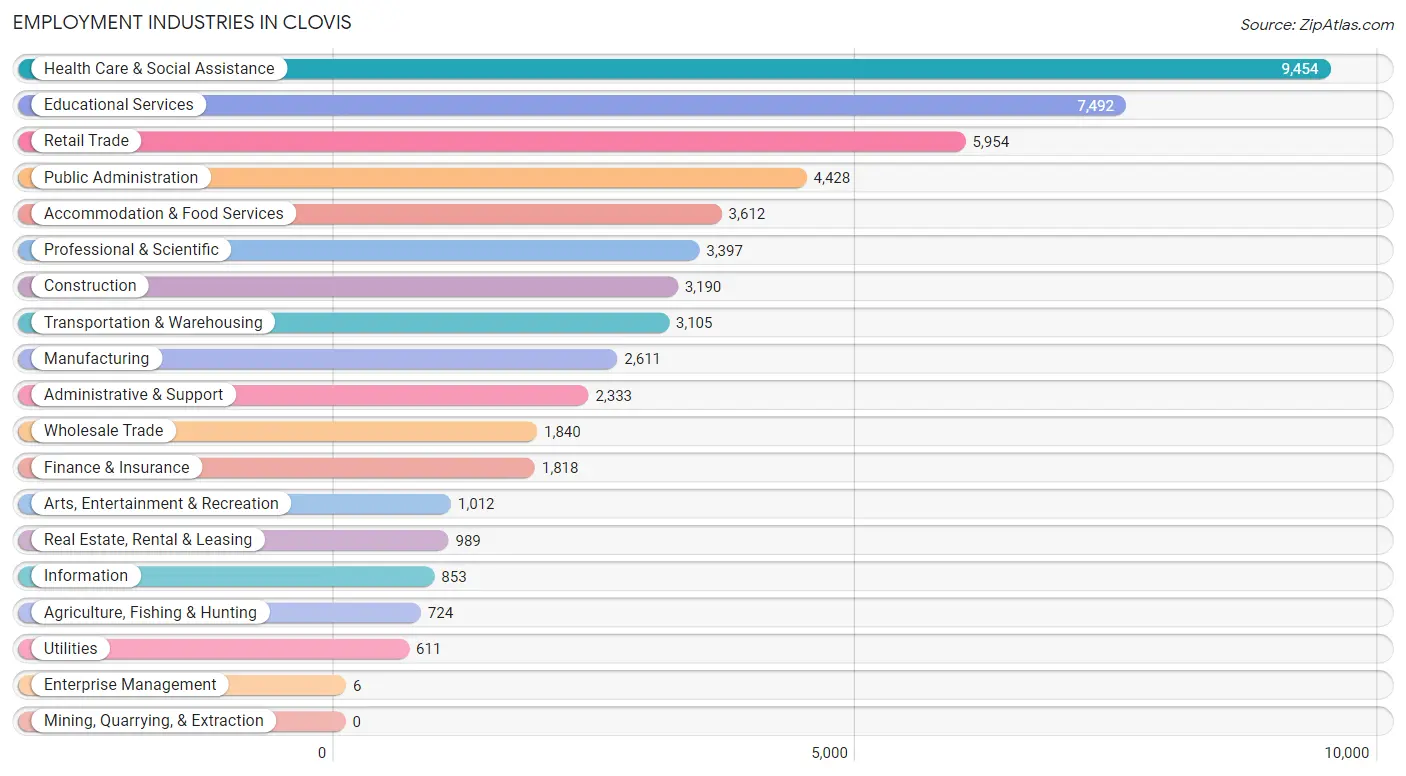
Employment Industries in Clovis
The major employment industries in Clovis include Health Care & Social Assistance (9,454 | 17.0%), Educational Services (7,492 | 13.4%), Retail Trade (5,954 | 10.7%), Public Administration (4,428 | 7.9%), and Accommodation & Food Services (3,612 | 6.5%).
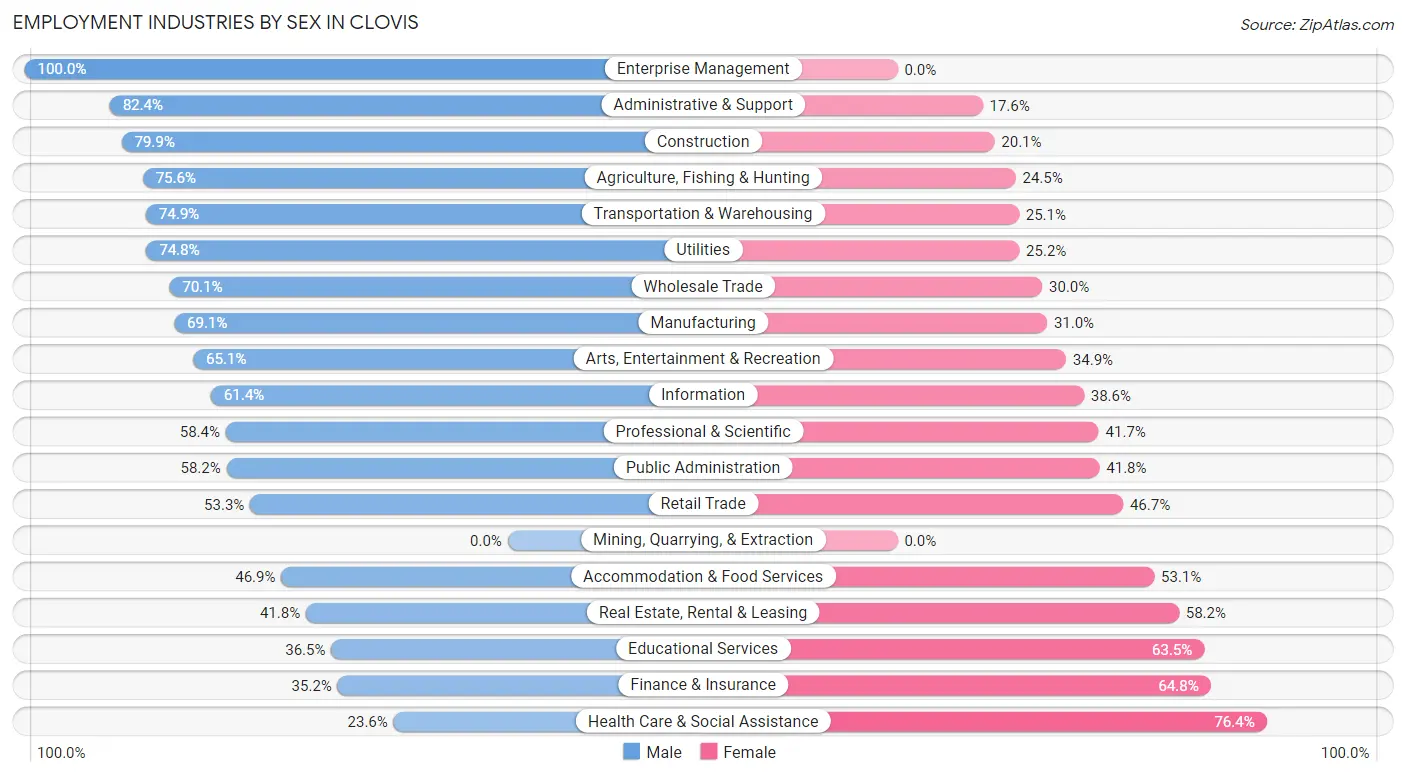
Employment Industries by Sex in Clovis
The Clovis industries that see more men than women are Enterprise Management (100.0%), Administrative & Support (82.4%), and Construction (79.9%), whereas the industries that tend to have a higher number of women are Health Care & Social Assistance (76.4%), Finance & Insurance (64.8%), and Educational Services (63.5%).
| Industry | Male | Female |
| Agriculture, Fishing & Hunting | 547 (75.5%) | 177 (24.4%) |
| Mining, Quarrying, & Extraction | 0 (0.0%) | 0 (0.0%) |
| Construction | 2,550 (79.9%) | 640 (20.1%) |
| Manufacturing | 1,803 (69.1%) | 808 (30.9%) |
| Wholesale Trade | 1,289 (70.1%) | 551 (29.9%) |
| Retail Trade | 3,174 (53.3%) | 2,780 (46.7%) |
| Transportation & Warehousing | 2,325 (74.9%) | 780 (25.1%) |
| Utilities | 457 (74.8%) | 154 (25.2%) |
| Information | 524 (61.4%) | 329 (38.6%) |
| Finance & Insurance | 640 (35.2%) | 1,178 (64.8%) |
| Real Estate, Rental & Leasing | 413 (41.8%) | 576 (58.2%) |
| Professional & Scientific | 1,982 (58.4%) | 1,415 (41.6%) |
| Enterprise Management | 6 (100.0%) | 0 (0.0%) |
| Administrative & Support | 1,922 (82.4%) | 411 (17.6%) |
| Educational Services | 2,736 (36.5%) | 4,756 (63.5%) |
| Health Care & Social Assistance | 2,233 (23.6%) | 7,221 (76.4%) |
| Arts, Entertainment & Recreation | 659 (65.1%) | 353 (34.9%) |
| Accommodation & Food Services | 1,693 (46.9%) | 1,919 (53.1%) |
| Public Administration | 2,577 (58.2%) | 1,851 (41.8%) |
| Total | 28,518 (51.1%) | 27,234 (48.8%) |
Education in Clovis
School Enrollment in Clovis
The most common levels of schooling among the 37,120 students in Clovis are middle school (9,051 | 24.4%), elementary school (7,517 | 20.3%), and college / undergraduate (7,317 | 19.7%).
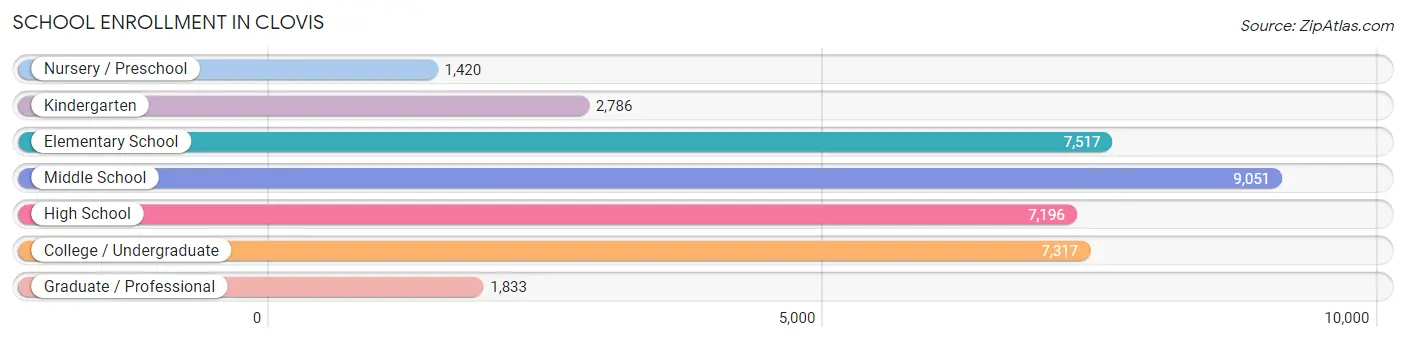
| School Level | # Students | % Students |
| Nursery / Preschool | 1,420 | 3.8% |
| Kindergarten | 2,786 | 7.5% |
| Elementary School | 7,517 | 20.3% |
| Middle School | 9,051 | 24.4% |
| High School | 7,196 | 19.4% |
| College / Undergraduate | 7,317 | 19.7% |
| Graduate / Professional | 1,833 | 4.9% |
| Total | 37,120 | 100.0% |
School Enrollment by Age by Funding Source in Clovis
Out of a total of 37,120 students who are enrolled in schools in Clovis, 4,083 (11.0%) attend a private institution, while the remaining 33,037 (89.0%) are enrolled in public schools. The age group of 3 to 4 year olds has the highest likelihood of being enrolled in private schools, with 432 (33.8% in the age bracket) enrolled. Conversely, the age group of 15 to 17 year olds has the lowest likelihood of being enrolled in a private school, with 5,286 (94.7% in the age bracket) attending a public institution.
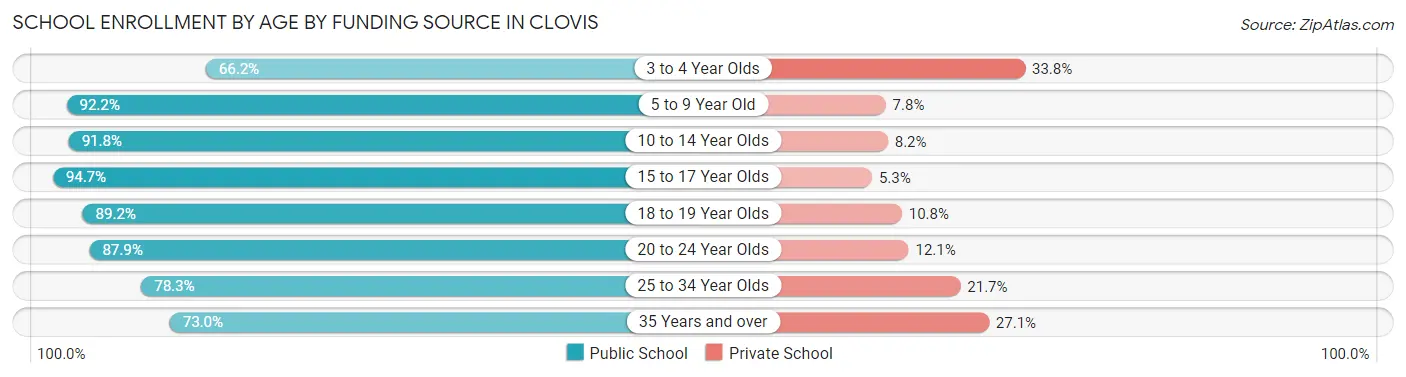
| Age Bracket | Public School | Private School |
| 3 to 4 Year Olds | 847 (66.2%) | 432 (33.8%) |
| 5 to 9 Year Old | 8,745 (92.2%) | 742 (7.8%) |
| 10 to 14 Year Olds | 9,965 (91.8%) | 892 (8.2%) |
| 15 to 17 Year Olds | 5,286 (94.7%) | 294 (5.3%) |
| 18 to 19 Year Olds | 1,748 (89.2%) | 212 (10.8%) |
| 20 to 24 Year Olds | 2,973 (87.9%) | 409 (12.1%) |
| 25 to 34 Year Olds | 1,894 (78.3%) | 526 (21.7%) |
| 35 Years and over | 1,572 (73.0%) | 583 (27.1%) |
| Total | 33,037 (89.0%) | 4,083 (11.0%) |
Educational Attainment by Field of Study in Clovis
Business (4,653 | 16.2%), science & technology (3,938 | 13.7%), liberal arts & history (2,856 | 9.9%), arts & humanities (2,729 | 9.5%), and education (2,290 | 8.0%) are the most common fields of study among 28,775 individuals in Clovis who have obtained a bachelor's degree or higher.
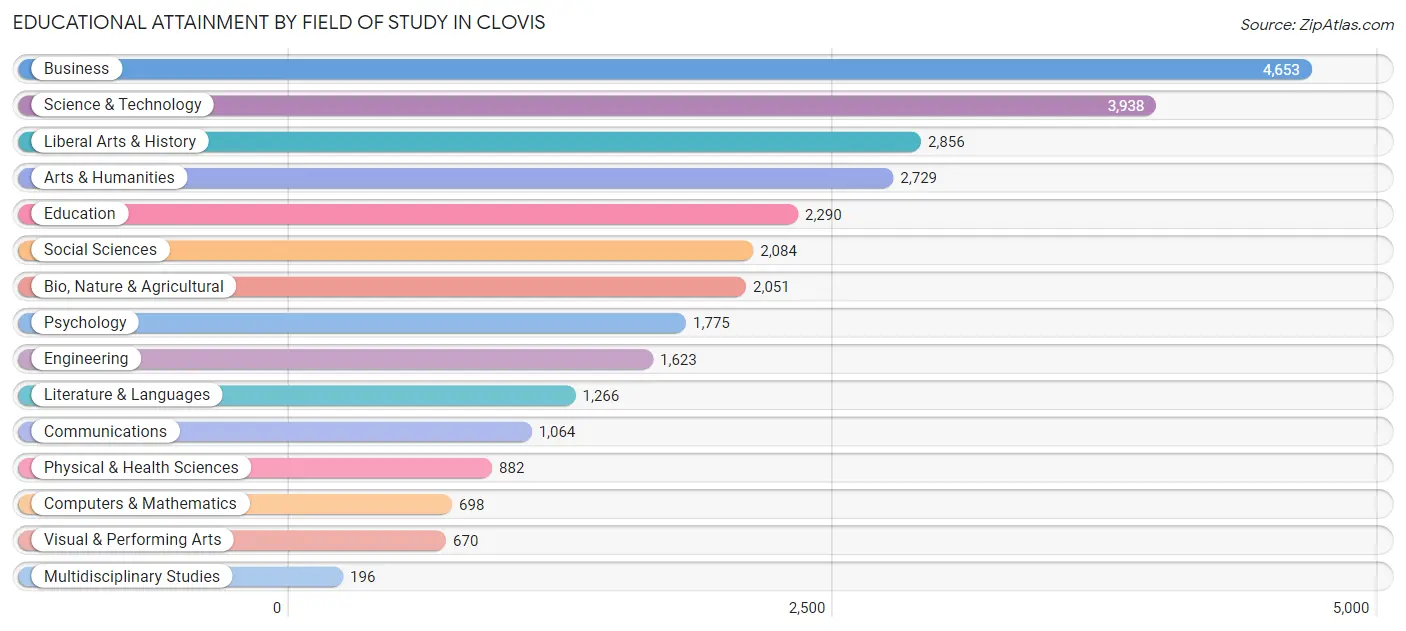
| Field of Study | # Graduates | % Graduates |
| Computers & Mathematics | 698 | 2.4% |
| Bio, Nature & Agricultural | 2,051 | 7.1% |
| Physical & Health Sciences | 882 | 3.1% |
| Psychology | 1,775 | 6.2% |
| Social Sciences | 2,084 | 7.2% |
| Engineering | 1,623 | 5.6% |
| Multidisciplinary Studies | 196 | 0.7% |
| Science & Technology | 3,938 | 13.7% |
| Business | 4,653 | 16.2% |
| Education | 2,290 | 8.0% |
| Literature & Languages | 1,266 | 4.4% |
| Liberal Arts & History | 2,856 | 9.9% |
| Visual & Performing Arts | 670 | 2.3% |
| Communications | 1,064 | 3.7% |
| Arts & Humanities | 2,729 | 9.5% |
| Total | 28,775 | 100.0% |
Transportation & Commute in Clovis
Vehicle Availability by Sex in Clovis
The most prevalent vehicle ownership categories in Clovis are males with 2 vehicles (12,935, accounting for 45.8%) and females with 2 vehicles (11,539, making up 49.3%).
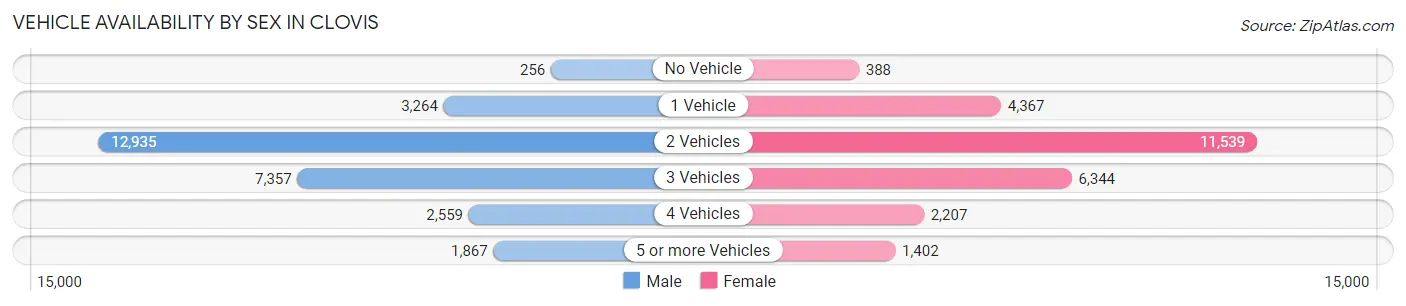
| Vehicles Available | Male | Female |
| No Vehicle | 256 (0.9%) | 388 (1.5%) |
| 1 Vehicle | 3,264 (11.6%) | 4,367 (16.6%) |
| 2 Vehicles | 12,935 (45.8%) | 11,539 (44.0%) |
| 3 Vehicles | 7,357 (26.1%) | 6,344 (24.2%) |
| 4 Vehicles | 2,559 (9.1%) | 2,207 (8.4%) |
| 5 or more Vehicles | 1,867 (6.6%) | 1,402 (5.3%) |
| Total | 28,238 (100.0%) | 26,247 (100.0%) |
Commute Time in Clovis
The most frequently occuring commute durations in Clovis are 15 to 19 minutes (10,432 commuters, 21.0%), 20 to 24 minutes (9,589 commuters, 19.3%), and 30 to 34 minutes (6,709 commuters, 13.5%).
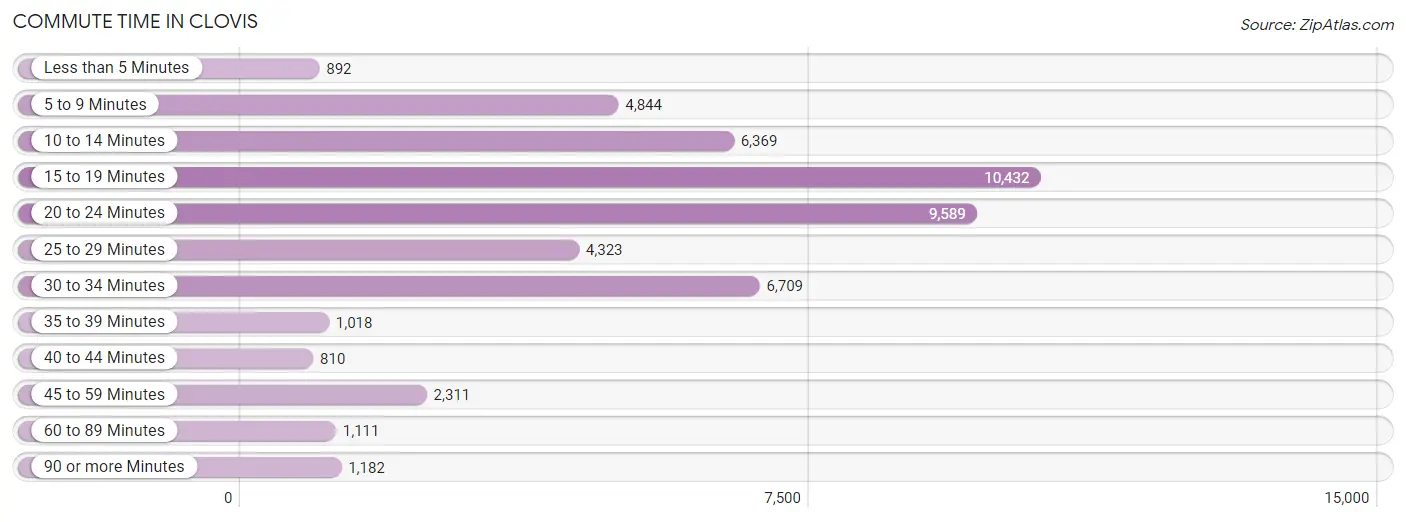
| Commute Time | # Commuters | % Commuters |
| Less than 5 Minutes | 892 | 1.8% |
| 5 to 9 Minutes | 4,844 | 9.8% |
| 10 to 14 Minutes | 6,369 | 12.8% |
| 15 to 19 Minutes | 10,432 | 21.0% |
| 20 to 24 Minutes | 9,589 | 19.3% |
| 25 to 29 Minutes | 4,323 | 8.7% |
| 30 to 34 Minutes | 6,709 | 13.5% |
| 35 to 39 Minutes | 1,018 | 2.1% |
| 40 to 44 Minutes | 810 | 1.6% |
| 45 to 59 Minutes | 2,311 | 4.7% |
| 60 to 89 Minutes | 1,111 | 2.2% |
| 90 or more Minutes | 1,182 | 2.4% |
Commute Time by Sex in Clovis
The most common commute times in Clovis are 15 to 19 minutes (5,211 commuters, 20.0%) for males and 15 to 19 minutes (5,221 commuters, 22.1%) for females.
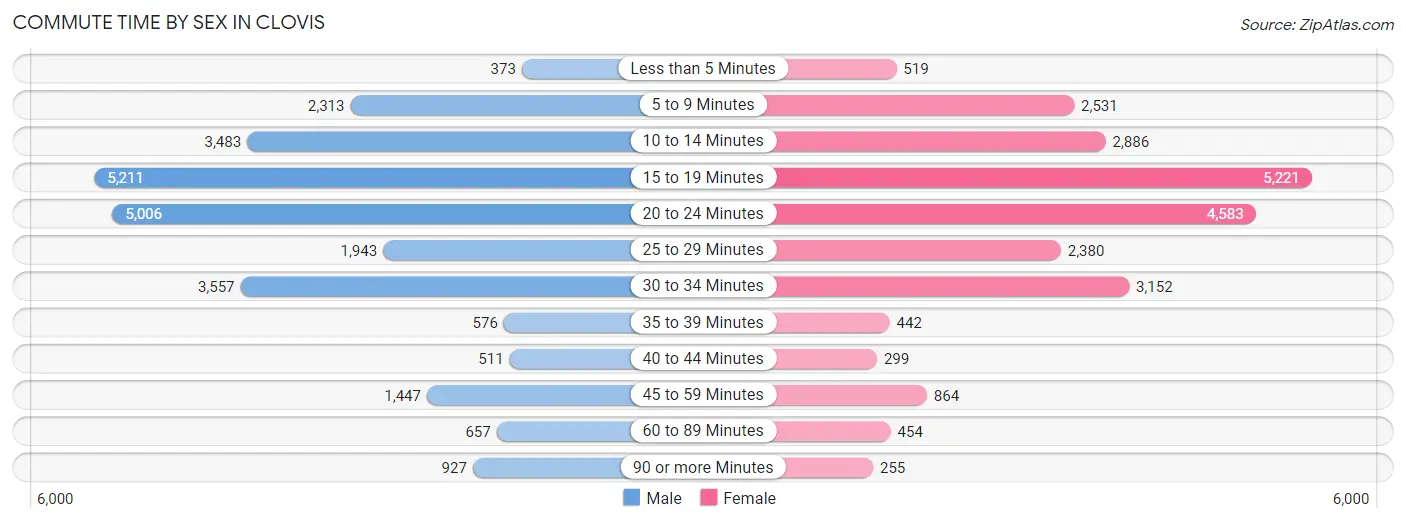
| Commute Time | Male | Female |
| Less than 5 Minutes | 373 (1.4%) | 519 (2.2%) |
| 5 to 9 Minutes | 2,313 (8.9%) | 2,531 (10.7%) |
| 10 to 14 Minutes | 3,483 (13.4%) | 2,886 (12.2%) |
| 15 to 19 Minutes | 5,211 (20.0%) | 5,221 (22.1%) |
| 20 to 24 Minutes | 5,006 (19.3%) | 4,583 (19.4%) |
| 25 to 29 Minutes | 1,943 (7.5%) | 2,380 (10.1%) |
| 30 to 34 Minutes | 3,557 (13.7%) | 3,152 (13.4%) |
| 35 to 39 Minutes | 576 (2.2%) | 442 (1.9%) |
| 40 to 44 Minutes | 511 (2.0%) | 299 (1.3%) |
| 45 to 59 Minutes | 1,447 (5.6%) | 864 (3.7%) |
| 60 to 89 Minutes | 657 (2.5%) | 454 (1.9%) |
| 90 or more Minutes | 927 (3.6%) | 255 (1.1%) |
Time of Departure to Work by Sex in Clovis
The most frequent times of departure to work in Clovis are 7:30 AM to 7:59 AM (3,537, 13.6%) for males and 7:00 AM to 7:29 AM (4,580, 19.4%) for females.
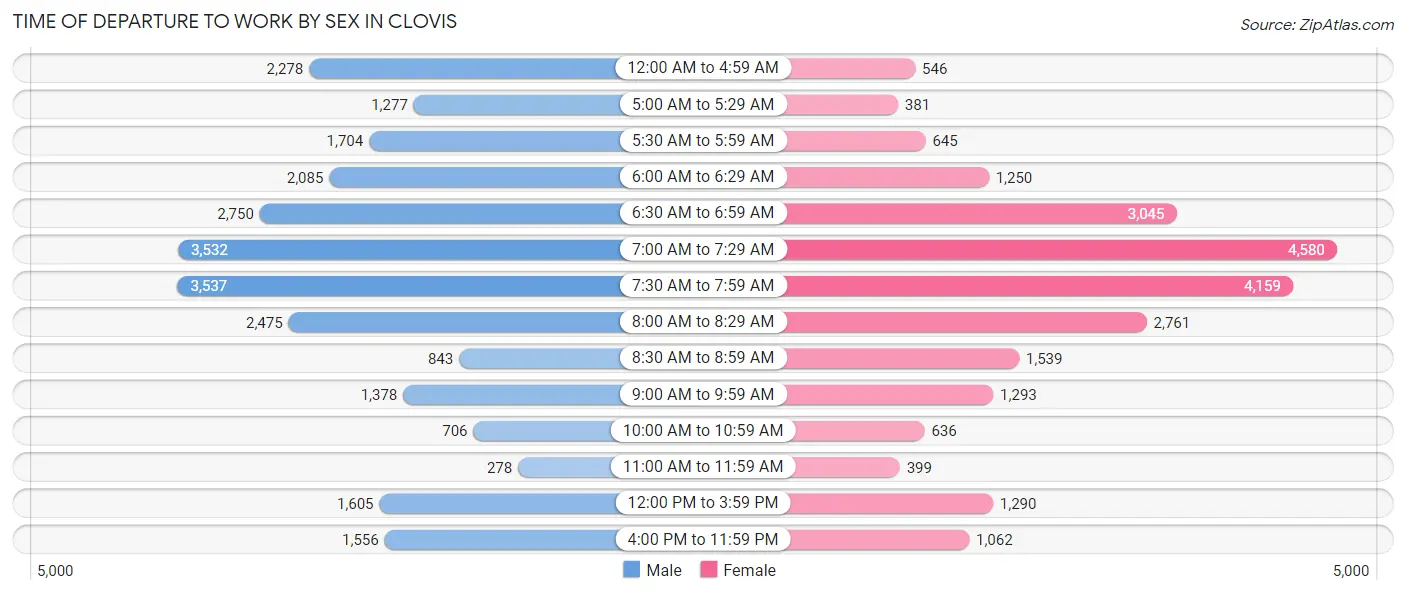
| Time of Departure | Male | Female |
| 12:00 AM to 4:59 AM | 2,278 (8.8%) | 546 (2.3%) |
| 5:00 AM to 5:29 AM | 1,277 (4.9%) | 381 (1.6%) |
| 5:30 AM to 5:59 AM | 1,704 (6.6%) | 645 (2.7%) |
| 6:00 AM to 6:29 AM | 2,085 (8.0%) | 1,250 (5.3%) |
| 6:30 AM to 6:59 AM | 2,750 (10.6%) | 3,045 (12.9%) |
| 7:00 AM to 7:29 AM | 3,532 (13.6%) | 4,580 (19.4%) |
| 7:30 AM to 7:59 AM | 3,537 (13.6%) | 4,159 (17.6%) |
| 8:00 AM to 8:29 AM | 2,475 (9.5%) | 2,761 (11.7%) |
| 8:30 AM to 8:59 AM | 843 (3.2%) | 1,539 (6.5%) |
| 9:00 AM to 9:59 AM | 1,378 (5.3%) | 1,293 (5.5%) |
| 10:00 AM to 10:59 AM | 706 (2.7%) | 636 (2.7%) |
| 11:00 AM to 11:59 AM | 278 (1.1%) | 399 (1.7%) |
| 12:00 PM to 3:59 PM | 1,605 (6.2%) | 1,290 (5.5%) |
| 4:00 PM to 11:59 PM | 1,556 (6.0%) | 1,062 (4.5%) |
| Total | 26,004 (100.0%) | 23,586 (100.0%) |
Housing Occupancy in Clovis
Occupancy by Ownership in Clovis
Of the total 40,135 dwellings in Clovis, owner-occupied units account for 26,697 (66.5%), while renter-occupied units make up 13,438 (33.5%).
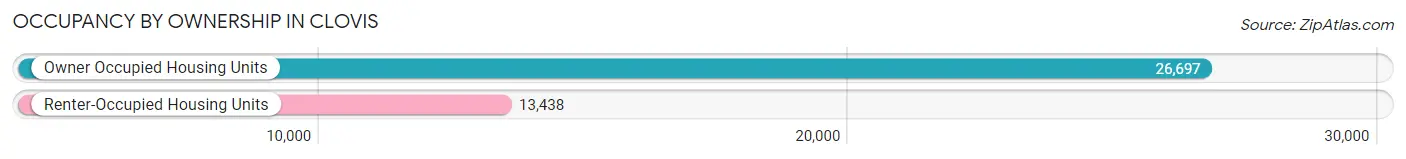
| Occupancy | # Housing Units | % Housing Units |
| Owner Occupied Housing Units | 26,697 | 66.5% |
| Renter-Occupied Housing Units | 13,438 | 33.5% |
| Total Occupied Housing Units | 40,135 | 100.0% |
Occupancy by Household Size in Clovis
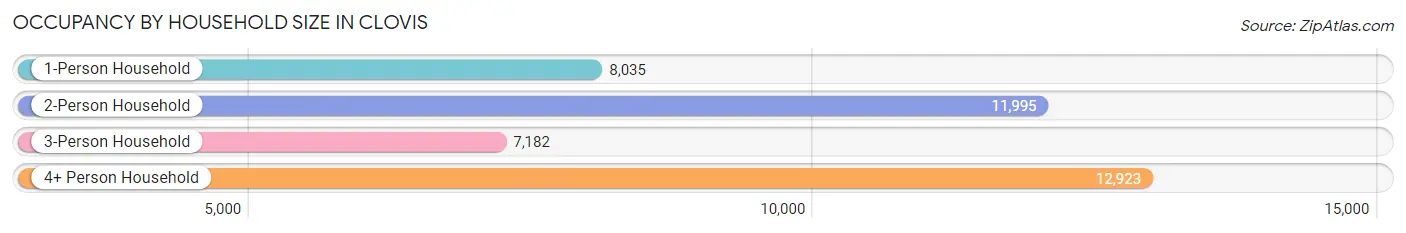
| Household Size | # Housing Units | % Housing Units |
| 1-Person Household | 8,035 | 20.0% |
| 2-Person Household | 11,995 | 29.9% |
| 3-Person Household | 7,182 | 17.9% |
| 4+ Person Household | 12,923 | 32.2% |
| Total Housing Units | 40,135 | 100.0% |
Occupancy by Ownership by Household Size in Clovis
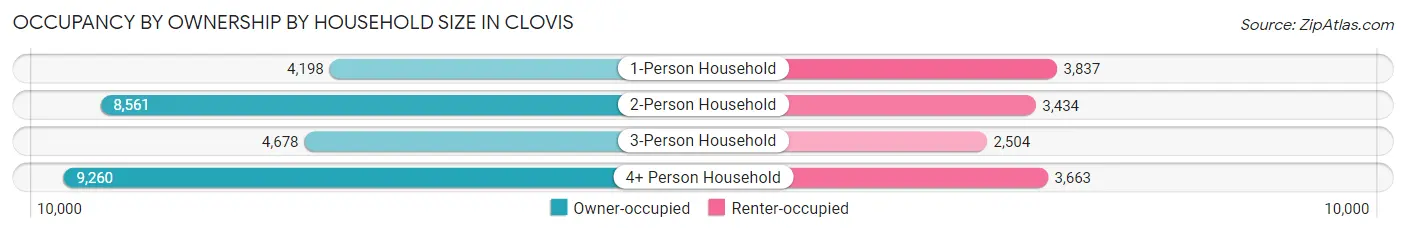
| Household Size | Owner-occupied | Renter-occupied |
| 1-Person Household | 4,198 (52.2%) | 3,837 (47.7%) |
| 2-Person Household | 8,561 (71.4%) | 3,434 (28.6%) |
| 3-Person Household | 4,678 (65.1%) | 2,504 (34.9%) |
| 4+ Person Household | 9,260 (71.7%) | 3,663 (28.3%) |
| Total Housing Units | 26,697 (66.5%) | 13,438 (33.5%) |
Occupancy by Educational Attainment in Clovis
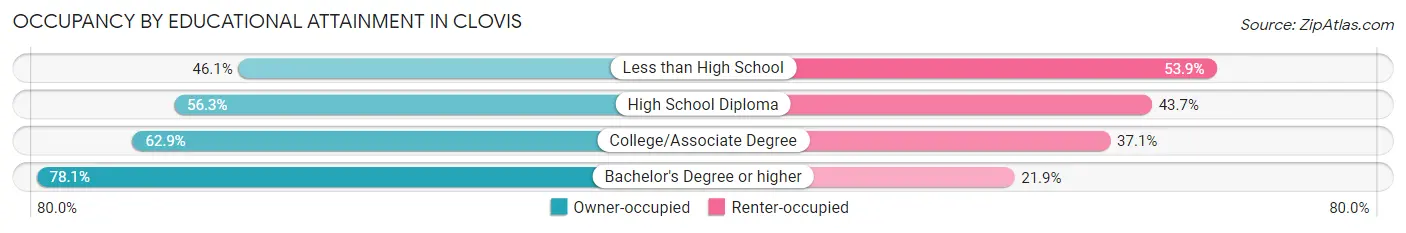
| Household Size | Owner-occupied | Renter-occupied |
| Less than High School | 1,251 (46.1%) | 1,465 (53.9%) |
| High School Diploma | 3,658 (56.3%) | 2,841 (43.7%) |
| College/Associate Degree | 9,750 (62.9%) | 5,754 (37.1%) |
| Bachelor's Degree or higher | 12,038 (78.1%) | 3,378 (21.9%) |
Occupancy by Age of Householder in Clovis
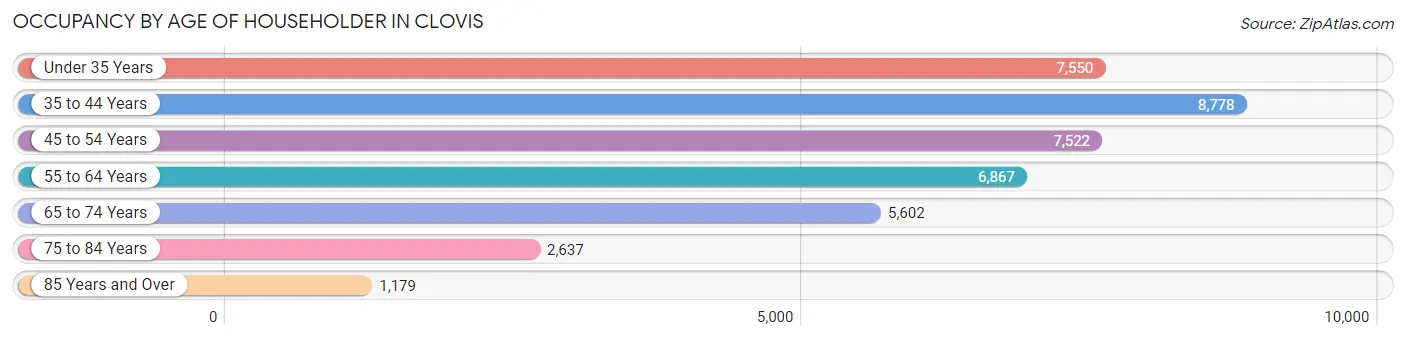
| Age Bracket | # Households | % Households |
| Under 35 Years | 7,550 | 18.8% |
| 35 to 44 Years | 8,778 | 21.9% |
| 45 to 54 Years | 7,522 | 18.7% |
| 55 to 64 Years | 6,867 | 17.1% |
| 65 to 74 Years | 5,602 | 14.0% |
| 75 to 84 Years | 2,637 | 6.6% |
| 85 Years and Over | 1,179 | 2.9% |
| Total | 40,135 | 100.0% |
Housing Finances in Clovis
Median Income by Occupancy in Clovis
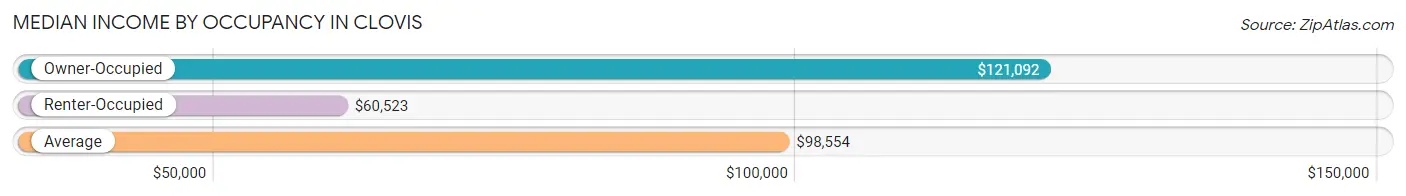
| Occupancy Type | # Households | Median Income |
| Owner-Occupied | 26,697 (66.5%) | $121,092 |
| Renter-Occupied | 13,438 (33.5%) | $60,523 |
| Average | 40,135 (100.0%) | $98,554 |
Occupancy by Householder Income Bracket in Clovis
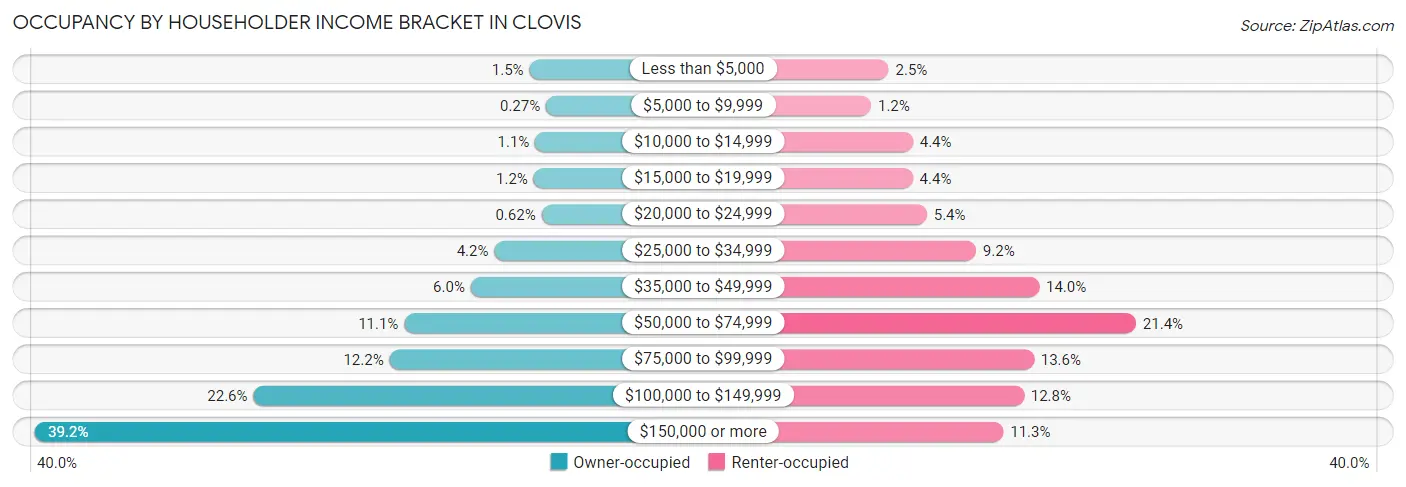
| Income Bracket | Owner-occupied | Renter-occupied |
| Less than $5,000 | 410 (1.5%) | 339 (2.5%) |
| $5,000 to $9,999 | 73 (0.3%) | 158 (1.2%) |
| $10,000 to $14,999 | 295 (1.1%) | 586 (4.4%) |
| $15,000 to $19,999 | 322 (1.2%) | 584 (4.3%) |
| $20,000 to $24,999 | 166 (0.6%) | 730 (5.4%) |
| $25,000 to $34,999 | 1,124 (4.2%) | 1,232 (9.2%) |
| $35,000 to $49,999 | 1,604 (6.0%) | 1,878 (14.0%) |
| $50,000 to $74,999 | 2,958 (11.1%) | 2,870 (21.4%) |
| $75,000 to $99,999 | 3,256 (12.2%) | 1,825 (13.6%) |
| $100,000 to $149,999 | 6,025 (22.6%) | 1,723 (12.8%) |
| $150,000 or more | 10,464 (39.2%) | 1,513 (11.3%) |
| Total | 26,697 (100.0%) | 13,438 (100.0%) |
Monthly Housing Cost Tiers in Clovis
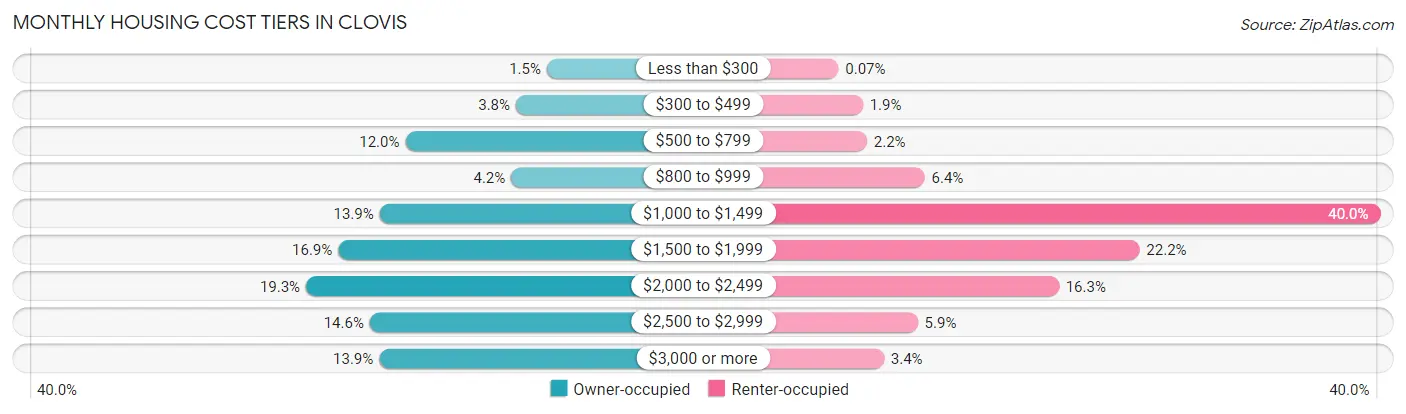
| Monthly Cost | Owner-occupied | Renter-occupied |
| Less than $300 | 410 (1.5%) | 10 (0.1%) |
| $300 to $499 | 1,019 (3.8%) | 250 (1.9%) |
| $500 to $799 | 3,194 (12.0%) | 291 (2.2%) |
| $800 to $999 | 1,113 (4.2%) | 863 (6.4%) |
| $1,000 to $1,499 | 3,699 (13.9%) | 5,372 (40.0%) |
| $1,500 to $1,999 | 4,514 (16.9%) | 2,989 (22.2%) |
| $2,000 to $2,499 | 5,146 (19.3%) | 2,190 (16.3%) |
| $2,500 to $2,999 | 3,893 (14.6%) | 794 (5.9%) |
| $3,000 or more | 3,709 (13.9%) | 460 (3.4%) |
| Total | 26,697 (100.0%) | 13,438 (100.0%) |
Physical Housing Characteristics in Clovis
Housing Structures in Clovis
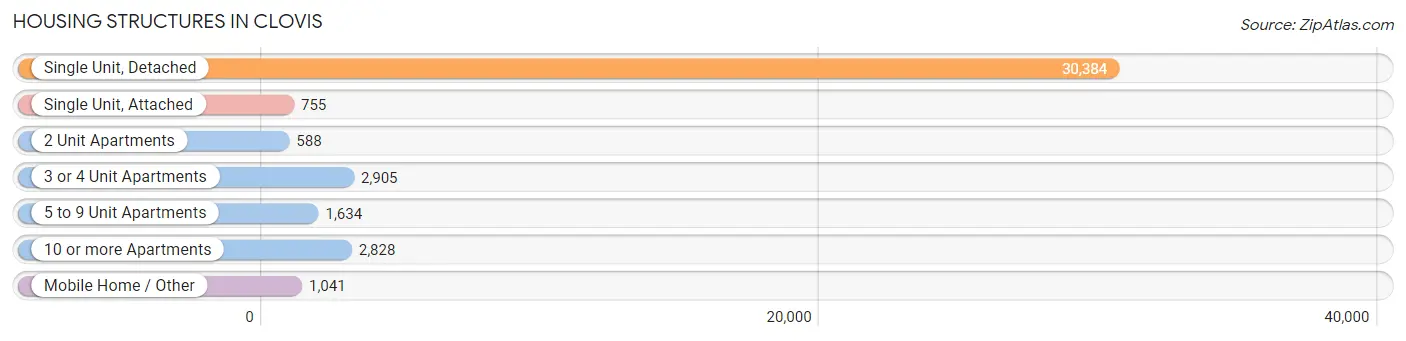
| Structure Type | # Housing Units | % Housing Units |
| Single Unit, Detached | 30,384 | 75.7% |
| Single Unit, Attached | 755 | 1.9% |
| 2 Unit Apartments | 588 | 1.5% |
| 3 or 4 Unit Apartments | 2,905 | 7.2% |
| 5 to 9 Unit Apartments | 1,634 | 4.1% |
| 10 or more Apartments | 2,828 | 7.0% |
| Mobile Home / Other | 1,041 | 2.6% |
| Total | 40,135 | 100.0% |
Housing Structures by Occupancy in Clovis
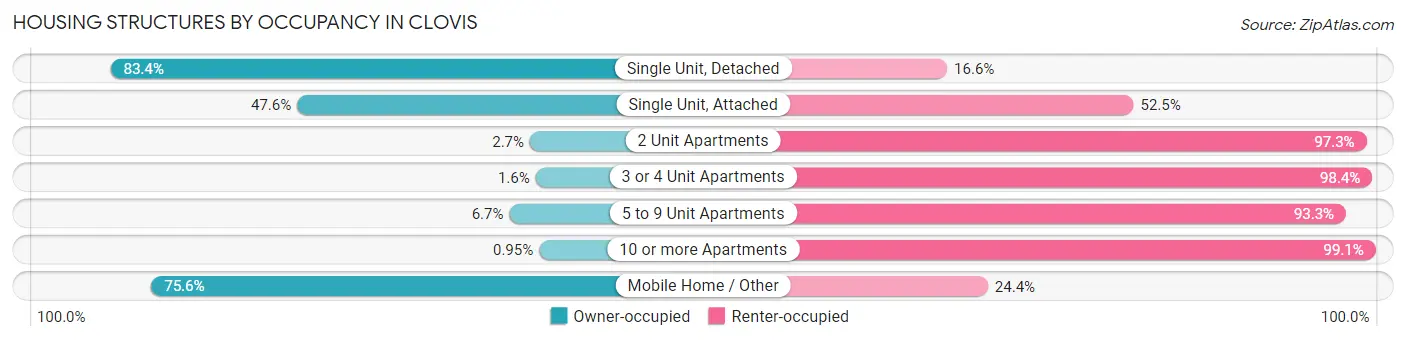
| Structure Type | Owner-occupied | Renter-occupied |
| Single Unit, Detached | 25,352 (83.4%) | 5,032 (16.6%) |
| Single Unit, Attached | 359 (47.5%) | 396 (52.4%) |
| 2 Unit Apartments | 16 (2.7%) | 572 (97.3%) |
| 3 or 4 Unit Apartments | 47 (1.6%) | 2,858 (98.4%) |
| 5 to 9 Unit Apartments | 109 (6.7%) | 1,525 (93.3%) |
| 10 or more Apartments | 27 (0.9%) | 2,801 (99.1%) |
| Mobile Home / Other | 787 (75.6%) | 254 (24.4%) |
| Total | 26,697 (66.5%) | 13,438 (33.5%) |
Housing Structures by Number of Rooms in Clovis
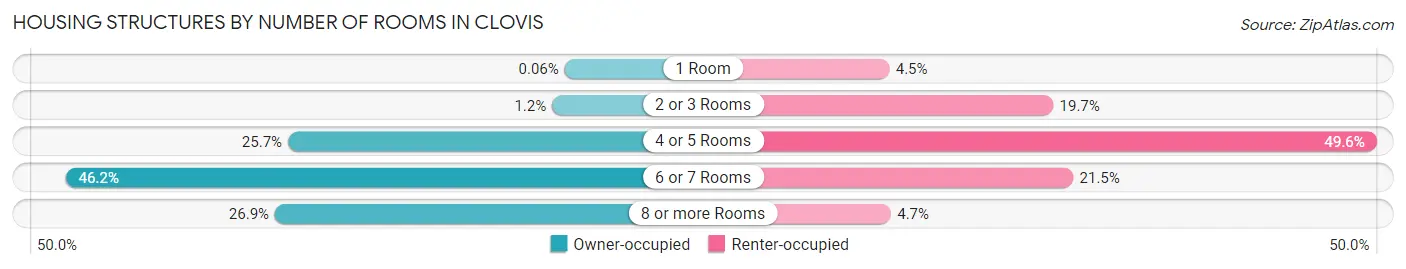
| Number of Rooms | Owner-occupied | Renter-occupied |
| 1 Room | 17 (0.1%) | 608 (4.5%) |
| 2 or 3 Rooms | 326 (1.2%) | 2,643 (19.7%) |
| 4 or 5 Rooms | 6,848 (25.7%) | 6,669 (49.6%) |
| 6 or 7 Rooms | 12,338 (46.2%) | 2,892 (21.5%) |
| 8 or more Rooms | 7,168 (26.9%) | 626 (4.7%) |
| Total | 26,697 (100.0%) | 13,438 (100.0%) |
Housing Structure by Heating Type in Clovis
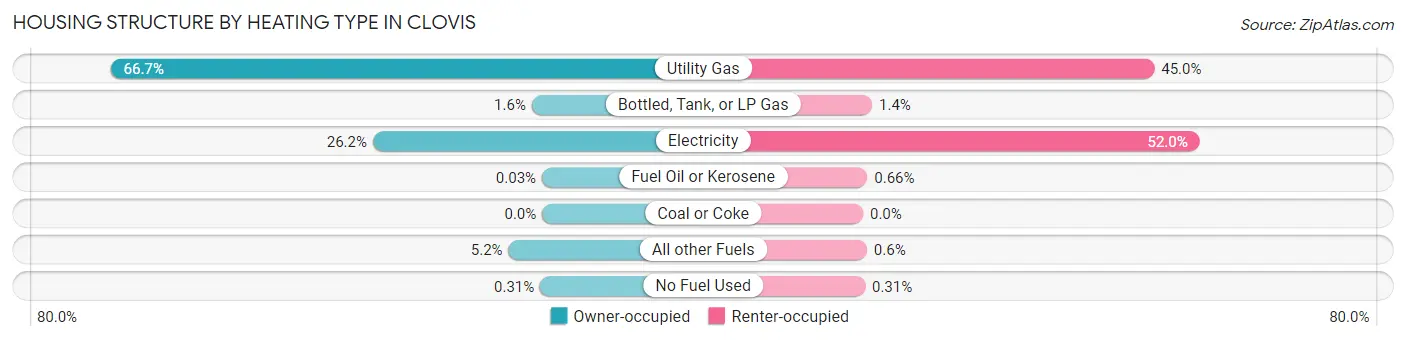
| Heating Type | Owner-occupied | Renter-occupied |
| Utility Gas | 17,807 (66.7%) | 6,050 (45.0%) |
| Bottled, Tank, or LP Gas | 426 (1.6%) | 188 (1.4%) |
| Electricity | 6,986 (26.2%) | 6,989 (52.0%) |
| Fuel Oil or Kerosene | 8 (0.0%) | 89 (0.7%) |
| Coal or Coke | 0 (0.0%) | 0 (0.0%) |
| All other Fuels | 1,388 (5.2%) | 80 (0.6%) |
| No Fuel Used | 82 (0.3%) | 42 (0.3%) |
| Total | 26,697 (100.0%) | 13,438 (100.0%) |
Household Vehicle Usage in Clovis
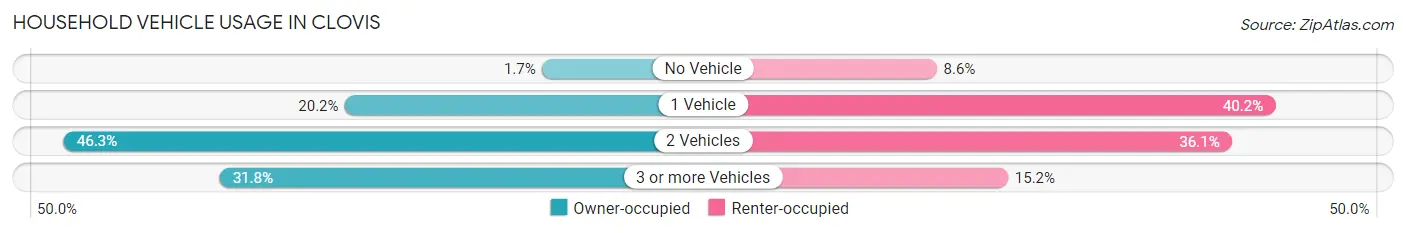
| Vehicles per Household | Owner-occupied | Renter-occupied |
| No Vehicle | 464 (1.7%) | 1,150 (8.6%) |
| 1 Vehicle | 5,380 (20.2%) | 5,395 (40.2%) |
| 2 Vehicles | 12,368 (46.3%) | 4,849 (36.1%) |
| 3 or more Vehicles | 8,485 (31.8%) | 2,044 (15.2%) |
| Total | 26,697 (100.0%) | 13,438 (100.0%) |
Real Estate & Mortgages in Clovis
Real Estate and Mortgage Overview in Clovis
| Characteristic | Without Mortgage | With Mortgage |
| Housing Units | 6,409 | 20,288 |
| Median Property Value | $409,200 | $424,100 |
| Median Household Income | $93,750 | $8,582 |
| Monthly Housing Costs | $711 | $3,682 |
| Real Estate Taxes | $3,348 | $409 |
Property Value by Mortgage Status in Clovis
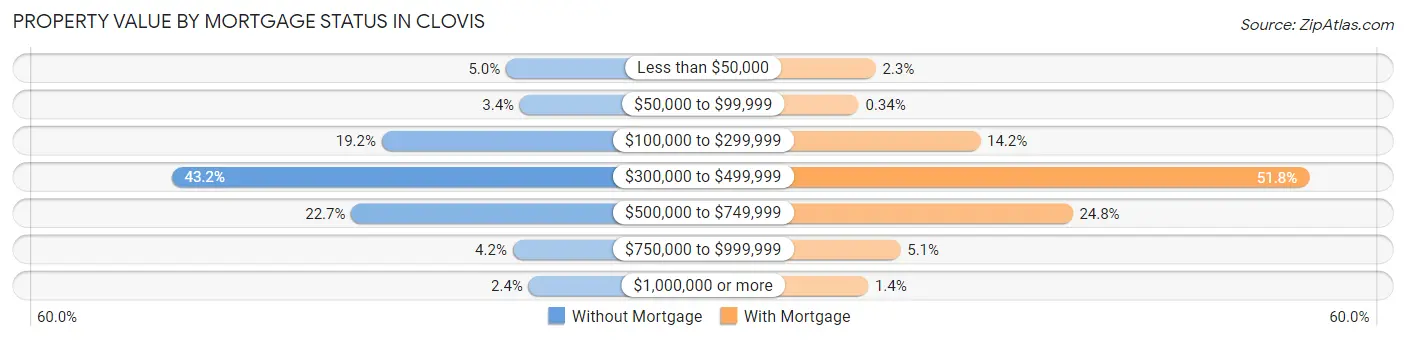
| Property Value | Without Mortgage | With Mortgage |
| Less than $50,000 | 319 (5.0%) | 463 (2.3%) |
| $50,000 to $99,999 | 217 (3.4%) | 68 (0.3%) |
| $100,000 to $299,999 | 1,229 (19.2%) | 2,887 (14.2%) |
| $300,000 to $499,999 | 2,769 (43.2%) | 10,515 (51.8%) |
| $500,000 to $749,999 | 1,452 (22.7%) | 5,029 (24.8%) |
| $750,000 to $999,999 | 270 (4.2%) | 1,037 (5.1%) |
| $1,000,000 or more | 153 (2.4%) | 289 (1.4%) |
| Total | 6,409 (100.0%) | 20,288 (100.0%) |
Household Income by Mortgage Status in Clovis
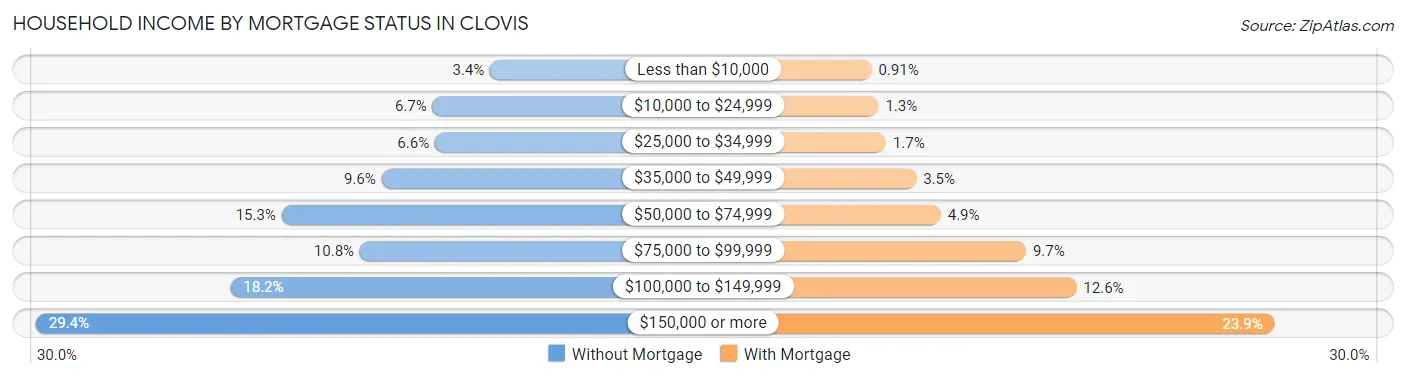
| Household Income | Without Mortgage | With Mortgage |
| Less than $10,000 | 218 (3.4%) | 184 (0.9%) |
| $10,000 to $24,999 | 429 (6.7%) | 265 (1.3%) |
| $25,000 to $34,999 | 420 (6.6%) | 354 (1.7%) |
| $35,000 to $49,999 | 615 (9.6%) | 704 (3.5%) |
| $50,000 to $74,999 | 981 (15.3%) | 989 (4.9%) |
| $75,000 to $99,999 | 695 (10.8%) | 1,977 (9.7%) |
| $100,000 to $149,999 | 1,169 (18.2%) | 2,561 (12.6%) |
| $150,000 or more | 1,882 (29.4%) | 4,856 (23.9%) |
| Total | 6,409 (100.0%) | 20,288 (100.0%) |
Property Value to Household Income Ratio in Clovis
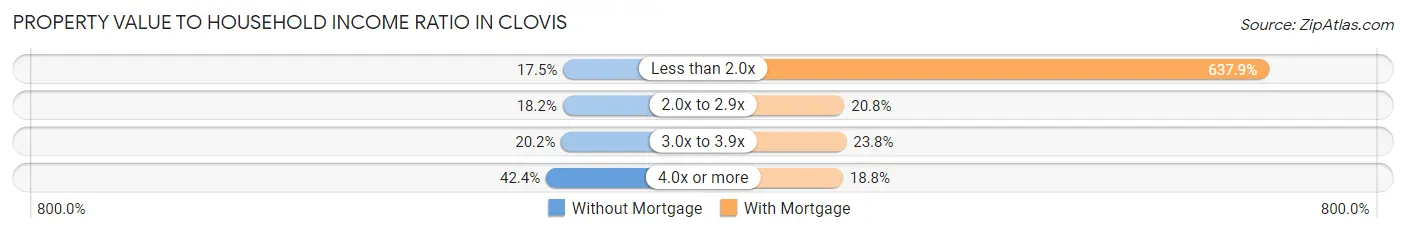
| Value-to-Income Ratio | Without Mortgage | With Mortgage |
| Less than 2.0x | 1,122 (17.5%) | 129,424 (637.9%) |
| 2.0x to 2.9x | 1,164 (18.2%) | 4,226 (20.8%) |
| 3.0x to 3.9x | 1,296 (20.2%) | 4,820 (23.8%) |
| 4.0x or more | 2,718 (42.4%) | 3,815 (18.8%) |
| Total | 6,409 (100.0%) | 20,288 (100.0%) |
Real Estate Taxes by Mortgage Status in Clovis
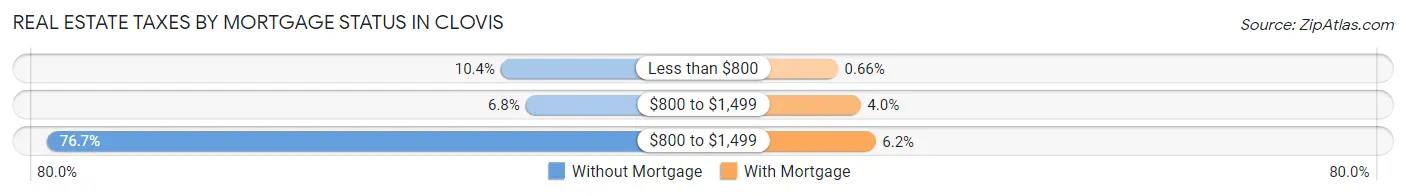
| Property Taxes | Without Mortgage | With Mortgage |
| Less than $800 | 668 (10.4%) | 134 (0.7%) |
| $800 to $1,499 | 435 (6.8%) | 812 (4.0%) |
| $800 to $1,499 | 4,918 (76.7%) | 1,253 (6.2%) |
| Total | 6,409 (100.0%) | 20,288 (100.0%) |
Health & Disability in Clovis
Health Insurance Coverage by Age in Clovis
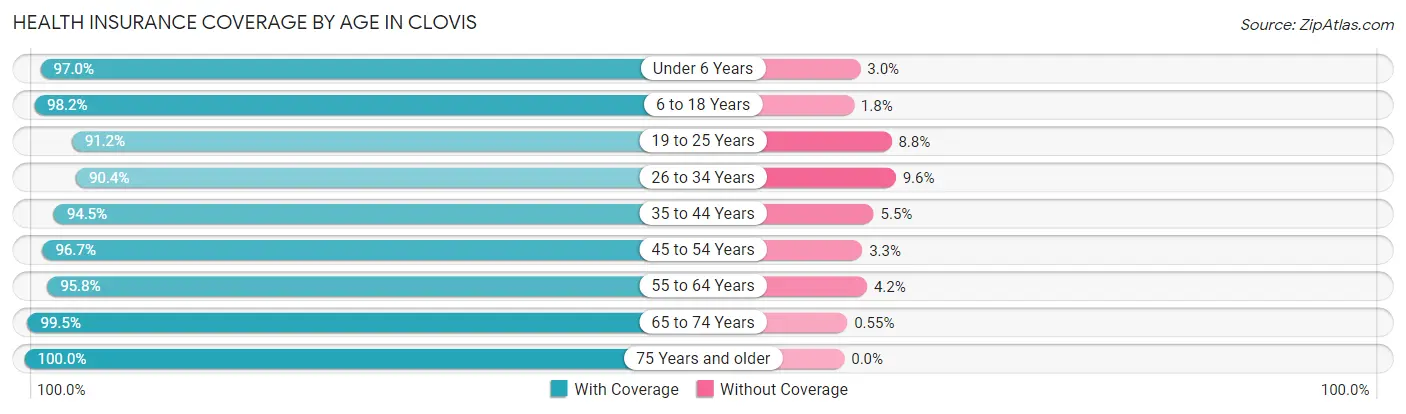
| Age Bracket | With Coverage | Without Coverage |
| Under 6 Years | 9,731 (97.0%) | 300 (3.0%) |
| 6 to 18 Years | 25,630 (98.2%) | 468 (1.8%) |
| 19 to 25 Years | 8,349 (91.2%) | 806 (8.8%) |
| 26 to 34 Years | 14,064 (90.4%) | 1,492 (9.6%) |
| 35 to 44 Years | 15,913 (94.5%) | 919 (5.5%) |
| 45 to 54 Years | 13,218 (96.7%) | 457 (3.3%) |
| 55 to 64 Years | 12,587 (95.8%) | 556 (4.2%) |
| 65 to 74 Years | 9,348 (99.5%) | 52 (0.5%) |
| 75 Years and older | 6,170 (100.0%) | 0 (0.0%) |
| Total | 115,010 (95.8%) | 5,050 (4.2%) |
Health Insurance Coverage by Citizenship Status in Clovis
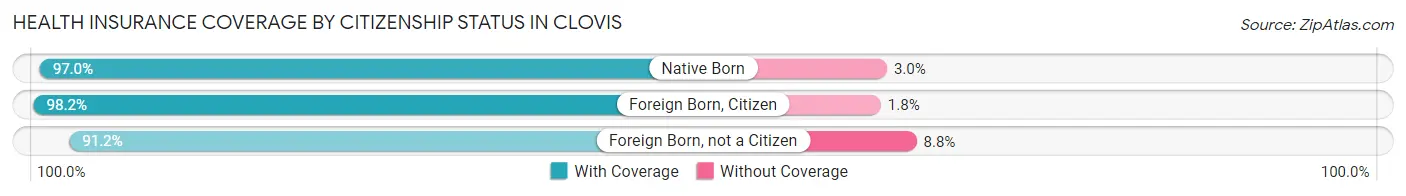
| Citizenship Status | With Coverage | Without Coverage |
| Native Born | 9,731 (97.0%) | 300 (3.0%) |
| Foreign Born, Citizen | 25,630 (98.2%) | 468 (1.8%) |
| Foreign Born, not a Citizen | 8,349 (91.2%) | 806 (8.8%) |
Health Insurance Coverage by Household Income in Clovis
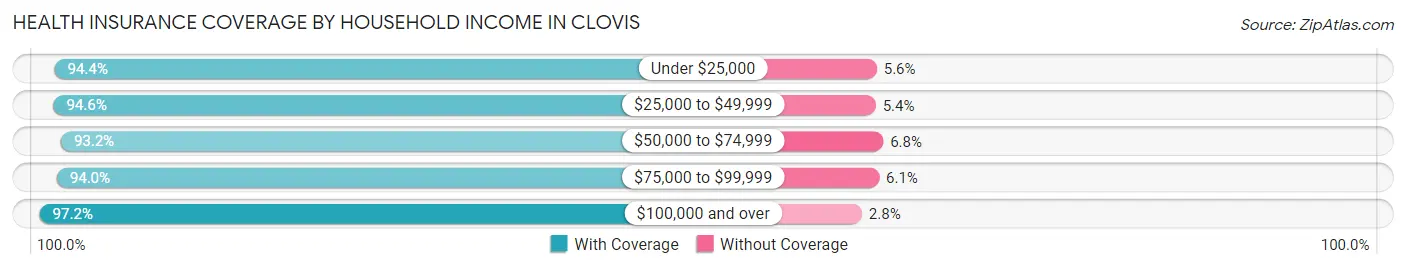
| Household Income | With Coverage | Without Coverage |
| Under $25,000 | 6,756 (94.4%) | 402 (5.6%) |
| $25,000 to $49,999 | 12,836 (94.6%) | 735 (5.4%) |
| $50,000 to $74,999 | 13,696 (93.2%) | 1,002 (6.8%) |
| $75,000 to $99,999 | 14,886 (94.0%) | 959 (6.0%) |
| $100,000 and over | 66,451 (97.2%) | 1,937 (2.8%) |
Public vs Private Health Insurance Coverage by Age in Clovis
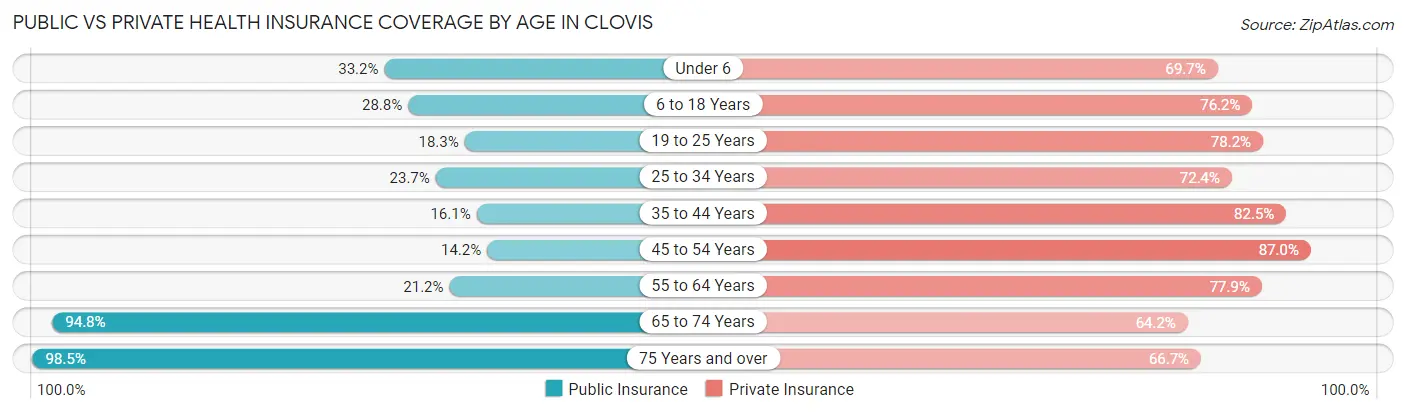
| Age Bracket | Public Insurance | Private Insurance |
| Under 6 | 3,334 (33.2%) | 6,996 (69.7%) |
| 6 to 18 Years | 7,525 (28.8%) | 19,883 (76.2%) |
| 19 to 25 Years | 1,679 (18.3%) | 7,156 (78.2%) |
| 25 to 34 Years | 3,689 (23.7%) | 11,263 (72.4%) |
| 35 to 44 Years | 2,714 (16.1%) | 13,882 (82.5%) |
| 45 to 54 Years | 1,937 (14.2%) | 11,903 (87.0%) |
| 55 to 64 Years | 2,781 (21.2%) | 10,244 (77.9%) |
| 65 to 74 Years | 8,915 (94.8%) | 6,035 (64.2%) |
| 75 Years and over | 6,079 (98.5%) | 4,113 (66.7%) |
| Total | 38,653 (32.2%) | 91,475 (76.2%) |
Disability Status by Sex by Age in Clovis
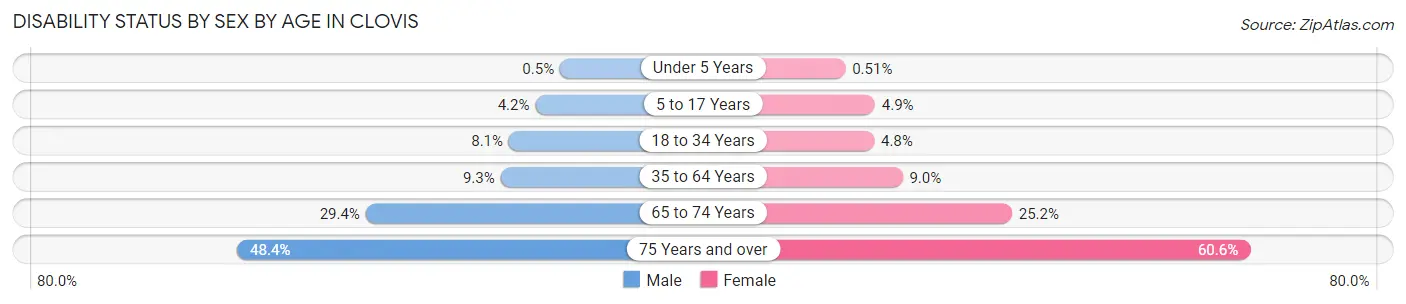
| Age Bracket | Male | Female |
| Under 5 Years | 21 (0.5%) | 21 (0.5%) |
| 5 to 17 Years | 571 (4.2%) | 630 (4.9%) |
| 18 to 34 Years | 1,011 (8.1%) | 646 (4.8%) |
| 35 to 64 Years | 1,987 (9.3%) | 2,011 (9.0%) |
| 65 to 74 Years | 1,247 (29.3%) | 1,300 (25.2%) |
| 75 Years and over | 1,204 (48.4%) | 2,233 (60.6%) |
Disability Class by Sex by Age in Clovis
Disability Class: Hearing Difficulty
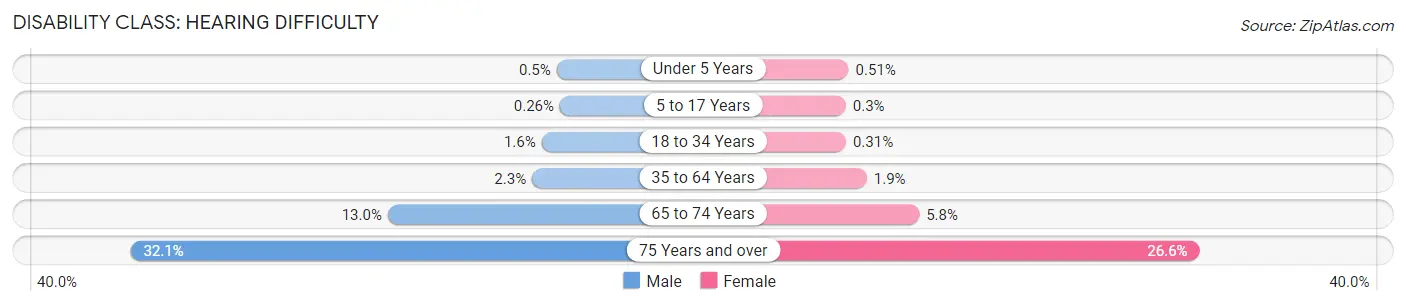
| Age Bracket | Male | Female |
| Under 5 Years | 21 (0.5%) | 21 (0.5%) |
| 5 to 17 Years | 35 (0.3%) | 39 (0.3%) |
| 18 to 34 Years | 202 (1.6%) | 42 (0.3%) |
| 35 to 64 Years | 496 (2.3%) | 415 (1.9%) |
| 65 to 74 Years | 554 (13.0%) | 296 (5.8%) |
| 75 Years and over | 799 (32.1%) | 978 (26.6%) |
Disability Class: Vision Difficulty
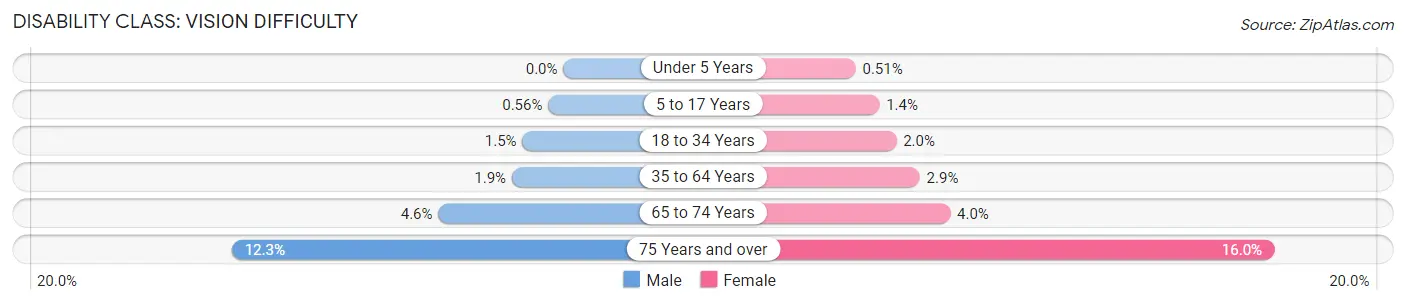
| Age Bracket | Male | Female |
| Under 5 Years | 0 (0.0%) | 21 (0.5%) |
| 5 to 17 Years | 76 (0.6%) | 178 (1.4%) |
| 18 to 34 Years | 190 (1.5%) | 273 (2.0%) |
| 35 to 64 Years | 408 (1.9%) | 646 (2.9%) |
| 65 to 74 Years | 197 (4.6%) | 207 (4.0%) |
| 75 Years and over | 306 (12.3%) | 591 (16.0%) |
Disability Class: Cognitive Difficulty
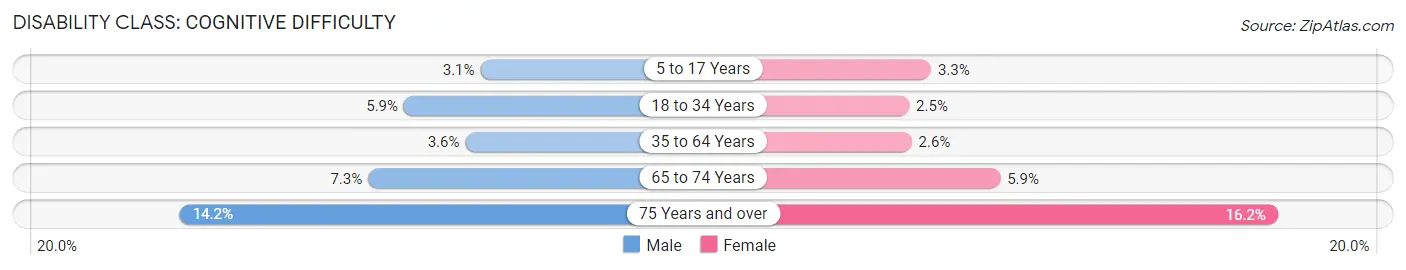
| Age Bracket | Male | Female |
| 5 to 17 Years | 422 (3.1%) | 425 (3.3%) |
| 18 to 34 Years | 740 (5.9%) | 337 (2.5%) |
| 35 to 64 Years | 777 (3.6%) | 578 (2.6%) |
| 65 to 74 Years | 308 (7.2%) | 303 (5.9%) |
| 75 Years and over | 354 (14.2%) | 596 (16.2%) |
Disability Class: Ambulatory Difficulty
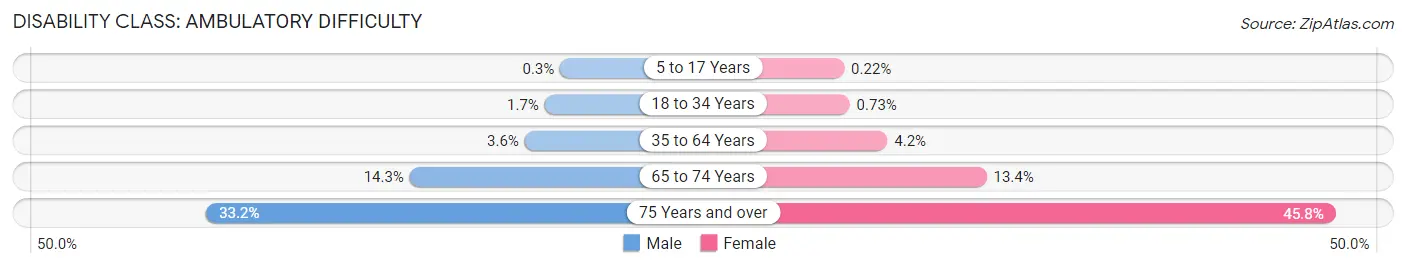
| Age Bracket | Male | Female |
| 5 to 17 Years | 41 (0.3%) | 28 (0.2%) |
| 18 to 34 Years | 216 (1.7%) | 99 (0.7%) |
| 35 to 64 Years | 765 (3.6%) | 943 (4.2%) |
| 65 to 74 Years | 606 (14.3%) | 692 (13.4%) |
| 75 Years and over | 824 (33.2%) | 1,688 (45.8%) |
Disability Class: Self-Care Difficulty
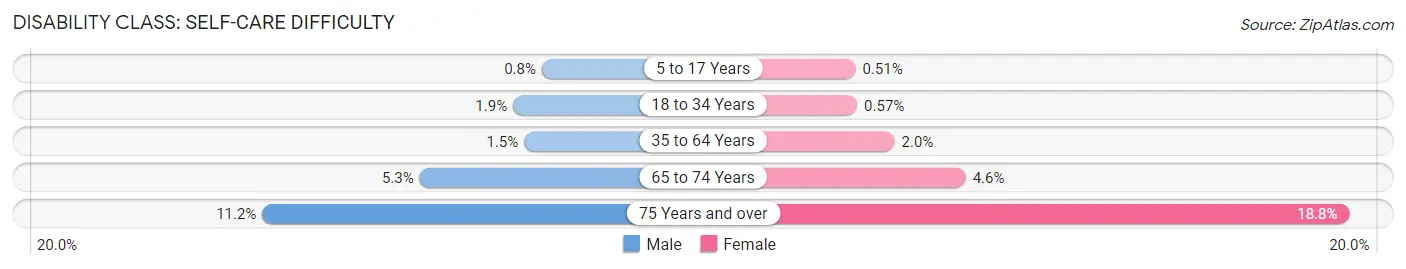
| Age Bracket | Male | Female |
| 5 to 17 Years | 109 (0.8%) | 66 (0.5%) |
| 18 to 34 Years | 234 (1.9%) | 77 (0.6%) |
| 35 to 64 Years | 312 (1.5%) | 437 (2.0%) |
| 65 to 74 Years | 227 (5.3%) | 237 (4.6%) |
| 75 Years and over | 278 (11.2%) | 694 (18.8%) |
Technology Access in Clovis
Computing Device Access in Clovis
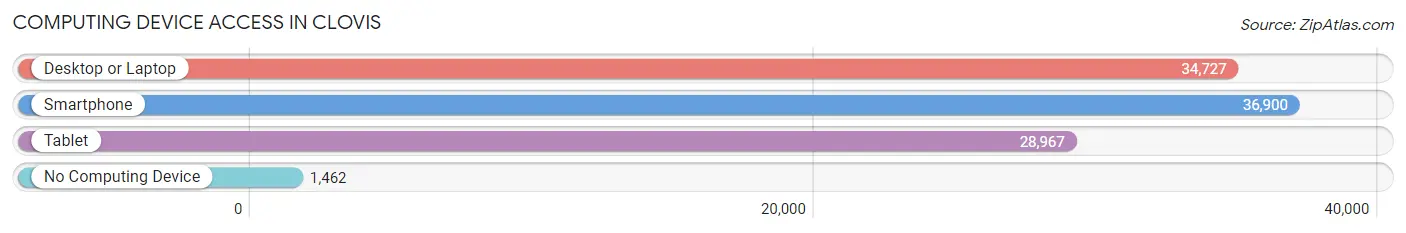
| Device Type | # Households | % Households |
| Desktop or Laptop | 34,727 | 86.5% |
| Smartphone | 36,900 | 91.9% |
| Tablet | 28,967 | 72.2% |
| No Computing Device | 1,462 | 3.6% |
| Total | 40,135 | 100.0% |
Internet Access in Clovis
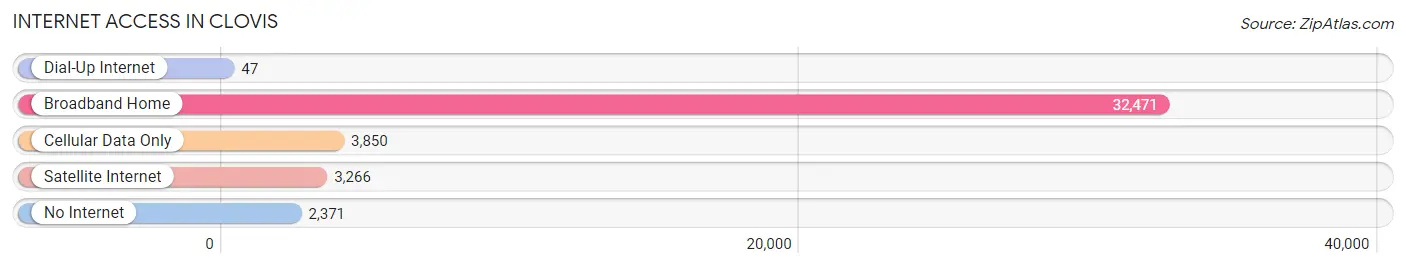
| Internet Type | # Households | % Households |
| Dial-Up Internet | 47 | 0.1% |
| Broadband Home | 32,471 | 80.9% |
| Cellular Data Only | 3,850 | 9.6% |
| Satellite Internet | 3,266 | 8.1% |
| No Internet | 2,371 | 5.9% |
| Total | 40,135 | 100.0% |
Clovis Summary
Clovis, California is a city located in Fresno County, California, United States. It is situated in the San Joaquin Valley, approximately 6 miles northeast of downtown Fresno. The city was founded in 1890 and incorporated in 1912. As of the 2010 census, the city had a population of 95,631, making it the fifth-largest city in Fresno County.
History
Clovis was founded in 1890 by a group of settlers from the nearby town of Millerton. The settlers chose the name Clovis after the nearby Clovis train station, which was named after the Clovis culture, a prehistoric Native American culture that lived in the area. The town was incorporated in 1912 and has since grown to become one of the largest cities in Fresno County.
Geography
Clovis is located at an elevation of 361 feet (110 m) above sea level. It is situated in the San Joaquin Valley, approximately 6 miles northeast of downtown Fresno. The city covers an area of 24.3 square miles (63 km2). The city is bordered by the cities of Fresno, Sanger, and Friant.
Climate
Clovis has a Mediterranean climate, with hot, dry summers and mild, wet winters. The average annual temperature is 64°F (18°C). The average annual precipitation is 11.3 inches (286 mm).
Demographics
As of the 2010 census, the city had a population of 95,631. The racial makeup of the city was 68.2% White, 4.3% African American, 1.2% Native American, 8.2% Asian, 0.2% Pacific Islander, 13.7% from other races, and 4.2% from two or more races. Hispanic or Latino of any race were 33.2% of the population.
Economy
Clovis is home to a variety of businesses, including retail, manufacturing, and agriculture. The city is home to several large employers, including Clovis Unified School District, Clovis Community Medical Center, and the City of Clovis. The city is also home to several shopping centers, including Sierra Vista Mall and Clovis Crossing.
The city is served by the Fresno Yosemite International Airport, which is located approximately 10 miles south of the city. The airport provides air service to several major cities in the United States, as well as international destinations.
Conclusion
Clovis, California is a city located in Fresno County, California, United States. It is situated in the San Joaquin Valley, approximately 6 miles northeast of downtown Fresno. The city was founded in 1890 and incorporated in 1912. As of the 2010 census, the city had a population of 95,631, making it the fifth-largest city in Fresno County. Clovis has a Mediterranean climate, with hot, dry summers and mild, wet winters. The city is home to a variety of businesses, including retail, manufacturing, and agriculture. The city is served by the Fresno Yosemite International Airport, which is located approximately 10 miles south of the city.
Common Questions
What is Per Capita Income in Clovis?
Per Capita income in Clovis is $41,909.
What is the Median Family Income in Clovis?
Median Family Income in Clovis is $111,257.
What is the Median Household income in Clovis?
Median Household Income in Clovis is $98,554.
What is Income or Wage Gap in Clovis?
Income or Wage Gap in Clovis is 23.4%.
Women in Clovis earn 76.6 cents for every dollar earned by a man.
What is Family Income Deficit in Clovis?
Family Income Deficit in Clovis is $10,508.
Families that are below poverty line in Clovis earn $10,508 less on average than the poverty threshold level.
What is Inequality or Gini Index in Clovis?
Inequality or Gini Index in Clovis is 0.42.
What is the Total Population of Clovis?
Total Population of Clovis is 120,607.
What is the Total Male Population of Clovis?
Total Male Population of Clovis is 58,694.
What is the Total Female Population of Clovis?
Total Female Population of Clovis is 61,913.
What is the Ratio of Males per 100 Females in Clovis?
There are 94.80 Males per 100 Females in Clovis.
What is the Ratio of Females per 100 Males in Clovis?
There are 105.48 Females per 100 Males in Clovis.
What is the Median Population Age in Clovis?
Median Population Age in Clovis is 34.8 Years.
What is the Average Family Size in Clovis
Average Family Size in Clovis is 3.4 People.
What is the Average Household Size in Clovis
Average Household Size in Clovis is 3.0 People.
How Large is the Labor Force in Clovis?
There are 59,769 People in the Labor Forcein in Clovis.
What is the Percentage of People in the Labor Force in Clovis?
66.7% of People are in the Labor Force in Clovis.
What is the Unemployment Rate in Clovis?
Unemployment Rate in Clovis is 6.3%.