Cities with the Highest Percentage of Population Employed in Office & Administration in North Carolina
RELATED REPORTS & OPTIONS
Office & Administration
North Carolina
Compare Cities
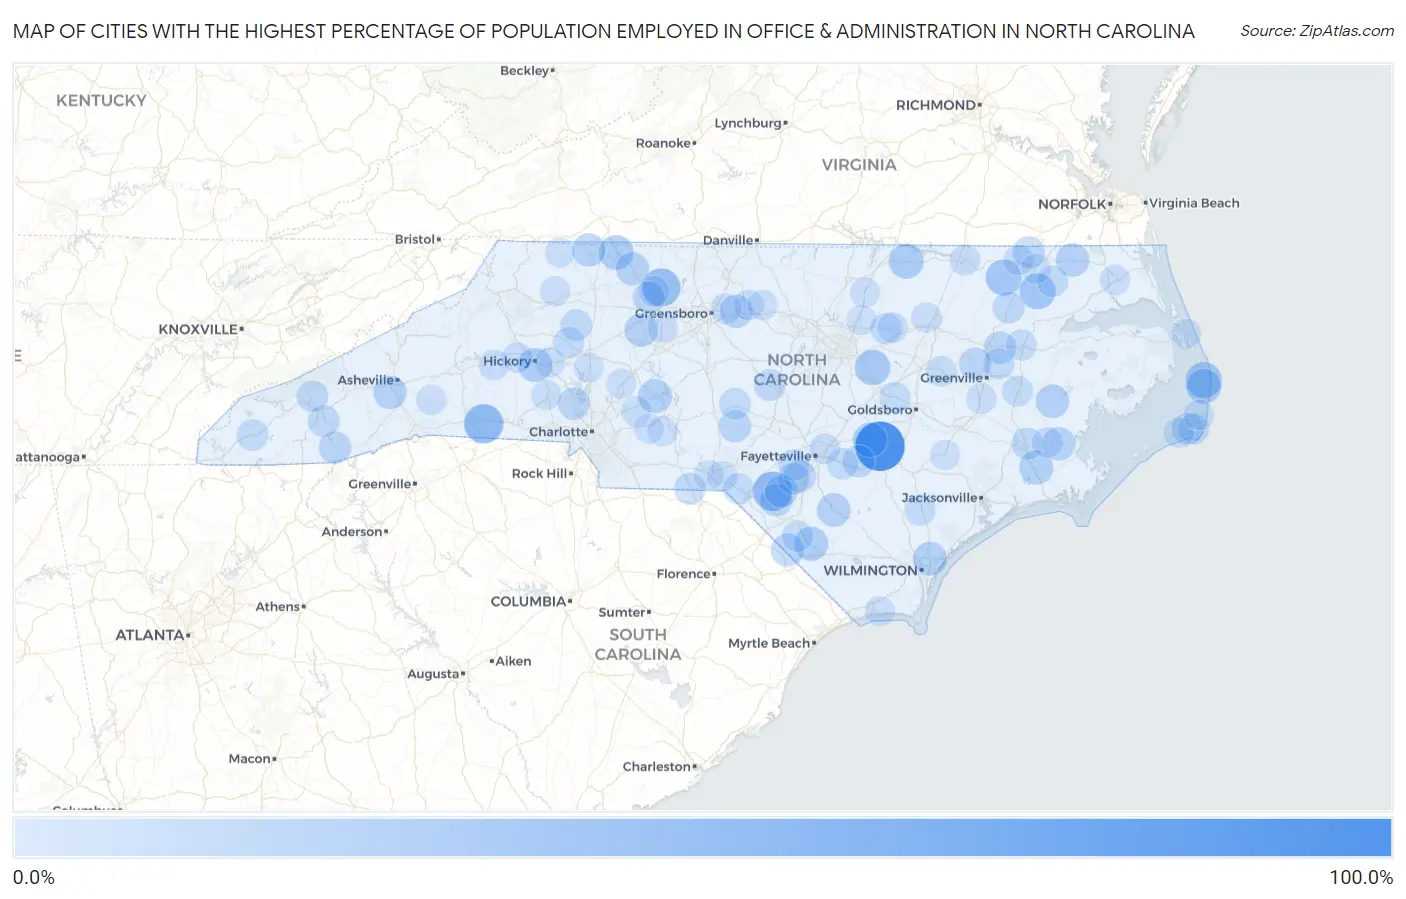
Map of Cities with the Highest Percentage of Population Employed in Office & Administration in North Carolina
0.0%
100.0%
Cities with the Highest Percentage of Population Employed in Office & Administration in North Carolina
| City | % Employed | vs State | vs National | |
| 1. | Keener | 81.7% | 10.2%(+71.5)#1 | 10.9%(+70.9)#60 |
| 2. | Caroleen | 45.9% | 10.2%(+35.7)#2 | 10.9%(+35.0)#275 |
| 3. | Wakulla | 45.9% | 10.2%(+35.7)#3 | 10.9%(+35.0)#276 |
| 4. | Germanton | 42.0% | 10.2%(+31.8)#4 | 10.9%(+31.1)#361 |
| 5. | Rodanthe | 35.3% | 10.2%(+25.1)#5 | 10.9%(+24.5)#556 |
| 6. | Woodland | 35.3% | 10.2%(+25.1)#6 | 10.9%(+24.4)#568 |
| 7. | Powellsville | 35.0% | 10.2%(+24.8)#7 | 10.9%(+24.1)#578 |
| 8. | Archer Lodge | 32.8% | 10.2%(+22.6)#8 | 10.9%(+21.9)#700 |
| 9. | Salvo | 31.6% | 10.2%(+21.4)#9 | 10.9%(+20.7)#753 |
| 10. | Macon | 31.0% | 10.2%(+20.8)#10 | 10.9%(+20.1)#788 |
| 11. | Toast | 30.7% | 10.2%(+20.5)#11 | 10.9%(+19.9)#803 |
| 12. | Vann Crossroads | 29.9% | 10.2%(+19.7)#12 | 10.9%(+19.1)#854 |
| 13. | Brookford | 28.7% | 10.2%(+18.5)#13 | 10.9%(+17.8)#943 |
| 14. | Evergreen | 28.6% | 10.2%(+18.4)#14 | 10.9%(+17.7)#947 |
| 15. | Neuse Forest | 28.3% | 10.2%(+18.1)#15 | 10.9%(+17.5)#979 |
| 16. | Misenheimer | 28.2% | 10.2%(+18.0)#16 | 10.9%(+17.3)#991 |
| 17. | Northchase | 27.7% | 10.2%(+17.5)#17 | 10.9%(+16.8)#1,036 |
| 18. | Bayview | 27.1% | 10.2%(+16.9)#18 | 10.9%(+16.3)#1,094 |
| 19. | Sunbury | 26.9% | 10.2%(+16.7)#19 | 10.9%(+16.0)#1,119 |
| 20. | Advance | 26.4% | 10.2%(+16.3)#20 | 10.9%(+15.6)#1,160 |
| 21. | Dublin | 26.4% | 10.2%(+16.2)#21 | 10.9%(+15.5)#1,164 |
| 22. | Bent Creek | 26.2% | 10.2%(+16.0)#22 | 10.9%(+15.4)#1,185 |
| 23. | Lowgap | 26.2% | 10.2%(+16.0)#23 | 10.9%(+15.3)#1,187 |
| 24. | Stonewall | 26.0% | 10.2%(+15.8)#24 | 10.9%(+15.2)#1,201 |
| 25. | Pilot Mountain | 25.7% | 10.2%(+15.5)#25 | 10.9%(+14.9)#1,223 |
| 26. | Whitsett | 25.6% | 10.2%(+15.4)#26 | 10.9%(+14.7)#1,244 |
| 27. | Marietta | 25.0% | 10.2%(+14.8)#27 | 10.9%(+14.1)#1,313 |
| 28. | Prospect | 24.3% | 10.2%(+14.1)#28 | 10.9%(+13.4)#1,423 |
| 29. | Red Springs | 23.9% | 10.2%(+13.7)#29 | 10.9%(+13.1)#1,468 |
| 30. | Robersonville | 23.6% | 10.2%(+13.4)#30 | 10.9%(+12.7)#1,537 |
| 31. | Cashiers | 23.1% | 10.2%(+12.9)#31 | 10.9%(+12.3)#1,614 |
| 32. | Seven Lakes | 23.0% | 10.2%(+12.8)#32 | 10.9%(+12.1)#1,631 |
| 33. | Parkton | 22.7% | 10.2%(+12.5)#33 | 10.9%(+11.9)#1,682 |
| 34. | Belvoir | 22.7% | 10.2%(+12.5)#34 | 10.9%(+11.9)#1,684 |
| 35. | Lowesville | 22.5% | 10.2%(+12.3)#35 | 10.9%(+11.7)#1,729 |
| 36. | Bethania | 22.5% | 10.2%(+12.3)#36 | 10.9%(+11.6)#1,748 |
| 37. | Salemburg | 22.2% | 10.2%(+12.0)#37 | 10.9%(+11.3)#1,811 |
| 38. | Como | 21.7% | 10.2%(+11.5)#38 | 10.9%(+10.9)#1,900 |
| 39. | Lumber Bridge | 21.7% | 10.2%(+11.5)#39 | 10.9%(+10.9)#1,903 |
| 40. | Gulf | 21.7% | 10.2%(+11.5)#40 | 10.9%(+10.8)#1,915 |
| 41. | Lewiston Woodville | 21.6% | 10.2%(+11.4)#41 | 10.9%(+10.7)#1,946 |
| 42. | Bridgeton | 21.5% | 10.2%(+11.3)#42 | 10.9%(+10.7)#1,959 |
| 43. | Forest Hills | 21.2% | 10.2%(+11.0)#43 | 10.9%(+10.4)#2,037 |
| 44. | Frisco | 21.0% | 10.2%(+10.8)#44 | 10.9%(+10.2)#2,094 |
| 45. | Love Valley | 20.9% | 10.2%(+10.7)#45 | 10.9%(+10.1)#2,118 |
| 46. | Mcfarlan | 20.9% | 10.2%(+10.7)#46 | 10.9%(+10.1)#2,119 |
| 47. | Cherokee | 20.7% | 10.2%(+10.5)#47 | 10.9%(+9.86)#2,186 |
| 48. | Andrews | 20.5% | 10.2%(+10.3)#48 | 10.9%(+9.67)#2,242 |
| 49. | Robbins | 20.4% | 10.2%(+10.2)#49 | 10.9%(+9.53)#2,282 |
| 50. | Bunn | 20.2% | 10.2%(+9.97)#50 | 10.9%(+9.31)#2,351 |
| 51. | Harrellsville | 20.0% | 10.2%(+9.80)#51 | 10.9%(+9.14)#2,413 |
| 52. | Rockfish | 19.9% | 10.2%(+9.67)#52 | 10.9%(+9.01)#2,475 |
| 53. | Stokes | 19.6% | 10.2%(+9.39)#53 | 10.9%(+8.73)#2,575 |
| 54. | Autryville | 19.6% | 10.2%(+9.37)#54 | 10.9%(+8.71)#2,582 |
| 55. | Princeton | 19.4% | 10.2%(+9.22)#55 | 10.9%(+8.56)#2,643 |
| 56. | Proctorville | 19.2% | 10.2%(+9.03)#56 | 10.9%(+8.37)#2,707 |
| 57. | Laurel Hill | 19.2% | 10.2%(+9.02)#57 | 10.9%(+8.36)#2,717 |
| 58. | Stony Point | 19.0% | 10.2%(+8.84)#58 | 10.9%(+8.19)#2,794 |
| 59. | Williamston | 19.0% | 10.2%(+8.76)#59 | 10.9%(+8.10)#2,819 |
| 60. | Buxton | 18.8% | 10.2%(+8.55)#60 | 10.9%(+7.89)#2,928 |
| 61. | Watha | 18.8% | 10.2%(+8.55)#61 | 10.9%(+7.89)#2,936 |
| 62. | Chocowinity | 18.7% | 10.2%(+8.53)#62 | 10.9%(+7.88)#2,961 |
| 63. | Grantsboro | 18.4% | 10.2%(+8.18)#63 | 10.9%(+7.52)#3,143 |
| 64. | Garysburg | 18.0% | 10.2%(+7.79)#64 | 10.9%(+7.14)#3,348 |
| 65. | Rural Hall | 17.9% | 10.2%(+7.65)#65 | 10.9%(+7.00)#3,426 |
| 66. | Eastover | 17.8% | 10.2%(+7.59)#66 | 10.9%(+6.93)#3,463 |
| 67. | Saratoga | 17.7% | 10.2%(+7.52)#67 | 10.9%(+6.86)#3,502 |
| 68. | Midway | 17.3% | 10.2%(+7.07)#68 | 10.9%(+6.42)#3,789 |
| 69. | Glenwood | 17.2% | 10.2%(+7.04)#69 | 10.9%(+6.38)#3,810 |
| 70. | Dobbins Heights | 17.2% | 10.2%(+7.01)#70 | 10.9%(+6.35)#3,830 |
| 71. | Hatteras | 17.2% | 10.2%(+6.96)#71 | 10.9%(+6.30)#3,864 |
| 72. | Ayden | 17.1% | 10.2%(+6.95)#72 | 10.9%(+6.29)#3,877 |
| 73. | Mcleansville | 17.1% | 10.2%(+6.94)#73 | 10.9%(+6.29)#3,881 |
| 74. | Chimney Rock Village | 17.0% | 10.2%(+6.85)#74 | 10.9%(+6.19)#3,941 |
| 75. | Red Oak | 17.0% | 10.2%(+6.83)#75 | 10.9%(+6.17)#3,957 |
| 76. | Glen Raven | 17.0% | 10.2%(+6.82)#76 | 10.9%(+6.17)#3,959 |
| 77. | Murfreesboro | 17.0% | 10.2%(+6.79)#77 | 10.9%(+6.13)#3,985 |
| 78. | Elizabeth City | 16.9% | 10.2%(+6.66)#78 | 10.9%(+6.01)#4,063 |
| 79. | Lake Royale | 16.8% | 10.2%(+6.65)#79 | 10.9%(+5.99)#4,071 |
| 80. | Salem | 16.8% | 10.2%(+6.61)#80 | 10.9%(+5.95)#4,104 |
| 81. | Connelly Springs | 16.6% | 10.2%(+6.43)#81 | 10.9%(+5.77)#4,252 |
| 82. | Mount Pleasant | 16.5% | 10.2%(+6.30)#82 | 10.9%(+5.65)#4,344 |
| 83. | Avon | 16.3% | 10.2%(+6.11)#83 | 10.9%(+5.46)#4,492 |
| 84. | Mulberry | 16.1% | 10.2%(+5.90)#84 | 10.9%(+5.24)#4,683 |
| 85. | Green Level | 16.1% | 10.2%(+5.90)#85 | 10.9%(+5.24)#4,685 |
| 86. | Kittrell | 16.1% | 10.2%(+5.87)#86 | 10.9%(+5.22)#4,713 |
| 87. | Aquadale | 16.1% | 10.2%(+5.87)#87 | 10.9%(+5.21)#4,718 |
| 88. | Pink Hill | 16.1% | 10.2%(+5.87)#88 | 10.9%(+5.21)#4,720 |
| 89. | Winton | 16.0% | 10.2%(+5.81)#89 | 10.9%(+5.16)#4,760 |
| 90. | Youngsville | 15.9% | 10.2%(+5.72)#90 | 10.9%(+5.07)#4,862 |
| 91. | Lincolnton | 15.9% | 10.2%(+5.71)#91 | 10.9%(+5.05)#4,884 |
| 92. | Holden Beach | 15.9% | 10.2%(+5.68)#92 | 10.9%(+5.02)#4,904 |
| 93. | Nags Head | 15.9% | 10.2%(+5.67)#93 | 10.9%(+5.01)#4,922 |
| 94. | Conover | 15.8% | 10.2%(+5.65)#94 | 10.9%(+4.99)#4,942 |
| 95. | China Grove | 15.8% | 10.2%(+5.60)#95 | 10.9%(+4.95)#4,973 |
| 96. | Sparta | 15.8% | 10.2%(+5.59)#96 | 10.9%(+4.93)#4,979 |
| 97. | Troutman | 15.8% | 10.2%(+5.59)#97 | 10.9%(+4.93)#5,002 |
| 98. | Cordova | 15.7% | 10.2%(+5.51)#98 | 10.9%(+4.85)#5,081 |
| 99. | Oakboro | 15.7% | 10.2%(+5.51)#99 | 10.9%(+4.85)#5,086 |
| 100. | Cherry Branch | 15.7% | 10.2%(+5.48)#100 | 10.9%(+4.82)#5,109 |
Common Questions
What are the Top 10 Cities with the Highest Percentage of Population Employed in Office & Administration in North Carolina?
Top 10 Cities with the Highest Percentage of Population Employed in Office & Administration in North Carolina are:
#1
81.7%
#2
45.9%
#3
45.9%
#4
42.0%
#5
35.3%
#6
35.3%
#7
35.0%
#8
32.8%
#9
31.6%
#10
31.0%
What city has the Highest Percentage of Population Employed in Office & Administration in North Carolina?
Keener has the Highest Percentage of Population Employed in Office & Administration in North Carolina with 81.7%.
What is the Percentage of Population Employed in Office & Administration in the State of North Carolina?
Percentage of Population Employed in Office & Administration in North Carolina is 10.2%.
What is the Percentage of Population Employed in Office & Administration in the United States?
Percentage of Population Employed in Office & Administration in the United States is 10.9%.