Mount Hebron, CA Map & Demographics
Mount Hebron Map
Mount Hebron Overview
$17,057
PER CAPITA INCOME
$75,694
AVG FAMILY INCOME
$75,694
AVG HOUSEHOLD INCOME
20.9%
WAGE / INCOME GAP [ % ]
79.1¢/ $1
WAGE / INCOME GAP [ $ ]
0.24
INEQUALITY / GINI INDEX
113
TOTAL POPULATION
45
MALE POPULATION
68
FEMALE POPULATION
66.18
MALES / 100 FEMALES
151.11
FEMALES / 100 MALES
40.0
MEDIAN AGE
5.0
AVG FAMILY SIZE
5.4
AVG HOUSEHOLD SIZE
59
LABOR FORCE [ PEOPLE ]
74.7%
PERCENT IN LABOR FORCE
22.0%
UNEMPLOYMENT RATE
Income in Mount Hebron
Income Overview in Mount Hebron
Per Capita Income in Mount Hebron is $17,057, while median incomes of families and households are $75,694 and $75,694 respectively.
| Characteristic | Number | Measure |
| Per Capita Income | 113 | $17,057 |
| Median Family Income | 21 | $75,694 |
| Mean Family Income | 21 | $67,052 |
| Median Household Income | 21 | $75,694 |
| Mean Household Income | 21 | $76,995 |
| Income Deficit | 21 | $0 |
| Wage / Income Gap (%) | 113 | 20.88% |
| Wage / Income Gap ($) | 113 | 79.12¢ per $1 |
| Gini / Inequality Index | 113 | 0.24 |
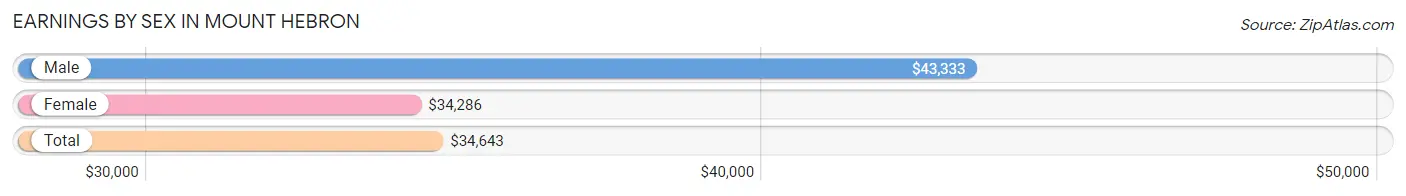
Earnings by Sex in Mount Hebron
Average Earnings in Mount Hebron are $34,643, $43,333 for men and $34,286 for women, a difference of 20.9%.
| Sex | Number | Average Earnings |
| Male | 16 (34.8%) | $43,333 |
| Female | 30 (65.2%) | $34,286 |
| Total | 46 (100.0%) | $34,643 |
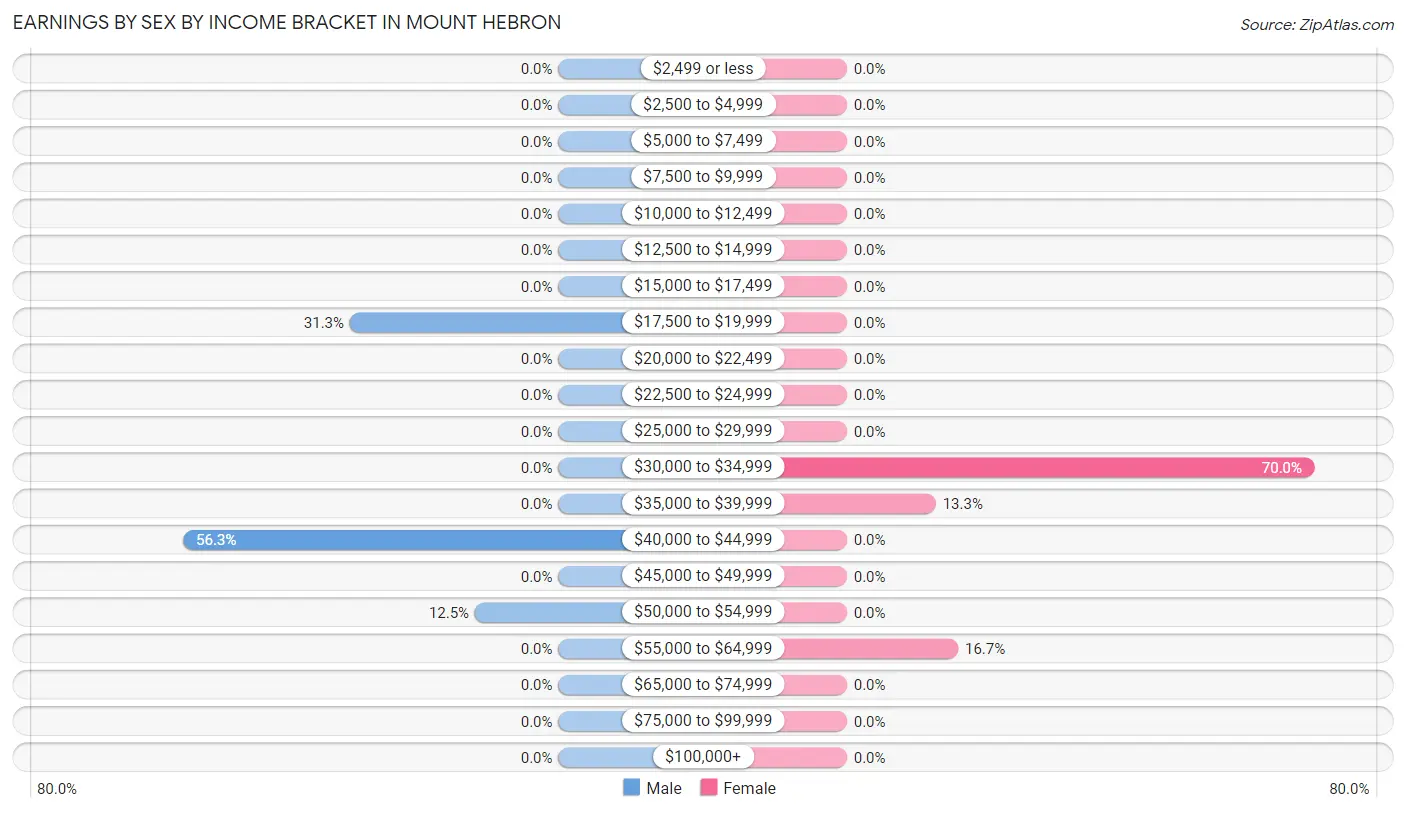
Earnings by Sex by Income Bracket in Mount Hebron
The most common earnings brackets in Mount Hebron are $40,000 to $44,999 for men (9 | 56.2%) and $30,000 to $34,999 for women (21 | 70.0%).
| Income | Male | Female |
| $2,499 or less | 0 (0.0%) | 0 (0.0%) |
| $2,500 to $4,999 | 0 (0.0%) | 0 (0.0%) |
| $5,000 to $7,499 | 0 (0.0%) | 0 (0.0%) |
| $7,500 to $9,999 | 0 (0.0%) | 0 (0.0%) |
| $10,000 to $12,499 | 0 (0.0%) | 0 (0.0%) |
| $12,500 to $14,999 | 0 (0.0%) | 0 (0.0%) |
| $15,000 to $17,499 | 0 (0.0%) | 0 (0.0%) |
| $17,500 to $19,999 | 5 (31.2%) | 0 (0.0%) |
| $20,000 to $22,499 | 0 (0.0%) | 0 (0.0%) |
| $22,500 to $24,999 | 0 (0.0%) | 0 (0.0%) |
| $25,000 to $29,999 | 0 (0.0%) | 0 (0.0%) |
| $30,000 to $34,999 | 0 (0.0%) | 21 (70.0%) |
| $35,000 to $39,999 | 0 (0.0%) | 4 (13.3%) |
| $40,000 to $44,999 | 9 (56.2%) | 0 (0.0%) |
| $45,000 to $49,999 | 0 (0.0%) | 0 (0.0%) |
| $50,000 to $54,999 | 2 (12.5%) | 0 (0.0%) |
| $55,000 to $64,999 | 0 (0.0%) | 5 (16.7%) |
| $65,000 to $74,999 | 0 (0.0%) | 0 (0.0%) |
| $75,000 to $99,999 | 0 (0.0%) | 0 (0.0%) |
| $100,000+ | 0 (0.0%) | 0 (0.0%) |
| Total | 16 (100.0%) | 30 (100.0%) |
Earnings by Sex by Educational Attainment in Mount Hebron
| Educational Attainment | Male Income | Female Income |
| Less than High School | - | - |
| High School Diploma | - | - |
| College or Associate's Degree | - | - |
| Bachelor's Degree | - | - |
| Graduate Degree | - | - |
| Total | - | - |
Family Income in Mount Hebron
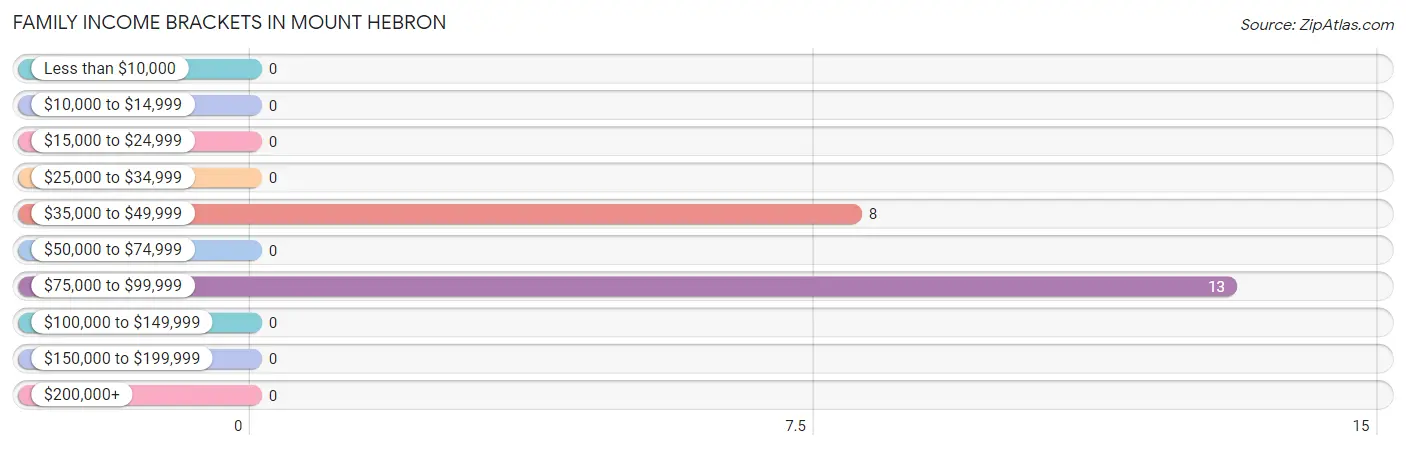
Family Income Brackets in Mount Hebron
According to the Mount Hebron family income data, there are 13 families falling into the $75,000 to $99,999 income range, which is the most common income bracket and makes up 61.9% of all families.
| Income Bracket | # Families | % Families |
| Less than $10,000 | 0 | 0.0% |
| $10,000 to $14,999 | 0 | 0.0% |
| $15,000 to $24,999 | 0 | 0.0% |
| $25,000 to $34,999 | 0 | 0.0% |
| $35,000 to $49,999 | 8 | 38.1% |
| $50,000 to $74,999 | 0 | 0.0% |
| $75,000 to $99,999 | 13 | 61.9% |
| $100,000 to $149,999 | 0 | 0.0% |
| $150,000 to $199,999 | 0 | 0.0% |
| $200,000+ | 0 | 0.0% |
Family Income by Famaliy Size in Mount Hebron
| Income Bracket | # Families | Median Income |
| 2-Person Families | 0 (0.0%) | $0 |
| 3-Person Families | 0 (0.0%) | $0 |
| 4-Person Families | 13 (61.9%) | $0 |
| 5-Person Families | 8 (38.1%) | $0 |
| 6-Person Families | 0 (0.0%) | $0 |
| 7+ Person Families | 0 (0.0%) | $0 |
| Total | 21 (100.0%) | $75,694 |
Family Income by Number of Earners in Mount Hebron
| Number of Earners | # Families | Median Income |
| No Earners | 0 (0.0%) | $0 |
| 1 Earner | 8 (38.1%) | $0 |
| 2 Earners | 13 (61.9%) | $0 |
| 3+ Earners | 0 (0.0%) | $0 |
| Total | 21 (100.0%) | $75,694 |
Household Income in Mount Hebron
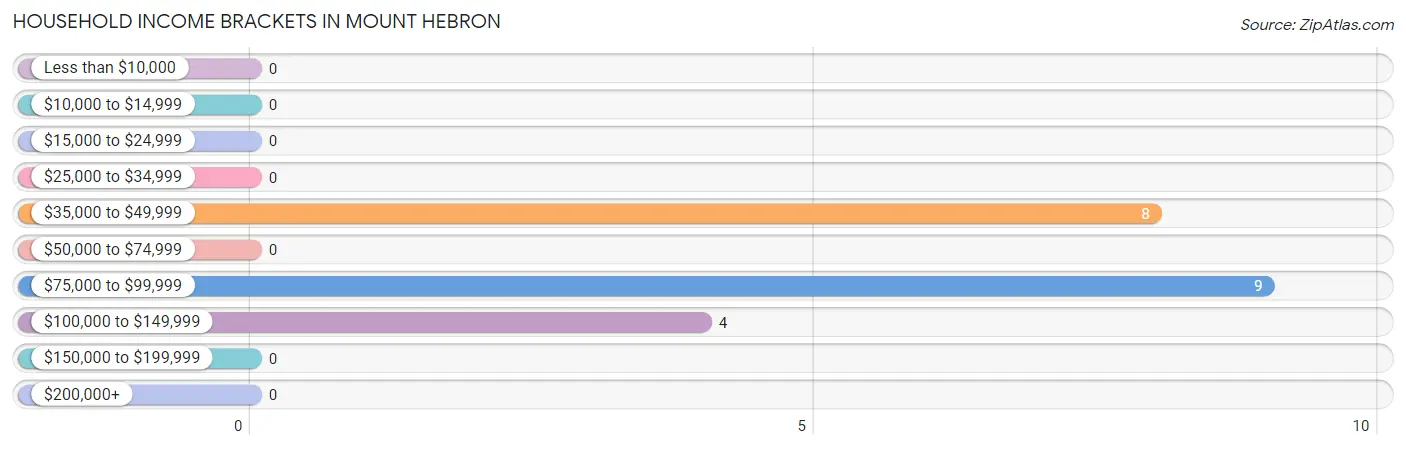
Household Income Brackets in Mount Hebron
With 9 households falling in the category, the $75,000 to $99,999 income range is the most frequent in Mount Hebron, accounting for 42.9% of all households.
| Income Bracket | # Households | % Households |
| Less than $10,000 | 0 | 0.0% |
| $10,000 to $14,999 | 0 | 0.0% |
| $15,000 to $24,999 | 0 | 0.0% |
| $25,000 to $34,999 | 0 | 0.0% |
| $35,000 to $49,999 | 8 | 38.1% |
| $50,000 to $74,999 | 0 | 0.0% |
| $75,000 to $99,999 | 9 | 42.9% |
| $100,000 to $149,999 | 4 | 19.0% |
| $150,000 to $199,999 | 0 | 0.0% |
| $200,000+ | 0 | 0.0% |
Household Income by Householder Age in Mount Hebron
| Income Bracket | # Households | Median Income |
| 15 to 24 Years | 0 (0.0%) | $0 |
| 25 to 44 Years | 8 (38.1%) | $0 |
| 45 to 64 Years | 13 (61.9%) | $0 |
| 65+ Years | 0 (0.0%) | $0 |
| Total | 21 (100.0%) | $75,694 |
Poverty in Mount Hebron
Income Below Poverty by Sex and Age in Mount Hebron
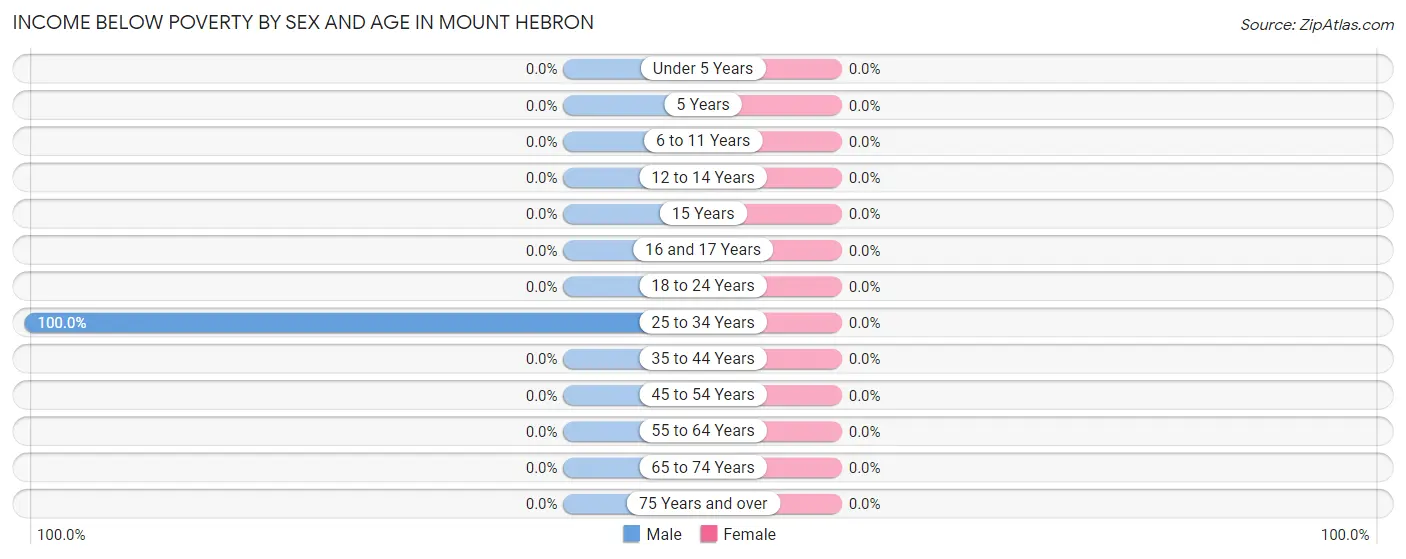
| Age Bracket | Male | Female |
| Under 5 Years | 0 (0.0%) | 0 (0.0%) |
| 5 Years | 0 (0.0%) | 0 (0.0%) |
| 6 to 11 Years | 0 (0.0%) | 0 (0.0%) |
| 12 to 14 Years | 0 (0.0%) | 0 (0.0%) |
| 15 Years | 0 (0.0%) | 0 (0.0%) |
| 16 and 17 Years | 0 (0.0%) | 0 (0.0%) |
| 18 to 24 Years | 0 (0.0%) | 0 (0.0%) |
| 25 to 34 Years | 5 (100.0%) | 0 (0.0%) |
| 35 to 44 Years | 0 (0.0%) | 0 (0.0%) |
| 45 to 54 Years | 0 (0.0%) | 0 (0.0%) |
| 55 to 64 Years | 0 (0.0%) | 0 (0.0%) |
| 65 to 74 Years | 0 (0.0%) | 0 (0.0%) |
| 75 Years and over | 0 (0.0%) | 0 (0.0%) |
| Total | 5 (11.1%) | 0 (0.0%) |
Income Above Poverty by Sex and Age in Mount Hebron
According to the poverty statistics in Mount Hebron, males aged under 5 years and females aged 6 to 11 years are the age groups that are most secure financially, with 100.0% of males and 100.0% of females in these age groups living above the poverty line.
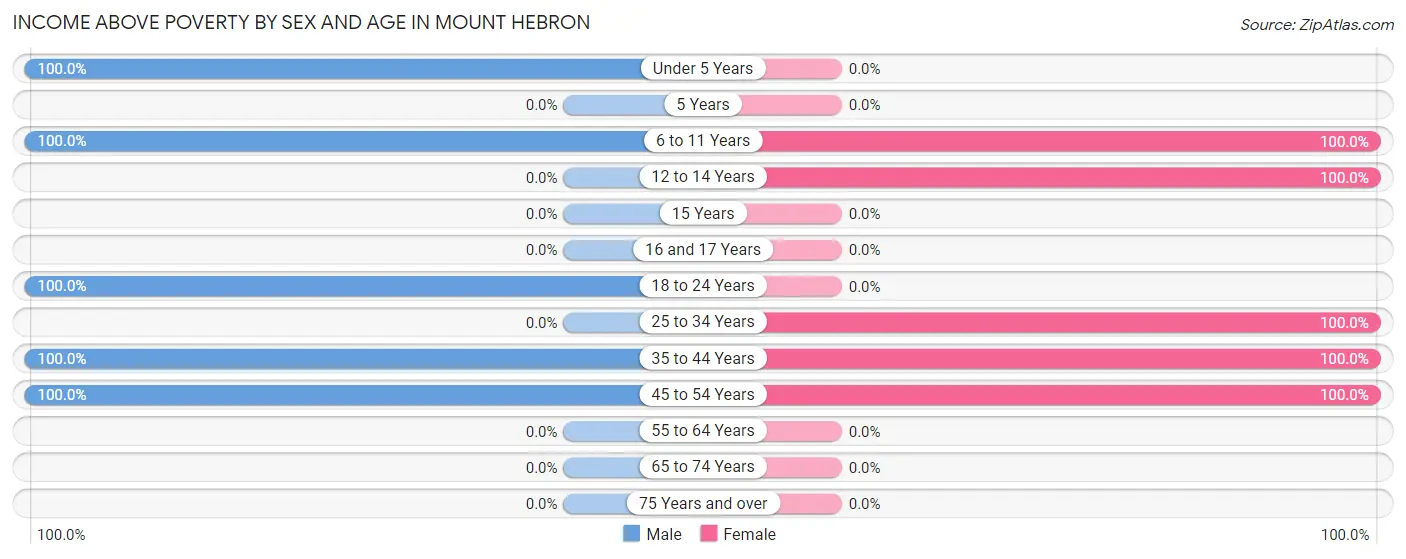
| Age Bracket | Male | Female |
| Under 5 Years | 5 (100.0%) | 0 (0.0%) |
| 5 Years | 0 (0.0%) | 0 (0.0%) |
| 6 to 11 Years | 4 (100.0%) | 18 (100.0%) |
| 12 to 14 Years | 0 (0.0%) | 7 (100.0%) |
| 15 Years | 0 (0.0%) | 0 (0.0%) |
| 16 and 17 Years | 0 (0.0%) | 0 (0.0%) |
| 18 to 24 Years | 12 (100.0%) | 0 (0.0%) |
| 25 to 34 Years | 0 (0.0%) | 5 (100.0%) |
| 35 to 44 Years | 8 (100.0%) | 34 (100.0%) |
| 45 to 54 Years | 11 (100.0%) | 4 (100.0%) |
| 55 to 64 Years | 0 (0.0%) | 0 (0.0%) |
| 65 to 74 Years | 0 (0.0%) | 0 (0.0%) |
| 75 Years and over | 0 (0.0%) | 0 (0.0%) |
| Total | 40 (88.9%) | 68 (100.0%) |
Income Below Poverty Among Married-Couple Families in Mount Hebron
| Children | Above Poverty | Below Poverty |
| No Children | 0 (0.0%) | 0 (0.0%) |
| 1 or 2 Children | 17 (100.0%) | 0 (0.0%) |
| 3 or 4 Children | 0 (0.0%) | 0 (0.0%) |
| 5 or more Children | 0 (0.0%) | 0 (0.0%) |
| Total | 17 (100.0%) | 0 (0.0%) |
Income Below Poverty Among Single-Parent Households in Mount Hebron
| Children | Single Father | Single Mother |
| No Children | 0 (0.0%) | 0 (0.0%) |
| 1 or 2 Children | 0 (0.0%) | 0 (0.0%) |
| 3 or 4 Children | 0 (0.0%) | 0 (0.0%) |
| 5 or more Children | 0 (0.0%) | 0 (0.0%) |
| Total | 0 (0.0%) | 0 (0.0%) |
Income Below Poverty Among Married-Couple vs Single-Parent Households in Mount Hebron
| Children | Married-Couple Families | Single-Parent Households |
| No Children | 0 (0.0%) | 0 (0.0%) |
| 1 or 2 Children | 0 (0.0%) | 0 (0.0%) |
| 3 or 4 Children | 0 (0.0%) | 0 (0.0%) |
| 5 or more Children | 0 (0.0%) | 0 (0.0%) |
| Total | 0 (0.0%) | 0 (0.0%) |
Race in Mount Hebron
The most populous races in Mount Hebron are Hispanic or Latino (109 | 96.5%), White / Caucasian (66 | 58.4%), and Two or more Races (40 | 35.4%).
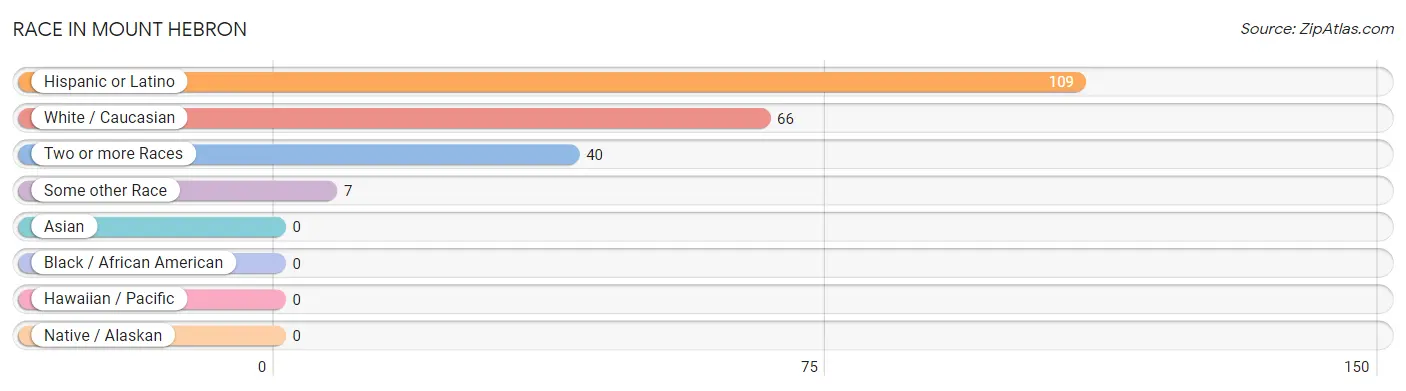
| Race | # Population | % Population |
| Asian | 0 | 0.0% |
| Black / African American | 0 | 0.0% |
| Hawaiian / Pacific | 0 | 0.0% |
| Hispanic or Latino | 109 | 96.5% |
| Native / Alaskan | 0 | 0.0% |
| White / Caucasian | 66 | 58.4% |
| Two or more Races | 40 | 35.4% |
| Some other Race | 7 | 6.2% |
| Total | 113 | 100.0% |
Ancestry in Mount Hebron
The most populous ancestries reported in Mount Hebron are Mexican (109 | 96.5%), English (4 | 3.5%), and Irish (4 | 3.5%), together accounting for 103.5% of all Mount Hebron residents.
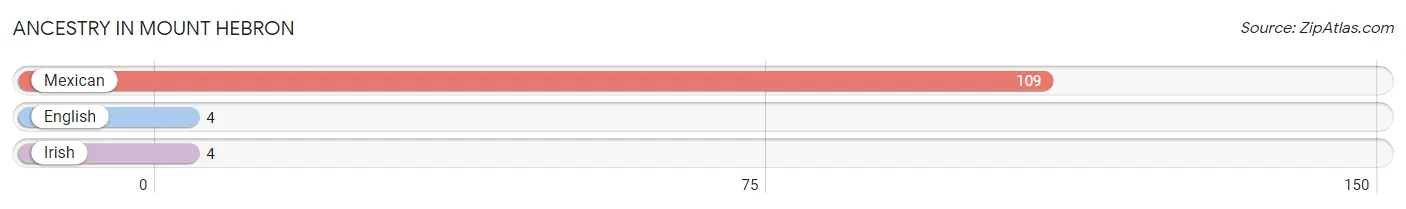
| Ancestry | # Population | % Population |
| English | 4 | 3.5% |
| Irish | 4 | 3.5% |
| Mexican | 109 | 96.5% | View All 3 Rows |
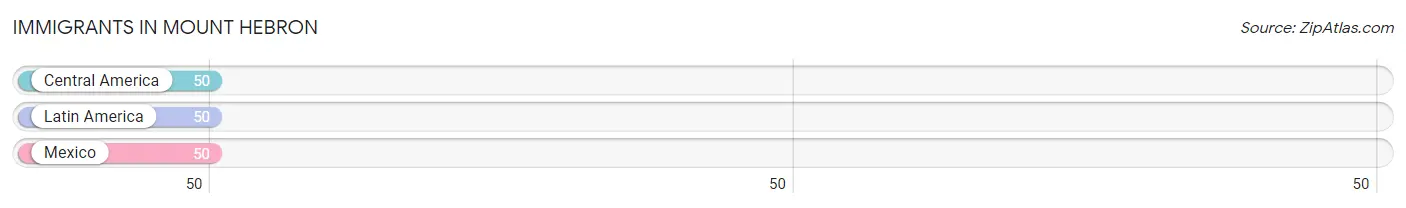
Immigrants in Mount Hebron
The most numerous immigrant groups reported in Mount Hebron came from Central America (50 | 44.3%), Latin America (50 | 44.3%), and Mexico (50 | 44.3%), together accounting for 132.8% of all Mount Hebron residents.
| Immigration Origin | # Population | % Population |
| Central America | 50 | 44.3% |
| Latin America | 50 | 44.3% |
| Mexico | 50 | 44.3% | View All 3 Rows |
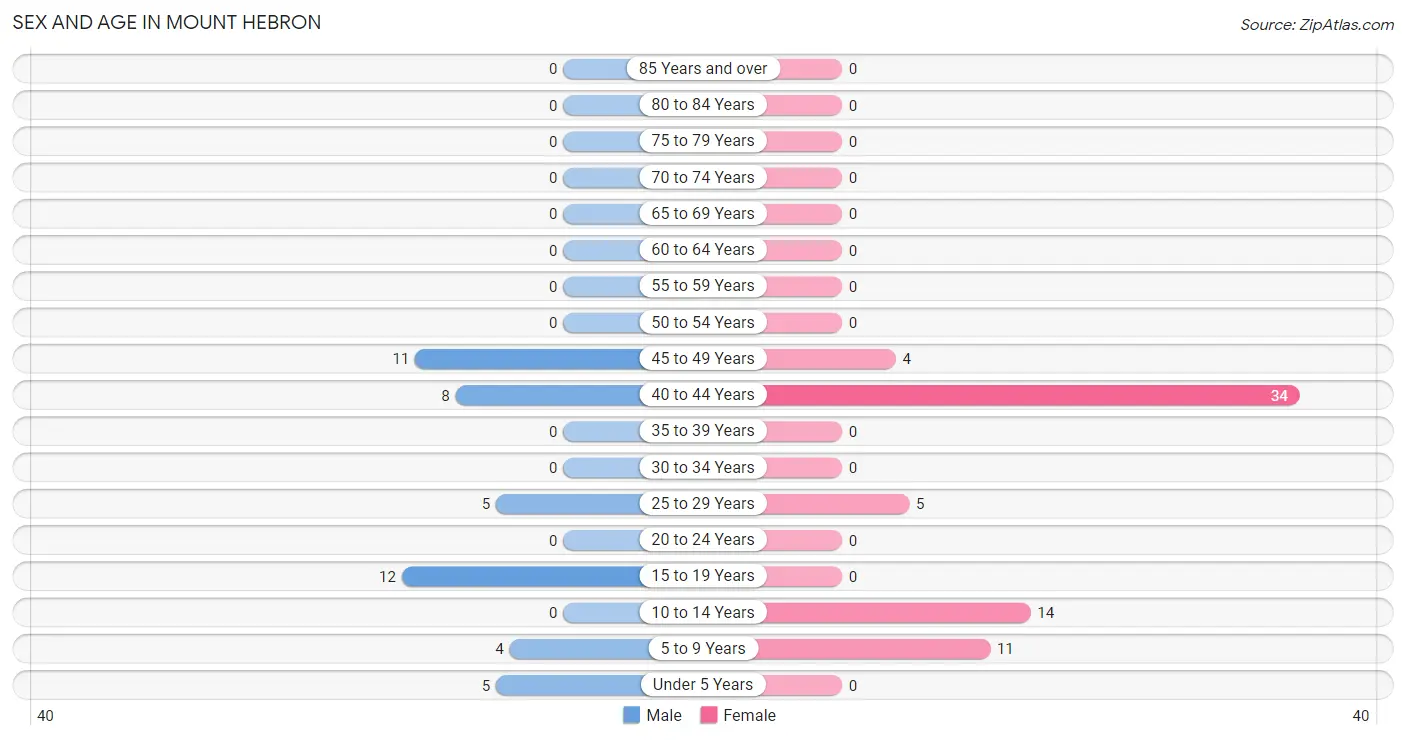
Sex and Age in Mount Hebron
Sex and Age in Mount Hebron
The most populous age groups in Mount Hebron are 15 to 19 Years (12 | 26.7%) for men and 40 to 44 Years (34 | 50.0%) for women.
| Age Bracket | Male | Female |
| Under 5 Years | 5 (11.1%) | 0 (0.0%) |
| 5 to 9 Years | 4 (8.9%) | 11 (16.2%) |
| 10 to 14 Years | 0 (0.0%) | 14 (20.6%) |
| 15 to 19 Years | 12 (26.7%) | 0 (0.0%) |
| 20 to 24 Years | 0 (0.0%) | 0 (0.0%) |
| 25 to 29 Years | 5 (11.1%) | 5 (7.3%) |
| 30 to 34 Years | 0 (0.0%) | 0 (0.0%) |
| 35 to 39 Years | 0 (0.0%) | 0 (0.0%) |
| 40 to 44 Years | 8 (17.8%) | 34 (50.0%) |
| 45 to 49 Years | 11 (24.4%) | 4 (5.9%) |
| 50 to 54 Years | 0 (0.0%) | 0 (0.0%) |
| 55 to 59 Years | 0 (0.0%) | 0 (0.0%) |
| 60 to 64 Years | 0 (0.0%) | 0 (0.0%) |
| 65 to 69 Years | 0 (0.0%) | 0 (0.0%) |
| 70 to 74 Years | 0 (0.0%) | 0 (0.0%) |
| 75 to 79 Years | 0 (0.0%) | 0 (0.0%) |
| 80 to 84 Years | 0 (0.0%) | 0 (0.0%) |
| 85 Years and over | 0 (0.0%) | 0 (0.0%) |
| Total | 45 (100.0%) | 68 (100.0%) |
Families and Households in Mount Hebron
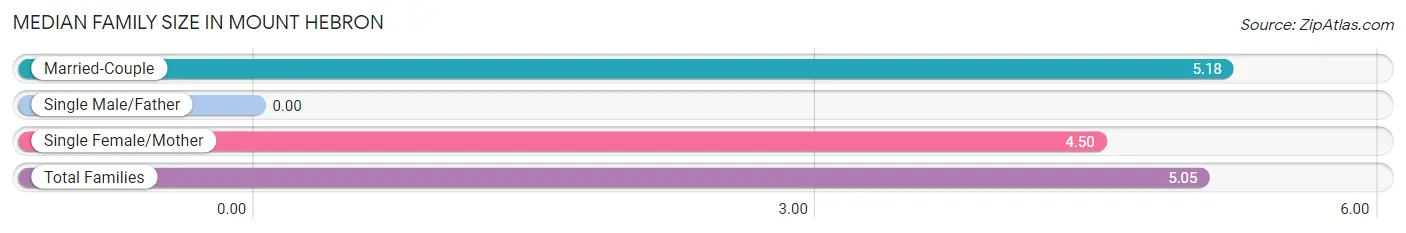
Median Family Size in Mount Hebron
| Family Type | # Families | Family Size |
| Married-Couple | 17 (80.9%) | 5.18 |
| Single Male/Father | 0 (0.0%) | - |
| Single Female/Mother | 4 (19.1%) | 4.50 |
| Total Families | 21 (100.0%) | 5.05 |
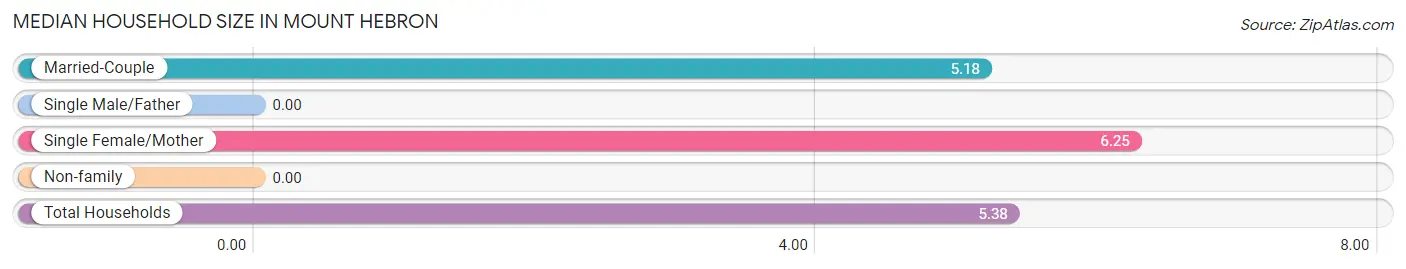
Median Household Size in Mount Hebron
| Household Type | # Households | Household Size |
| Married-Couple | 17 (80.9%) | 5.18 |
| Single Male/Father | 0 (0.0%) | - |
| Single Female/Mother | 4 (19.1%) | 6.25 |
| Non-family | 0 (0.0%) | - |
| Total Households | 21 (100.0%) | 5.38 |
Household Size by Marriage Status in Mount Hebron
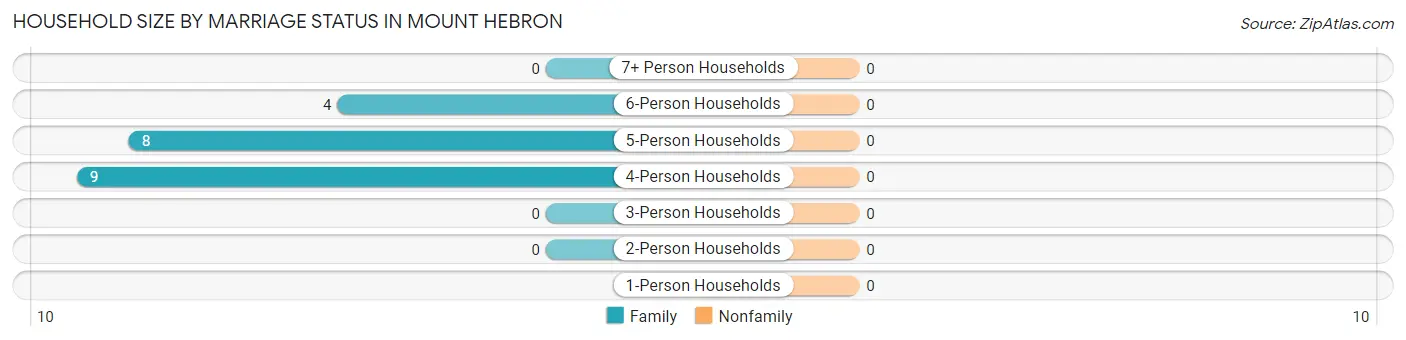
| Household Size | Family Households | Nonfamily Households |
| 1-Person Households | - | 0 (0.0%) |
| 2-Person Households | 0 (0.0%) | 0 (0.0%) |
| 3-Person Households | 0 (0.0%) | 0 (0.0%) |
| 4-Person Households | 9 (42.9%) | 0 (0.0%) |
| 5-Person Households | 8 (38.1%) | 0 (0.0%) |
| 6-Person Households | 4 (19.1%) | 0 (0.0%) |
| 7+ Person Households | 0 (0.0%) | 0 (0.0%) |
| Total | 21 (100.0%) | 0 (0.0%) |
Female Fertility in Mount Hebron
Fertility by Age in Mount Hebron
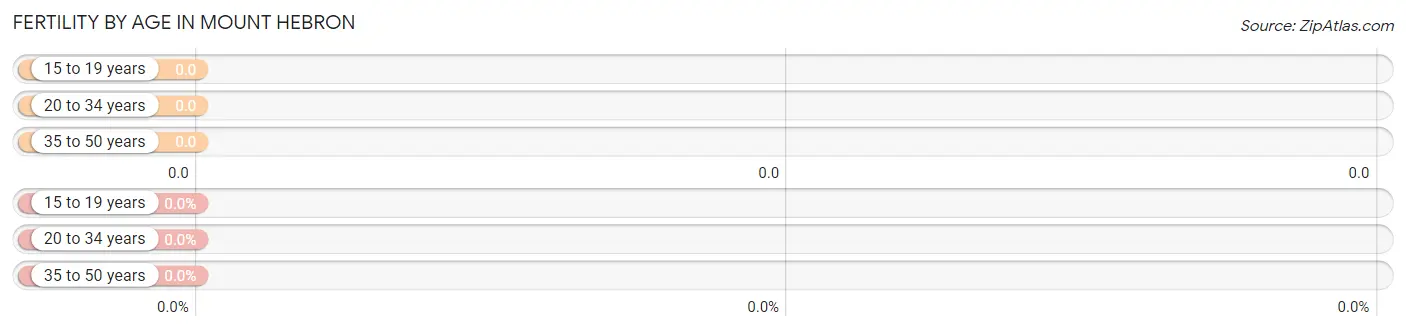
| Age Bracket | Women with Births | Births / 1,000 Women |
| 15 to 19 years | 0 (0.0%) | 0.0 |
| 20 to 34 years | 0 (0.0%) | 0.0 |
| 35 to 50 years | 0 (0.0%) | 0.0 |
| Total | 0 (0.0%) | 0.0 |
Fertility by Age by Marriage Status in Mount Hebron
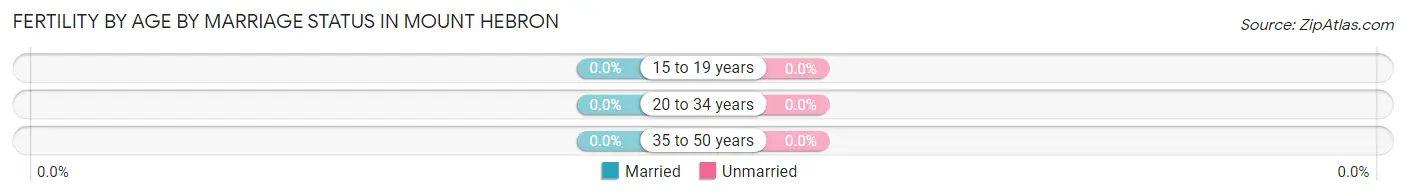
| Age Bracket | Married | Unmarried |
| 15 to 19 years | 0 (0.0%) | 0 (0.0%) |
| 20 to 34 years | 0 (0.0%) | 0 (0.0%) |
| 35 to 50 years | 0 (0.0%) | 0 (0.0%) |
| Total | 0 (0.0%) | 0 (0.0%) |
Fertility by Education in Mount Hebron
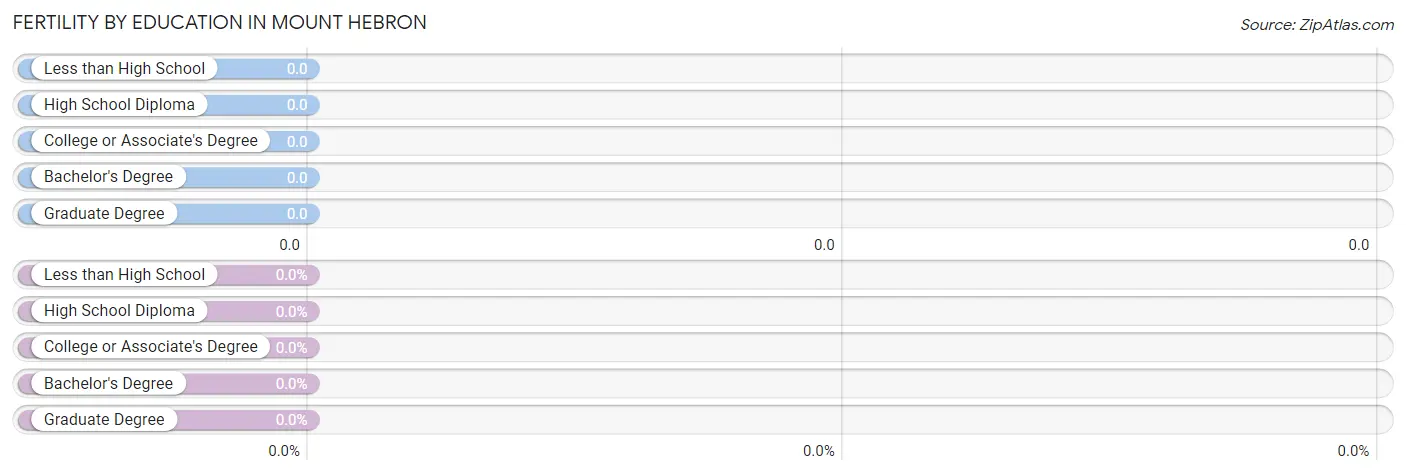
| Educational Attainment | Women with Births | Births / 1,000 Women |
| Less than High School | 0 (0.0%) | 0.0 |
| High School Diploma | 0 (0.0%) | 0.0 |
| College or Associate's Degree | 0 (0.0%) | 0.0 |
| Bachelor's Degree | 0 (0.0%) | 0.0 |
| Graduate Degree | 0 (0.0%) | 0.0 |
| Total | 0 (0.0%) | 0.0 |
Fertility by Education by Marriage Status in Mount Hebron
| Educational Attainment | Married | Unmarried |
| Less than High School | 0 (0.0%) | 0 (0.0%) |
| High School Diploma | 0 (0.0%) | 0 (0.0%) |
| College or Associate's Degree | 0 (0.0%) | 0 (0.0%) |
| Bachelor's Degree | 0 (0.0%) | 0 (0.0%) |
| Graduate Degree | 0 (0.0%) | 0 (0.0%) |
| Total | 0 (0.0%) | 0 (0.0%) |
Employment Characteristics in Mount Hebron
Employment by Class of Employer in Mount Hebron
Among the 46 employed individuals in Mount Hebron, private company employees (37 | 80.4%), local government employees (5 | 10.9%), and federal government employees (4 | 8.7%) make up the most common classes of employment.
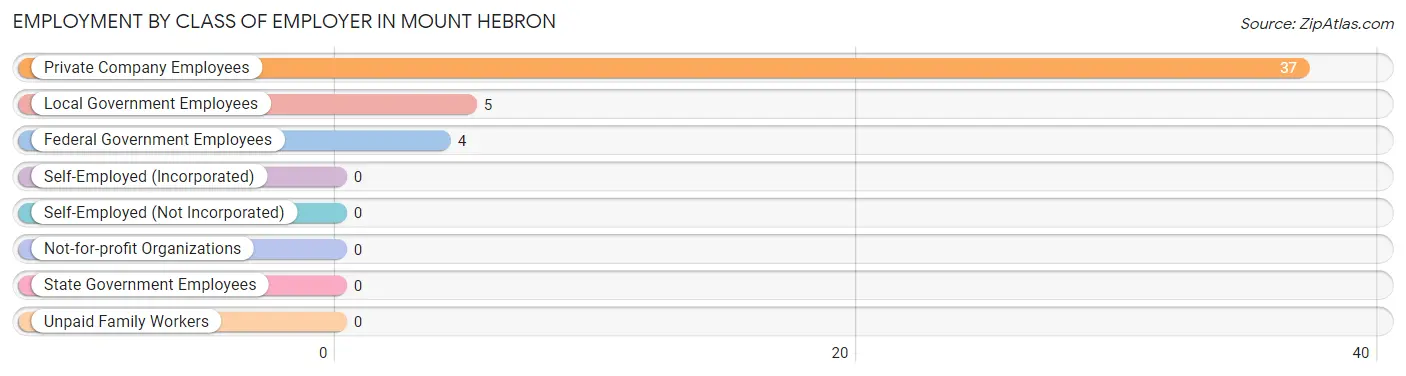
| Employer Class | # Employees | % Employees |
| Private Company Employees | 37 | 80.4% |
| Self-Employed (Incorporated) | 0 | 0.0% |
| Self-Employed (Not Incorporated) | 0 | 0.0% |
| Not-for-profit Organizations | 0 | 0.0% |
| Local Government Employees | 5 | 10.9% |
| State Government Employees | 0 | 0.0% |
| Federal Government Employees | 4 | 8.7% |
| Unpaid Family Workers | 0 | 0.0% |
| Total | 46 | 100.0% |
Employment Status by Age in Mount Hebron
According to the labor force statistics for Mount Hebron, out of the total population over 16 years of age (79), 74.7% or 59 individuals are in the labor force, with 22.0% or 13 of them unemployed. The age group with the highest labor force participation rate is 25 to 29 years, with 100.0% or 10 individuals in the labor force. Within the labor force, the 25 to 29 years age range has the highest percentage of unemployed individuals, with 50.0% or 5 of them being unemployed.
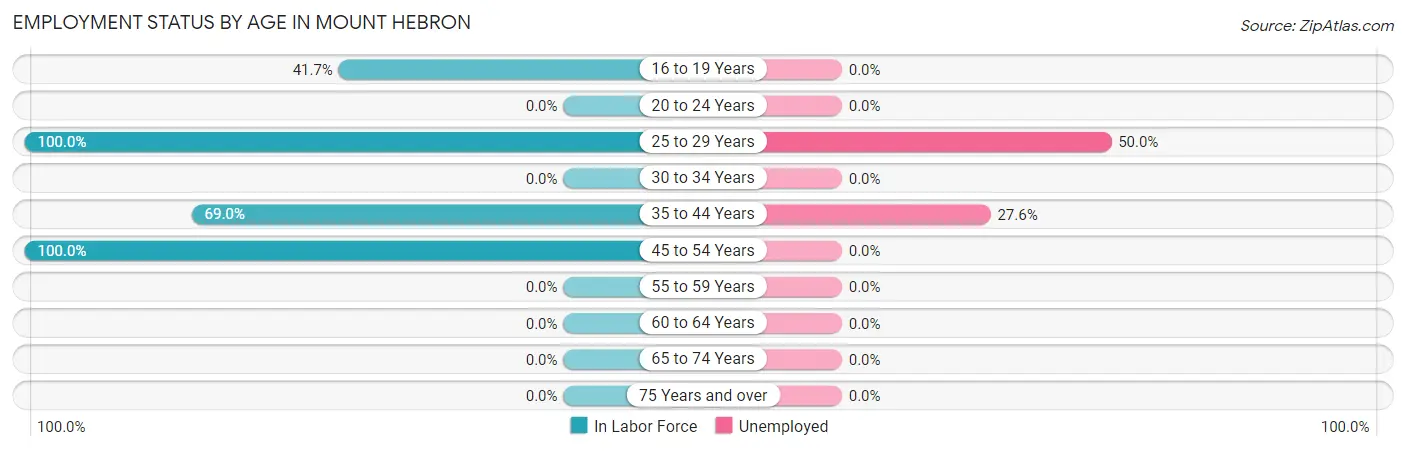
| Age Bracket | In Labor Force | Unemployed |
| 16 to 19 Years | 5 (41.7%) | 0 (0.0%) |
| 20 to 24 Years | 0 (0.0%) | 0 (0.0%) |
| 25 to 29 Years | 10 (100.0%) | 5 (50.0%) |
| 30 to 34 Years | 0 (0.0%) | 0 (0.0%) |
| 35 to 44 Years | 29 (69.0%) | 8 (27.6%) |
| 45 to 54 Years | 15 (100.0%) | 0 (0.0%) |
| 55 to 59 Years | 0 (0.0%) | 0 (0.0%) |
| 60 to 64 Years | 0 (0.0%) | 0 (0.0%) |
| 65 to 74 Years | 0 (0.0%) | 0 (0.0%) |
| 75 Years and over | 0 (0.0%) | 0 (0.0%) |
| Total | 59 (74.7%) | 13 (22.0%) |
Employment Status by Educational Attainment in Mount Hebron
According to labor force statistics for Mount Hebron, 80.6% of individuals (54) out of the total population between 25 and 64 years of age (67) are in the labor force, with 24.1% or 13 of them being unemployed. The group with the highest labor force participation rate are those with the educational attainment of high school diploma, with 100.0% or 33 individuals in the labor force. Within the labor force, individuals with high school diploma education have the highest percentage of unemployment, with 24.2% or 8 of them being unemployed.
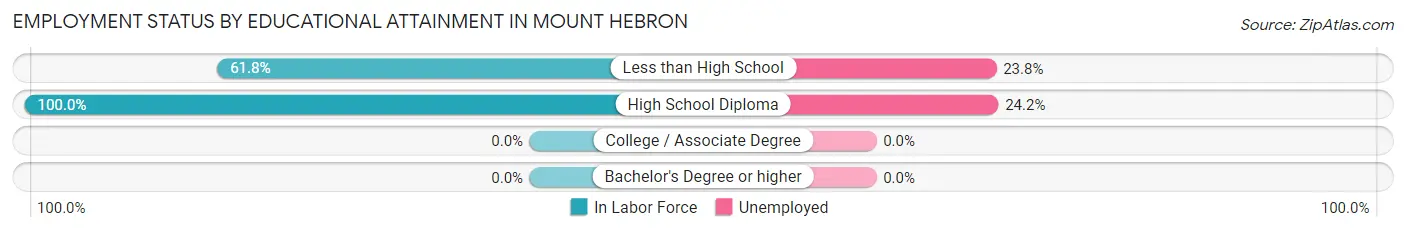
| Educational Attainment | In Labor Force | Unemployed |
| Less than High School | 21 (61.8%) | 8 (23.8%) |
| High School Diploma | 33 (100.0%) | 8 (24.2%) |
| College / Associate Degree | 0 (0.0%) | 0 (0.0%) |
| Bachelor's Degree or higher | 0 (0.0%) | 0 (0.0%) |
| Total | 54 (80.6%) | 16 (24.1%) |
Employment Occupations by Sex in Mount Hebron
Management, Business, Science and Arts Occupations
Management, Business, Science and Arts Occupations by Sex
| Occupation | Male | Female |
| Management | 0 (0.0%) | 0 (0.0%) |
| Business & Financial | 0 (0.0%) | 0 (0.0%) |
| Computers, Engineering & Science | 0 (0.0%) | 0 (0.0%) |
| Computers & Mathematics | 0 (0.0%) | 0 (0.0%) |
| Architecture & Engineering | 0 (0.0%) | 0 (0.0%) |
| Life, Physical & Social Science | 0 (0.0%) | 0 (0.0%) |
| Community & Social Service | 0 (0.0%) | 0 (0.0%) |
| Education, Arts & Media | 0 (0.0%) | 0 (0.0%) |
| Legal Services & Support | 0 (0.0%) | 0 (0.0%) |
| Education Instruction & Library | 0 (0.0%) | 0 (0.0%) |
| Arts, Media & Entertainment | 0 (0.0%) | 0 (0.0%) |
| Health Diagnosing & Treating | 0 (0.0%) | 0 (0.0%) |
| Health Technologists | 0 (0.0%) | 0 (0.0%) |
| Total (Category) | 0 (0.0%) | 0 (0.0%) |
| Total (Overall) | 16 (34.8%) | 30 (65.2%) |
Services Occupations
Services Occupations by Sex
| Occupation | Male | Female |
| Healthcare Support | 0 (0.0%) | 0 (0.0%) |
| Security & Protection | 0 (0.0%) | 0 (0.0%) |
| Firefighting & Prevention | 0 (0.0%) | 0 (0.0%) |
| Law Enforcement | 0 (0.0%) | 0 (0.0%) |
| Food Preparation & Serving | 0 (0.0%) | 0 (0.0%) |
| Cleaning & Maintenance | 0 (0.0%) | 0 (0.0%) |
| Personal Care & Service | 0 (0.0%) | 0 (0.0%) |
| Total (Category) | 0 (0.0%) | 0 (0.0%) |
| Total (Overall) | 16 (34.8%) | 30 (65.2%) |
Sales and Office Occupations
The most common Sales and Office occupations in Mount Hebron are , and Office & Administration (35 | 76.1%).
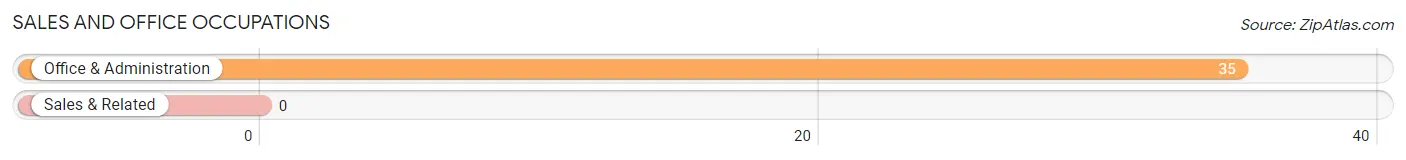
Sales and Office Occupations by Sex
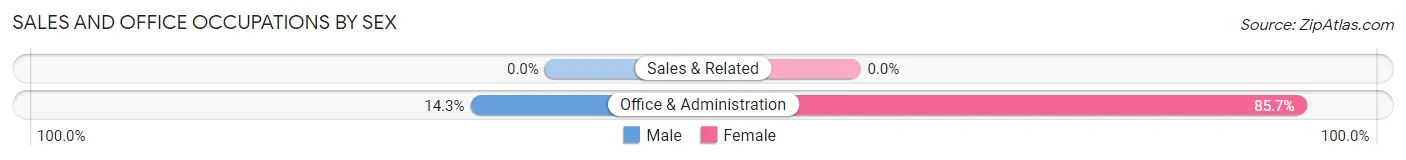
| Occupation | Male | Female |
| Sales & Related | 0 (0.0%) | 0 (0.0%) |
| Office & Administration | 5 (14.3%) | 30 (85.7%) |
| Total (Category) | 5 (14.3%) | 30 (85.7%) |
| Total (Overall) | 16 (34.8%) | 30 (65.2%) |
Natural Resources, Construction and Maintenance Occupations
The most common Natural Resources, Construction and Maintenance occupations in Mount Hebron are , and Farming, Fishing & Forestry (9 | 19.6%).
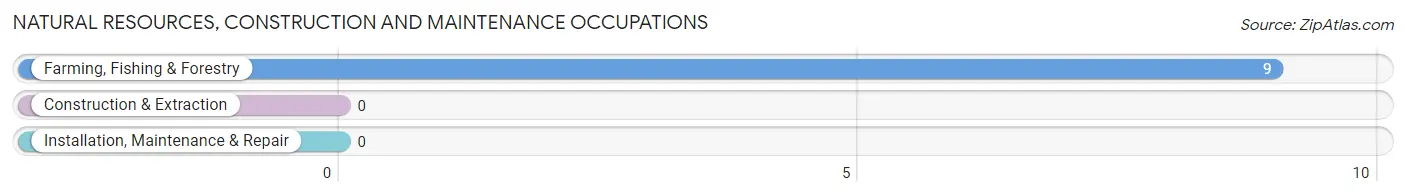
Natural Resources, Construction and Maintenance Occupations by Sex
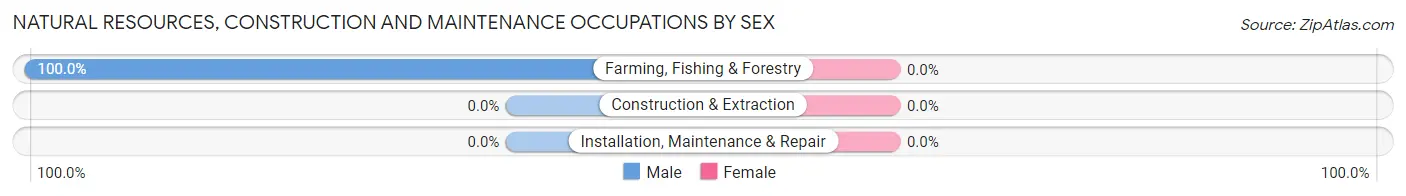
| Occupation | Male | Female |
| Farming, Fishing & Forestry | 9 (100.0%) | 0 (0.0%) |
| Construction & Extraction | 0 (0.0%) | 0 (0.0%) |
| Installation, Maintenance & Repair | 0 (0.0%) | 0 (0.0%) |
| Total (Category) | 9 (100.0%) | 0 (0.0%) |
| Total (Overall) | 16 (34.8%) | 30 (65.2%) |
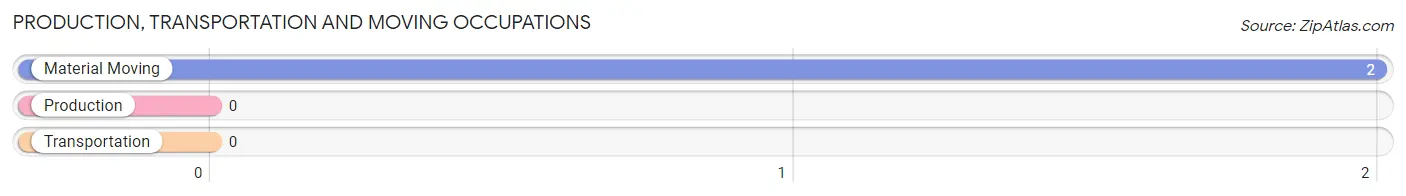
Production, Transportation and Moving Occupations
The most common Production, Transportation and Moving occupations in Mount Hebron are , and Material Moving (2 | 4.3%).
Production, Transportation and Moving Occupations by Sex
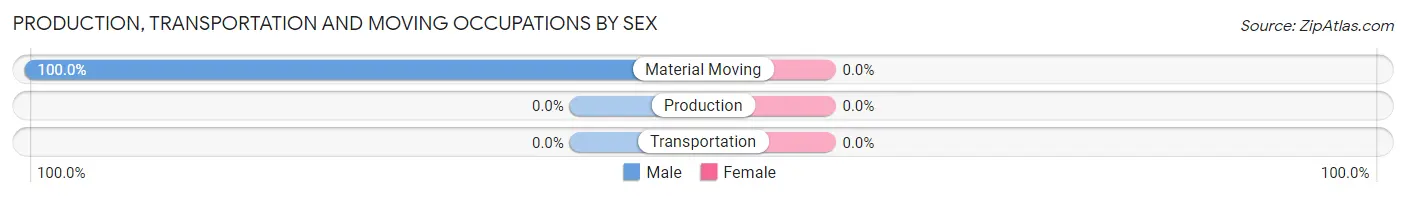
| Occupation | Male | Female |
| Production | 0 (0.0%) | 0 (0.0%) |
| Transportation | 0 (0.0%) | 0 (0.0%) |
| Material Moving | 2 (100.0%) | 0 (0.0%) |
| Total (Category) | 2 (100.0%) | 0 (0.0%) |
| Total (Overall) | 16 (34.8%) | 30 (65.2%) |
Employment Industries by Sex in Mount Hebron
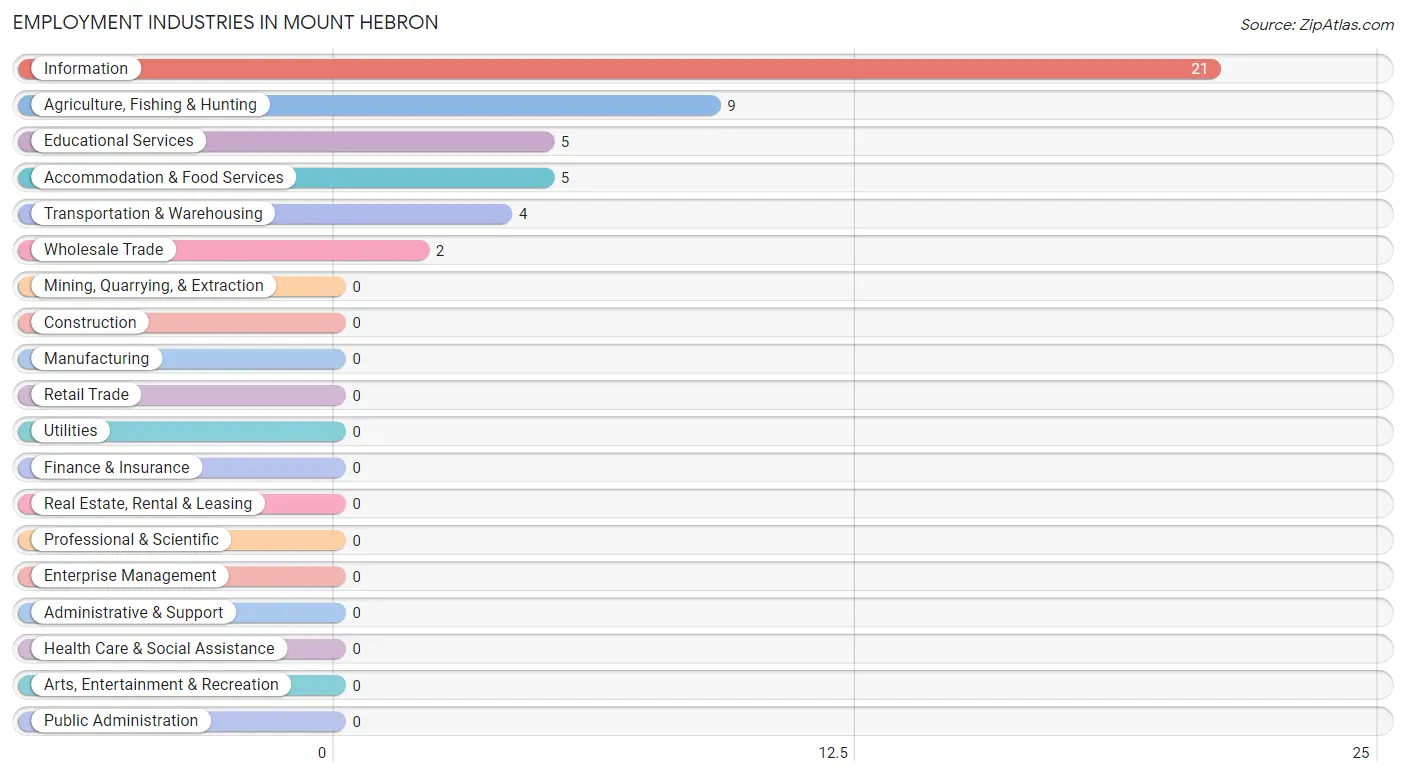
Employment Industries in Mount Hebron
The major employment industries in Mount Hebron include Information (21 | 45.7%), Agriculture, Fishing & Hunting (9 | 19.6%), Educational Services (5 | 10.9%), Accommodation & Food Services (5 | 10.9%), and Transportation & Warehousing (4 | 8.7%).
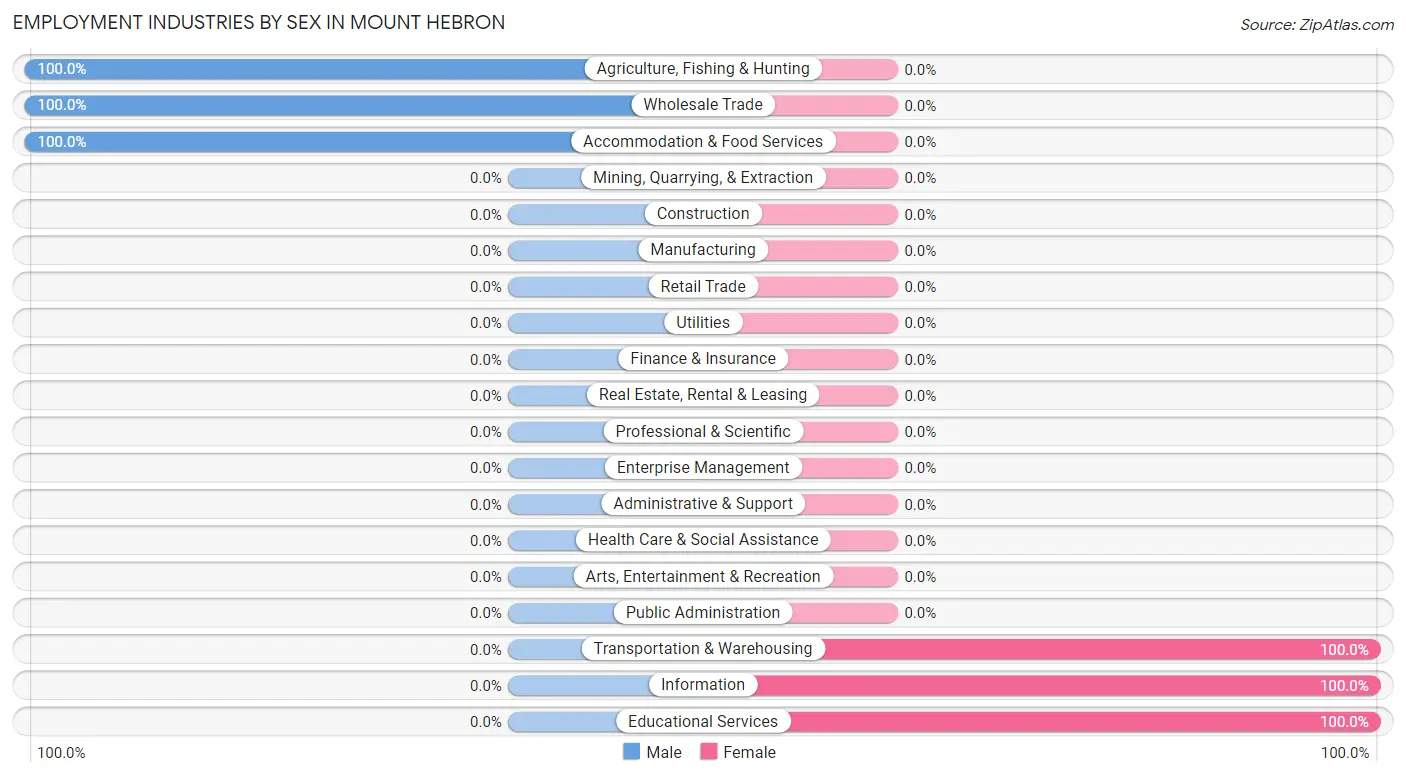
Employment Industries by Sex in Mount Hebron
The Mount Hebron industries that see more men than women are Agriculture, Fishing & Hunting (100.0%), Wholesale Trade (100.0%), and Accommodation & Food Services (100.0%), whereas the industries that tend to have a higher number of women are Transportation & Warehousing (100.0%), Information (100.0%), and Educational Services (100.0%).
| Industry | Male | Female |
| Agriculture, Fishing & Hunting | 9 (100.0%) | 0 (0.0%) |
| Mining, Quarrying, & Extraction | 0 (0.0%) | 0 (0.0%) |
| Construction | 0 (0.0%) | 0 (0.0%) |
| Manufacturing | 0 (0.0%) | 0 (0.0%) |
| Wholesale Trade | 2 (100.0%) | 0 (0.0%) |
| Retail Trade | 0 (0.0%) | 0 (0.0%) |
| Transportation & Warehousing | 0 (0.0%) | 4 (100.0%) |
| Utilities | 0 (0.0%) | 0 (0.0%) |
| Information | 0 (0.0%) | 21 (100.0%) |
| Finance & Insurance | 0 (0.0%) | 0 (0.0%) |
| Real Estate, Rental & Leasing | 0 (0.0%) | 0 (0.0%) |
| Professional & Scientific | 0 (0.0%) | 0 (0.0%) |
| Enterprise Management | 0 (0.0%) | 0 (0.0%) |
| Administrative & Support | 0 (0.0%) | 0 (0.0%) |
| Educational Services | 0 (0.0%) | 5 (100.0%) |
| Health Care & Social Assistance | 0 (0.0%) | 0 (0.0%) |
| Arts, Entertainment & Recreation | 0 (0.0%) | 0 (0.0%) |
| Accommodation & Food Services | 5 (100.0%) | 0 (0.0%) |
| Public Administration | 0 (0.0%) | 0 (0.0%) |
| Total | 16 (34.8%) | 30 (65.2%) |
Education in Mount Hebron
School Enrollment in Mount Hebron
The most common levels of schooling among the 34 students in Mount Hebron are elementary school (15 | 44.1%), middle school (14 | 41.2%), and college / undergraduate (5 | 14.7%).
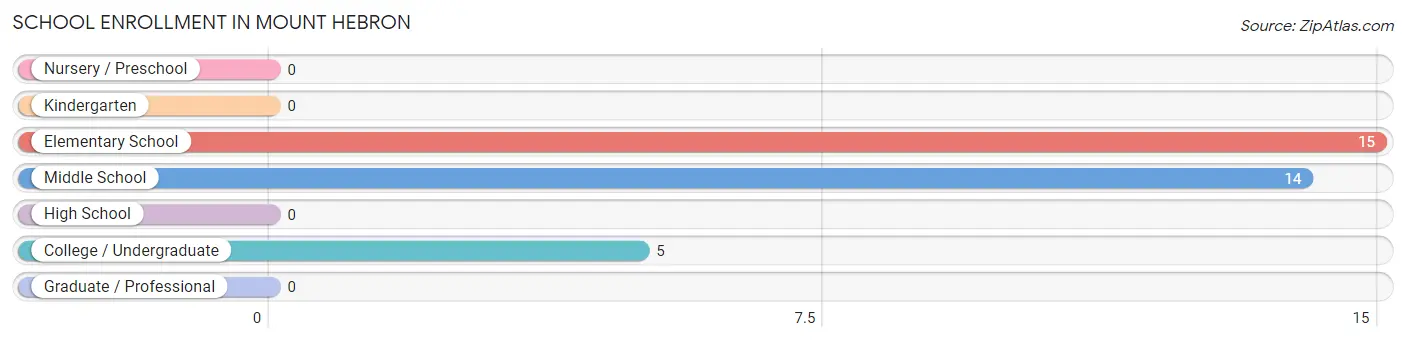
| School Level | # Students | % Students |
| Nursery / Preschool | 0 | 0.0% |
| Kindergarten | 0 | 0.0% |
| Elementary School | 15 | 44.1% |
| Middle School | 14 | 41.2% |
| High School | 0 | 0.0% |
| College / Undergraduate | 5 | 14.7% |
| Graduate / Professional | 0 | 0.0% |
| Total | 34 | 100.0% |
School Enrollment by Age by Funding Source in Mount Hebron
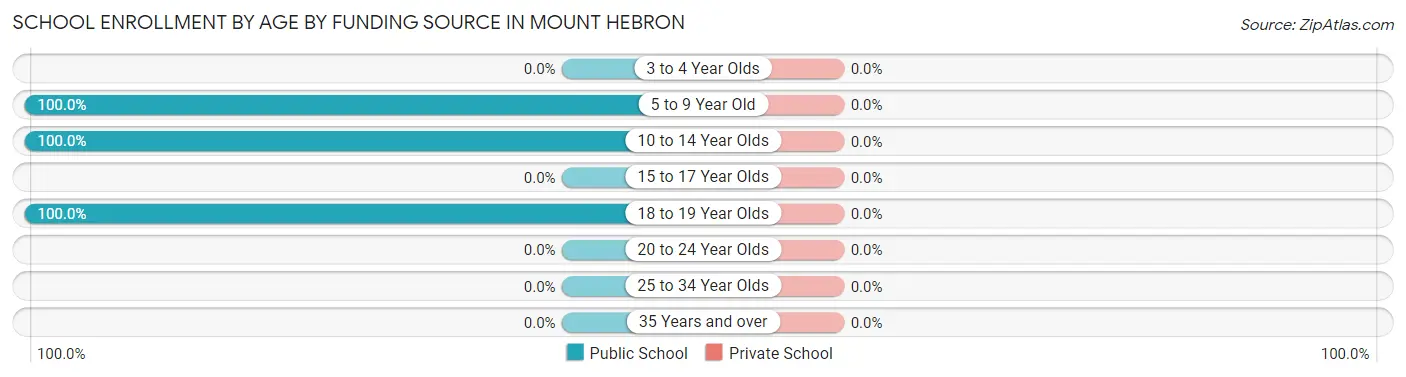
| Age Bracket | Public School | Private School |
| 3 to 4 Year Olds | 0 (0.0%) | 0 (0.0%) |
| 5 to 9 Year Old | 15 (100.0%) | 0 (0.0%) |
| 10 to 14 Year Olds | 14 (100.0%) | 0 (0.0%) |
| 15 to 17 Year Olds | 0 (0.0%) | 0 (0.0%) |
| 18 to 19 Year Olds | 5 (100.0%) | 0 (0.0%) |
| 20 to 24 Year Olds | 0 (0.0%) | 0 (0.0%) |
| 25 to 34 Year Olds | 0 (0.0%) | 0 (0.0%) |
| 35 Years and over | 0 (0.0%) | 0 (0.0%) |
| Total | 34 (100.0%) | 0 (0.0%) |
Educational Attainment by Field of Study in Mount Hebron
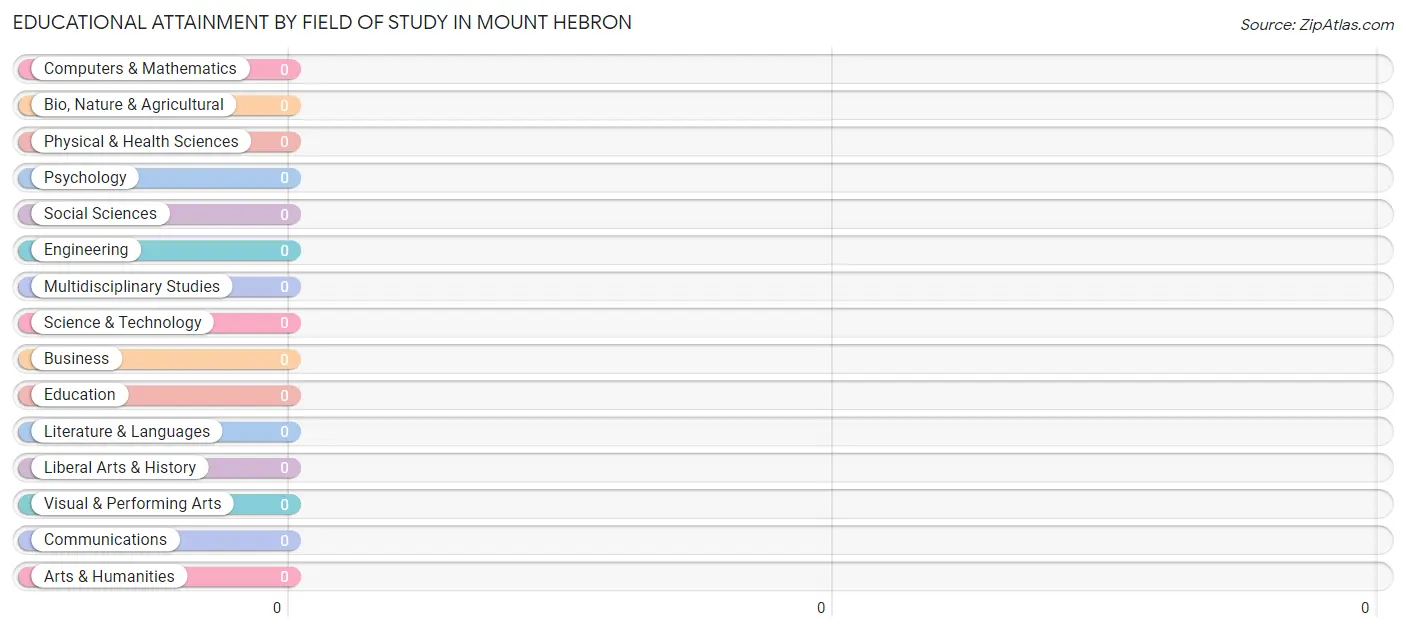
| Field of Study | # Graduates | % Graduates |
| Computers & Mathematics | 0 | 0.0% |
| Bio, Nature & Agricultural | 0 | 0.0% |
| Physical & Health Sciences | 0 | 0.0% |
| Psychology | 0 | 0.0% |
| Social Sciences | 0 | 0.0% |
| Engineering | 0 | 0.0% |
| Multidisciplinary Studies | 0 | 0.0% |
| Science & Technology | 0 | 0.0% |
| Business | 0 | 0.0% |
| Education | 0 | 0.0% |
| Literature & Languages | 0 | 0.0% |
| Liberal Arts & History | 0 | 0.0% |
| Visual & Performing Arts | 0 | 0.0% |
| Communications | 0 | 0.0% |
| Arts & Humanities | 0 | 0.0% |
| Total | 0 | 0.0% |
Transportation & Commute in Mount Hebron
Vehicle Availability by Sex in Mount Hebron
The most prevalent vehicle ownership categories in Mount Hebron are males with 3 vehicles (14, accounting for 87.5%) and females with 3 vehicles (21, making up 46.7%).
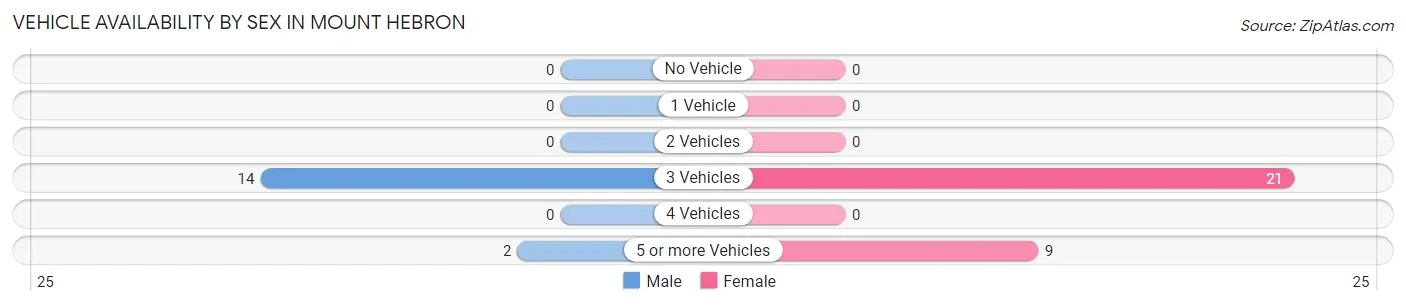
| Vehicles Available | Male | Female |
| No Vehicle | 0 (0.0%) | 0 (0.0%) |
| 1 Vehicle | 0 (0.0%) | 0 (0.0%) |
| 2 Vehicles | 0 (0.0%) | 0 (0.0%) |
| 3 Vehicles | 14 (87.5%) | 21 (70.0%) |
| 4 Vehicles | 0 (0.0%) | 0 (0.0%) |
| 5 or more Vehicles | 2 (12.5%) | 9 (30.0%) |
| Total | 16 (100.0%) | 30 (100.0%) |
Commute Time in Mount Hebron
The most frequently occuring commute durations in Mount Hebron are 15 to 19 minutes (30 commuters, 65.2%), less than 5 minutes (9 commuters, 19.6%), and 10 to 14 minutes (5 commuters, 10.9%).
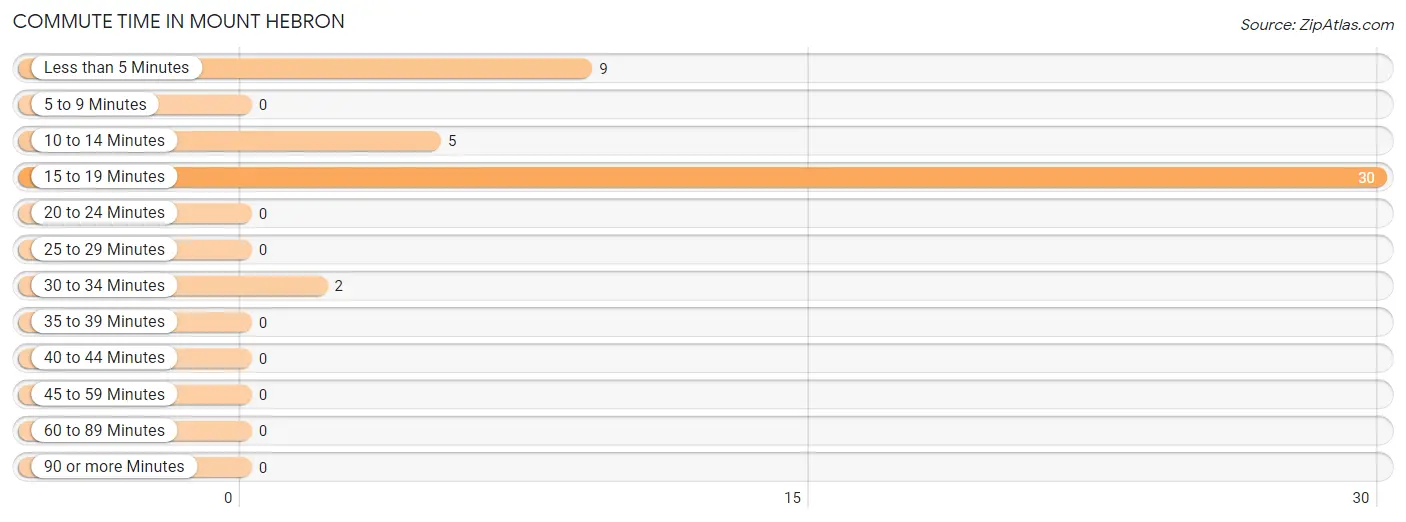
| Commute Time | # Commuters | % Commuters |
| Less than 5 Minutes | 9 | 19.6% |
| 5 to 9 Minutes | 0 | 0.0% |
| 10 to 14 Minutes | 5 | 10.9% |
| 15 to 19 Minutes | 30 | 65.2% |
| 20 to 24 Minutes | 0 | 0.0% |
| 25 to 29 Minutes | 0 | 0.0% |
| 30 to 34 Minutes | 2 | 4.3% |
| 35 to 39 Minutes | 0 | 0.0% |
| 40 to 44 Minutes | 0 | 0.0% |
| 45 to 59 Minutes | 0 | 0.0% |
| 60 to 89 Minutes | 0 | 0.0% |
| 90 or more Minutes | 0 | 0.0% |
Commute Time by Sex in Mount Hebron
The most common commute times in Mount Hebron are 15 to 19 minutes (9 commuters, 56.2%) for males and 15 to 19 minutes (21 commuters, 70.0%) for females.
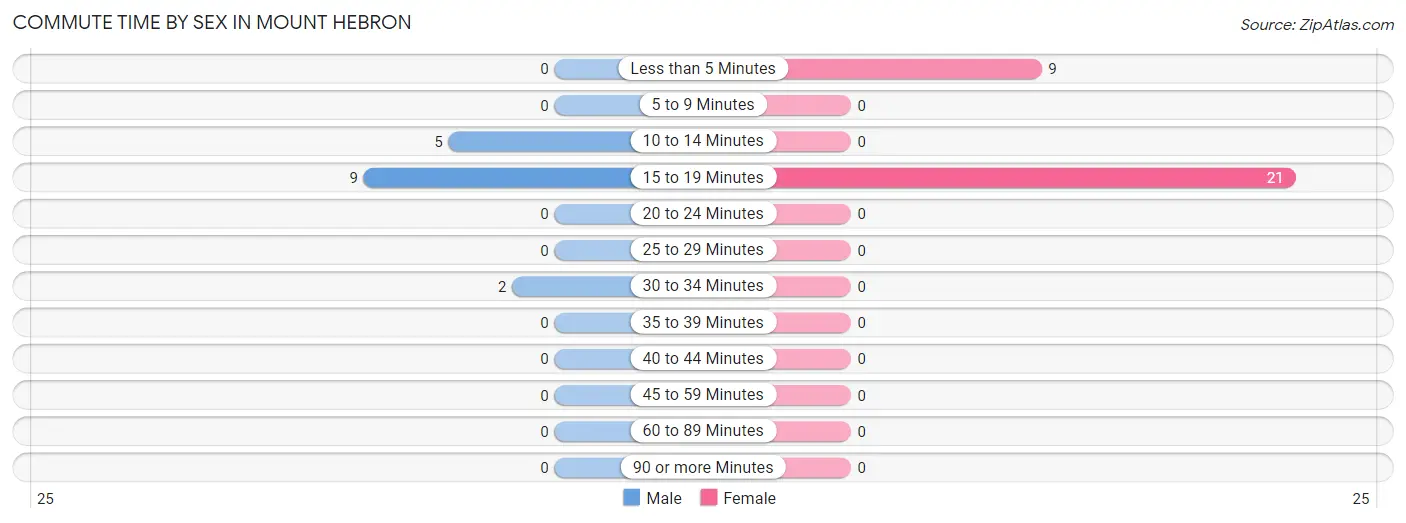
| Commute Time | Male | Female |
| Less than 5 Minutes | 0 (0.0%) | 9 (30.0%) |
| 5 to 9 Minutes | 0 (0.0%) | 0 (0.0%) |
| 10 to 14 Minutes | 5 (31.2%) | 0 (0.0%) |
| 15 to 19 Minutes | 9 (56.2%) | 21 (70.0%) |
| 20 to 24 Minutes | 0 (0.0%) | 0 (0.0%) |
| 25 to 29 Minutes | 0 (0.0%) | 0 (0.0%) |
| 30 to 34 Minutes | 2 (12.5%) | 0 (0.0%) |
| 35 to 39 Minutes | 0 (0.0%) | 0 (0.0%) |
| 40 to 44 Minutes | 0 (0.0%) | 0 (0.0%) |
| 45 to 59 Minutes | 0 (0.0%) | 0 (0.0%) |
| 60 to 89 Minutes | 0 (0.0%) | 0 (0.0%) |
| 90 or more Minutes | 0 (0.0%) | 0 (0.0%) |
Time of Departure to Work by Sex in Mount Hebron
The most frequent times of departure to work in Mount Hebron are 4:00 PM to 11:59 PM (9, 56.2%) for males and 7:00 AM to 7:29 AM (21, 70.0%) for females.
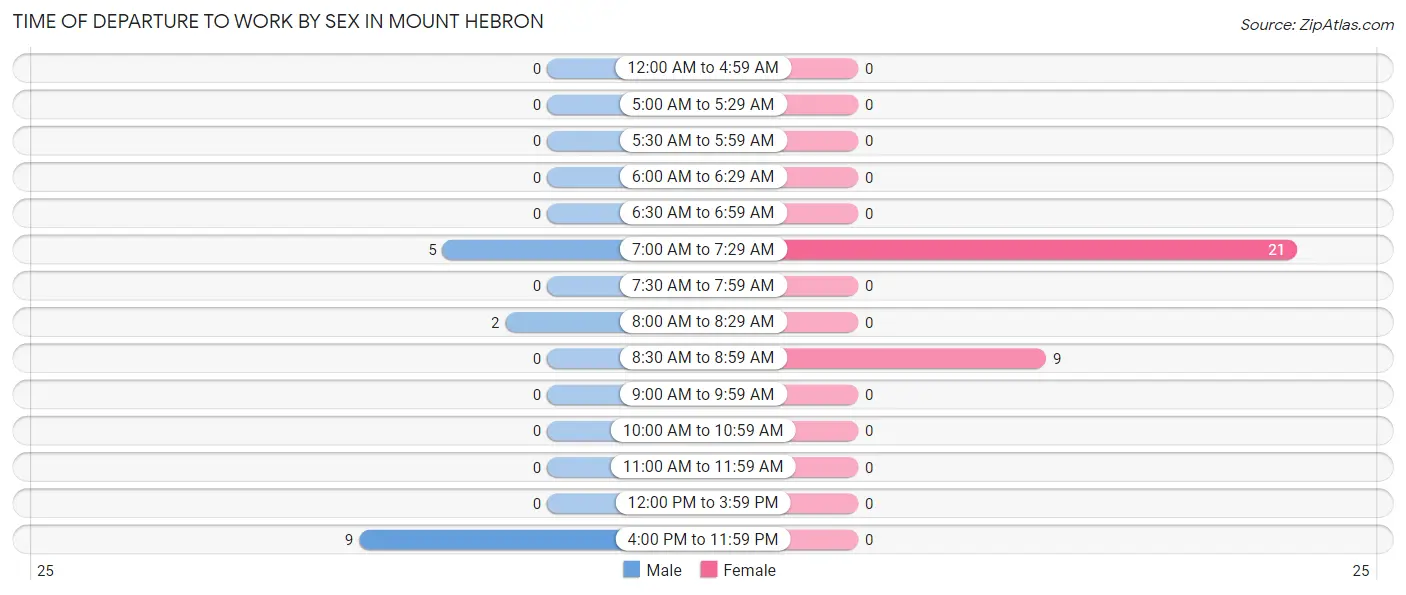
| Time of Departure | Male | Female |
| 12:00 AM to 4:59 AM | 0 (0.0%) | 0 (0.0%) |
| 5:00 AM to 5:29 AM | 0 (0.0%) | 0 (0.0%) |
| 5:30 AM to 5:59 AM | 0 (0.0%) | 0 (0.0%) |
| 6:00 AM to 6:29 AM | 0 (0.0%) | 0 (0.0%) |
| 6:30 AM to 6:59 AM | 0 (0.0%) | 0 (0.0%) |
| 7:00 AM to 7:29 AM | 5 (31.2%) | 21 (70.0%) |
| 7:30 AM to 7:59 AM | 0 (0.0%) | 0 (0.0%) |
| 8:00 AM to 8:29 AM | 2 (12.5%) | 0 (0.0%) |
| 8:30 AM to 8:59 AM | 0 (0.0%) | 9 (30.0%) |
| 9:00 AM to 9:59 AM | 0 (0.0%) | 0 (0.0%) |
| 10:00 AM to 10:59 AM | 0 (0.0%) | 0 (0.0%) |
| 11:00 AM to 11:59 AM | 0 (0.0%) | 0 (0.0%) |
| 12:00 PM to 3:59 PM | 0 (0.0%) | 0 (0.0%) |
| 4:00 PM to 11:59 PM | 9 (56.2%) | 0 (0.0%) |
| Total | 16 (100.0%) | 30 (100.0%) |
Housing Occupancy in Mount Hebron
Occupancy by Ownership in Mount Hebron
Of the total 21 dwellings in Mount Hebron, owner-occupied units account for 12 (57.1%), while renter-occupied units make up 9 (42.9%).
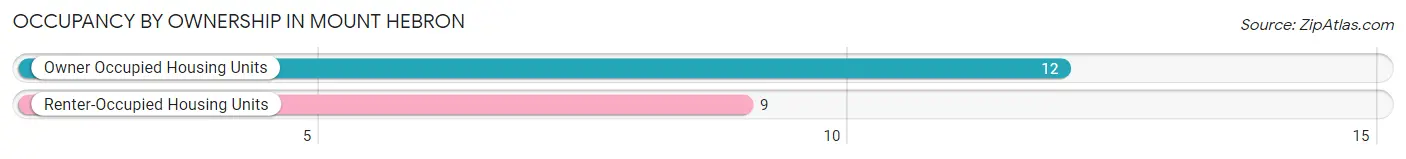
| Occupancy | # Housing Units | % Housing Units |
| Owner Occupied Housing Units | 12 | 57.1% |
| Renter-Occupied Housing Units | 9 | 42.9% |
| Total Occupied Housing Units | 21 | 100.0% |
Occupancy by Household Size in Mount Hebron
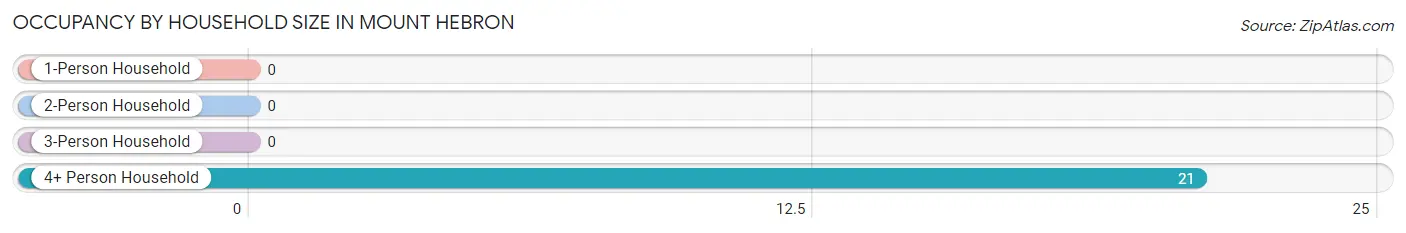
| Household Size | # Housing Units | % Housing Units |
| 1-Person Household | 0 | 0.0% |
| 2-Person Household | 0 | 0.0% |
| 3-Person Household | 0 | 0.0% |
| 4+ Person Household | 21 | 100.0% |
| Total Housing Units | 21 | 100.0% |
Occupancy by Ownership by Household Size in Mount Hebron
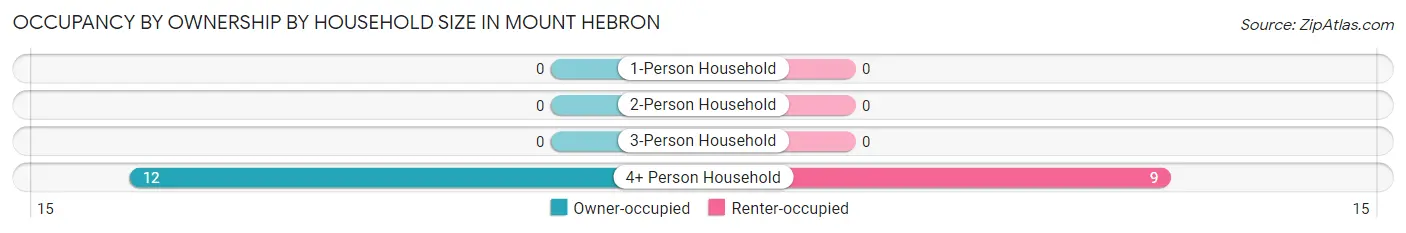
| Household Size | Owner-occupied | Renter-occupied |
| 1-Person Household | 0 (0.0%) | 0 (0.0%) |
| 2-Person Household | 0 (0.0%) | 0 (0.0%) |
| 3-Person Household | 0 (0.0%) | 0 (0.0%) |
| 4+ Person Household | 12 (57.1%) | 9 (42.9%) |
| Total Housing Units | 12 (57.1%) | 9 (42.9%) |
Occupancy by Educational Attainment in Mount Hebron
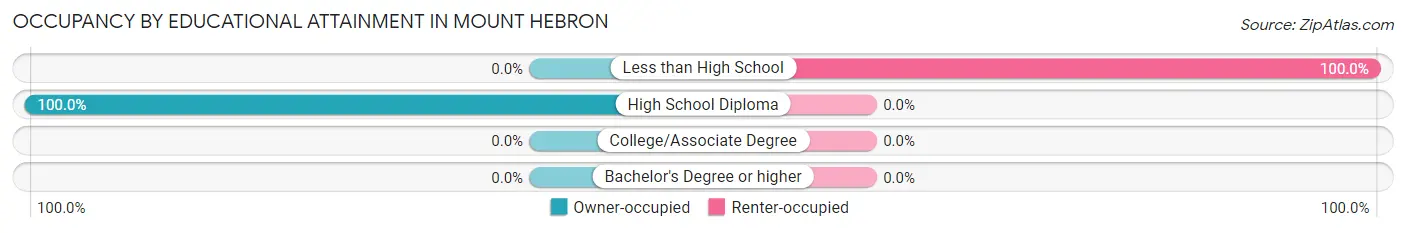
| Household Size | Owner-occupied | Renter-occupied |
| Less than High School | 0 (0.0%) | 9 (100.0%) |
| High School Diploma | 12 (100.0%) | 0 (0.0%) |
| College/Associate Degree | 0 (0.0%) | 0 (0.0%) |
| Bachelor's Degree or higher | 0 (0.0%) | 0 (0.0%) |
Occupancy by Age of Householder in Mount Hebron
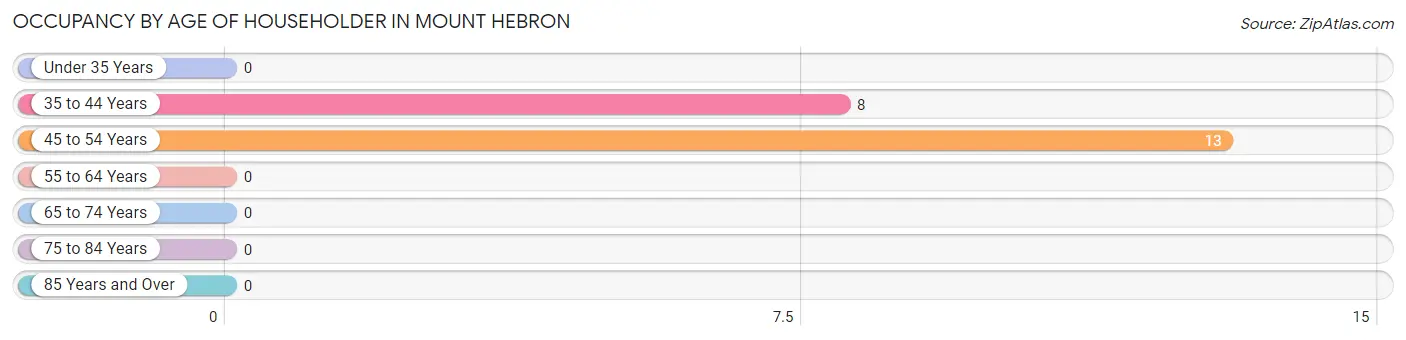
| Age Bracket | # Households | % Households |
| Under 35 Years | 0 | 0.0% |
| 35 to 44 Years | 8 | 38.1% |
| 45 to 54 Years | 13 | 61.9% |
| 55 to 64 Years | 0 | 0.0% |
| 65 to 74 Years | 0 | 0.0% |
| 75 to 84 Years | 0 | 0.0% |
| 85 Years and Over | 0 | 0.0% |
| Total | 21 | 100.0% |
Housing Finances in Mount Hebron
Median Income by Occupancy in Mount Hebron
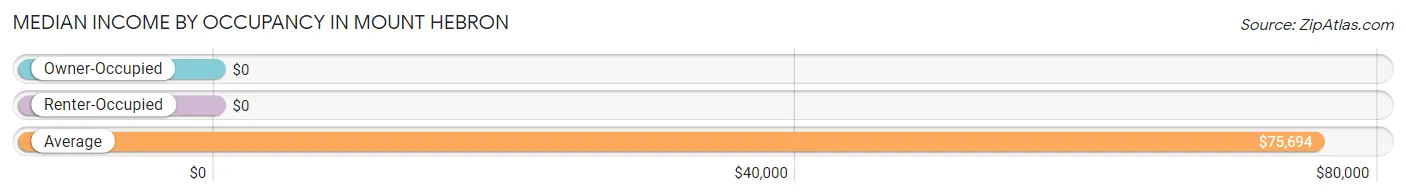
| Occupancy Type | # Households | Median Income |
| Owner-Occupied | 12 (57.1%) | $0 |
| Renter-Occupied | 9 (42.9%) | $0 |
| Average | 21 (100.0%) | $75,694 |
Occupancy by Householder Income Bracket in Mount Hebron
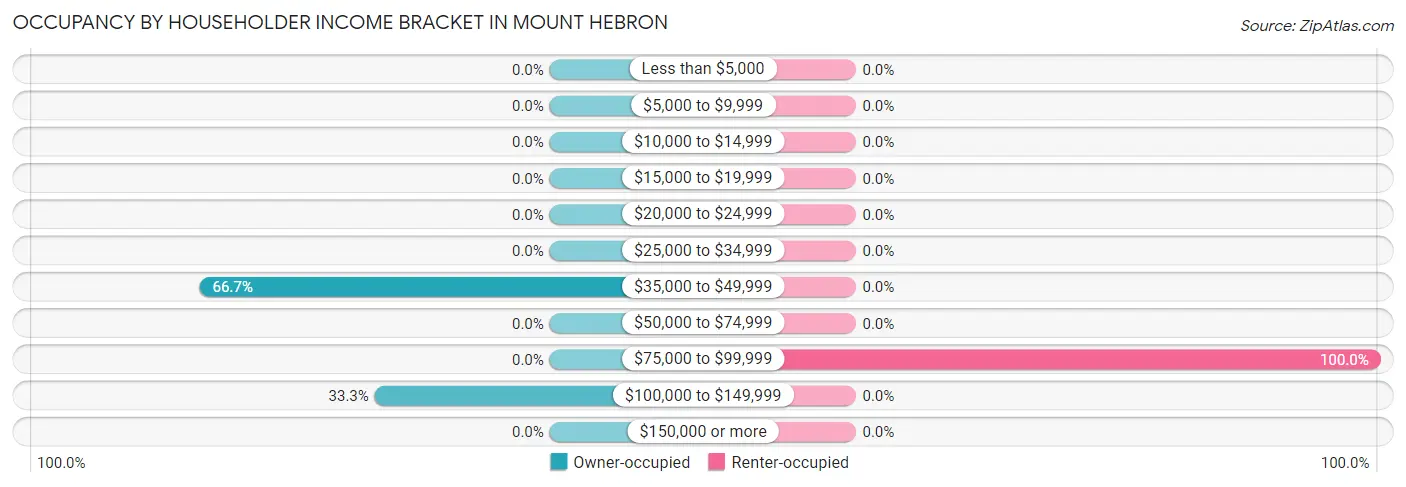
| Income Bracket | Owner-occupied | Renter-occupied |
| Less than $5,000 | 0 (0.0%) | 0 (0.0%) |
| $5,000 to $9,999 | 0 (0.0%) | 0 (0.0%) |
| $10,000 to $14,999 | 0 (0.0%) | 0 (0.0%) |
| $15,000 to $19,999 | 0 (0.0%) | 0 (0.0%) |
| $20,000 to $24,999 | 0 (0.0%) | 0 (0.0%) |
| $25,000 to $34,999 | 0 (0.0%) | 0 (0.0%) |
| $35,000 to $49,999 | 8 (66.7%) | 0 (0.0%) |
| $50,000 to $74,999 | 0 (0.0%) | 0 (0.0%) |
| $75,000 to $99,999 | 0 (0.0%) | 9 (100.0%) |
| $100,000 to $149,999 | 4 (33.3%) | 0 (0.0%) |
| $150,000 or more | 0 (0.0%) | 0 (0.0%) |
| Total | 12 (100.0%) | 9 (100.0%) |
Monthly Housing Cost Tiers in Mount Hebron
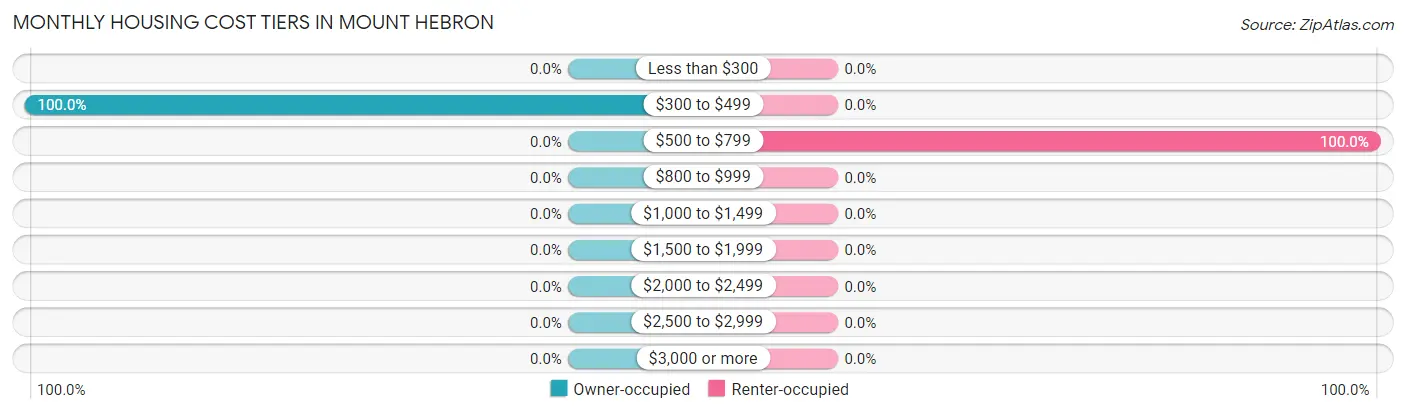
| Monthly Cost | Owner-occupied | Renter-occupied |
| Less than $300 | 0 (0.0%) | 0 (0.0%) |
| $300 to $499 | 12 (100.0%) | 0 (0.0%) |
| $500 to $799 | 0 (0.0%) | 9 (100.0%) |
| $800 to $999 | 0 (0.0%) | 0 (0.0%) |
| $1,000 to $1,499 | 0 (0.0%) | 0 (0.0%) |
| $1,500 to $1,999 | 0 (0.0%) | 0 (0.0%) |
| $2,000 to $2,499 | 0 (0.0%) | 0 (0.0%) |
| $2,500 to $2,999 | 0 (0.0%) | 0 (0.0%) |
| $3,000 or more | 0 (0.0%) | 0 (0.0%) |
| Total | 12 (100.0%) | 9 (100.0%) |
Physical Housing Characteristics in Mount Hebron
Housing Structures in Mount Hebron
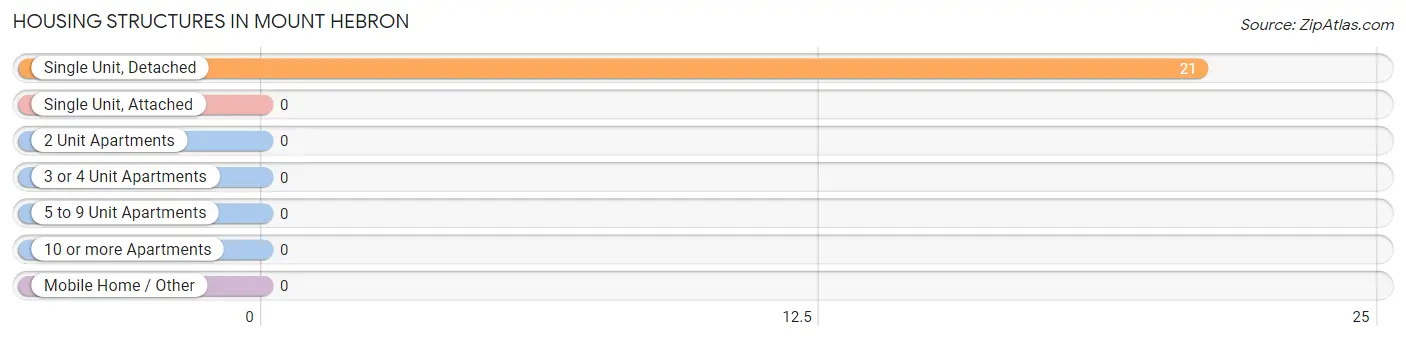
| Structure Type | # Housing Units | % Housing Units |
| Single Unit, Detached | 21 | 100.0% |
| Single Unit, Attached | 0 | 0.0% |
| 2 Unit Apartments | 0 | 0.0% |
| 3 or 4 Unit Apartments | 0 | 0.0% |
| 5 to 9 Unit Apartments | 0 | 0.0% |
| 10 or more Apartments | 0 | 0.0% |
| Mobile Home / Other | 0 | 0.0% |
| Total | 21 | 100.0% |
Housing Structures by Occupancy in Mount Hebron
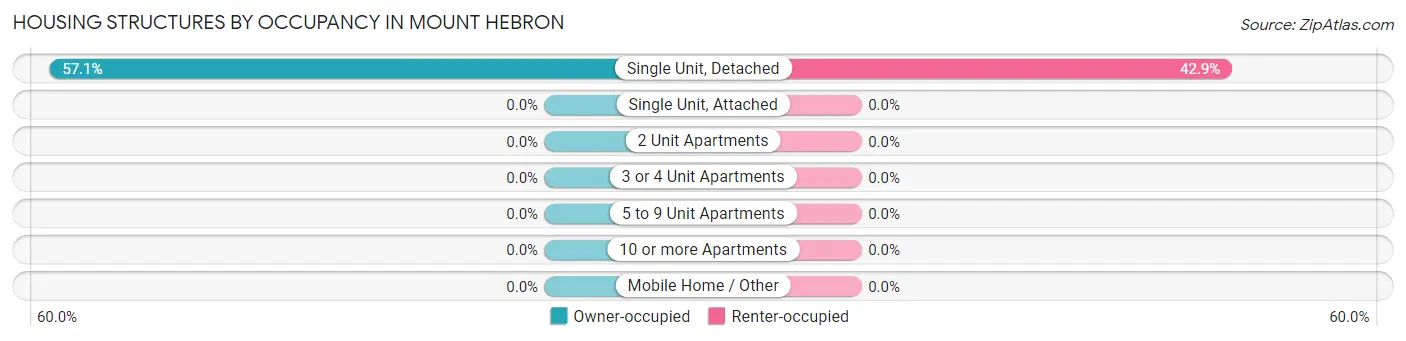
| Structure Type | Owner-occupied | Renter-occupied |
| Single Unit, Detached | 12 (57.1%) | 9 (42.9%) |
| Single Unit, Attached | 0 (0.0%) | 0 (0.0%) |
| 2 Unit Apartments | 0 (0.0%) | 0 (0.0%) |
| 3 or 4 Unit Apartments | 0 (0.0%) | 0 (0.0%) |
| 5 to 9 Unit Apartments | 0 (0.0%) | 0 (0.0%) |
| 10 or more Apartments | 0 (0.0%) | 0 (0.0%) |
| Mobile Home / Other | 0 (0.0%) | 0 (0.0%) |
| Total | 12 (57.1%) | 9 (42.9%) |
Housing Structures by Number of Rooms in Mount Hebron
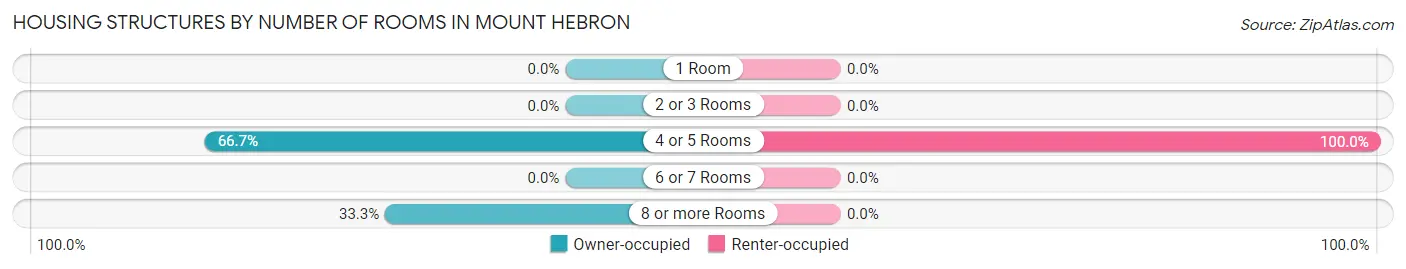
| Number of Rooms | Owner-occupied | Renter-occupied |
| 1 Room | 0 (0.0%) | 0 (0.0%) |
| 2 or 3 Rooms | 0 (0.0%) | 0 (0.0%) |
| 4 or 5 Rooms | 8 (66.7%) | 9 (100.0%) |
| 6 or 7 Rooms | 0 (0.0%) | 0 (0.0%) |
| 8 or more Rooms | 4 (33.3%) | 0 (0.0%) |
| Total | 12 (100.0%) | 9 (100.0%) |
Housing Structure by Heating Type in Mount Hebron
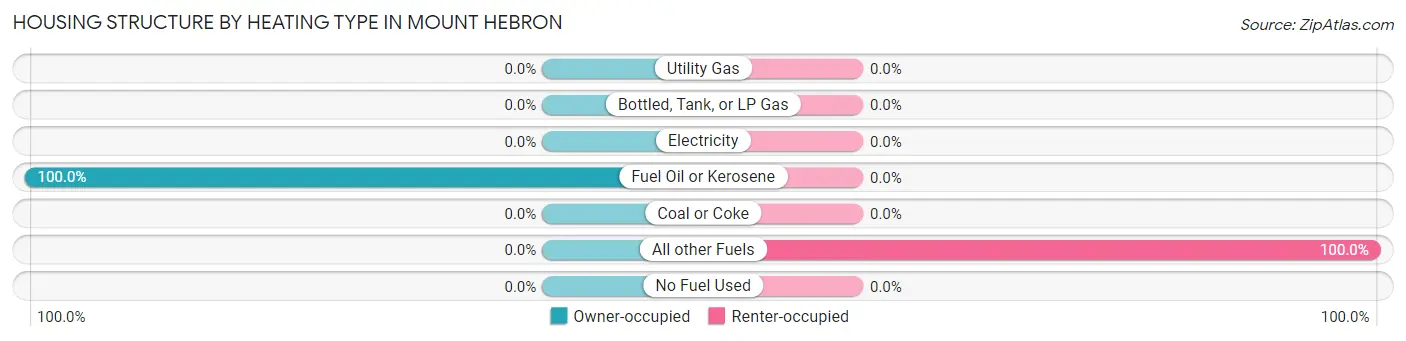
| Heating Type | Owner-occupied | Renter-occupied |
| Utility Gas | 0 (0.0%) | 0 (0.0%) |
| Bottled, Tank, or LP Gas | 0 (0.0%) | 0 (0.0%) |
| Electricity | 0 (0.0%) | 0 (0.0%) |
| Fuel Oil or Kerosene | 12 (100.0%) | 0 (0.0%) |
| Coal or Coke | 0 (0.0%) | 0 (0.0%) |
| All other Fuels | 0 (0.0%) | 9 (100.0%) |
| No Fuel Used | 0 (0.0%) | 0 (0.0%) |
| Total | 12 (100.0%) | 9 (100.0%) |
Household Vehicle Usage in Mount Hebron
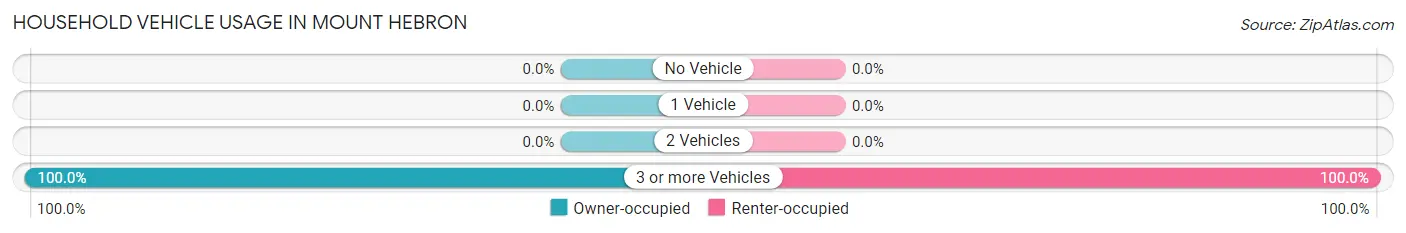
| Vehicles per Household | Owner-occupied | Renter-occupied |
| No Vehicle | 0 (0.0%) | 0 (0.0%) |
| 1 Vehicle | 0 (0.0%) | 0 (0.0%) |
| 2 Vehicles | 0 (0.0%) | 0 (0.0%) |
| 3 or more Vehicles | 12 (100.0%) | 9 (100.0%) |
| Total | 12 (100.0%) | 9 (100.0%) |
Real Estate & Mortgages in Mount Hebron
Real Estate and Mortgage Overview in Mount Hebron
| Characteristic | Without Mortgage | With Mortgage |
| Housing Units | 12 | 0 |
| Median Property Value | - | - |
| Median Household Income | - | - |
| Monthly Housing Costs | - | - |
| Real Estate Taxes | - | - |
Property Value by Mortgage Status in Mount Hebron
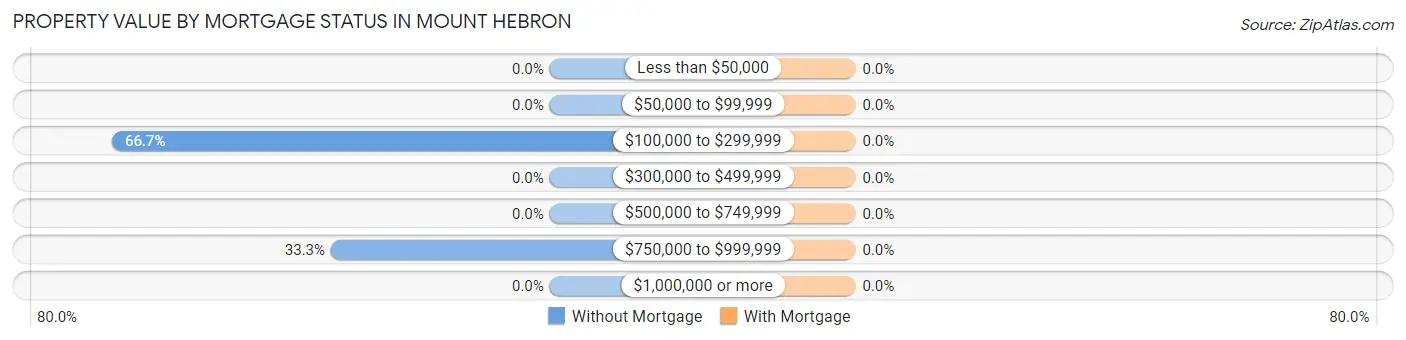
| Property Value | Without Mortgage | With Mortgage |
| Less than $50,000 | 0 (0.0%) | 0 (0.0%) |
| $50,000 to $99,999 | 0 (0.0%) | 0 (0.0%) |
| $100,000 to $299,999 | 8 (66.7%) | 0 (0.0%) |
| $300,000 to $499,999 | 0 (0.0%) | 0 (0.0%) |
| $500,000 to $749,999 | 0 (0.0%) | 0 (0.0%) |
| $750,000 to $999,999 | 4 (33.3%) | 0 (0.0%) |
| $1,000,000 or more | 0 (0.0%) | 0 (0.0%) |
| Total | 12 (100.0%) | 0 (0.0%) |
Household Income by Mortgage Status in Mount Hebron
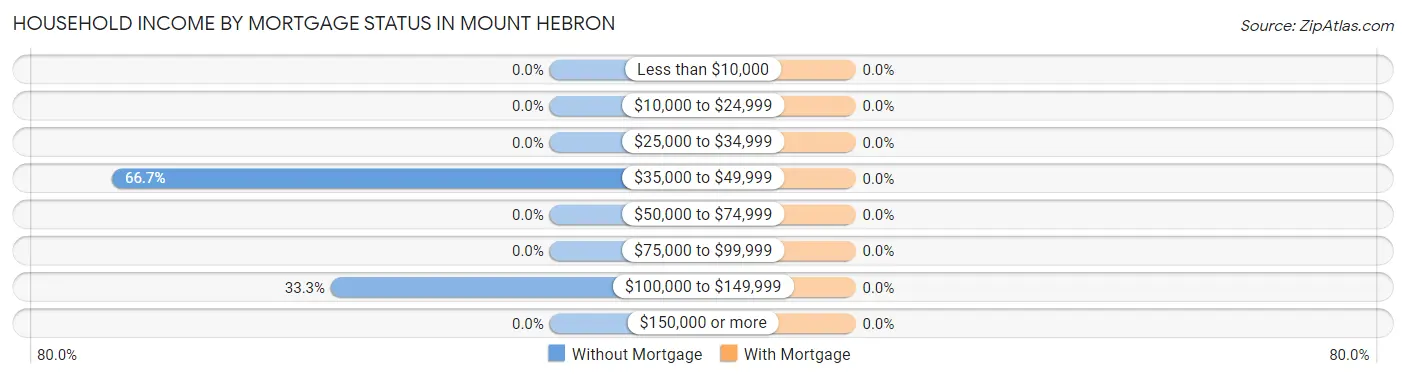
| Household Income | Without Mortgage | With Mortgage |
| Less than $10,000 | 0 (0.0%) | 0 (0.0%) |
| $10,000 to $24,999 | 0 (0.0%) | 0 (0.0%) |
| $25,000 to $34,999 | 0 (0.0%) | 0 (0.0%) |
| $35,000 to $49,999 | 8 (66.7%) | 0 (0.0%) |
| $50,000 to $74,999 | 0 (0.0%) | 0 (0.0%) |
| $75,000 to $99,999 | 0 (0.0%) | 0 (0.0%) |
| $100,000 to $149,999 | 4 (33.3%) | 0 (0.0%) |
| $150,000 or more | 0 (0.0%) | 0 (0.0%) |
| Total | 12 (100.0%) | 0 (0.0%) |
Property Value to Household Income Ratio in Mount Hebron
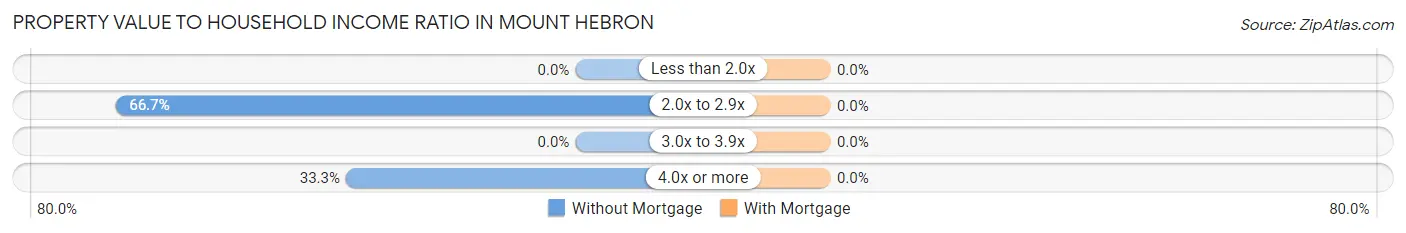
| Value-to-Income Ratio | Without Mortgage | With Mortgage |
| Less than 2.0x | 0 (0.0%) | 0 (0.0%) |
| 2.0x to 2.9x | 8 (66.7%) | 0 (0.0%) |
| 3.0x to 3.9x | 0 (0.0%) | 0 (0.0%) |
| 4.0x or more | 4 (33.3%) | 0 (0.0%) |
| Total | 12 (100.0%) | 0 (0.0%) |
Real Estate Taxes by Mortgage Status in Mount Hebron
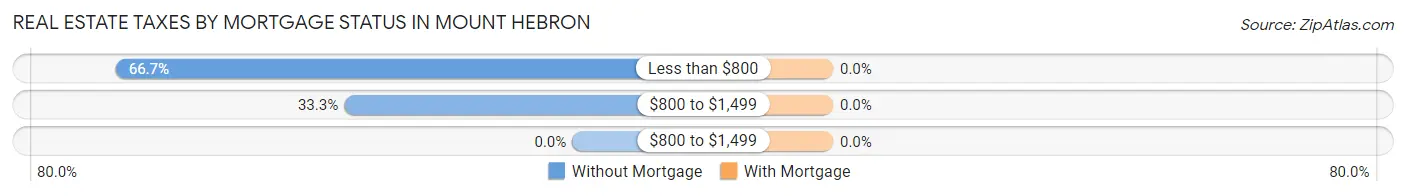
| Property Taxes | Without Mortgage | With Mortgage |
| Less than $800 | 8 (66.7%) | 0 (0.0%) |
| $800 to $1,499 | 4 (33.3%) | 0 (0.0%) |
| $800 to $1,499 | 0 (0.0%) | 0 (0.0%) |
| Total | 12 (100.0%) | 0 (0.0%) |
Health & Disability in Mount Hebron
Health Insurance Coverage by Age in Mount Hebron
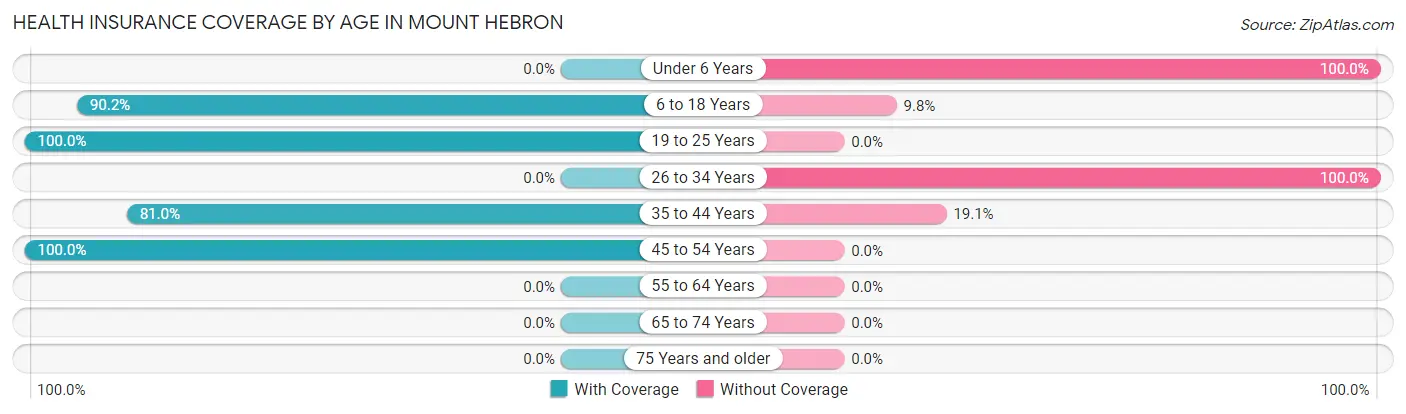
| Age Bracket | With Coverage | Without Coverage |
| Under 6 Years | 0 (0.0%) | 5 (100.0%) |
| 6 to 18 Years | 37 (90.2%) | 4 (9.8%) |
| 19 to 25 Years | 5 (100.0%) | 0 (0.0%) |
| 26 to 34 Years | 0 (0.0%) | 5 (100.0%) |
| 35 to 44 Years | 34 (80.9%) | 8 (19.1%) |
| 45 to 54 Years | 15 (100.0%) | 0 (0.0%) |
| 55 to 64 Years | 0 (0.0%) | 0 (0.0%) |
| 65 to 74 Years | 0 (0.0%) | 0 (0.0%) |
| 75 Years and older | 0 (0.0%) | 0 (0.0%) |
| Total | 91 (80.5%) | 22 (19.5%) |
Health Insurance Coverage by Citizenship Status in Mount Hebron
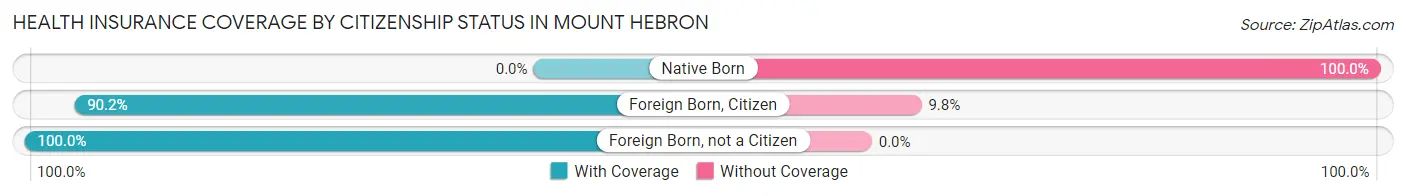
| Citizenship Status | With Coverage | Without Coverage |
| Native Born | 0 (0.0%) | 5 (100.0%) |
| Foreign Born, Citizen | 37 (90.2%) | 4 (9.8%) |
| Foreign Born, not a Citizen | 5 (100.0%) | 0 (0.0%) |
Health Insurance Coverage by Household Income in Mount Hebron
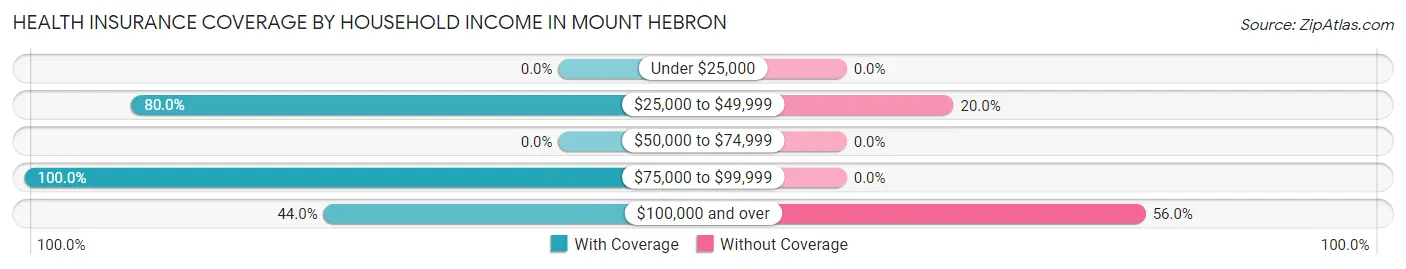
| Household Income | With Coverage | Without Coverage |
| Under $25,000 | 0 (0.0%) | 0 (0.0%) |
| $25,000 to $49,999 | 32 (80.0%) | 8 (20.0%) |
| $50,000 to $74,999 | 0 (0.0%) | 0 (0.0%) |
| $75,000 to $99,999 | 48 (100.0%) | 0 (0.0%) |
| $100,000 and over | 11 (44.0%) | 14 (56.0%) |
Public vs Private Health Insurance Coverage by Age in Mount Hebron
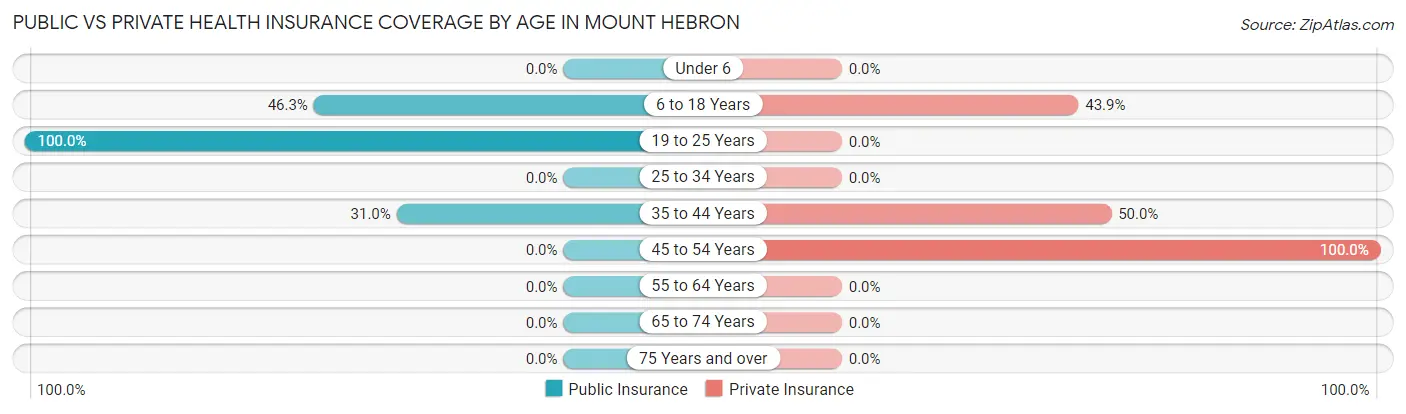
| Age Bracket | Public Insurance | Private Insurance |
| Under 6 | 0 (0.0%) | 0 (0.0%) |
| 6 to 18 Years | 19 (46.3%) | 18 (43.9%) |
| 19 to 25 Years | 5 (100.0%) | 0 (0.0%) |
| 25 to 34 Years | 0 (0.0%) | 0 (0.0%) |
| 35 to 44 Years | 13 (30.9%) | 21 (50.0%) |
| 45 to 54 Years | 0 (0.0%) | 15 (100.0%) |
| 55 to 64 Years | 0 (0.0%) | 0 (0.0%) |
| 65 to 74 Years | 0 (0.0%) | 0 (0.0%) |
| 75 Years and over | 0 (0.0%) | 0 (0.0%) |
| Total | 37 (32.7%) | 54 (47.8%) |
Disability Status by Sex by Age in Mount Hebron
| Age Bracket | Male | Female |
| Under 5 Years | 0 (0.0%) | 0 (0.0%) |
| 5 to 17 Years | 0 (0.0%) | 0 (0.0%) |
| 18 to 34 Years | 0 (0.0%) | 0 (0.0%) |
| 35 to 64 Years | 0 (0.0%) | 0 (0.0%) |
| 65 to 74 Years | 0 (0.0%) | 0 (0.0%) |
| 75 Years and over | 0 (0.0%) | 0 (0.0%) |
Disability Class by Sex by Age in Mount Hebron
Disability Class: Hearing Difficulty
| Age Bracket | Male | Female |
| Under 5 Years | 0 (0.0%) | 0 (0.0%) |
| 5 to 17 Years | 0 (0.0%) | 0 (0.0%) |
| 18 to 34 Years | 0 (0.0%) | 0 (0.0%) |
| 35 to 64 Years | 0 (0.0%) | 0 (0.0%) |
| 65 to 74 Years | 0 (0.0%) | 0 (0.0%) |
| 75 Years and over | 0 (0.0%) | 0 (0.0%) |
Disability Class: Vision Difficulty
| Age Bracket | Male | Female |
| Under 5 Years | 0 (0.0%) | 0 (0.0%) |
| 5 to 17 Years | 0 (0.0%) | 0 (0.0%) |
| 18 to 34 Years | 0 (0.0%) | 0 (0.0%) |
| 35 to 64 Years | 0 (0.0%) | 0 (0.0%) |
| 65 to 74 Years | 0 (0.0%) | 0 (0.0%) |
| 75 Years and over | 0 (0.0%) | 0 (0.0%) |
Disability Class: Cognitive Difficulty
| Age Bracket | Male | Female |
| 5 to 17 Years | 0 (0.0%) | 0 (0.0%) |
| 18 to 34 Years | 0 (0.0%) | 0 (0.0%) |
| 35 to 64 Years | 0 (0.0%) | 0 (0.0%) |
| 65 to 74 Years | 0 (0.0%) | 0 (0.0%) |
| 75 Years and over | 0 (0.0%) | 0 (0.0%) |
Disability Class: Ambulatory Difficulty
| Age Bracket | Male | Female |
| 5 to 17 Years | 0 (0.0%) | 0 (0.0%) |
| 18 to 34 Years | 0 (0.0%) | 0 (0.0%) |
| 35 to 64 Years | 0 (0.0%) | 0 (0.0%) |
| 65 to 74 Years | 0 (0.0%) | 0 (0.0%) |
| 75 Years and over | 0 (0.0%) | 0 (0.0%) |
Disability Class: Self-Care Difficulty
| Age Bracket | Male | Female |
| 5 to 17 Years | 0 (0.0%) | 0 (0.0%) |
| 18 to 34 Years | 0 (0.0%) | 0 (0.0%) |
| 35 to 64 Years | 0 (0.0%) | 0 (0.0%) |
| 65 to 74 Years | 0 (0.0%) | 0 (0.0%) |
| 75 Years and over | 0 (0.0%) | 0 (0.0%) |
Technology Access in Mount Hebron
Computing Device Access in Mount Hebron
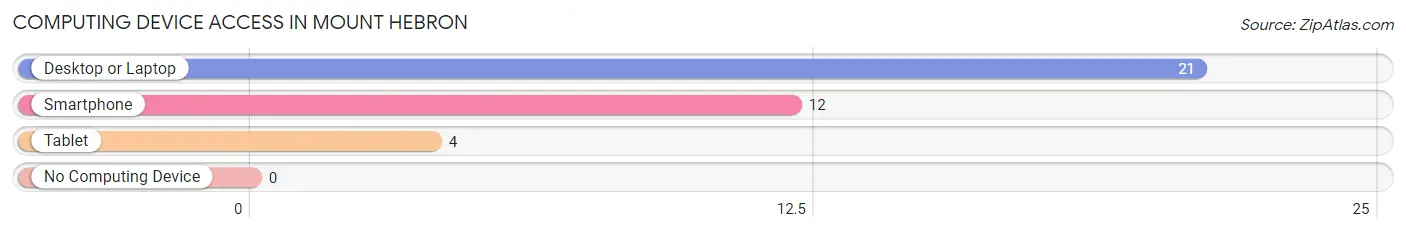
| Device Type | # Households | % Households |
| Desktop or Laptop | 21 | 100.0% |
| Smartphone | 12 | 57.1% |
| Tablet | 4 | 19.1% |
| No Computing Device | 0 | 0.0% |
| Total | 21 | 100.0% |
Internet Access in Mount Hebron
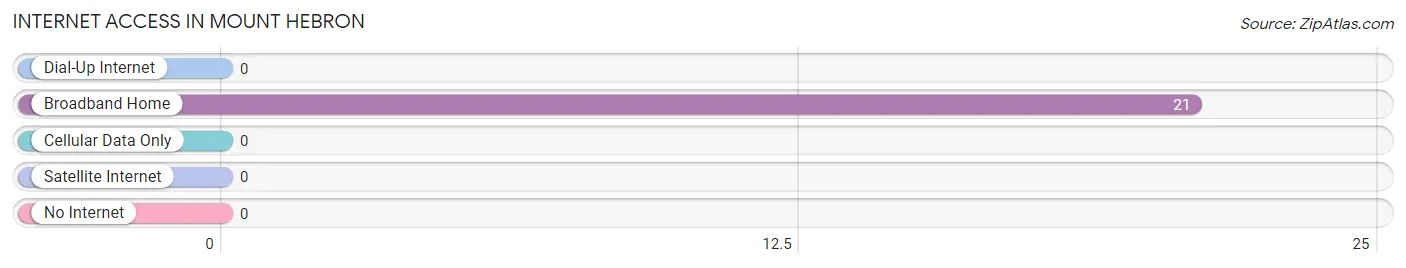
| Internet Type | # Households | % Households |
| Dial-Up Internet | 0 | 0.0% |
| Broadband Home | 21 | 100.0% |
| Cellular Data Only | 0 | 0.0% |
| Satellite Internet | 0 | 0.0% |
| No Internet | 0 | 0.0% |
| Total | 21 | 100.0% |
Mount Hebron Summary
History
Mount Hebron is a small unincorporated community located in the Sierra Nevada foothills of El Dorado County, California. It is situated at an elevation of 2,845 feet (867 m) and is located approximately 8 miles (13 km) east of Placerville. The community was founded in the late 1800s and was originally known as “Hebron”. The name was changed to “Mount Hebron” in the early 1900s.
The area was first settled by miners in the 1850s, who were attracted to the area by the gold rush. The town was officially established in 1858 and was named after the biblical Mount Hebron. The town grew quickly and by the late 1800s, it had become a bustling community with a post office, a school, a hotel, and several stores.
In the early 1900s, the town began to decline as the gold rush ended and the population began to move away. By the 1950s, the town had become a ghost town. In the 1970s, the town was revitalized by the construction of a new highway, which brought new businesses and residents to the area.
Geography
Mount Hebron is located in the Sierra Nevada foothills of El Dorado County, California. It is situated at an elevation of 2,845 feet (867 m) and is located approximately 8 miles (13 km) east of Placerville. The town is surrounded by rolling hills and is located in a heavily forested area. The area is known for its scenic beauty and is a popular destination for outdoor activities such as hiking, camping, and fishing.
The climate in Mount Hebron is mild and temperate. Summers are warm and dry, while winters are cool and wet. The average annual temperature is around 50°F (10°C). The average annual precipitation is around 25 inches (63 cm).
Economy
The economy of Mount Hebron is largely based on tourism and outdoor recreation. The town is a popular destination for hikers, campers, and fishermen. There are several local businesses in the area, including restaurants, stores, and lodging. The town is also home to several wineries and vineyards.
The town is also home to several small businesses, including a sawmill, a woodworking shop, and a furniture store. The town is also home to a small airport, which serves as a base for private aircraft.
Demographics
As of the 2010 census, the population of Mount Hebron was 1,093. The racial makeup of the town was 94.3% White, 0.7% African American, 0.7% Native American, 0.7% Asian, 0.3% Pacific Islander, and 2.7% from other races. The median household income was $50,000 and the median family income was $54,000. The per capita income was $25,000.
Mount Hebron is a small, rural community with a close-knit community. The town is known for its friendly atmosphere and its strong sense of community. The town is also home to several churches, including the Mount Hebron Baptist Church, the Mount Hebron Methodist Church, and the Mount Hebron Presbyterian Church.
Common Questions
What is Per Capita Income in Mount Hebron?
Per Capita income in Mount Hebron is $17,057.
What is the Median Family Income in Mount Hebron?
Median Family Income in Mount Hebron is $75,694.
What is the Median Household income in Mount Hebron?
Median Household Income in Mount Hebron is $75,694.
What is Income or Wage Gap in Mount Hebron?
Income or Wage Gap in Mount Hebron is 20.9%.
Women in Mount Hebron earn 79.1 cents for every dollar earned by a man.
What is Inequality or Gini Index in Mount Hebron?
Inequality or Gini Index in Mount Hebron is 0.24.
What is the Total Population of Mount Hebron?
Total Population of Mount Hebron is 113.
What is the Total Male Population of Mount Hebron?
Total Male Population of Mount Hebron is 45.
What is the Total Female Population of Mount Hebron?
Total Female Population of Mount Hebron is 68.
What is the Ratio of Males per 100 Females in Mount Hebron?
There are 66.18 Males per 100 Females in Mount Hebron.
What is the Ratio of Females per 100 Males in Mount Hebron?
There are 151.11 Females per 100 Males in Mount Hebron.
What is the Median Population Age in Mount Hebron?
Median Population Age in Mount Hebron is 40.0 Years.
What is the Average Family Size in Mount Hebron
Average Family Size in Mount Hebron is 5.0 People.
What is the Average Household Size in Mount Hebron
Average Household Size in Mount Hebron is 5.4 People.
How Large is the Labor Force in Mount Hebron?
There are 59 People in the Labor Forcein in Mount Hebron.
What is the Percentage of People in the Labor Force in Mount Hebron?
74.7% of People are in the Labor Force in Mount Hebron.
What is the Unemployment Rate in Mount Hebron?
Unemployment Rate in Mount Hebron is 22.0%.