Zip Codes with the Highest Percentage of Population Employed in Office & Administration in San Bernardino, CA
RELATED REPORTS & OPTIONS
Office & Administration
San Bernardino
Compare Zip Codes
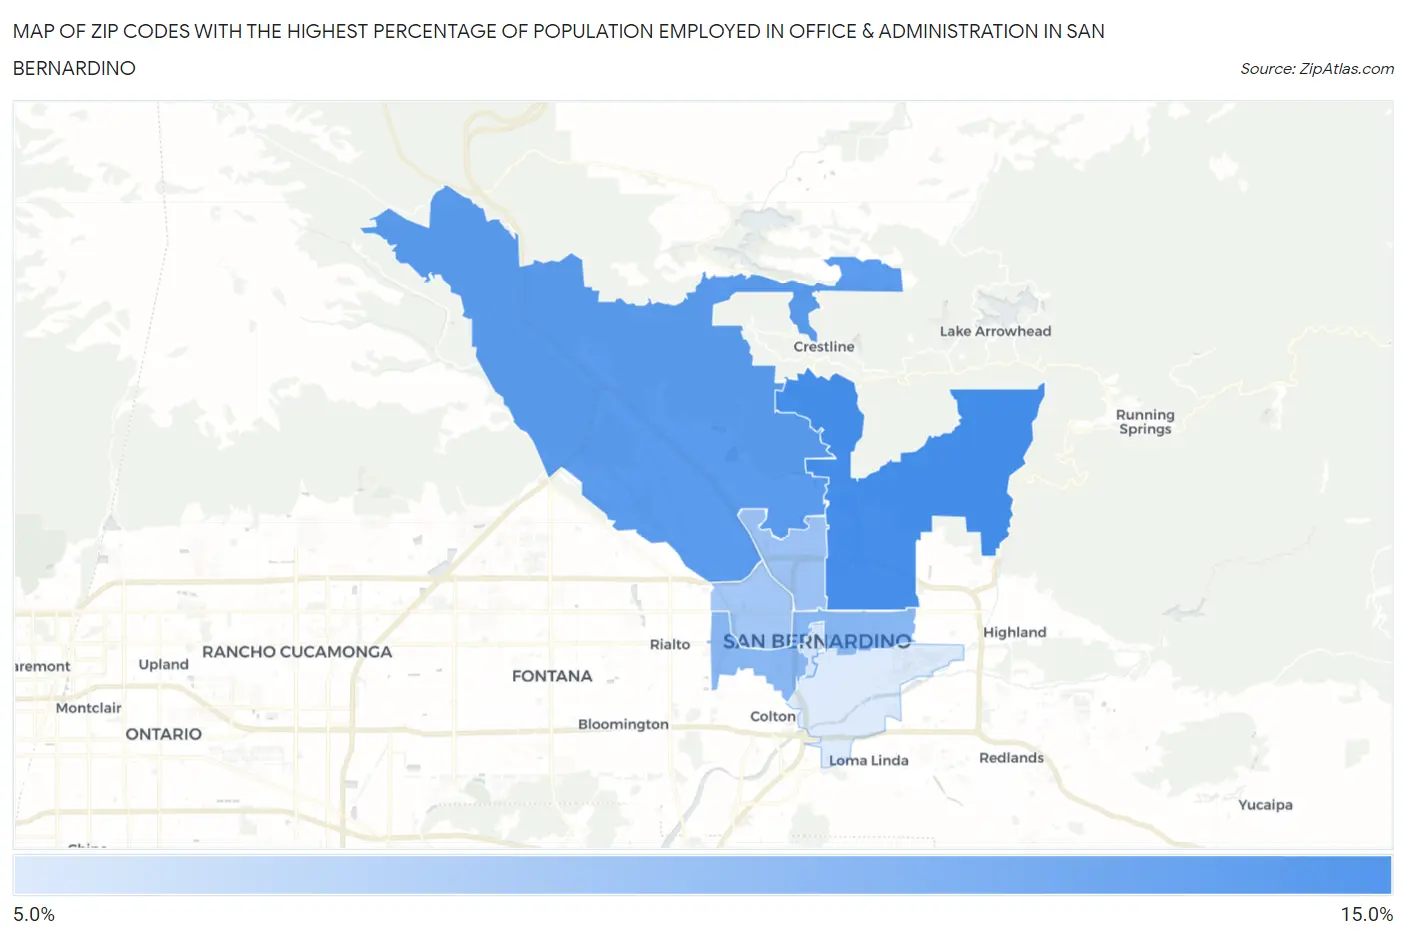
Map of Zip Codes with the Highest Percentage of Population Employed in Office & Administration in San Bernardino
8.0%
13.2%
Zip Codes with the Highest Percentage of Population Employed in Office & Administration in San Bernardino, CA
| Zip Code | % Employed | vs State | vs National | |
| 1. | 92404 | 13.2% | 10.5%(+2.65)#292 | 10.9%(+2.30)#7,693 |
| 2. | 92407 | 12.4% | 10.5%(+1.92)#391 | 10.9%(+1.57)#9,512 |
| 3. | 92410 | 10.9% | 10.5%(+0.396)#679 | 10.9%(+0.043)#14,184 |
| 4. | 92405 | 10.2% | 10.5%(-0.257)#809 | 10.9%(-0.610)#16,340 |
| 5. | 92411 | 10.0% | 10.5%(-0.523)#858 | 10.9%(-0.876)#17,200 |
| 6. | 92401 | 8.4% | 10.5%(-2.08)#1,097 | 10.9%(-2.43)#21,893 |
| 7. | 92408 | 8.0% | 10.5%(-2.50)#1,162 | 10.9%(-2.85)#23,005 |
1
Common Questions
What are the Top 5 Zip Codes with the Highest Percentage of Population Employed in Office & Administration in San Bernardino, CA?
Top 5 Zip Codes with the Highest Percentage of Population Employed in Office & Administration in San Bernardino, CA are:
What zip code has the Highest Percentage of Population Employed in Office & Administration in San Bernardino, CA?
92404 has the Highest Percentage of Population Employed in Office & Administration in San Bernardino, CA with 13.2%.
What is the Percentage of Population Employed in Office & Administration in San Bernardino, CA?
Percentage of Population Employed in Office & Administration in San Bernardino is 11.9%.
What is the Percentage of Population Employed in Office & Administration in California?
Percentage of Population Employed in Office & Administration in California is 10.5%.
What is the Percentage of Population Employed in Office & Administration in the United States?
Percentage of Population Employed in Office & Administration in the United States is 10.9%.