Onyx, CA Map & Demographics
Onyx Map
Onyx Overview
$17,406
PER CAPITA INCOME
$25,982
AVG HOUSEHOLD INCOME
0.26
INEQUALITY / GINI INDEX
645
TOTAL POPULATION
296
MALE POPULATION
349
FEMALE POPULATION
84.81
MALES / 100 FEMALES
117.91
FEMALES / 100 MALES
54.6
MEDIAN AGE
1.9
AVG FAMILY SIZE
2.1
AVG HOUSEHOLD SIZE
173
LABOR FORCE [ PEOPLE ]
26.8%
PERCENT IN LABOR FORCE
37.6%
UNEMPLOYMENT RATE
Onyx Zip Codes
Onyx Area Codes
Income in Onyx
Income Overview in Onyx
| Characteristic | Number | Measure |
| Per Capita Income | 645 | $17,406 |
| Median Family Income | 120 | $0 |
| Mean Family Income | 120 | $32,938 |
| Median Household Income | 307 | $25,982 |
| Mean Household Income | 307 | $36,796 |
| Income Deficit | 120 | $0 |
| Wage / Income Gap (%) | 645 | 0.00% |
| Wage / Income Gap ($) | 645 | 100.00¢ per $1 |
| Gini / Inequality Index | 645 | 0.26 |
Earnings by Sex in Onyx
| Sex | Number | Average Earnings |
| Male | 36 (25.0%) | $0 |
| Female | 108 (75.0%) | $0 |
| Total | 144 (100.0%) | $0 |
Earnings by Sex by Income Bracket in Onyx
The most common earnings brackets in Onyx are $2,500 to $4,999 for men (36 | 100.0%) and $20,000 to $22,499 for women (50 | 46.3%).
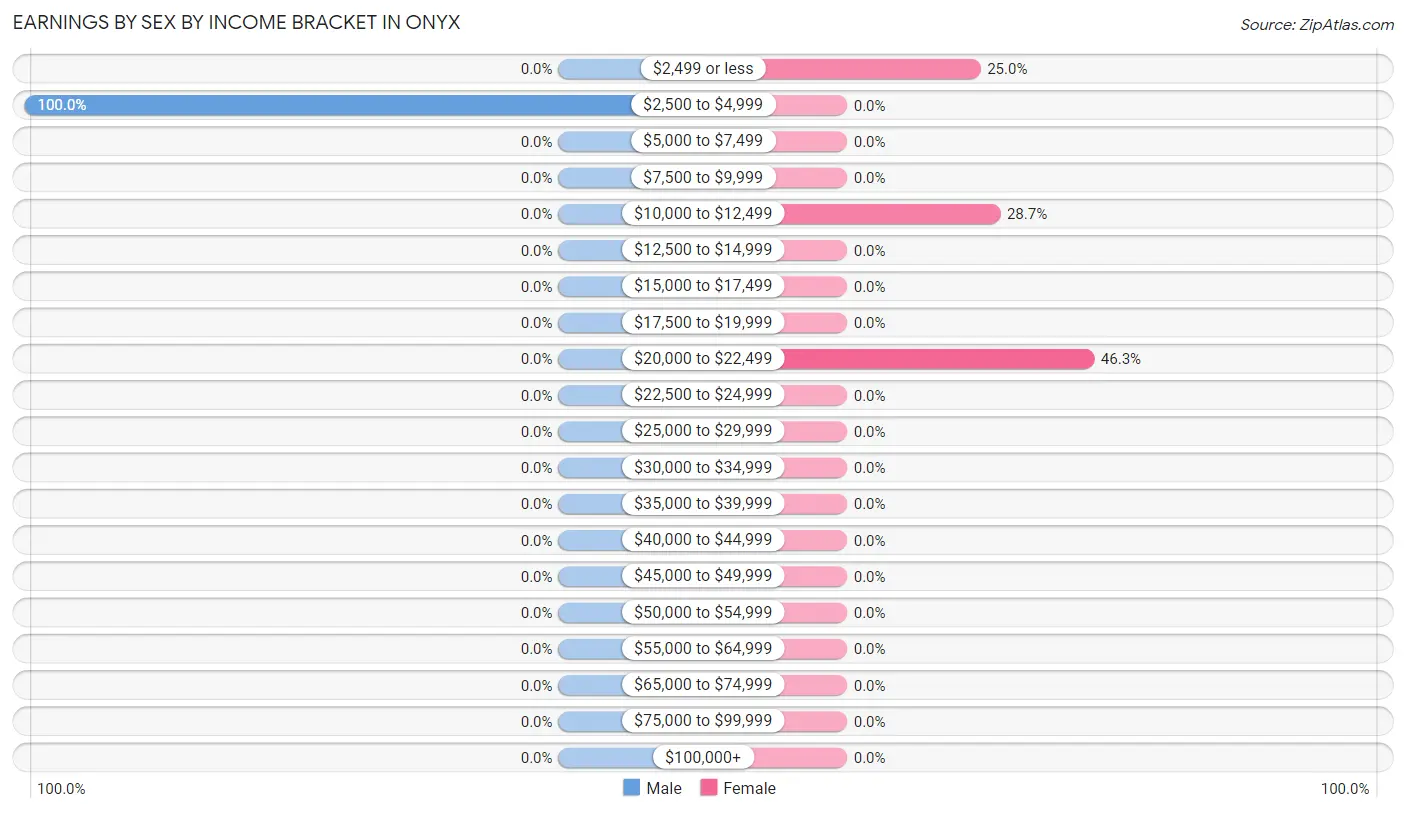
| Income | Male | Female |
| $2,499 or less | 0 (0.0%) | 27 (25.0%) |
| $2,500 to $4,999 | 36 (100.0%) | 0 (0.0%) |
| $5,000 to $7,499 | 0 (0.0%) | 0 (0.0%) |
| $7,500 to $9,999 | 0 (0.0%) | 0 (0.0%) |
| $10,000 to $12,499 | 0 (0.0%) | 31 (28.7%) |
| $12,500 to $14,999 | 0 (0.0%) | 0 (0.0%) |
| $15,000 to $17,499 | 0 (0.0%) | 0 (0.0%) |
| $17,500 to $19,999 | 0 (0.0%) | 0 (0.0%) |
| $20,000 to $22,499 | 0 (0.0%) | 50 (46.3%) |
| $22,500 to $24,999 | 0 (0.0%) | 0 (0.0%) |
| $25,000 to $29,999 | 0 (0.0%) | 0 (0.0%) |
| $30,000 to $34,999 | 0 (0.0%) | 0 (0.0%) |
| $35,000 to $39,999 | 0 (0.0%) | 0 (0.0%) |
| $40,000 to $44,999 | 0 (0.0%) | 0 (0.0%) |
| $45,000 to $49,999 | 0 (0.0%) | 0 (0.0%) |
| $50,000 to $54,999 | 0 (0.0%) | 0 (0.0%) |
| $55,000 to $64,999 | 0 (0.0%) | 0 (0.0%) |
| $65,000 to $74,999 | 0 (0.0%) | 0 (0.0%) |
| $75,000 to $99,999 | 0 (0.0%) | 0 (0.0%) |
| $100,000+ | 0 (0.0%) | 0 (0.0%) |
| Total | 36 (100.0%) | 108 (100.0%) |
Earnings by Sex by Educational Attainment in Onyx
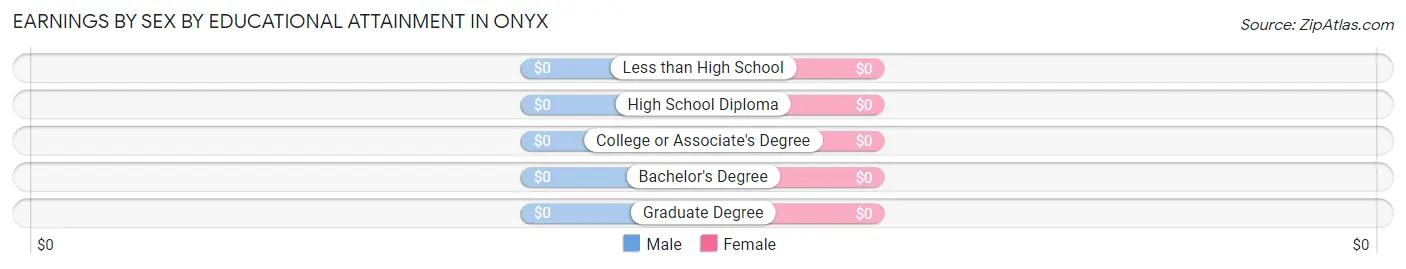
| Educational Attainment | Male Income | Female Income |
| Less than High School | - | - |
| High School Diploma | - | - |
| College or Associate's Degree | - | - |
| Bachelor's Degree | - | - |
| Graduate Degree | - | - |
| Total | - | - |
Family Income in Onyx
Family Income Brackets in Onyx
According to the Onyx family income data, there are 101 families falling into the $15,000 to $24,999 income range, which is the most common income bracket and makes up 84.2% of all families.
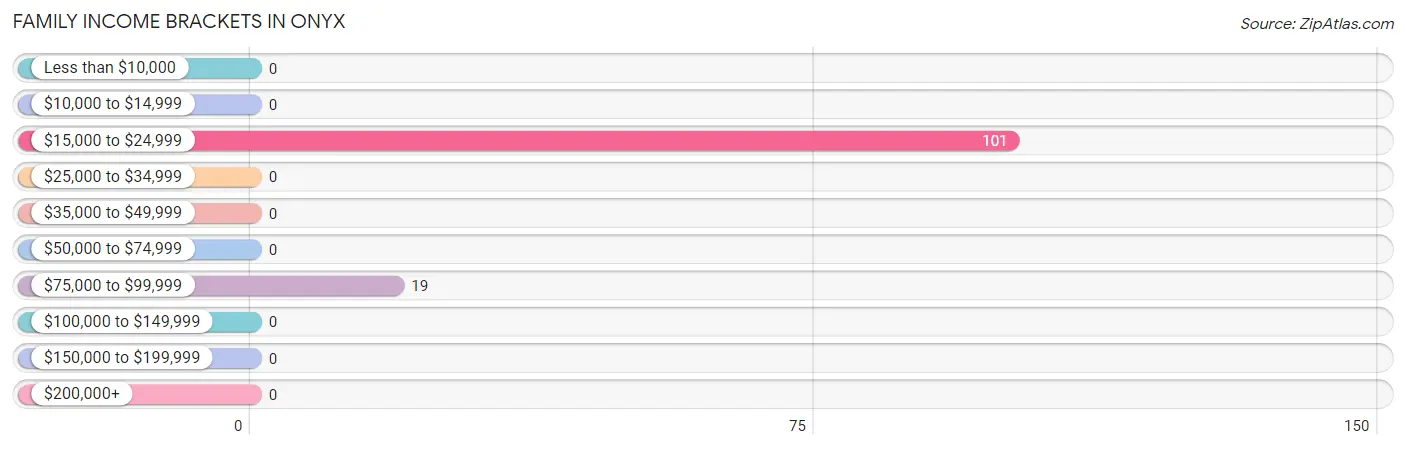
| Income Bracket | # Families | % Families |
| Less than $10,000 | 0 | 0.0% |
| $10,000 to $14,999 | 0 | 0.0% |
| $15,000 to $24,999 | 101 | 84.2% |
| $25,000 to $34,999 | 0 | 0.0% |
| $35,000 to $49,999 | 0 | 0.0% |
| $50,000 to $74,999 | 0 | 0.0% |
| $75,000 to $99,999 | 19 | 15.8% |
| $100,000 to $149,999 | 0 | 0.0% |
| $150,000 to $199,999 | 0 | 0.0% |
| $200,000+ | 0 | 0.0% |
Family Income by Famaliy Size in Onyx
| Income Bracket | # Families | Median Income |
| 2-Person Families | 120 (100.0%) | $0 |
| 3-Person Families | 0 (0.0%) | $0 |
| 4-Person Families | 0 (0.0%) | $0 |
| 5-Person Families | 0 (0.0%) | $0 |
| 6-Person Families | 0 (0.0%) | $0 |
| 7+ Person Families | 0 (0.0%) | $0 |
| Total | 120 (100.0%) | $0 |
Family Income by Number of Earners in Onyx
| Number of Earners | # Families | Median Income |
| No Earners | 0 (0.0%) | $0 |
| 1 Earner | 120 (100.0%) | $0 |
| 2 Earners | 0 (0.0%) | $0 |
| 3+ Earners | 0 (0.0%) | $0 |
| Total | 120 (100.0%) | $0 |
Household Income in Onyx
Household Income Brackets in Onyx
With 148 households falling in the category, the $15,000 to $24,999 income range is the most frequent in Onyx, accounting for 48.2% of all households.
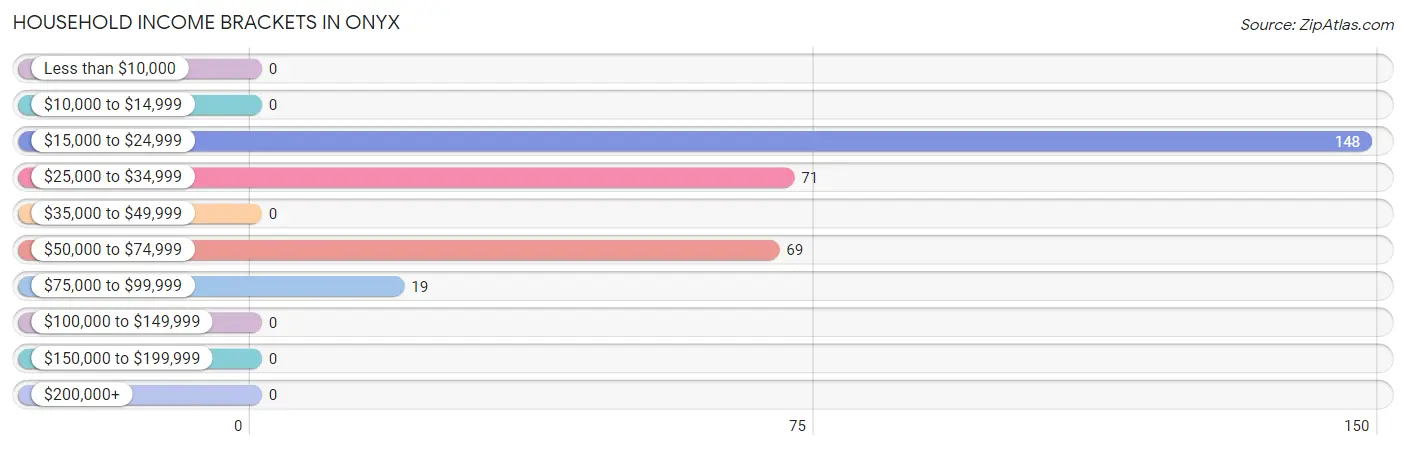
| Income Bracket | # Households | % Households |
| Less than $10,000 | 0 | 0.0% |
| $10,000 to $14,999 | 0 | 0.0% |
| $15,000 to $24,999 | 148 | 48.2% |
| $25,000 to $34,999 | 71 | 23.1% |
| $35,000 to $49,999 | 0 | 0.0% |
| $50,000 to $74,999 | 69 | 22.5% |
| $75,000 to $99,999 | 19 | 6.2% |
| $100,000 to $149,999 | 0 | 0.0% |
| $150,000 to $199,999 | 0 | 0.0% |
| $200,000+ | 0 | 0.0% |
Household Income by Householder Age in Onyx
The median household income in Onyx is $25,982, with the highest median household income of $51,375 found in the 65+ years age bracket for the primary householder. A total of 83 households (27.0%) fall into this category. Meanwhile, the 15 to 24 years age bracket for the primary householder has the lowest median household income of $0, with 47 households (15.3%) in this group.
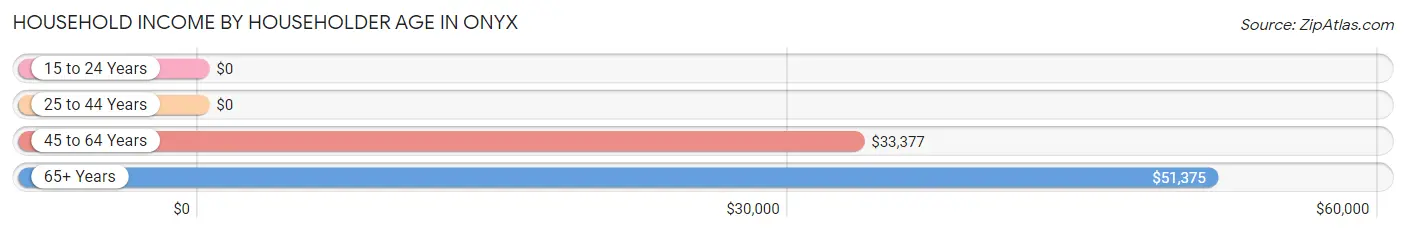
| Income Bracket | # Households | Median Income |
| 15 to 24 Years | 47 (15.3%) | $0 |
| 25 to 44 Years | 65 (21.2%) | $0 |
| 45 to 64 Years | 112 (36.5%) | $33,377 |
| 65+ Years | 83 (27.0%) | $51,375 |
| Total | 307 (100.0%) | $25,982 |
Poverty in Onyx
Income Below Poverty by Sex and Age in Onyx
With 28.0% poverty level for males and 27.5% for females among the residents of Onyx, 55 to 64 year old males and 18 to 24 year old females are the most vulnerable to poverty, with 63 males (63.6%) and 96 females (65.7%) in their respective age groups living below the poverty level.
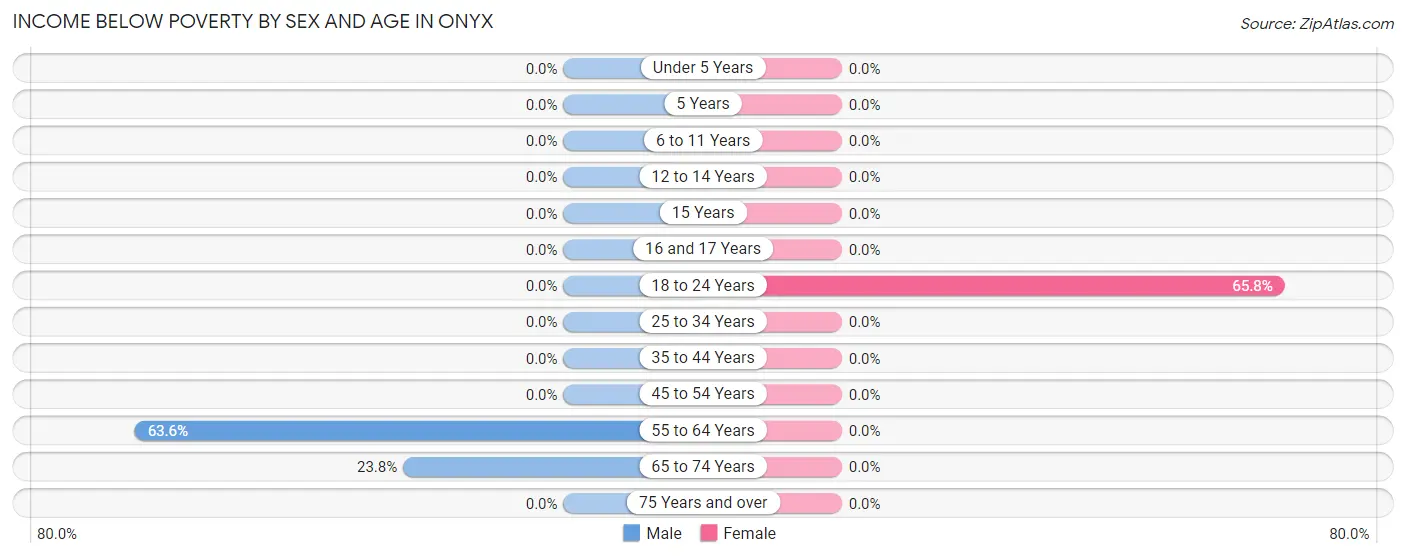
| Age Bracket | Male | Female |
| Under 5 Years | 0 (0.0%) | 0 (0.0%) |
| 5 Years | 0 (0.0%) | 0 (0.0%) |
| 6 to 11 Years | 0 (0.0%) | 0 (0.0%) |
| 12 to 14 Years | 0 (0.0%) | 0 (0.0%) |
| 15 Years | 0 (0.0%) | 0 (0.0%) |
| 16 and 17 Years | 0 (0.0%) | 0 (0.0%) |
| 18 to 24 Years | 0 (0.0%) | 96 (65.7%) |
| 25 to 34 Years | 0 (0.0%) | 0 (0.0%) |
| 35 to 44 Years | 0 (0.0%) | 0 (0.0%) |
| 45 to 54 Years | 0 (0.0%) | 0 (0.0%) |
| 55 to 64 Years | 63 (63.6%) | 0 (0.0%) |
| 65 to 74 Years | 20 (23.8%) | 0 (0.0%) |
| 75 Years and over | 0 (0.0%) | 0 (0.0%) |
| Total | 83 (28.0%) | 96 (27.5%) |
Income Above Poverty by Sex and Age in Onyx
According to the poverty statistics in Onyx, males aged 25 to 34 years and females aged 25 to 34 years are the age groups that are most secure financially, with 100.0% of males and 100.0% of females in these age groups living above the poverty line.
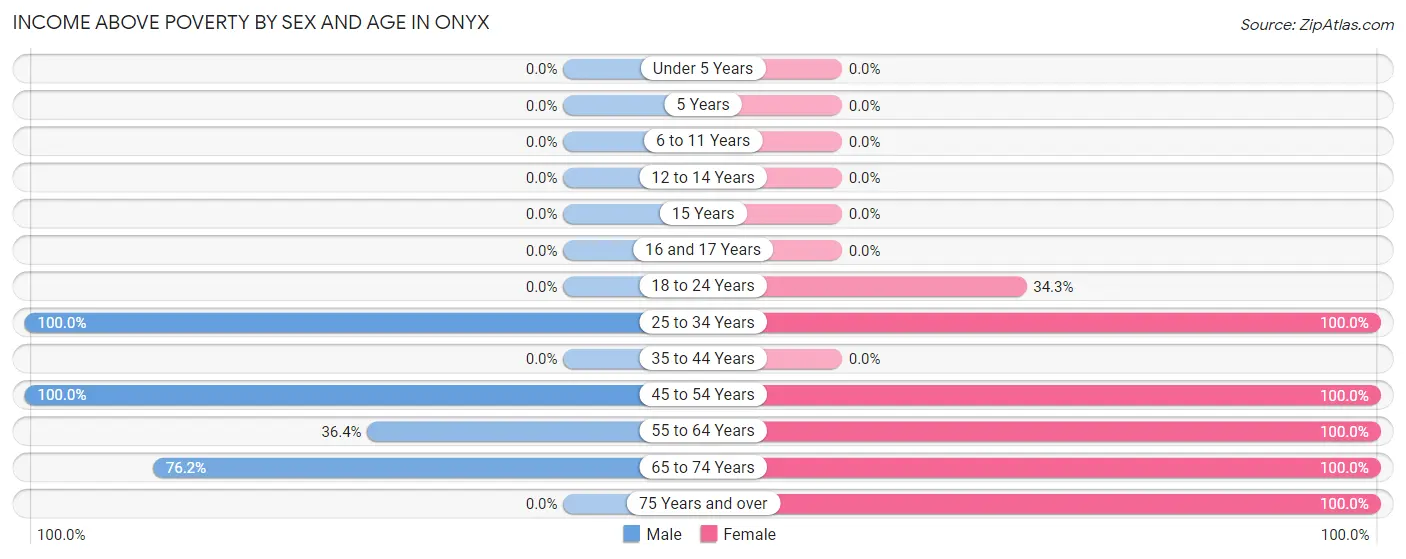
| Age Bracket | Male | Female |
| Under 5 Years | 0 (0.0%) | 0 (0.0%) |
| 5 Years | 0 (0.0%) | 0 (0.0%) |
| 6 to 11 Years | 0 (0.0%) | 0 (0.0%) |
| 12 to 14 Years | 0 (0.0%) | 0 (0.0%) |
| 15 Years | 0 (0.0%) | 0 (0.0%) |
| 16 and 17 Years | 0 (0.0%) | 0 (0.0%) |
| 18 to 24 Years | 0 (0.0%) | 50 (34.3%) |
| 25 to 34 Years | 65 (100.0%) | 31 (100.0%) |
| 35 to 44 Years | 0 (0.0%) | 0 (0.0%) |
| 45 to 54 Years | 48 (100.0%) | 57 (100.0%) |
| 55 to 64 Years | 36 (36.4%) | 46 (100.0%) |
| 65 to 74 Years | 64 (76.2%) | 50 (100.0%) |
| 75 Years and over | 0 (0.0%) | 19 (100.0%) |
| Total | 213 (72.0%) | 253 (72.5%) |
Income Below Poverty Among Married-Couple Families in Onyx
| Children | Above Poverty | Below Poverty |
| No Children | 0 (0.0%) | 0 (0.0%) |
| 1 or 2 Children | 0 (0.0%) | 0 (0.0%) |
| 3 or 4 Children | 0 (0.0%) | 0 (0.0%) |
| 5 or more Children | 0 (0.0%) | 0 (0.0%) |
| Total | 0 (0.0%) | 0 (0.0%) |
Income Below Poverty Among Single-Parent Households in Onyx
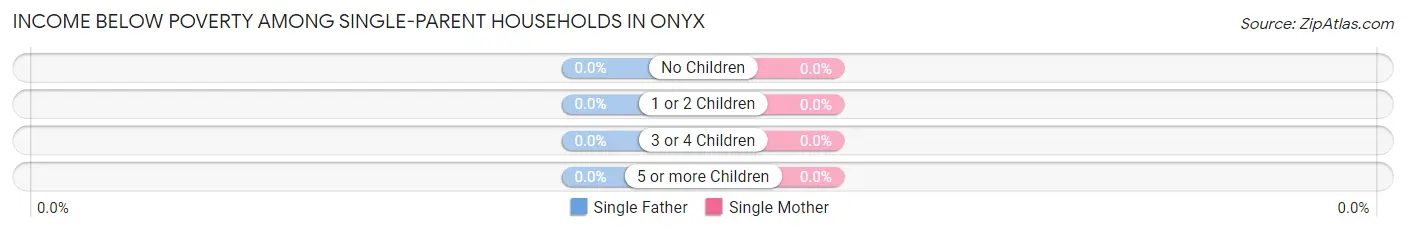
| Children | Single Father | Single Mother |
| No Children | 0 (0.0%) | 0 (0.0%) |
| 1 or 2 Children | 0 (0.0%) | 0 (0.0%) |
| 3 or 4 Children | 0 (0.0%) | 0 (0.0%) |
| 5 or more Children | 0 (0.0%) | 0 (0.0%) |
| Total | 0 (0.0%) | 0 (0.0%) |
Income Below Poverty Among Married-Couple vs Single-Parent Households in Onyx
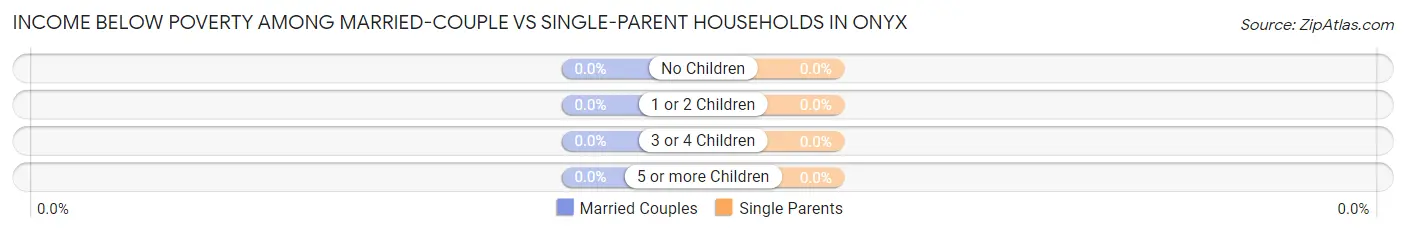
| Children | Married-Couple Families | Single-Parent Households |
| No Children | 0 (0.0%) | 0 (0.0%) |
| 1 or 2 Children | 0 (0.0%) | 0 (0.0%) |
| 3 or 4 Children | 0 (0.0%) | 0 (0.0%) |
| 5 or more Children | 0 (0.0%) | 0 (0.0%) |
| Total | 0 (0.0%) | 0 (0.0%) |
Race in Onyx
The most populous races in Onyx are White / Caucasian (407 | 63.1%), Hispanic or Latino (99 | 15.3%), and Some other Race (99 | 15.3%).
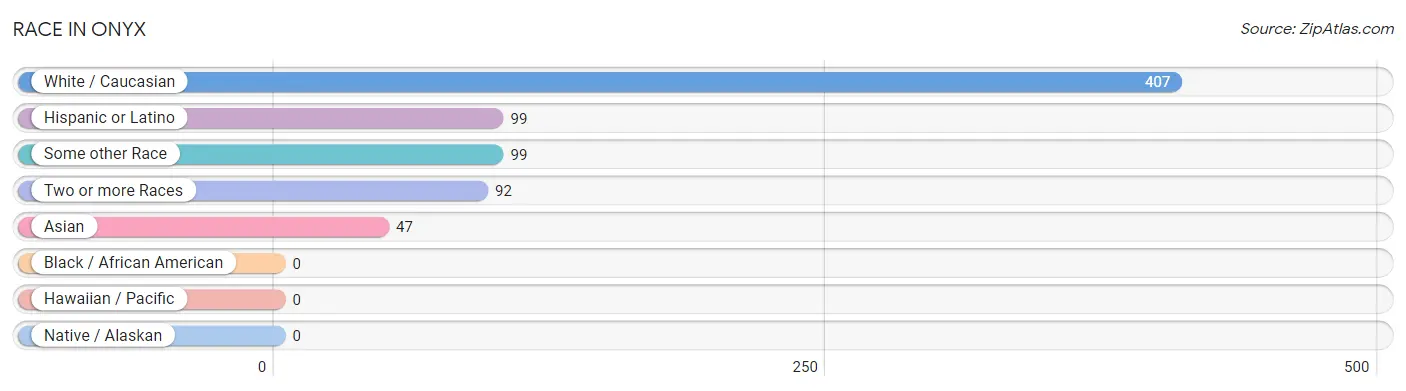
| Race | # Population | % Population |
| Asian | 47 | 7.3% |
| Black / African American | 0 | 0.0% |
| Hawaiian / Pacific | 0 | 0.0% |
| Hispanic or Latino | 99 | 15.3% |
| Native / Alaskan | 0 | 0.0% |
| White / Caucasian | 407 | 63.1% |
| Two or more Races | 92 | 14.3% |
| Some other Race | 99 | 15.3% |
| Total | 645 | 100.0% |
Ancestry in Onyx
The most populous ancestries reported in Onyx are American (120 | 18.6%), German (103 | 16.0%), Mexican (99 | 15.3%), Cherokee (92 | 14.3%), and Welsh (50 | 7.7%), together accounting for 71.9% of all Onyx residents.
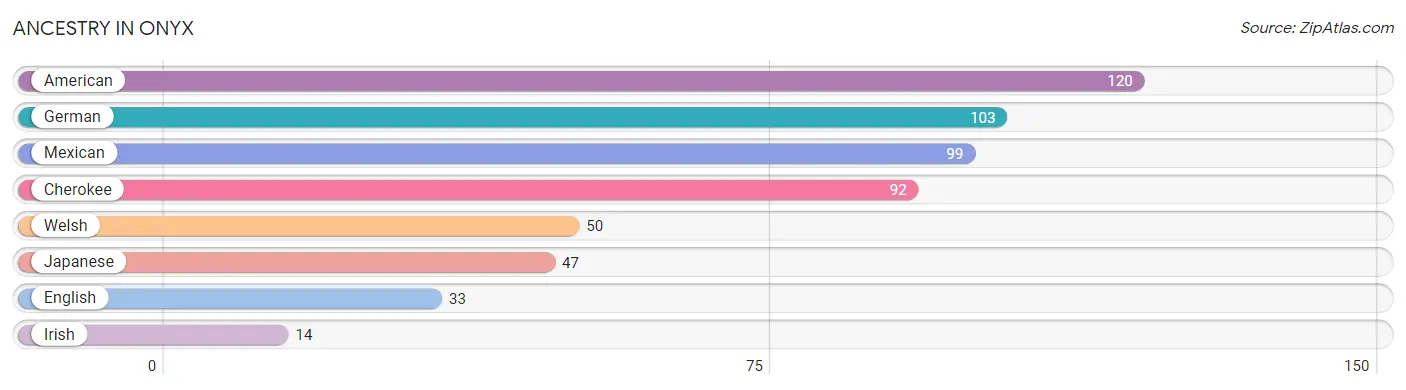
| Ancestry | # Population | % Population |
| American | 120 | 18.6% |
| Cherokee | 92 | 14.3% |
| English | 33 | 5.1% |
| German | 103 | 16.0% |
| Irish | 14 | 2.2% |
| Japanese | 47 | 7.3% |
| Mexican | 99 | 15.3% |
| Welsh | 50 | 7.7% | View All 8 Rows |
Immigrants in Onyx
The most numerous immigrant groups reported in Onyx came from Central America (49 | 7.6%), Latin America (49 | 7.6%), and Mexico (49 | 7.6%), together accounting for 22.8% of all Onyx residents.
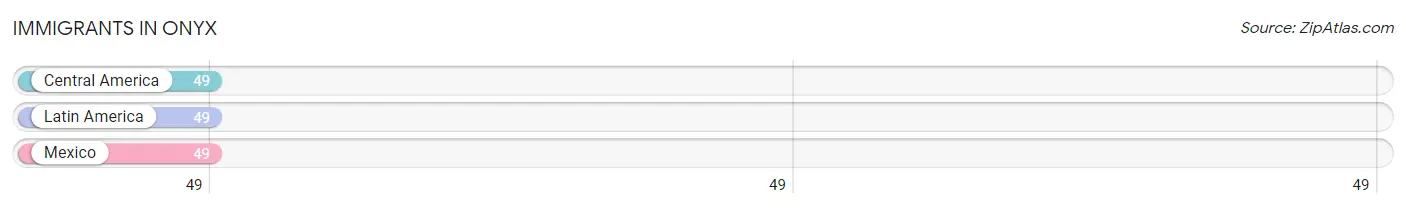
| Immigration Origin | # Population | % Population |
| Central America | 49 | 7.6% |
| Latin America | 49 | 7.6% |
| Mexico | 49 | 7.6% | View All 3 Rows |
Sex and Age in Onyx
Sex and Age in Onyx
The most populous age groups in Onyx are 30 to 34 Years (65 | 22.0%) for men and 20 to 24 Years (146 | 41.8%) for women.
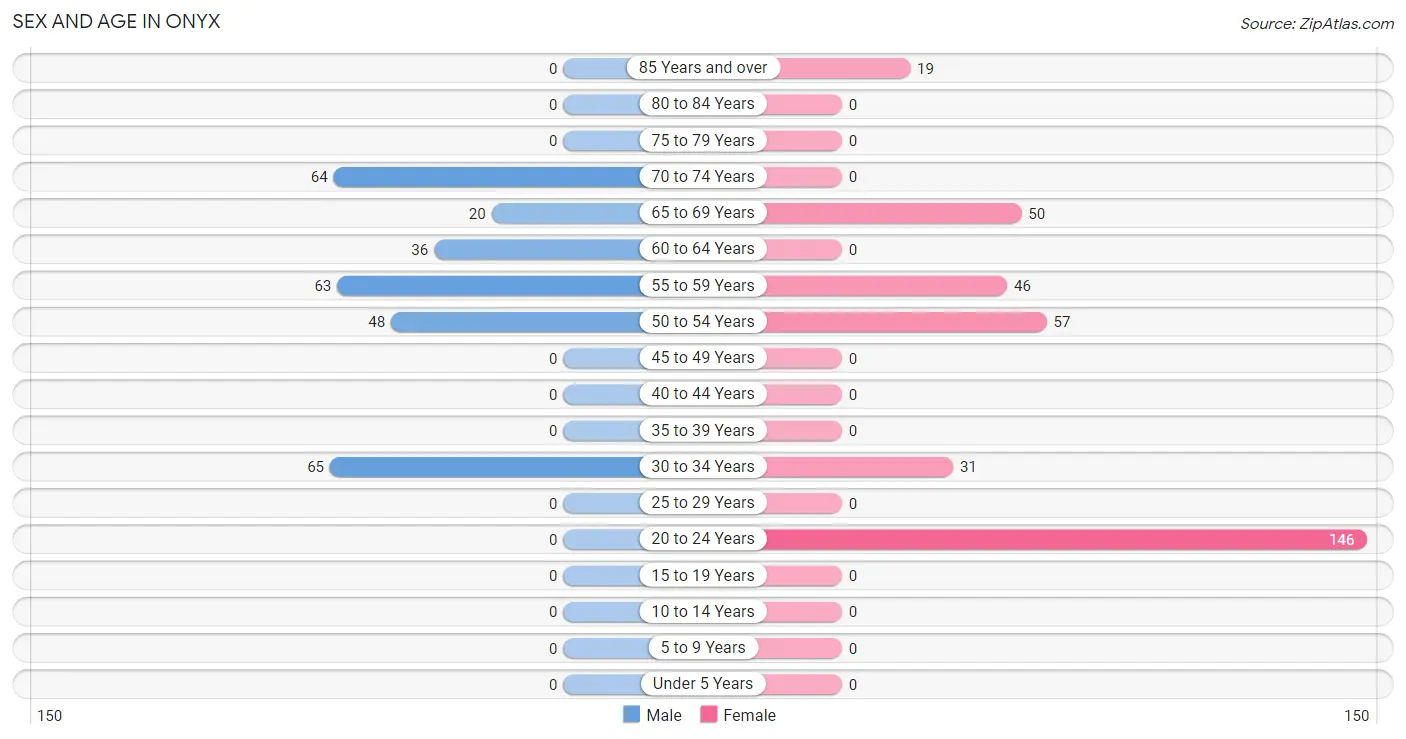
| Age Bracket | Male | Female |
| Under 5 Years | 0 (0.0%) | 0 (0.0%) |
| 5 to 9 Years | 0 (0.0%) | 0 (0.0%) |
| 10 to 14 Years | 0 (0.0%) | 0 (0.0%) |
| 15 to 19 Years | 0 (0.0%) | 0 (0.0%) |
| 20 to 24 Years | 0 (0.0%) | 146 (41.8%) |
| 25 to 29 Years | 0 (0.0%) | 0 (0.0%) |
| 30 to 34 Years | 65 (22.0%) | 31 (8.9%) |
| 35 to 39 Years | 0 (0.0%) | 0 (0.0%) |
| 40 to 44 Years | 0 (0.0%) | 0 (0.0%) |
| 45 to 49 Years | 0 (0.0%) | 0 (0.0%) |
| 50 to 54 Years | 48 (16.2%) | 57 (16.3%) |
| 55 to 59 Years | 63 (21.3%) | 46 (13.2%) |
| 60 to 64 Years | 36 (12.2%) | 0 (0.0%) |
| 65 to 69 Years | 20 (6.8%) | 50 (14.3%) |
| 70 to 74 Years | 64 (21.6%) | 0 (0.0%) |
| 75 to 79 Years | 0 (0.0%) | 0 (0.0%) |
| 80 to 84 Years | 0 (0.0%) | 0 (0.0%) |
| 85 Years and over | 0 (0.0%) | 19 (5.4%) |
| Total | 296 (100.0%) | 349 (100.0%) |
Families and Households in Onyx
Median Family Size in Onyx
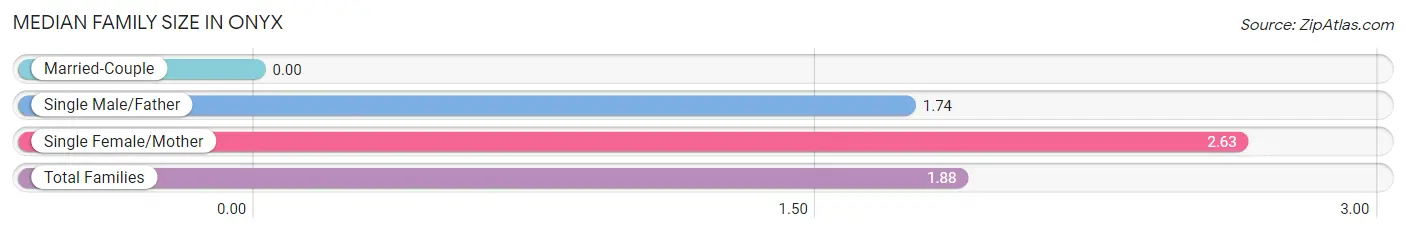
| Family Type | # Families | Family Size |
| Married-Couple | 0 (0.0%) | - |
| Single Male/Father | 101 (84.2%) | 1.74 |
| Single Female/Mother | 19 (15.8%) | 2.63 |
| Total Families | 120 (100.0%) | 1.88 |
Median Household Size in Onyx
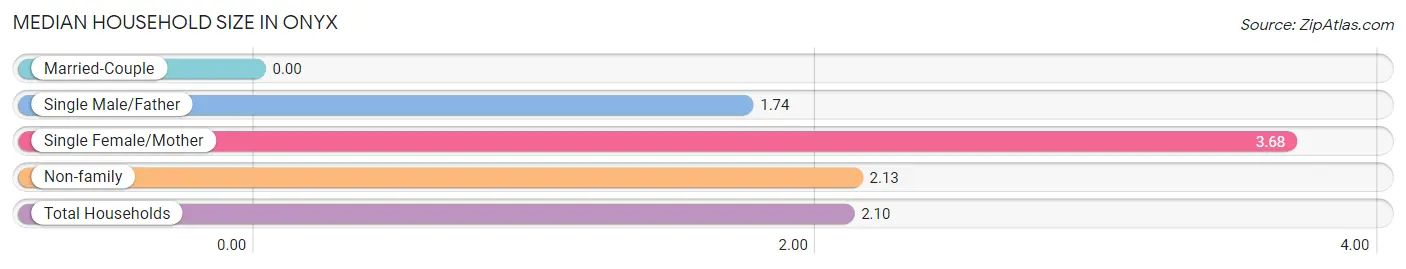
| Household Type | # Households | Household Size |
| Married-Couple | 0 (0.0%) | - |
| Single Male/Father | 101 (32.9%) | 1.74 |
| Single Female/Mother | 19 (6.2%) | 3.68 |
| Non-family | 187 (60.9%) | 2.13 |
| Total Households | 307 (100.0%) | 2.10 |
Household Size by Marriage Status in Onyx
Out of a total of 307 households in Onyx, 120 (39.1%) are family households, while 187 (60.9%) are nonfamily households. The most numerous type of family households are 2-person households, comprising 101, and the most common type of nonfamily households are 2-person households, comprising 107.
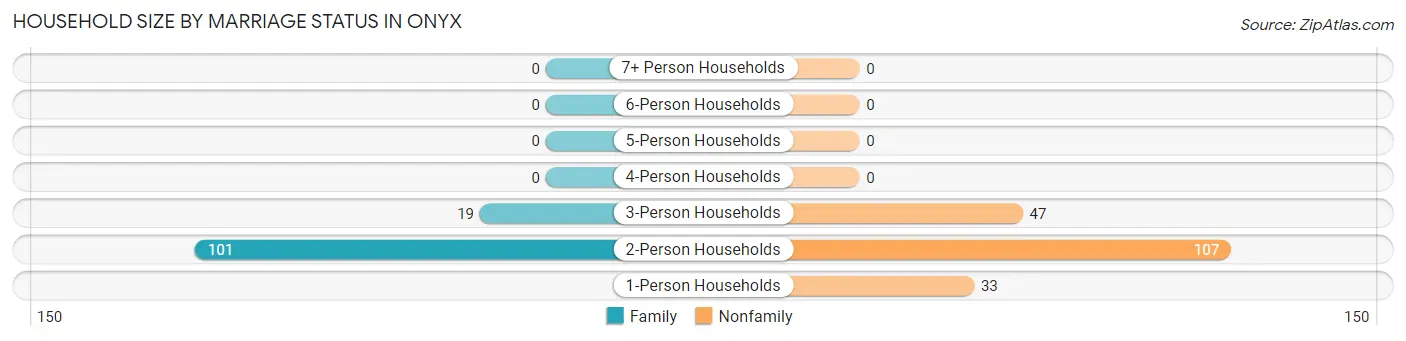
| Household Size | Family Households | Nonfamily Households |
| 1-Person Households | - | 33 (10.7%) |
| 2-Person Households | 101 (32.9%) | 107 (34.8%) |
| 3-Person Households | 19 (6.2%) | 47 (15.3%) |
| 4-Person Households | 0 (0.0%) | 0 (0.0%) |
| 5-Person Households | 0 (0.0%) | 0 (0.0%) |
| 6-Person Households | 0 (0.0%) | 0 (0.0%) |
| 7+ Person Households | 0 (0.0%) | 0 (0.0%) |
| Total | 120 (39.1%) | 187 (60.9%) |
Female Fertility in Onyx
Fertility by Age in Onyx
| Age Bracket | Women with Births | Births / 1,000 Women |
| 15 to 19 years | 0 (0.0%) | 0.0 |
| 20 to 34 years | 0 (0.0%) | 0.0 |
| 35 to 50 years | 0 (0.0%) | 0.0 |
| Total | 0 (0.0%) | 0.0 |
Fertility by Age by Marriage Status in Onyx
| Age Bracket | Married | Unmarried |
| 15 to 19 years | 0 (0.0%) | 0 (0.0%) |
| 20 to 34 years | 0 (0.0%) | 0 (0.0%) |
| 35 to 50 years | 0 (0.0%) | 0 (0.0%) |
| Total | 0 (0.0%) | 0 (0.0%) |
Fertility by Education in Onyx
| Educational Attainment | Women with Births | Births / 1,000 Women |
| Less than High School | 0 (0.0%) | 0.0 |
| High School Diploma | 0 (0.0%) | 0.0 |
| College or Associate's Degree | 0 (0.0%) | 0.0 |
| Bachelor's Degree | 0 (0.0%) | 0.0 |
| Graduate Degree | 0 (0.0%) | 0.0 |
| Total | 0 (0.0%) | 0.0 |
Fertility by Education by Marriage Status in Onyx
| Educational Attainment | Married | Unmarried |
| Less than High School | 0 (0.0%) | 0 (0.0%) |
| High School Diploma | 0 (0.0%) | 0 (0.0%) |
| College or Associate's Degree | 0 (0.0%) | 0 (0.0%) |
| Bachelor's Degree | 0 (0.0%) | 0 (0.0%) |
| Graduate Degree | 0 (0.0%) | 0 (0.0%) |
| Total | 0 (0.0%) | 0 (0.0%) |
Employment Characteristics in Onyx
Employment by Class of Employer in Onyx
Among the 108 employed individuals in Onyx, not-for-profit organizations (50 | 46.3%), private company employees (31 | 28.7%), and local government employees (27 | 25.0%) make up the most common classes of employment.
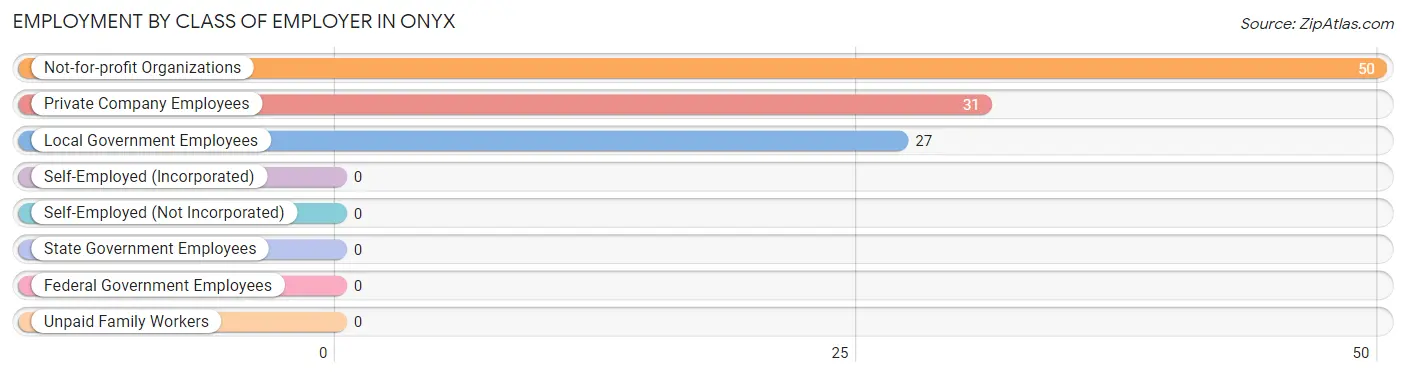
| Employer Class | # Employees | % Employees |
| Private Company Employees | 31 | 28.7% |
| Self-Employed (Incorporated) | 0 | 0.0% |
| Self-Employed (Not Incorporated) | 0 | 0.0% |
| Not-for-profit Organizations | 50 | 46.3% |
| Local Government Employees | 27 | 25.0% |
| State Government Employees | 0 | 0.0% |
| Federal Government Employees | 0 | 0.0% |
| Unpaid Family Workers | 0 | 0.0% |
| Total | 108 | 100.0% |
Employment Status by Age in Onyx
According to the labor force statistics for Onyx, out of the total population over 16 years of age (645), 26.8% or 173 individuals are in the labor force, with 37.6% or 65 of them unemployed. The age group with the highest labor force participation rate is 30 to 34 years, with 100.0% or 96 individuals in the labor force. Within the labor force, the 30 to 34 years age range has the highest percentage of unemployed individuals, with 67.7% or 65 of them being unemployed.
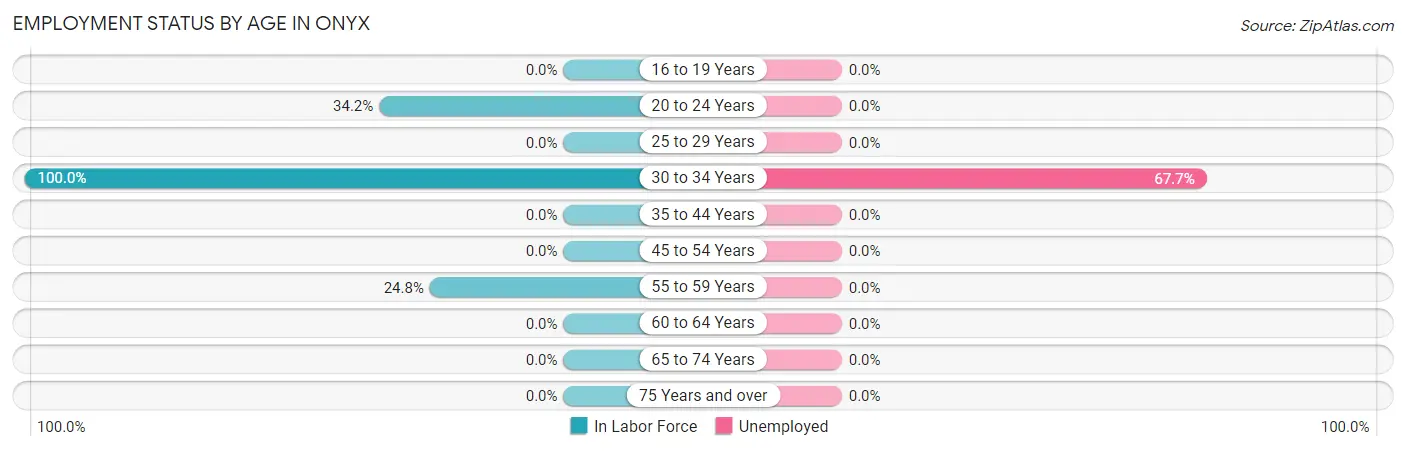
| Age Bracket | In Labor Force | Unemployed |
| 16 to 19 Years | 0 (0.0%) | 0 (0.0%) |
| 20 to 24 Years | 50 (34.2%) | 0 (0.0%) |
| 25 to 29 Years | 0 (0.0%) | 0 (0.0%) |
| 30 to 34 Years | 96 (100.0%) | 65 (67.7%) |
| 35 to 44 Years | 0 (0.0%) | 0 (0.0%) |
| 45 to 54 Years | 0 (0.0%) | 0 (0.0%) |
| 55 to 59 Years | 27 (24.8%) | 0 (0.0%) |
| 60 to 64 Years | 0 (0.0%) | 0 (0.0%) |
| 65 to 74 Years | 0 (0.0%) | 0 (0.0%) |
| 75 Years and over | 0 (0.0%) | 0 (0.0%) |
| Total | 173 (26.8%) | 65 (37.6%) |
Employment Status by Educational Attainment in Onyx
According to labor force statistics for Onyx, 35.5% of individuals (123) out of the total population between 25 and 64 years of age (346) are in the labor force, with 52.8% or 65 of them being unemployed. The group with the highest labor force participation rate are those with the educational attainment of less than high school, with 100.0% or 65 individuals in the labor force. Within the labor force, individuals with less than high school education have the highest percentage of unemployment, with 100.0% or 65 of them being unemployed.
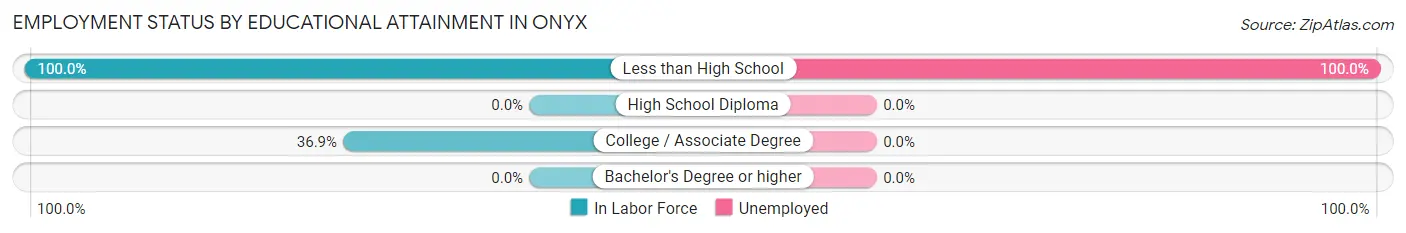
| Educational Attainment | In Labor Force | Unemployed |
| Less than High School | 65 (100.0%) | 65 (100.0%) |
| High School Diploma | 0 (0.0%) | 0 (0.0%) |
| College / Associate Degree | 58 (36.9%) | 0 (0.0%) |
| Bachelor's Degree or higher | 0 (0.0%) | 0 (0.0%) |
| Total | 123 (35.5%) | 183 (52.8%) |
Employment Occupations by Sex in Onyx
Management, Business, Science and Arts Occupations
Management, Business, Science and Arts Occupations by Sex
| Occupation | Male | Female |
| Management | 0 (0.0%) | 0 (0.0%) |
| Business & Financial | 0 (0.0%) | 0 (0.0%) |
| Computers, Engineering & Science | 0 (0.0%) | 0 (0.0%) |
| Computers & Mathematics | 0 (0.0%) | 0 (0.0%) |
| Architecture & Engineering | 0 (0.0%) | 0 (0.0%) |
| Life, Physical & Social Science | 0 (0.0%) | 0 (0.0%) |
| Community & Social Service | 0 (0.0%) | 0 (0.0%) |
| Education, Arts & Media | 0 (0.0%) | 0 (0.0%) |
| Legal Services & Support | 0 (0.0%) | 0 (0.0%) |
| Education Instruction & Library | 0 (0.0%) | 0 (0.0%) |
| Arts, Media & Entertainment | 0 (0.0%) | 0 (0.0%) |
| Health Diagnosing & Treating | 0 (0.0%) | 0 (0.0%) |
| Health Technologists | 0 (0.0%) | 0 (0.0%) |
| Total (Category) | 0 (0.0%) | 0 (0.0%) |
| Total (Overall) | 0 (0.0%) | 108 (100.0%) |
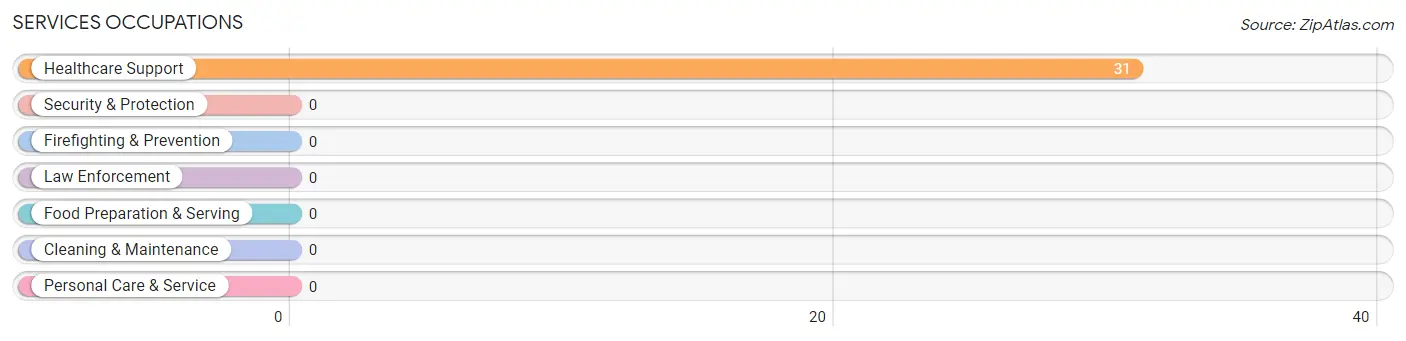
Services Occupations
The most common Services occupations in Onyx are , and Healthcare Support (31 | 28.7%).
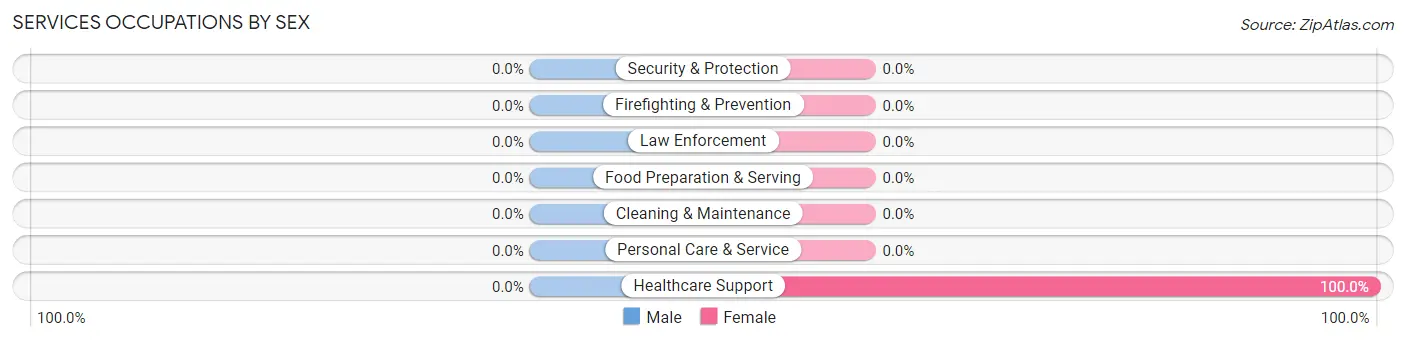
Services Occupations by Sex
| Occupation | Male | Female |
| Healthcare Support | 0 (0.0%) | 31 (100.0%) |
| Security & Protection | 0 (0.0%) | 0 (0.0%) |
| Firefighting & Prevention | 0 (0.0%) | 0 (0.0%) |
| Law Enforcement | 0 (0.0%) | 0 (0.0%) |
| Food Preparation & Serving | 0 (0.0%) | 0 (0.0%) |
| Cleaning & Maintenance | 0 (0.0%) | 0 (0.0%) |
| Personal Care & Service | 0 (0.0%) | 0 (0.0%) |
| Total (Category) | 0 (0.0%) | 31 (100.0%) |
| Total (Overall) | 0 (0.0%) | 108 (100.0%) |
Sales and Office Occupations
The most common Sales and Office occupations in Onyx are , and Office & Administration (77 | 71.3%).
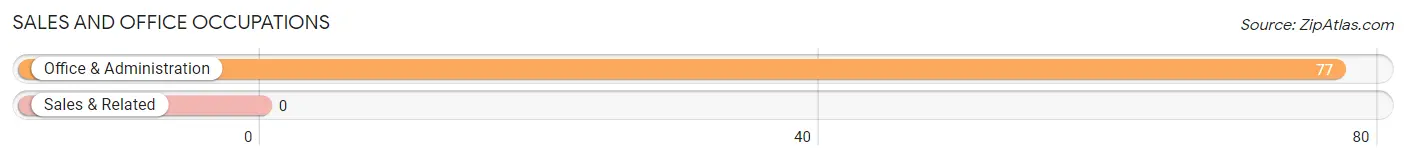
Sales and Office Occupations by Sex
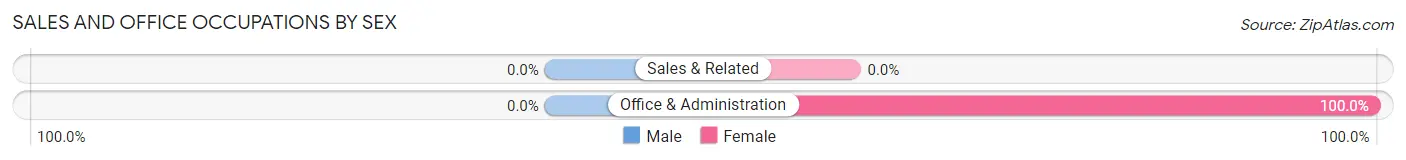
| Occupation | Male | Female |
| Sales & Related | 0 (0.0%) | 0 (0.0%) |
| Office & Administration | 0 (0.0%) | 77 (100.0%) |
| Total (Category) | 0 (0.0%) | 77 (100.0%) |
| Total (Overall) | 0 (0.0%) | 108 (100.0%) |
Natural Resources, Construction and Maintenance Occupations
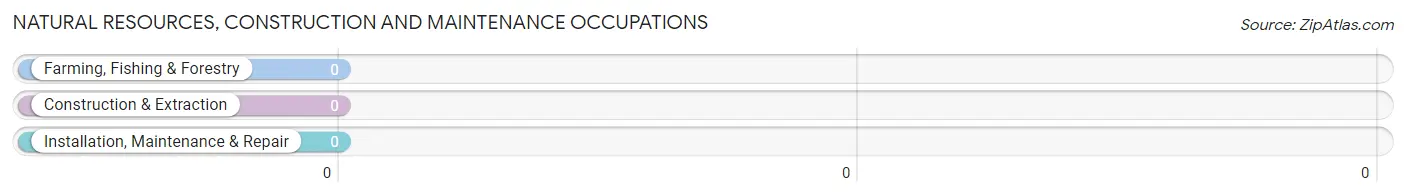
Natural Resources, Construction and Maintenance Occupations by Sex
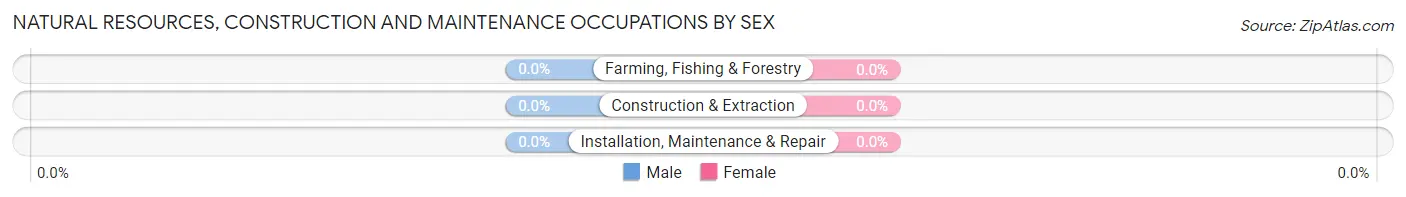
| Occupation | Male | Female |
| Farming, Fishing & Forestry | 0 (0.0%) | 0 (0.0%) |
| Construction & Extraction | 0 (0.0%) | 0 (0.0%) |
| Installation, Maintenance & Repair | 0 (0.0%) | 0 (0.0%) |
| Total (Category) | 0 (0.0%) | 0 (0.0%) |
| Total (Overall) | 0 (0.0%) | 108 (100.0%) |
Production, Transportation and Moving Occupations
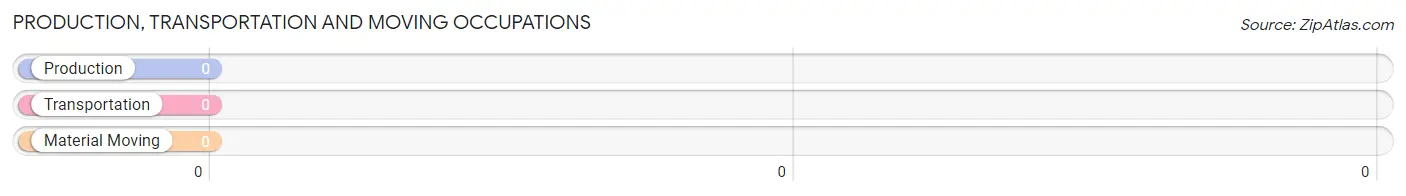
Production, Transportation and Moving Occupations by Sex
| Occupation | Male | Female |
| Production | 0 (0.0%) | 0 (0.0%) |
| Transportation | 0 (0.0%) | 0 (0.0%) |
| Material Moving | 0 (0.0%) | 0 (0.0%) |
| Total (Category) | 0 (0.0%) | 0 (0.0%) |
| Total (Overall) | 0 (0.0%) | 108 (100.0%) |
Employment Industries by Sex in Onyx
Employment Industries in Onyx
The major employment industries in Onyx include , and Health Care & Social Assistance (108 | 100.0%).
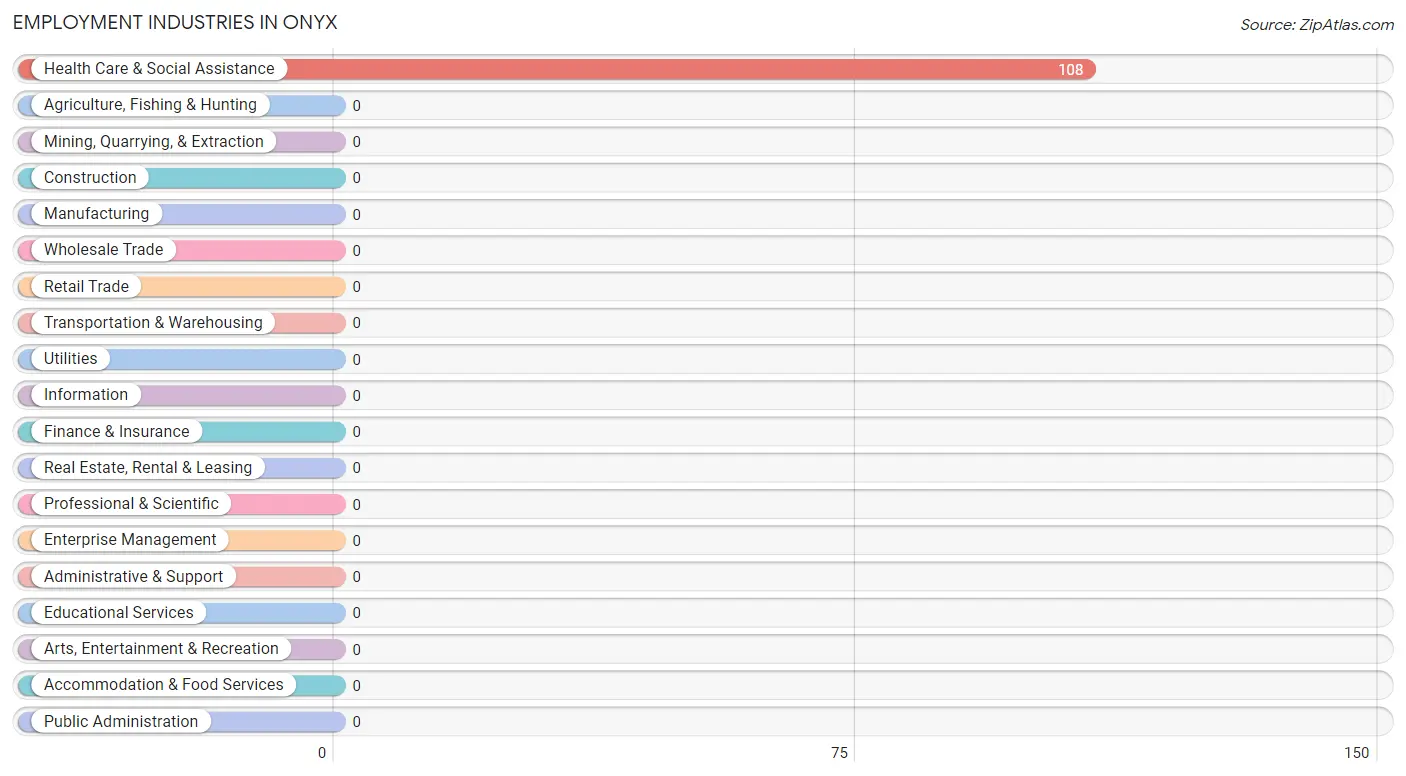
Employment Industries by Sex in Onyx
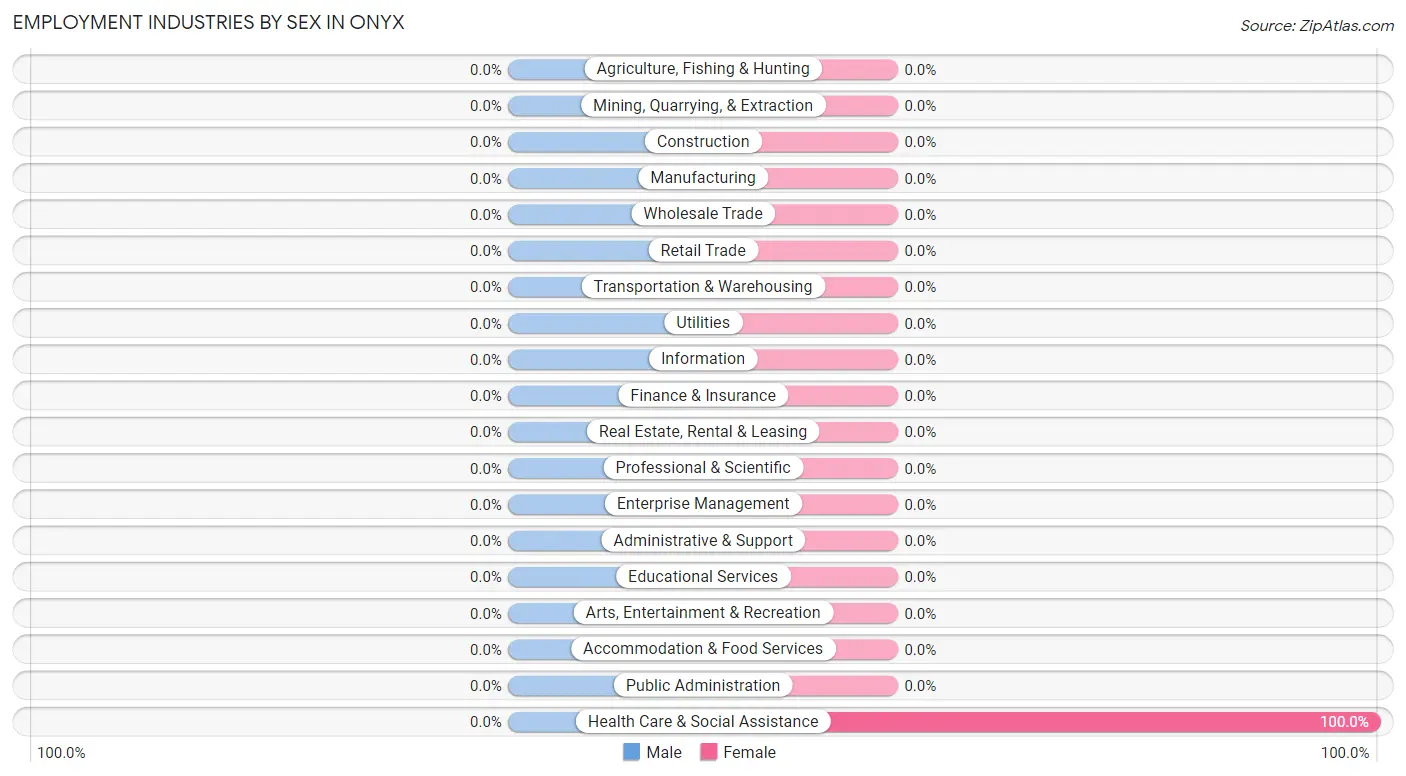
| Industry | Male | Female |
| Agriculture, Fishing & Hunting | 0 (0.0%) | 0 (0.0%) |
| Mining, Quarrying, & Extraction | 0 (0.0%) | 0 (0.0%) |
| Construction | 0 (0.0%) | 0 (0.0%) |
| Manufacturing | 0 (0.0%) | 0 (0.0%) |
| Wholesale Trade | 0 (0.0%) | 0 (0.0%) |
| Retail Trade | 0 (0.0%) | 0 (0.0%) |
| Transportation & Warehousing | 0 (0.0%) | 0 (0.0%) |
| Utilities | 0 (0.0%) | 0 (0.0%) |
| Information | 0 (0.0%) | 0 (0.0%) |
| Finance & Insurance | 0 (0.0%) | 0 (0.0%) |
| Real Estate, Rental & Leasing | 0 (0.0%) | 0 (0.0%) |
| Professional & Scientific | 0 (0.0%) | 0 (0.0%) |
| Enterprise Management | 0 (0.0%) | 0 (0.0%) |
| Administrative & Support | 0 (0.0%) | 0 (0.0%) |
| Educational Services | 0 (0.0%) | 0 (0.0%) |
| Health Care & Social Assistance | 0 (0.0%) | 108 (100.0%) |
| Arts, Entertainment & Recreation | 0 (0.0%) | 0 (0.0%) |
| Accommodation & Food Services | 0 (0.0%) | 0 (0.0%) |
| Public Administration | 0 (0.0%) | 0 (0.0%) |
| Total | 0 (0.0%) | 108 (100.0%) |
Education in Onyx
School Enrollment in Onyx
The most common levels of schooling among the 97 students in Onyx are high school (50 | 51.5%), and college / undergraduate (47 | 48.4%).
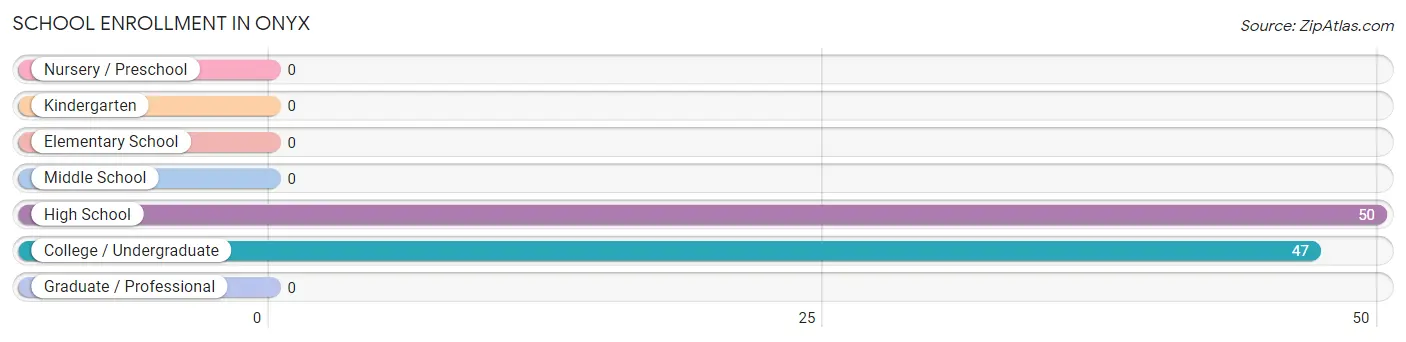
| School Level | # Students | % Students |
| Nursery / Preschool | 0 | 0.0% |
| Kindergarten | 0 | 0.0% |
| Elementary School | 0 | 0.0% |
| Middle School | 0 | 0.0% |
| High School | 50 | 51.5% |
| College / Undergraduate | 47 | 48.4% |
| Graduate / Professional | 0 | 0.0% |
| Total | 97 | 100.0% |
School Enrollment by Age by Funding Source in Onyx
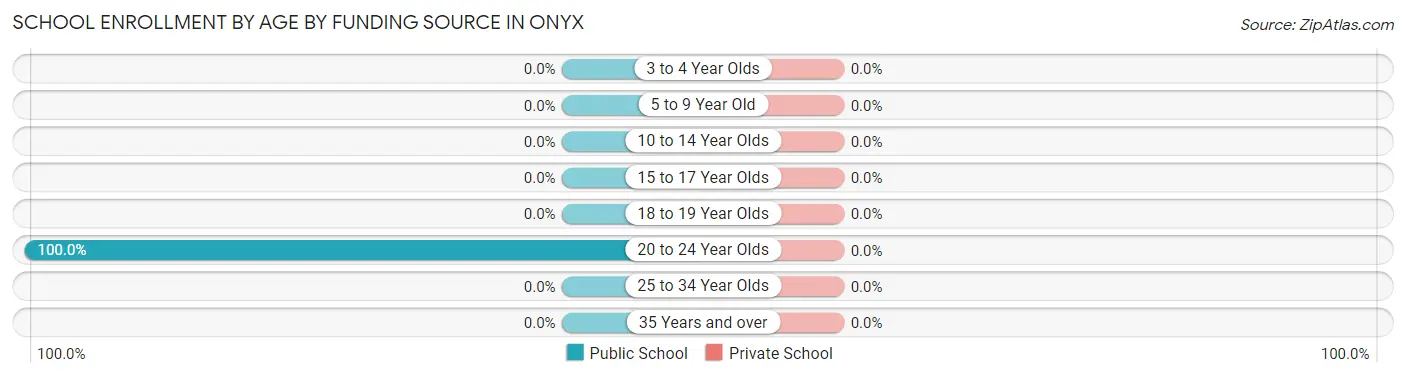
| Age Bracket | Public School | Private School |
| 3 to 4 Year Olds | 0 (0.0%) | 0 (0.0%) |
| 5 to 9 Year Old | 0 (0.0%) | 0 (0.0%) |
| 10 to 14 Year Olds | 0 (0.0%) | 0 (0.0%) |
| 15 to 17 Year Olds | 0 (0.0%) | 0 (0.0%) |
| 18 to 19 Year Olds | 0 (0.0%) | 0 (0.0%) |
| 20 to 24 Year Olds | 97 (100.0%) | 0 (0.0%) |
| 25 to 34 Year Olds | 0 (0.0%) | 0 (0.0%) |
| 35 Years and over | 0 (0.0%) | 0 (0.0%) |
| Total | 97 (100.0%) | 0 (0.0%) |
Educational Attainment by Field of Study in Onyx
, and business (64 | 100.0%) are the most common fields of study among 64 individuals in Onyx who have obtained a bachelor's degree or higher.
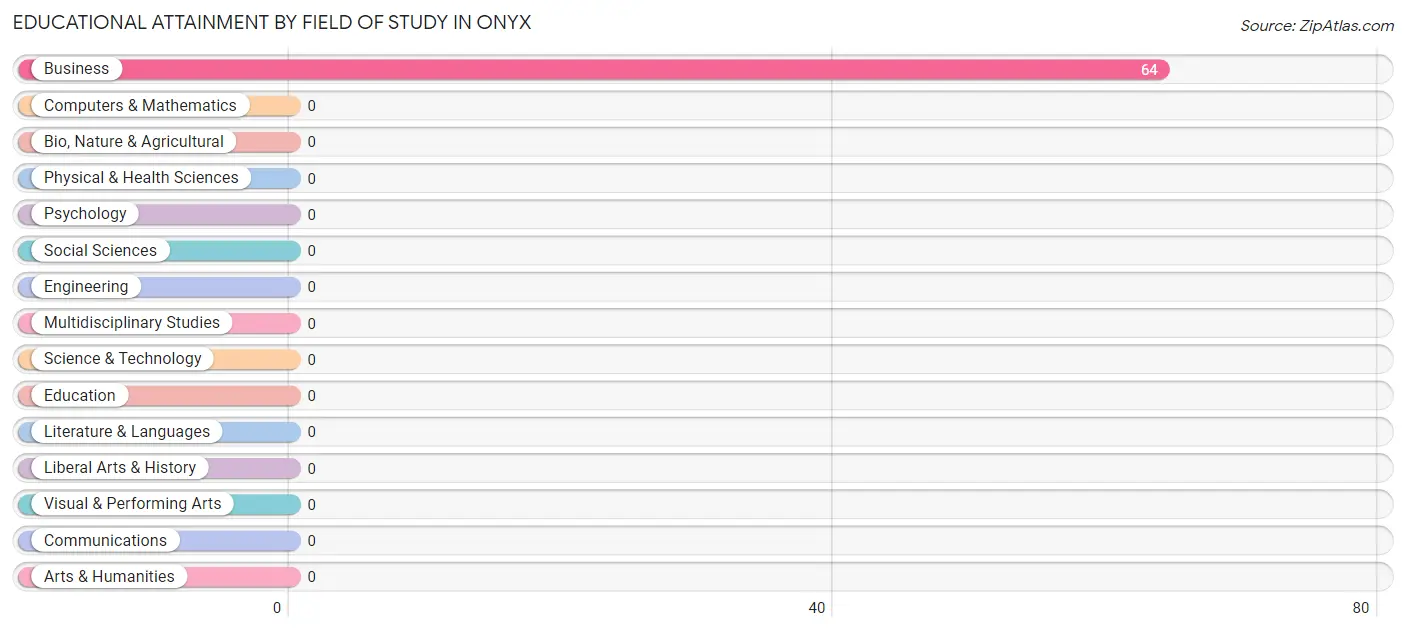
| Field of Study | # Graduates | % Graduates |
| Computers & Mathematics | 0 | 0.0% |
| Bio, Nature & Agricultural | 0 | 0.0% |
| Physical & Health Sciences | 0 | 0.0% |
| Psychology | 0 | 0.0% |
| Social Sciences | 0 | 0.0% |
| Engineering | 0 | 0.0% |
| Multidisciplinary Studies | 0 | 0.0% |
| Science & Technology | 0 | 0.0% |
| Business | 64 | 100.0% |
| Education | 0 | 0.0% |
| Literature & Languages | 0 | 0.0% |
| Liberal Arts & History | 0 | 0.0% |
| Visual & Performing Arts | 0 | 0.0% |
| Communications | 0 | 0.0% |
| Arts & Humanities | 0 | 0.0% |
| Total | 64 | 100.0% |
Transportation & Commute in Onyx
Vehicle Availability by Sex in Onyx
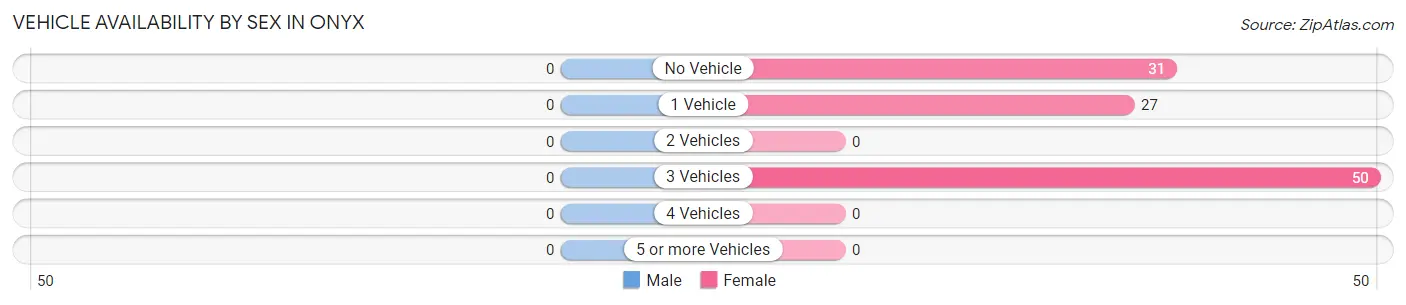
| Vehicles Available | Male | Female |
| No Vehicle | 0 (0.0%) | 31 (28.7%) |
| 1 Vehicle | 0 (0.0%) | 27 (25.0%) |
| 2 Vehicles | 0 (0.0%) | 0 (0.0%) |
| 3 Vehicles | 0 (0.0%) | 50 (46.3%) |
| 4 Vehicles | 0 (0.0%) | 0 (0.0%) |
| 5 or more Vehicles | 0 (0.0%) | 0 (0.0%) |
| Total | 0 (0.0%) | 108 (100.0%) |
Commute Time in Onyx
The most frequently occuring commute durations in Onyx are 15 to 19 minutes (50 commuters, 46.3%), 45 to 59 minutes (31 commuters, 28.7%), and 25 to 29 minutes (27 commuters, 25.0%).
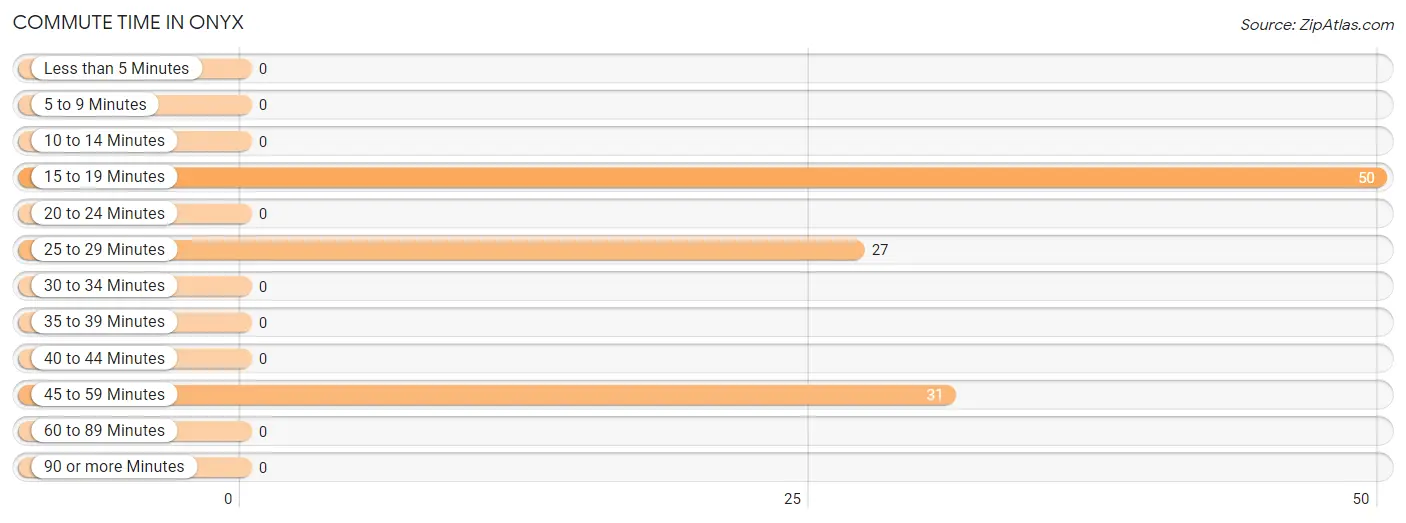
| Commute Time | # Commuters | % Commuters |
| Less than 5 Minutes | 0 | 0.0% |
| 5 to 9 Minutes | 0 | 0.0% |
| 10 to 14 Minutes | 0 | 0.0% |
| 15 to 19 Minutes | 50 | 46.3% |
| 20 to 24 Minutes | 0 | 0.0% |
| 25 to 29 Minutes | 27 | 25.0% |
| 30 to 34 Minutes | 0 | 0.0% |
| 35 to 39 Minutes | 0 | 0.0% |
| 40 to 44 Minutes | 0 | 0.0% |
| 45 to 59 Minutes | 31 | 28.7% |
| 60 to 89 Minutes | 0 | 0.0% |
| 90 or more Minutes | 0 | 0.0% |
Commute Time by Sex in Onyx
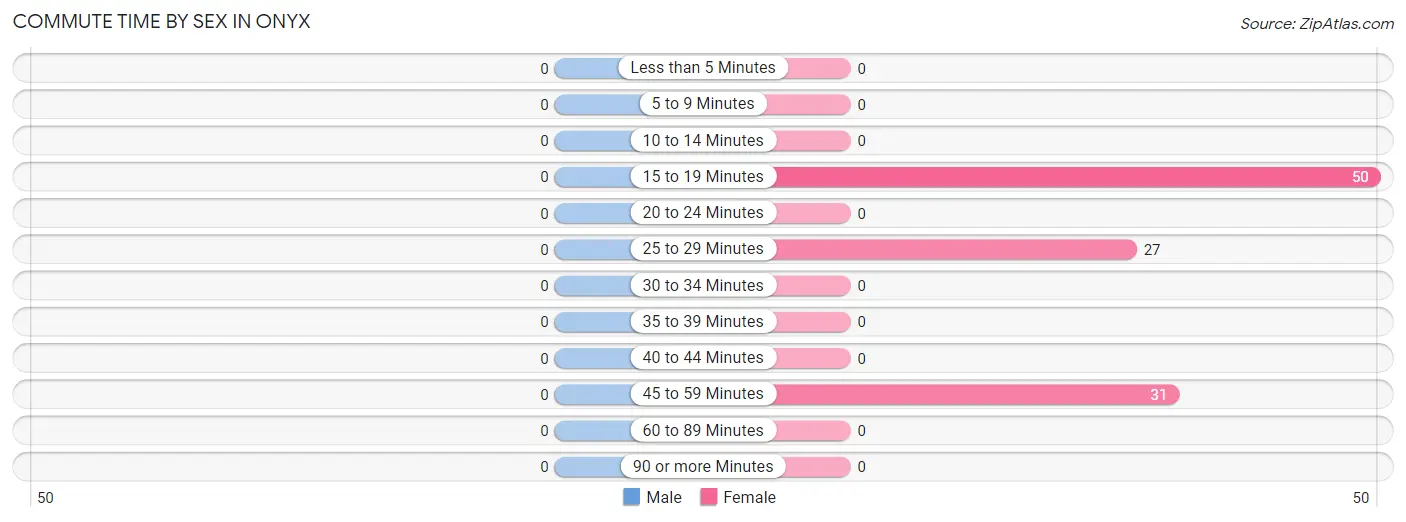
| Commute Time | Male | Female |
| Less than 5 Minutes | 0 (0.0%) | 0 (0.0%) |
| 5 to 9 Minutes | 0 (0.0%) | 0 (0.0%) |
| 10 to 14 Minutes | 0 (0.0%) | 0 (0.0%) |
| 15 to 19 Minutes | 0 (0.0%) | 50 (46.3%) |
| 20 to 24 Minutes | 0 (0.0%) | 0 (0.0%) |
| 25 to 29 Minutes | 0 (0.0%) | 27 (25.0%) |
| 30 to 34 Minutes | 0 (0.0%) | 0 (0.0%) |
| 35 to 39 Minutes | 0 (0.0%) | 0 (0.0%) |
| 40 to 44 Minutes | 0 (0.0%) | 0 (0.0%) |
| 45 to 59 Minutes | 0 (0.0%) | 31 (28.7%) |
| 60 to 89 Minutes | 0 (0.0%) | 0 (0.0%) |
| 90 or more Minutes | 0 (0.0%) | 0 (0.0%) |
Time of Departure to Work by Sex in Onyx
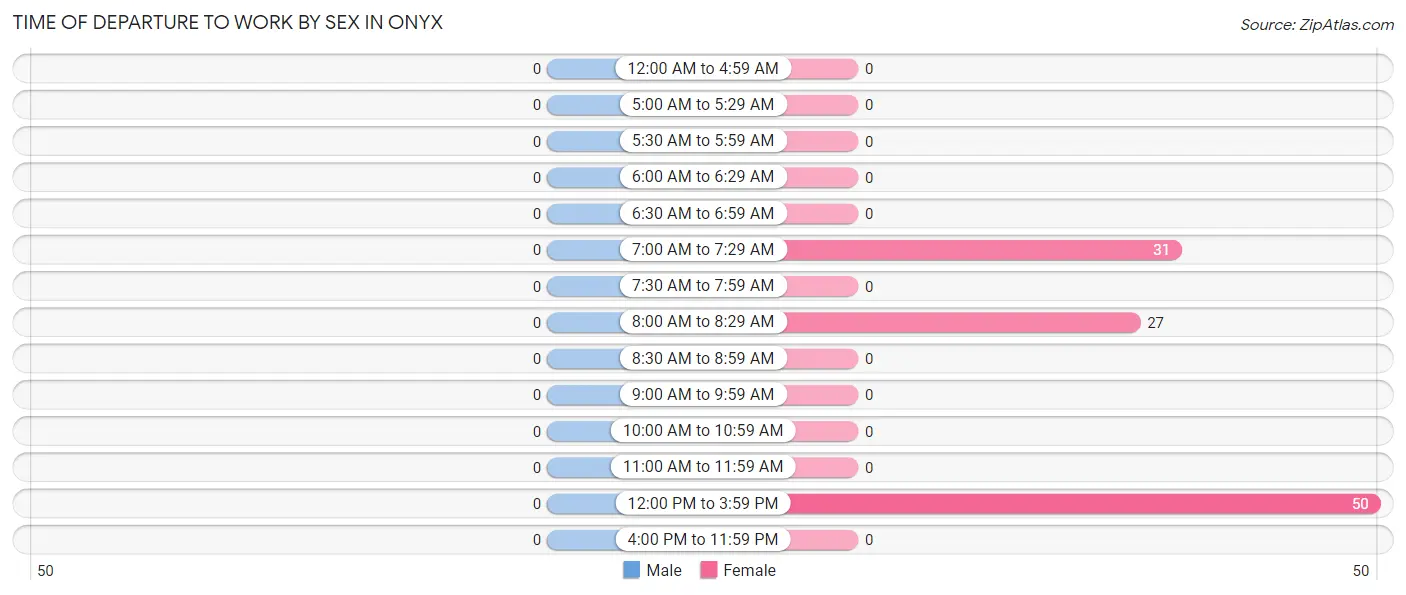
| Time of Departure | Male | Female |
| 12:00 AM to 4:59 AM | 0 (0.0%) | 0 (0.0%) |
| 5:00 AM to 5:29 AM | 0 (0.0%) | 0 (0.0%) |
| 5:30 AM to 5:59 AM | 0 (0.0%) | 0 (0.0%) |
| 6:00 AM to 6:29 AM | 0 (0.0%) | 0 (0.0%) |
| 6:30 AM to 6:59 AM | 0 (0.0%) | 0 (0.0%) |
| 7:00 AM to 7:29 AM | 0 (0.0%) | 31 (28.7%) |
| 7:30 AM to 7:59 AM | 0 (0.0%) | 0 (0.0%) |
| 8:00 AM to 8:29 AM | 0 (0.0%) | 27 (25.0%) |
| 8:30 AM to 8:59 AM | 0 (0.0%) | 0 (0.0%) |
| 9:00 AM to 9:59 AM | 0 (0.0%) | 0 (0.0%) |
| 10:00 AM to 10:59 AM | 0 (0.0%) | 0 (0.0%) |
| 11:00 AM to 11:59 AM | 0 (0.0%) | 0 (0.0%) |
| 12:00 PM to 3:59 PM | 0 (0.0%) | 50 (46.3%) |
| 4:00 PM to 11:59 PM | 0 (0.0%) | 0 (0.0%) |
| Total | 0 (0.0%) | 108 (100.0%) |
Housing Occupancy in Onyx
Occupancy by Ownership in Onyx
Of the total 307 dwellings in Onyx, owner-occupied units account for 260 (84.7%), while renter-occupied units make up 47 (15.3%).
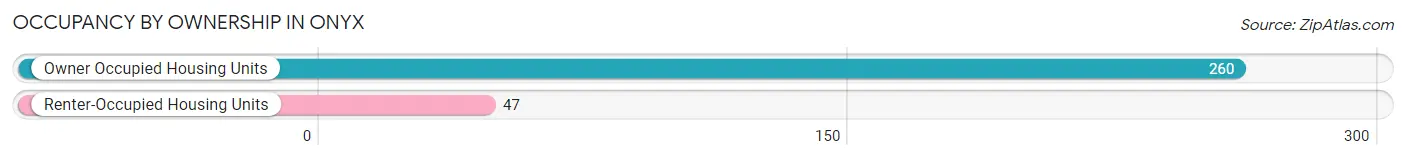
| Occupancy | # Housing Units | % Housing Units |
| Owner Occupied Housing Units | 260 | 84.7% |
| Renter-Occupied Housing Units | 47 | 15.3% |
| Total Occupied Housing Units | 307 | 100.0% |
Occupancy by Household Size in Onyx
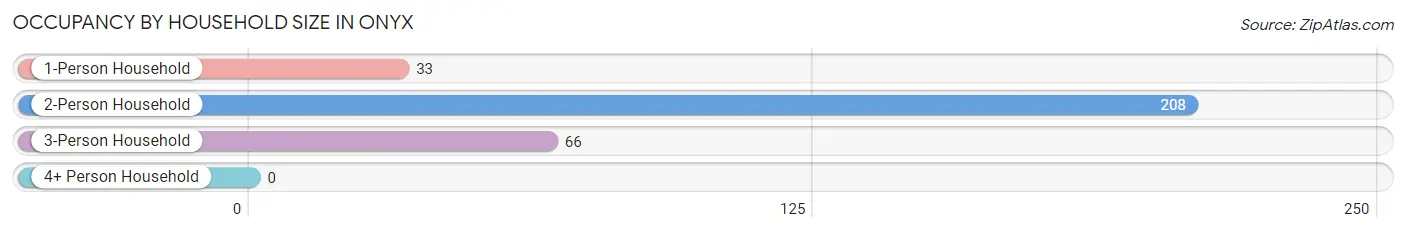
| Household Size | # Housing Units | % Housing Units |
| 1-Person Household | 33 | 10.7% |
| 2-Person Household | 208 | 67.7% |
| 3-Person Household | 66 | 21.5% |
| 4+ Person Household | 0 | 0.0% |
| Total Housing Units | 307 | 100.0% |
Occupancy by Ownership by Household Size in Onyx
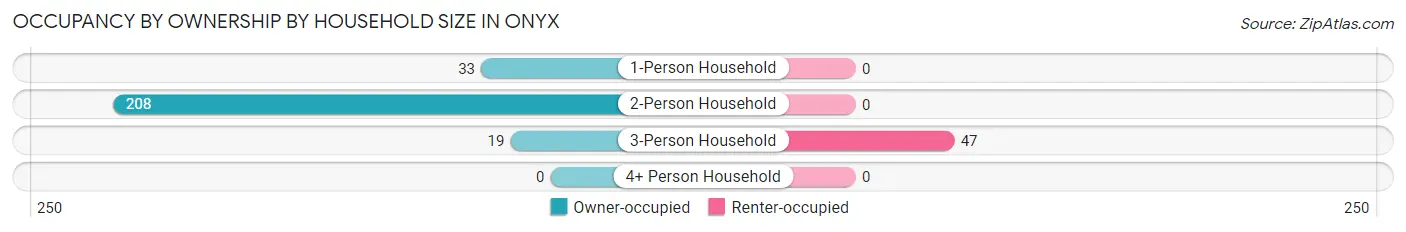
| Household Size | Owner-occupied | Renter-occupied |
| 1-Person Household | 33 (100.0%) | 0 (0.0%) |
| 2-Person Household | 208 (100.0%) | 0 (0.0%) |
| 3-Person Household | 19 (28.8%) | 47 (71.2%) |
| 4+ Person Household | 0 (0.0%) | 0 (0.0%) |
| Total Housing Units | 260 (84.7%) | 47 (15.3%) |
Occupancy by Educational Attainment in Onyx
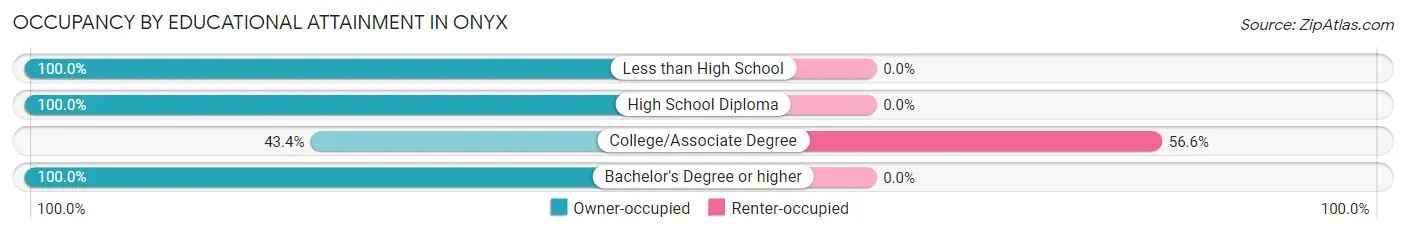
| Household Size | Owner-occupied | Renter-occupied |
| Less than High School | 65 (100.0%) | 0 (0.0%) |
| High School Diploma | 95 (100.0%) | 0 (0.0%) |
| College/Associate Degree | 36 (43.4%) | 47 (56.6%) |
| Bachelor's Degree or higher | 64 (100.0%) | 0 (0.0%) |
Occupancy by Age of Householder in Onyx
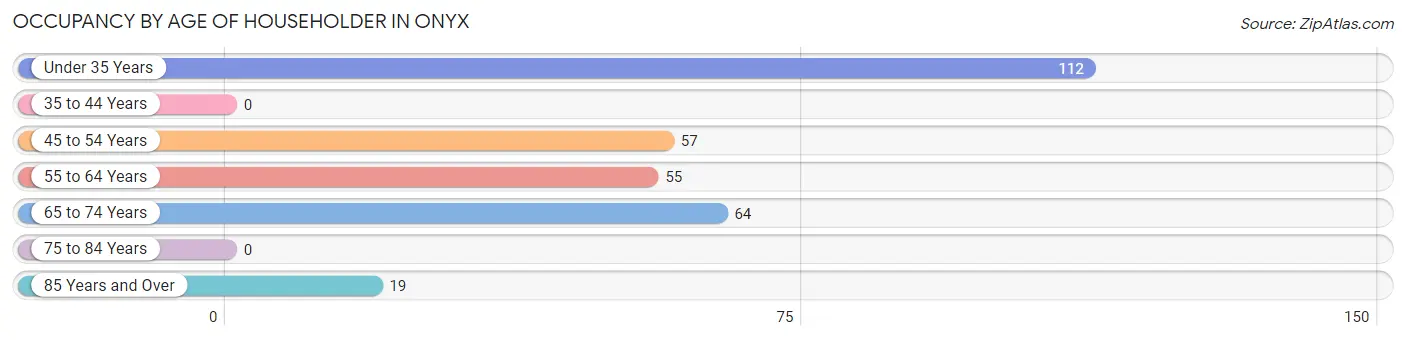
| Age Bracket | # Households | % Households |
| Under 35 Years | 112 | 36.5% |
| 35 to 44 Years | 0 | 0.0% |
| 45 to 54 Years | 57 | 18.6% |
| 55 to 64 Years | 55 | 17.9% |
| 65 to 74 Years | 64 | 20.8% |
| 75 to 84 Years | 0 | 0.0% |
| 85 Years and Over | 19 | 6.2% |
| Total | 307 | 100.0% |
Housing Finances in Onyx
Median Income by Occupancy in Onyx
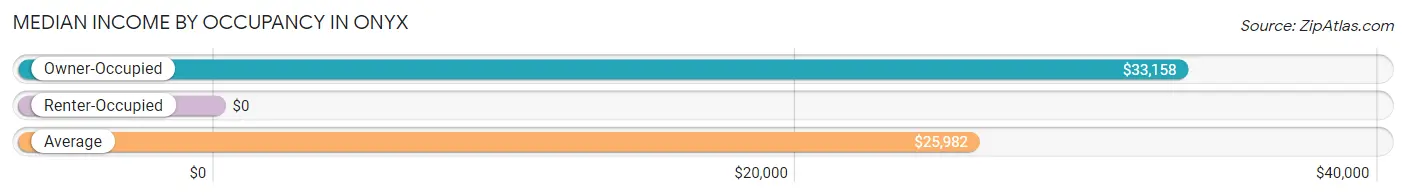
| Occupancy Type | # Households | Median Income |
| Owner-Occupied | 260 (84.7%) | $33,158 |
| Renter-Occupied | 47 (15.3%) | $0 |
| Average | 307 (100.0%) | $25,982 |
Occupancy by Householder Income Bracket in Onyx
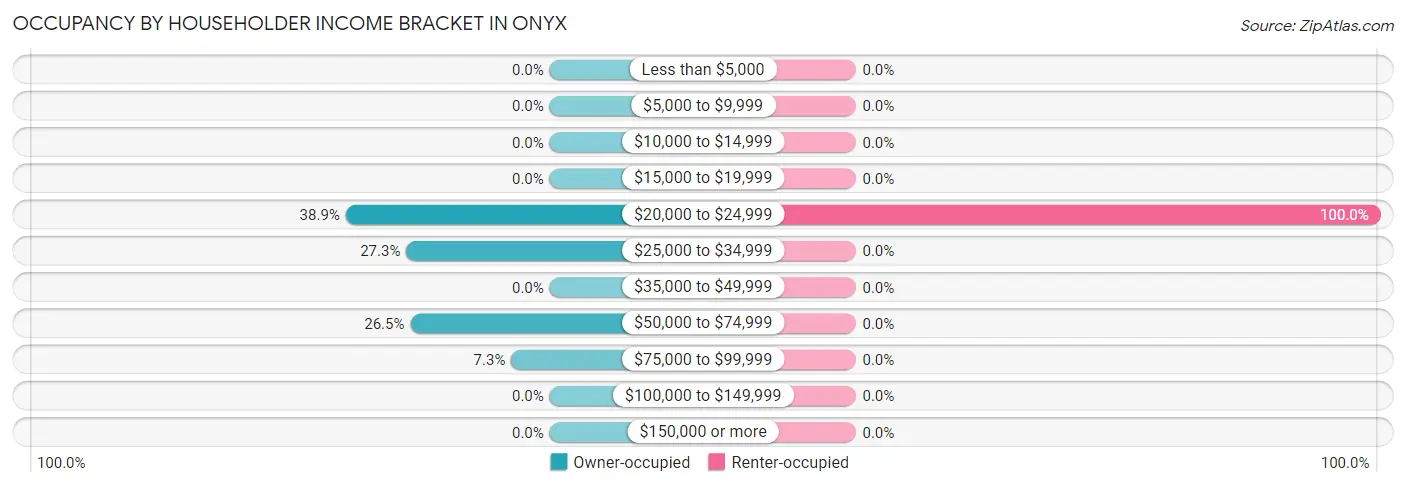
| Income Bracket | Owner-occupied | Renter-occupied |
| Less than $5,000 | 0 (0.0%) | 0 (0.0%) |
| $5,000 to $9,999 | 0 (0.0%) | 0 (0.0%) |
| $10,000 to $14,999 | 0 (0.0%) | 0 (0.0%) |
| $15,000 to $19,999 | 0 (0.0%) | 0 (0.0%) |
| $20,000 to $24,999 | 101 (38.9%) | 47 (100.0%) |
| $25,000 to $34,999 | 71 (27.3%) | 0 (0.0%) |
| $35,000 to $49,999 | 0 (0.0%) | 0 (0.0%) |
| $50,000 to $74,999 | 69 (26.5%) | 0 (0.0%) |
| $75,000 to $99,999 | 19 (7.3%) | 0 (0.0%) |
| $100,000 to $149,999 | 0 (0.0%) | 0 (0.0%) |
| $150,000 or more | 0 (0.0%) | 0 (0.0%) |
| Total | 260 (100.0%) | 47 (100.0%) |
Monthly Housing Cost Tiers in Onyx
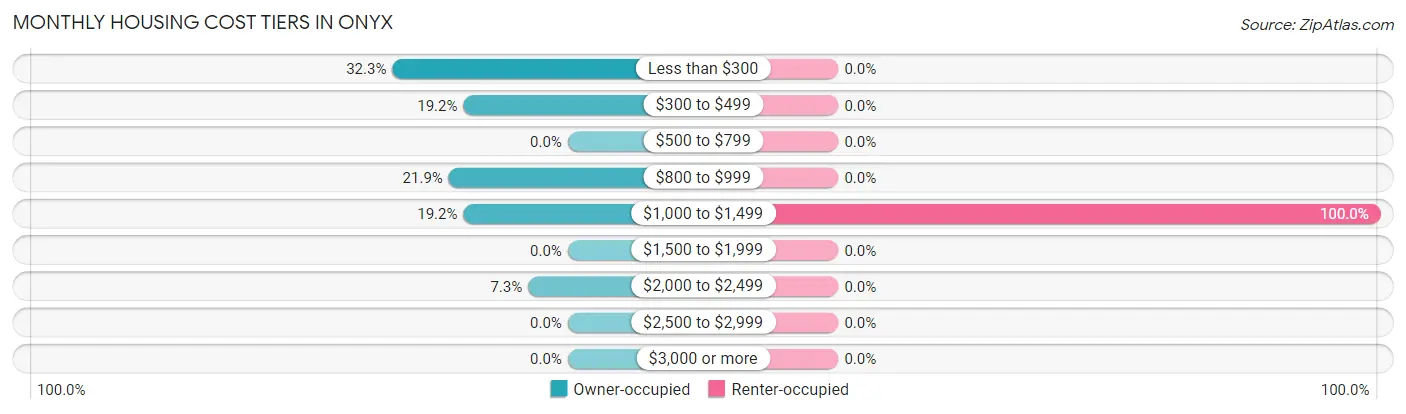
| Monthly Cost | Owner-occupied | Renter-occupied |
| Less than $300 | 84 (32.3%) | 0 (0.0%) |
| $300 to $499 | 50 (19.2%) | 0 (0.0%) |
| $500 to $799 | 0 (0.0%) | 0 (0.0%) |
| $800 to $999 | 57 (21.9%) | 0 (0.0%) |
| $1,000 to $1,499 | 50 (19.2%) | 47 (100.0%) |
| $1,500 to $1,999 | 0 (0.0%) | 0 (0.0%) |
| $2,000 to $2,499 | 19 (7.3%) | 0 (0.0%) |
| $2,500 to $2,999 | 0 (0.0%) | 0 (0.0%) |
| $3,000 or more | 0 (0.0%) | 0 (0.0%) |
| Total | 260 (100.0%) | 47 (100.0%) |
Physical Housing Characteristics in Onyx
Housing Structures in Onyx
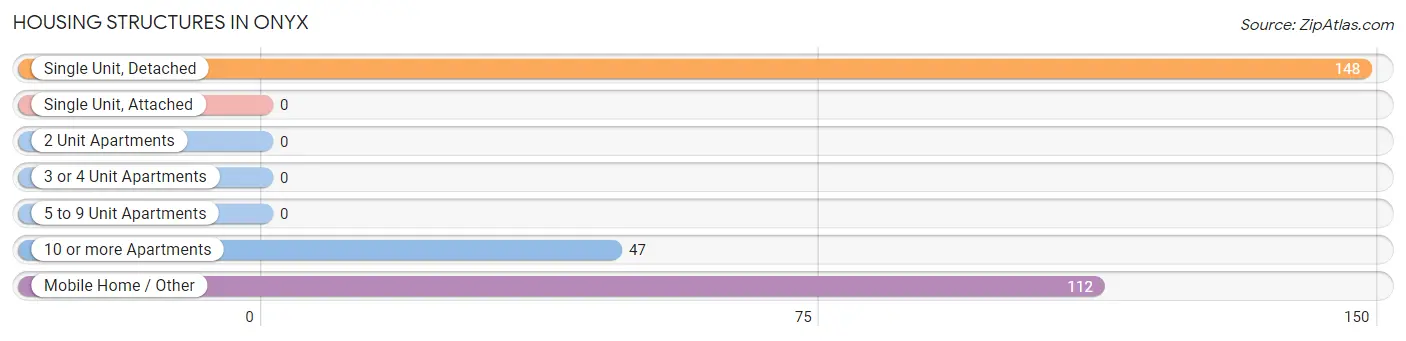
| Structure Type | # Housing Units | % Housing Units |
| Single Unit, Detached | 148 | 48.2% |
| Single Unit, Attached | 0 | 0.0% |
| 2 Unit Apartments | 0 | 0.0% |
| 3 or 4 Unit Apartments | 0 | 0.0% |
| 5 to 9 Unit Apartments | 0 | 0.0% |
| 10 or more Apartments | 47 | 15.3% |
| Mobile Home / Other | 112 | 36.5% |
| Total | 307 | 100.0% |
Housing Structures by Occupancy in Onyx
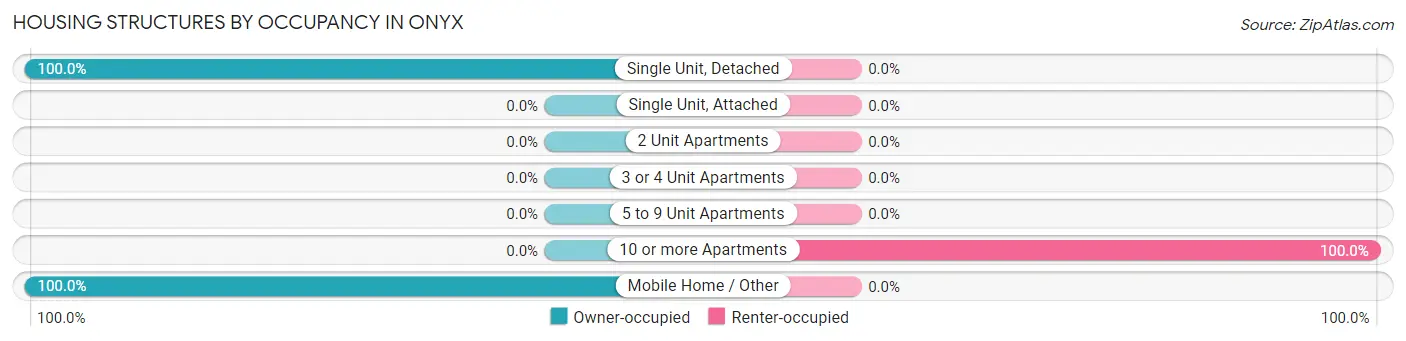
| Structure Type | Owner-occupied | Renter-occupied |
| Single Unit, Detached | 148 (100.0%) | 0 (0.0%) |
| Single Unit, Attached | 0 (0.0%) | 0 (0.0%) |
| 2 Unit Apartments | 0 (0.0%) | 0 (0.0%) |
| 3 or 4 Unit Apartments | 0 (0.0%) | 0 (0.0%) |
| 5 to 9 Unit Apartments | 0 (0.0%) | 0 (0.0%) |
| 10 or more Apartments | 0 (0.0%) | 47 (100.0%) |
| Mobile Home / Other | 112 (100.0%) | 0 (0.0%) |
| Total | 260 (84.7%) | 47 (15.3%) |
Housing Structures by Number of Rooms in Onyx
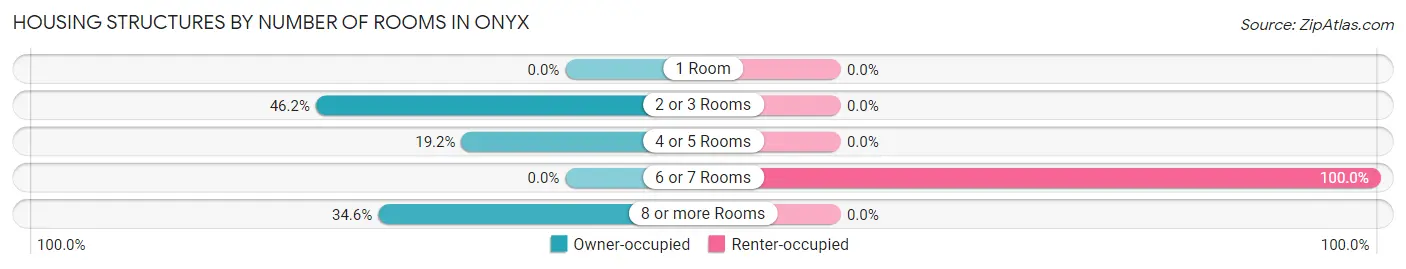
| Number of Rooms | Owner-occupied | Renter-occupied |
| 1 Room | 0 (0.0%) | 0 (0.0%) |
| 2 or 3 Rooms | 120 (46.2%) | 0 (0.0%) |
| 4 or 5 Rooms | 50 (19.2%) | 0 (0.0%) |
| 6 or 7 Rooms | 0 (0.0%) | 47 (100.0%) |
| 8 or more Rooms | 90 (34.6%) | 0 (0.0%) |
| Total | 260 (100.0%) | 47 (100.0%) |
Housing Structure by Heating Type in Onyx
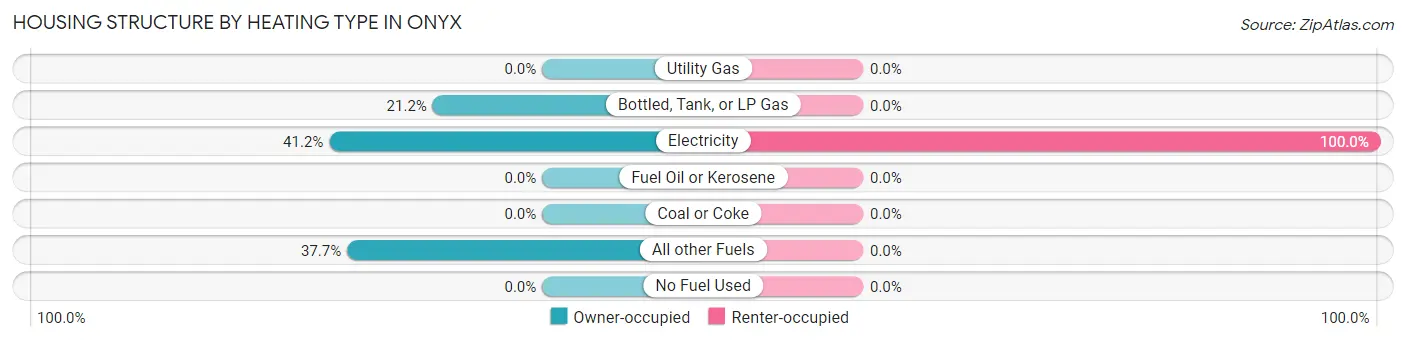
| Heating Type | Owner-occupied | Renter-occupied |
| Utility Gas | 0 (0.0%) | 0 (0.0%) |
| Bottled, Tank, or LP Gas | 55 (21.1%) | 0 (0.0%) |
| Electricity | 107 (41.1%) | 47 (100.0%) |
| Fuel Oil or Kerosene | 0 (0.0%) | 0 (0.0%) |
| Coal or Coke | 0 (0.0%) | 0 (0.0%) |
| All other Fuels | 98 (37.7%) | 0 (0.0%) |
| No Fuel Used | 0 (0.0%) | 0 (0.0%) |
| Total | 260 (100.0%) | 47 (100.0%) |
Household Vehicle Usage in Onyx
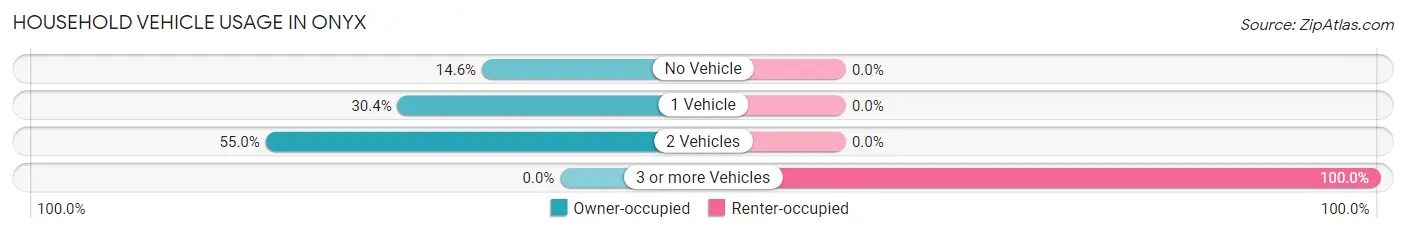
| Vehicles per Household | Owner-occupied | Renter-occupied |
| No Vehicle | 38 (14.6%) | 0 (0.0%) |
| 1 Vehicle | 79 (30.4%) | 0 (0.0%) |
| 2 Vehicles | 143 (55.0%) | 0 (0.0%) |
| 3 or more Vehicles | 0 (0.0%) | 47 (100.0%) |
| Total | 260 (100.0%) | 47 (100.0%) |
Real Estate & Mortgages in Onyx
Real Estate and Mortgage Overview in Onyx
| Characteristic | Without Mortgage | With Mortgage |
| Housing Units | 210 | 50 |
| Median Property Value | - | - |
| Median Household Income | $25,714 | $0 |
| Monthly Housing Costs | - | - |
| Real Estate Taxes | $529 | $0 |
Property Value by Mortgage Status in Onyx
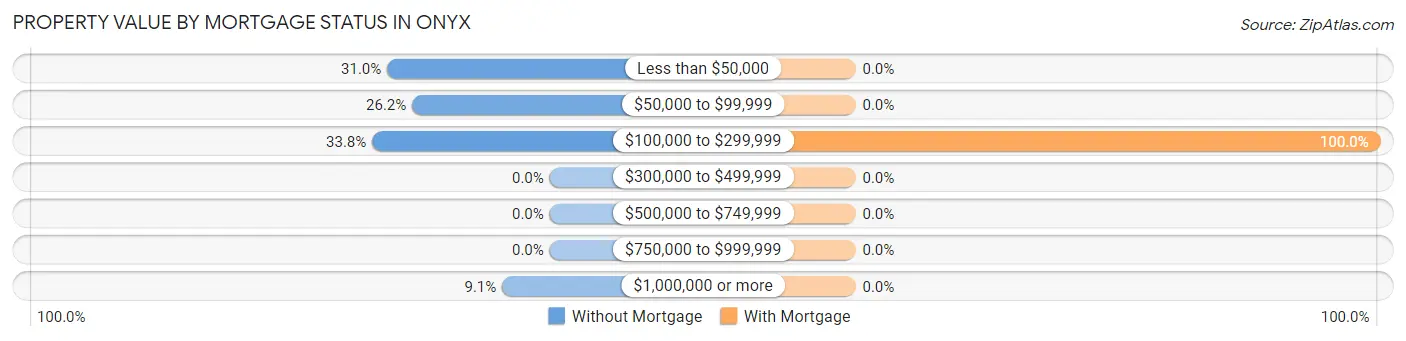
| Property Value | Without Mortgage | With Mortgage |
| Less than $50,000 | 65 (30.9%) | 0 (0.0%) |
| $50,000 to $99,999 | 55 (26.2%) | 0 (0.0%) |
| $100,000 to $299,999 | 71 (33.8%) | 50 (100.0%) |
| $300,000 to $499,999 | 0 (0.0%) | 0 (0.0%) |
| $500,000 to $749,999 | 0 (0.0%) | 0 (0.0%) |
| $750,000 to $999,999 | 0 (0.0%) | 0 (0.0%) |
| $1,000,000 or more | 19 (9.0%) | 0 (0.0%) |
| Total | 210 (100.0%) | 50 (100.0%) |
Household Income by Mortgage Status in Onyx
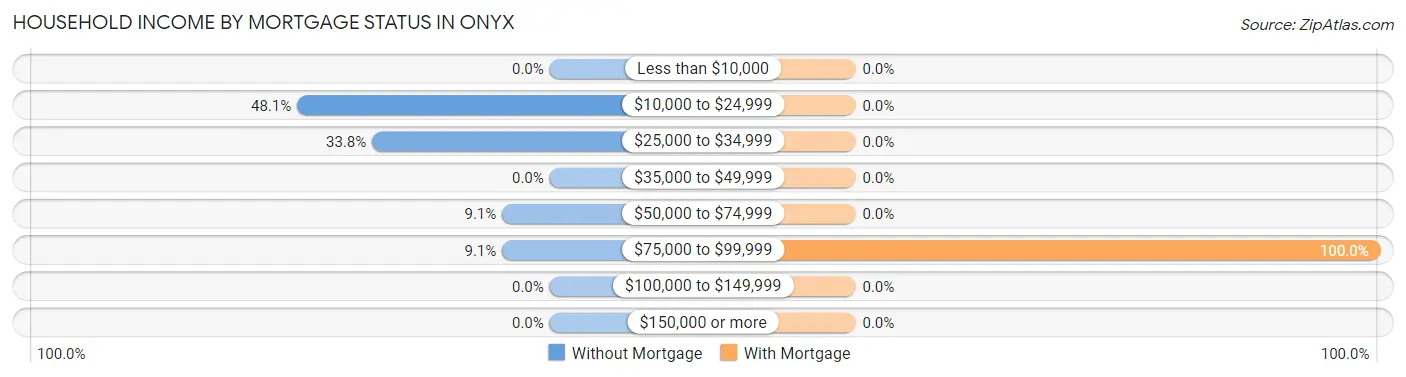
| Household Income | Without Mortgage | With Mortgage |
| Less than $10,000 | 0 (0.0%) | 0 (0.0%) |
| $10,000 to $24,999 | 101 (48.1%) | 0 (0.0%) |
| $25,000 to $34,999 | 71 (33.8%) | 0 (0.0%) |
| $35,000 to $49,999 | 0 (0.0%) | 0 (0.0%) |
| $50,000 to $74,999 | 19 (9.0%) | 0 (0.0%) |
| $75,000 to $99,999 | 19 (9.0%) | 50 (100.0%) |
| $100,000 to $149,999 | 0 (0.0%) | 0 (0.0%) |
| $150,000 or more | 0 (0.0%) | 0 (0.0%) |
| Total | 210 (100.0%) | 50 (100.0%) |
Property Value to Household Income Ratio in Onyx
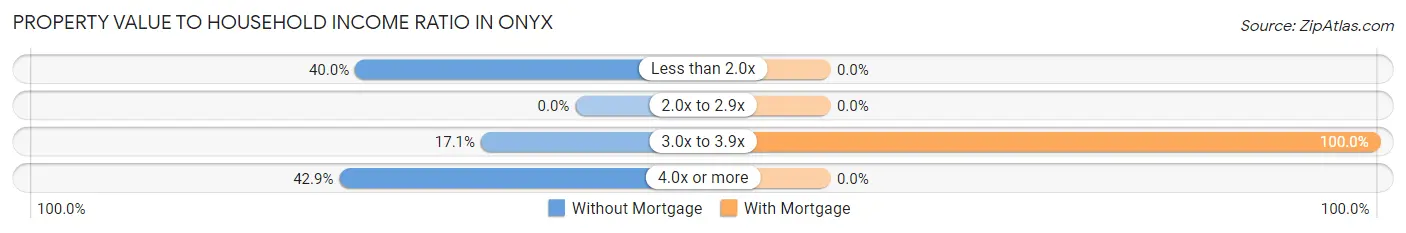
| Value-to-Income Ratio | Without Mortgage | With Mortgage |
| Less than 2.0x | 84 (40.0%) | 0 (0.0%) |
| 2.0x to 2.9x | 0 (0.0%) | 0 (0.0%) |
| 3.0x to 3.9x | 36 (17.1%) | 50 (100.0%) |
| 4.0x or more | 90 (42.9%) | 0 (0.0%) |
| Total | 210 (100.0%) | 50 (100.0%) |
Real Estate Taxes by Mortgage Status in Onyx
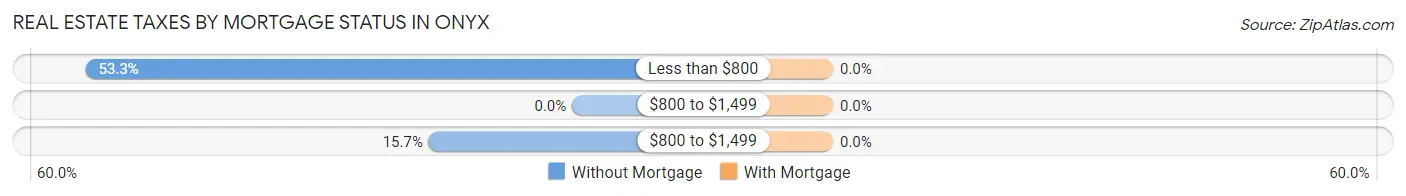
| Property Taxes | Without Mortgage | With Mortgage |
| Less than $800 | 112 (53.3%) | 0 (0.0%) |
| $800 to $1,499 | 0 (0.0%) | 0 (0.0%) |
| $800 to $1,499 | 33 (15.7%) | 0 (0.0%) |
| Total | 210 (100.0%) | 50 (100.0%) |
Health & Disability in Onyx
Health Insurance Coverage by Age in Onyx
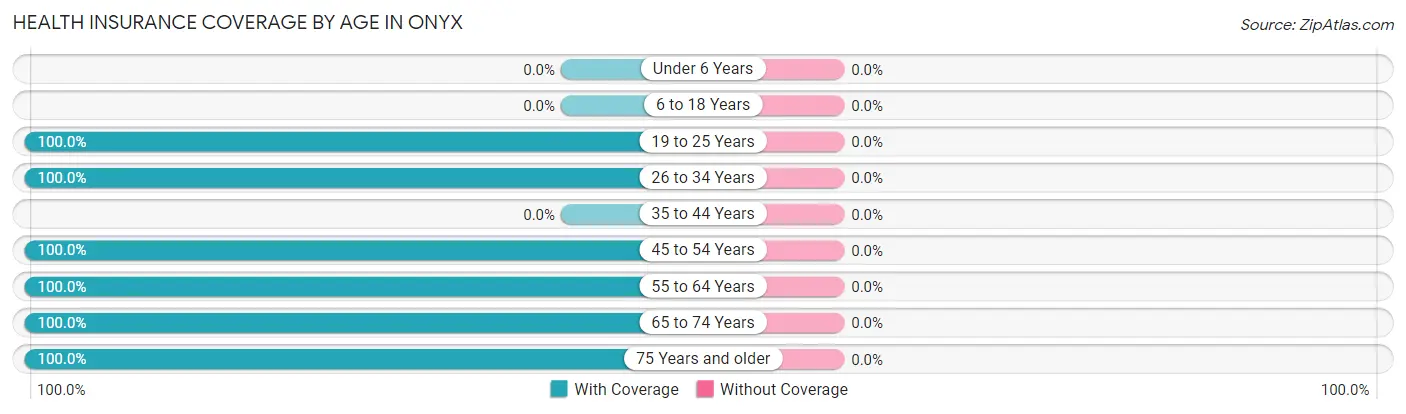
| Age Bracket | With Coverage | Without Coverage |
| Under 6 Years | 0 (0.0%) | 0 (0.0%) |
| 6 to 18 Years | 0 (0.0%) | 0 (0.0%) |
| 19 to 25 Years | 146 (100.0%) | 0 (0.0%) |
| 26 to 34 Years | 96 (100.0%) | 0 (0.0%) |
| 35 to 44 Years | 0 (0.0%) | 0 (0.0%) |
| 45 to 54 Years | 105 (100.0%) | 0 (0.0%) |
| 55 to 64 Years | 145 (100.0%) | 0 (0.0%) |
| 65 to 74 Years | 134 (100.0%) | 0 (0.0%) |
| 75 Years and older | 19 (100.0%) | 0 (0.0%) |
| Total | 645 (100.0%) | 0 (0.0%) |
Health Insurance Coverage by Citizenship Status in Onyx
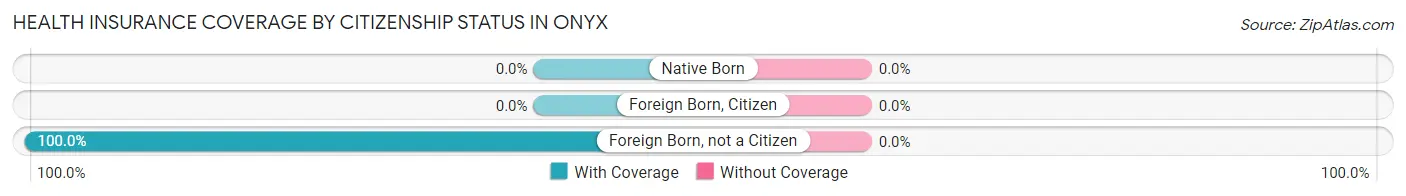
| Citizenship Status | With Coverage | Without Coverage |
| Native Born | 0 (0.0%) | 0 (0.0%) |
| Foreign Born, Citizen | 0 (0.0%) | 0 (0.0%) |
| Foreign Born, not a Citizen | 146 (100.0%) | 0 (0.0%) |
Health Insurance Coverage by Household Income in Onyx
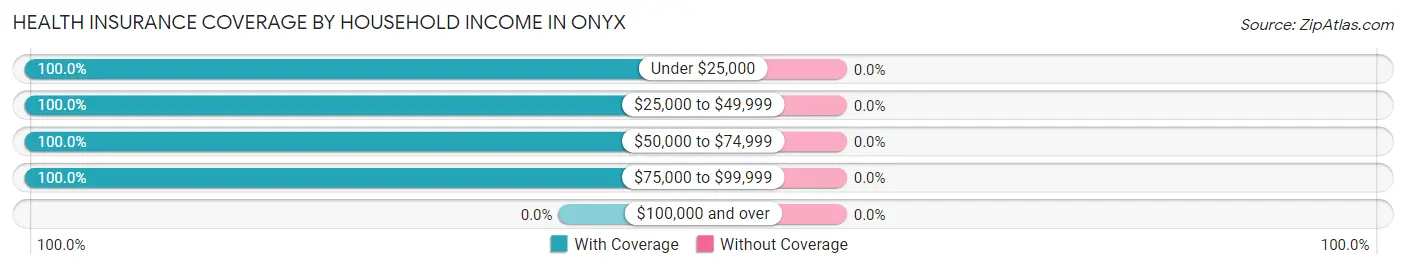
| Household Income | With Coverage | Without Coverage |
| Under $25,000 | 322 (100.0%) | 0 (0.0%) |
| $25,000 to $49,999 | 134 (100.0%) | 0 (0.0%) |
| $50,000 to $74,999 | 119 (100.0%) | 0 (0.0%) |
| $75,000 to $99,999 | 70 (100.0%) | 0 (0.0%) |
| $100,000 and over | 0 (0.0%) | 0 (0.0%) |
Public vs Private Health Insurance Coverage by Age in Onyx
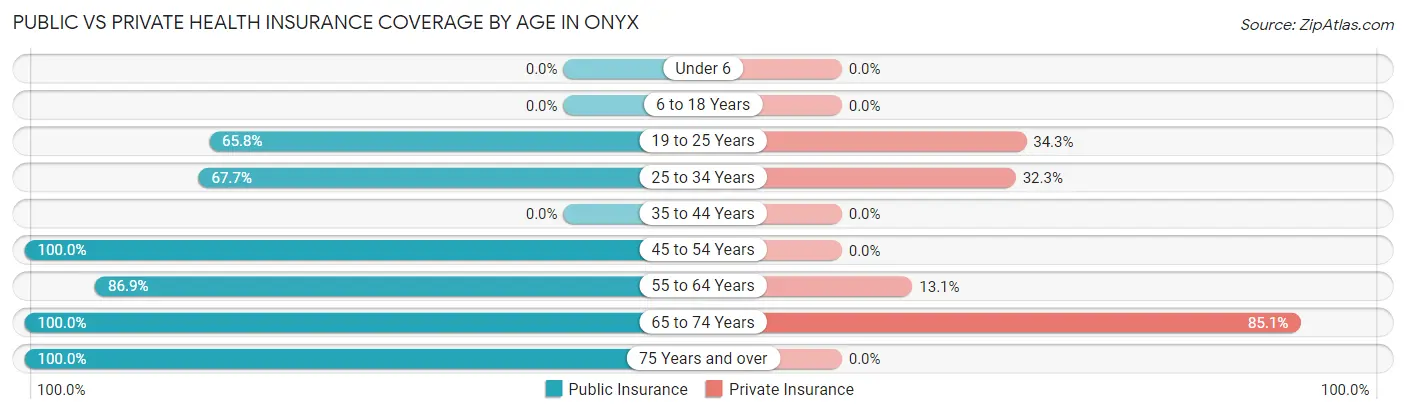
| Age Bracket | Public Insurance | Private Insurance |
| Under 6 | 0 (0.0%) | 0 (0.0%) |
| 6 to 18 Years | 0 (0.0%) | 0 (0.0%) |
| 19 to 25 Years | 96 (65.7%) | 50 (34.3%) |
| 25 to 34 Years | 65 (67.7%) | 31 (32.3%) |
| 35 to 44 Years | 0 (0.0%) | 0 (0.0%) |
| 45 to 54 Years | 105 (100.0%) | 0 (0.0%) |
| 55 to 64 Years | 126 (86.9%) | 19 (13.1%) |
| 65 to 74 Years | 134 (100.0%) | 114 (85.1%) |
| 75 Years and over | 19 (100.0%) | 0 (0.0%) |
| Total | 545 (84.5%) | 214 (33.2%) |
Disability Status by Sex by Age in Onyx
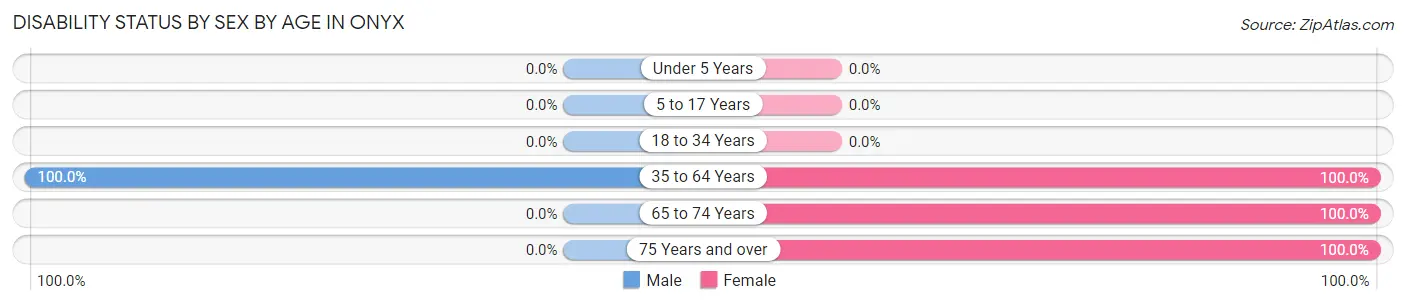
| Age Bracket | Male | Female |
| Under 5 Years | 0 (0.0%) | 0 (0.0%) |
| 5 to 17 Years | 0 (0.0%) | 0 (0.0%) |
| 18 to 34 Years | 0 (0.0%) | 0 (0.0%) |
| 35 to 64 Years | 147 (100.0%) | 103 (100.0%) |
| 65 to 74 Years | 0 (0.0%) | 50 (100.0%) |
| 75 Years and over | 0 (0.0%) | 19 (100.0%) |
Disability Class by Sex by Age in Onyx
Disability Class: Hearing Difficulty
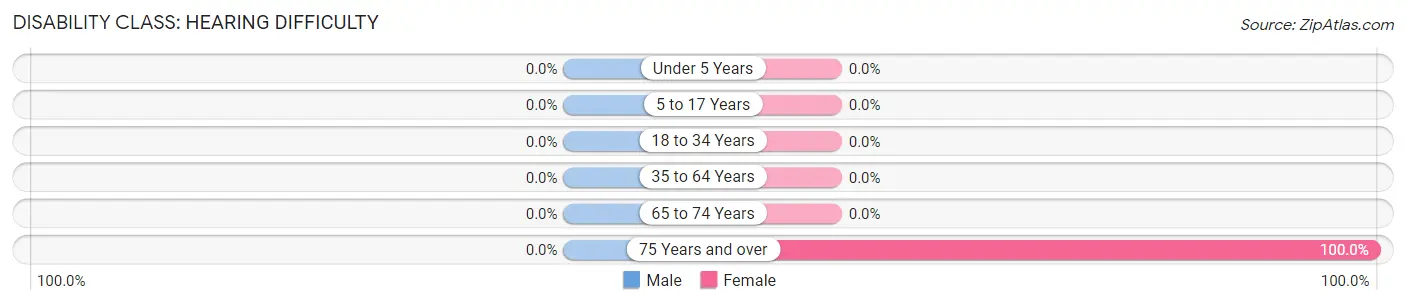
| Age Bracket | Male | Female |
| Under 5 Years | 0 (0.0%) | 0 (0.0%) |
| 5 to 17 Years | 0 (0.0%) | 0 (0.0%) |
| 18 to 34 Years | 0 (0.0%) | 0 (0.0%) |
| 35 to 64 Years | 0 (0.0%) | 0 (0.0%) |
| 65 to 74 Years | 0 (0.0%) | 0 (0.0%) |
| 75 Years and over | 0 (0.0%) | 19 (100.0%) |
Disability Class: Vision Difficulty
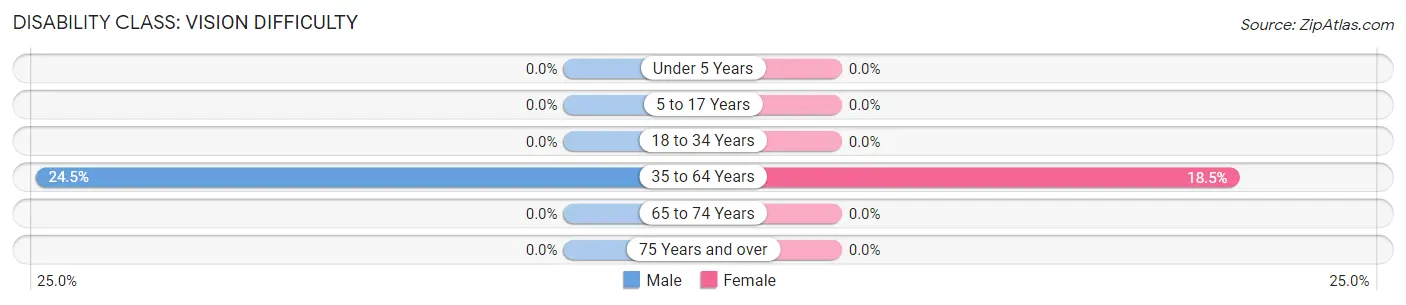
| Age Bracket | Male | Female |
| Under 5 Years | 0 (0.0%) | 0 (0.0%) |
| 5 to 17 Years | 0 (0.0%) | 0 (0.0%) |
| 18 to 34 Years | 0 (0.0%) | 0 (0.0%) |
| 35 to 64 Years | 36 (24.5%) | 19 (18.4%) |
| 65 to 74 Years | 0 (0.0%) | 0 (0.0%) |
| 75 Years and over | 0 (0.0%) | 0 (0.0%) |
Disability Class: Cognitive Difficulty
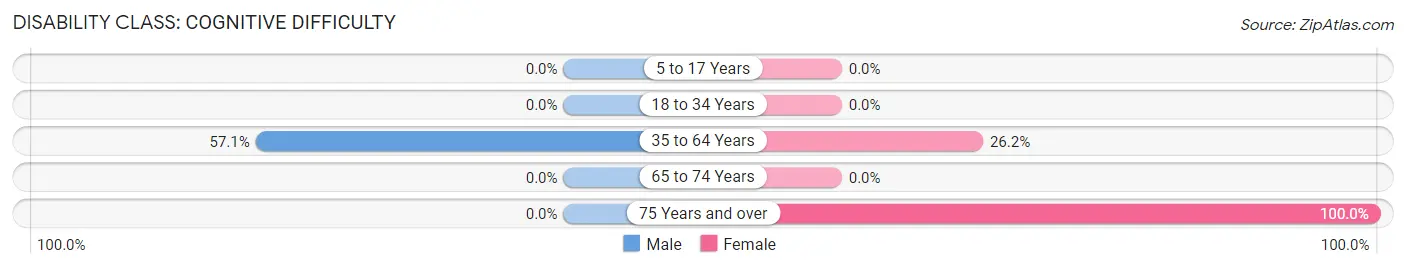
| Age Bracket | Male | Female |
| 5 to 17 Years | 0 (0.0%) | 0 (0.0%) |
| 18 to 34 Years | 0 (0.0%) | 0 (0.0%) |
| 35 to 64 Years | 84 (57.1%) | 27 (26.2%) |
| 65 to 74 Years | 0 (0.0%) | 0 (0.0%) |
| 75 Years and over | 0 (0.0%) | 19 (100.0%) |
Disability Class: Ambulatory Difficulty
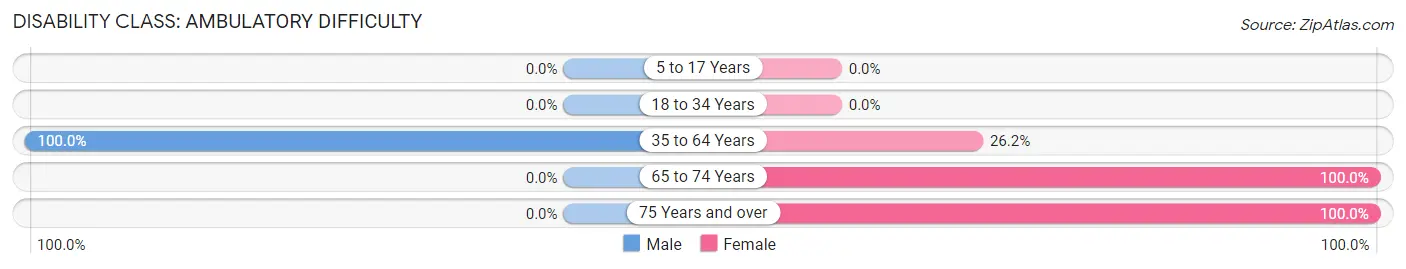
| Age Bracket | Male | Female |
| 5 to 17 Years | 0 (0.0%) | 0 (0.0%) |
| 18 to 34 Years | 0 (0.0%) | 0 (0.0%) |
| 35 to 64 Years | 147 (100.0%) | 27 (26.2%) |
| 65 to 74 Years | 0 (0.0%) | 50 (100.0%) |
| 75 Years and over | 0 (0.0%) | 19 (100.0%) |
Disability Class: Self-Care Difficulty
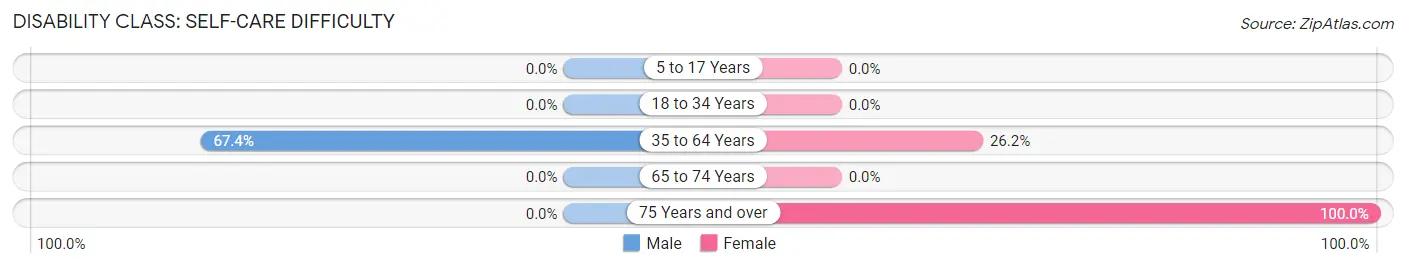
| Age Bracket | Male | Female |
| 5 to 17 Years | 0 (0.0%) | 0 (0.0%) |
| 18 to 34 Years | 0 (0.0%) | 0 (0.0%) |
| 35 to 64 Years | 99 (67.3%) | 27 (26.2%) |
| 65 to 74 Years | 0 (0.0%) | 0 (0.0%) |
| 75 Years and over | 0 (0.0%) | 19 (100.0%) |
Technology Access in Onyx
Computing Device Access in Onyx
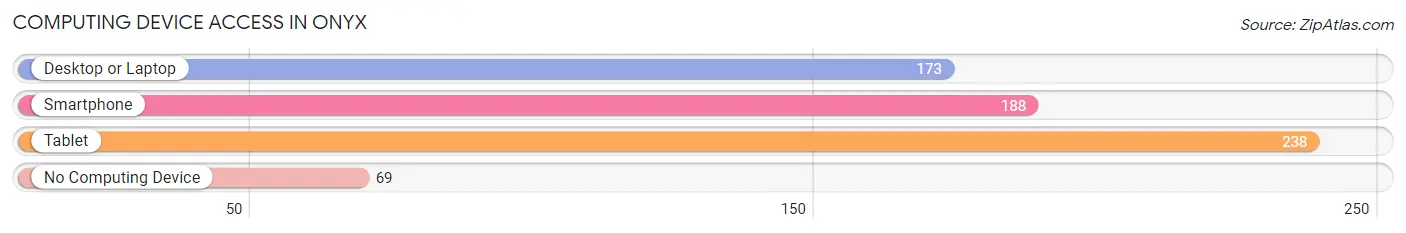
| Device Type | # Households | % Households |
| Desktop or Laptop | 173 | 56.4% |
| Smartphone | 188 | 61.2% |
| Tablet | 238 | 77.5% |
| No Computing Device | 69 | 22.5% |
| Total | 307 | 100.0% |
Internet Access in Onyx
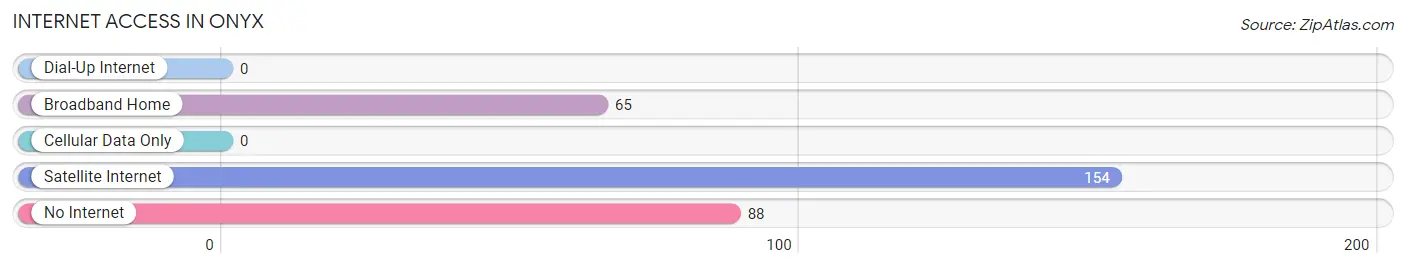
| Internet Type | # Households | % Households |
| Dial-Up Internet | 0 | 0.0% |
| Broadband Home | 65 | 21.2% |
| Cellular Data Only | 0 | 0.0% |
| Satellite Internet | 154 | 50.2% |
| No Internet | 88 | 28.7% |
| Total | 307 | 100.0% |
Onyx Summary
Onyx is a small unincorporated community located in Kern County, California. It is situated in the foothills of the Sierra Nevada Mountains, approximately 25 miles east of Bakersfield. The population of Onyx was estimated to be around 200 people in 2000.
History
Onyx was founded in 1876 by a group of settlers from the Midwest. The settlers were attracted to the area by the abundance of natural resources, including timber, water, and minerals. The town was named after the Onyx marble that was found in the area. The marble was used to build the first schoolhouse in Onyx.
In the early 1900s, Onyx was a thriving mining town. The town was home to several mines, including the Onyx Marble Mine, the Onyx Gold Mine, and the Onyx Copper Mine. The mines provided employment for many of the town’s residents.
In the 1920s, the town began to decline as the mines closed and the population decreased. The town was nearly abandoned by the 1940s. In the 1950s, the town was revitalized by the construction of a new highway, which connected Onyx to Bakersfield.
Geography
Onyx is located in the foothills of the Sierra Nevada Mountains, approximately 25 miles east of Bakersfield. The town is situated at an elevation of 2,400 feet. The climate in Onyx is semi-arid, with hot summers and mild winters.
The town is surrounded by rolling hills and mountains. The nearby Kern River provides a source of recreation for the town’s residents. The town is also home to several natural springs, which provide a source of fresh water.
Economy
The economy of Onyx is largely based on agriculture. The town is home to several farms, which produce a variety of crops, including alfalfa, cotton, and wheat. The town is also home to several small businesses, including a gas station, a grocery store, and a restaurant.
The town is also home to several mining operations, which produce a variety of minerals, including gold, silver, and copper. The town is also home to several oil and gas wells, which provide employment for many of the town’s residents.
Demographics
The population of Onyx was estimated to be around 200 people in 2000. The town is predominantly white, with a small Hispanic population. The median household income in Onyx is $30,000. The town has a high rate of poverty, with nearly 40% of the population living below the poverty line.
Onyx is a small, rural community with a rich history and a bright future. The town is home to a diverse population and a variety of businesses and industries. The town is a great place to live, work, and raise a family.
Common Questions
What is Per Capita Income in Onyx?
Per Capita income in Onyx is $17,406.
What is the Median Household income in Onyx?
Median Household Income in Onyx is $25,982.
What is Inequality or Gini Index in Onyx?
Inequality or Gini Index in Onyx is 0.26.
What is the Total Population of Onyx?
Total Population of Onyx is 645.
What is the Total Male Population of Onyx?
Total Male Population of Onyx is 296.
What is the Total Female Population of Onyx?
Total Female Population of Onyx is 349.
What is the Ratio of Males per 100 Females in Onyx?
There are 84.81 Males per 100 Females in Onyx.
What is the Ratio of Females per 100 Males in Onyx?
There are 117.91 Females per 100 Males in Onyx.
What is the Median Population Age in Onyx?
Median Population Age in Onyx is 54.6 Years.
What is the Average Family Size in Onyx
Average Family Size in Onyx is 1.9 People.
What is the Average Household Size in Onyx
Average Household Size in Onyx is 2.1 People.
How Large is the Labor Force in Onyx?
There are 173 People in the Labor Forcein in Onyx.
What is the Percentage of People in the Labor Force in Onyx?
26.8% of People are in the Labor Force in Onyx.
What is the Unemployment Rate in Onyx?
Unemployment Rate in Onyx is 37.6%.