Zip Codes with the Highest Percentage of Population Employed in Office & Administration in Los Angeles, CA
RELATED REPORTS & OPTIONS
Office & Administration
Los Angeles
Compare Zip Codes
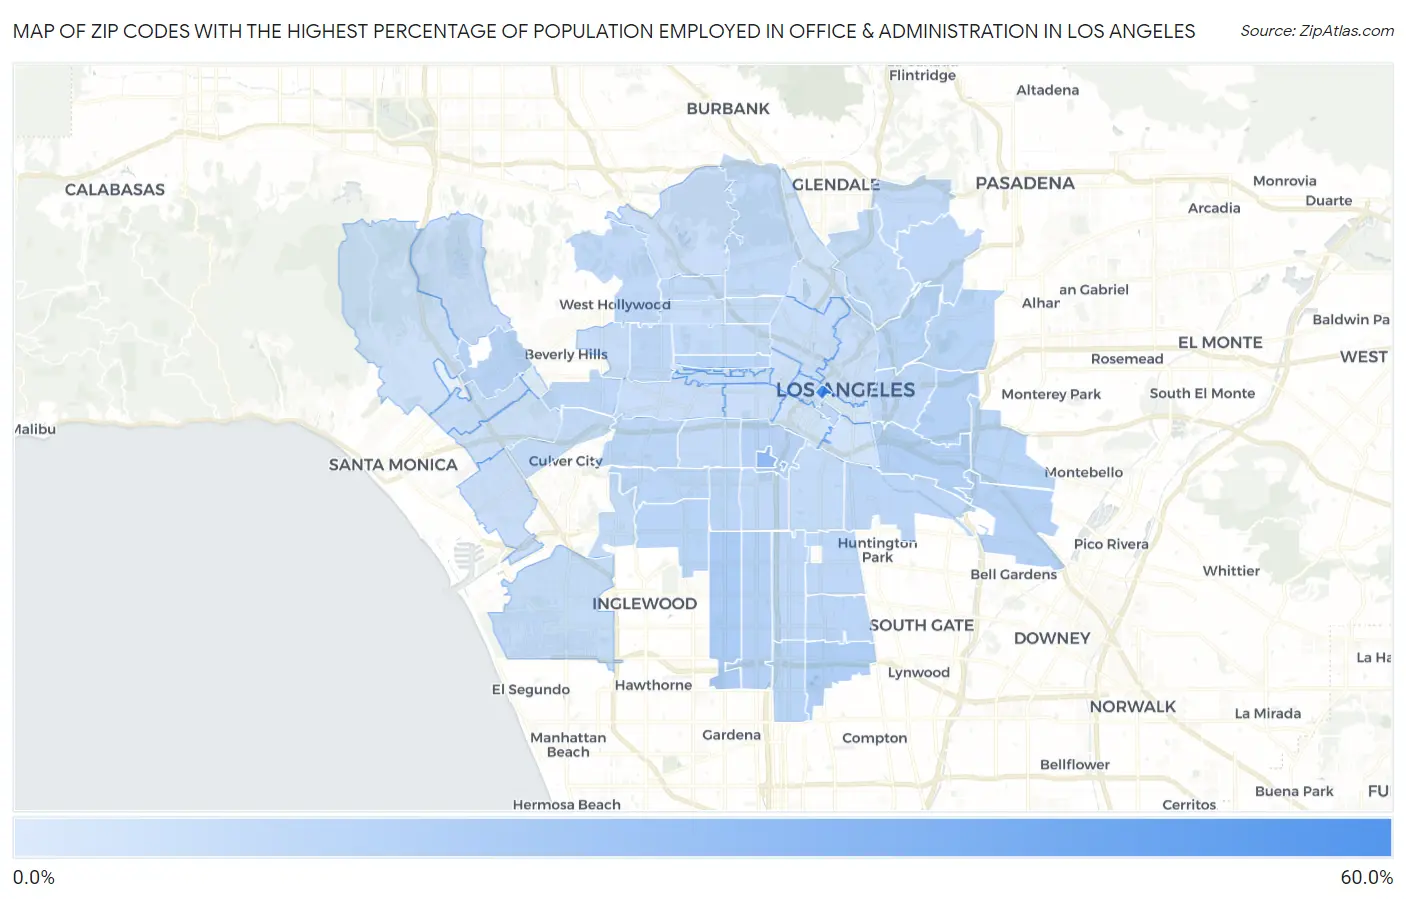
Map of Zip Codes with the Highest Percentage of Population Employed in Office & Administration in Los Angeles
2.4%
50.6%
Zip Codes with the Highest Percentage of Population Employed in Office & Administration in Los Angeles, CA
| Zip Code | % Employed | vs State | vs National | |
| 1. | 90071 | 50.6% | 10.5%(+40.1)#3 | 10.9%(+39.7)#124 |
| 2. | 90089 | 25.6% | 10.5%(+15.1)#31 | 10.9%(+14.7)#866 |
| 3. | 90047 | 15.9% | 10.5%(+5.40)#109 | 10.9%(+5.05)#3,638 |
| 4. | 90059 | 14.7% | 10.5%(+4.18)#170 | 10.9%(+3.83)#5,004 |
| 5. | 90023 | 14.0% | 10.5%(+3.50)#211 | 10.9%(+3.15)#6,011 |
| 6. | 90044 | 13.3% | 10.5%(+2.80)#278 | 10.9%(+2.44)#7,374 |
| 7. | 90040 | 13.3% | 10.5%(+2.79)#279 | 10.9%(+2.43)#7,398 |
| 8. | 90063 | 13.0% | 10.5%(+2.54)#308 | 10.9%(+2.18)#7,981 |
| 9. | 90024 | 12.8% | 10.5%(+2.32)#338 | 10.9%(+1.96)#8,497 |
| 10. | 90007 | 12.7% | 10.5%(+2.17)#363 | 10.9%(+1.82)#8,862 |
| 11. | 90022 | 12.1% | 10.5%(+1.64)#441 | 10.9%(+1.29)#10,297 |
| 12. | 90031 | 12.0% | 10.5%(+1.52)#457 | 10.9%(+1.17)#10,648 |
| 13. | 90061 | 12.0% | 10.5%(+1.46)#472 | 10.9%(+1.10)#10,864 |
| 14. | 90020 | 11.9% | 10.5%(+1.37)#494 | 10.9%(+1.02)#11,124 |
| 15. | 90032 | 11.8% | 10.5%(+1.29)#509 | 10.9%(+0.936)#11,363 |
| 16. | 90043 | 11.7% | 10.5%(+1.21)#518 | 10.9%(+0.862)#11,576 |
| 17. | 90002 | 11.6% | 10.5%(+1.07)#554 | 10.9%(+0.716)#12,034 |
| 18. | 90008 | 11.5% | 10.5%(+1.01)#565 | 10.9%(+0.656)#12,213 |
| 19. | 90016 | 11.3% | 10.5%(+0.769)#604 | 10.9%(+0.416)#12,969 |
| 20. | 90062 | 11.2% | 10.5%(+0.694)#622 | 10.9%(+0.342)#13,214 |
| 21. | 90058 | 11.2% | 10.5%(+0.658)#630 | 10.9%(+0.306)#13,326 |
| 22. | 90035 | 10.9% | 10.5%(+0.428)#668 | 10.9%(+0.075)#14,057 |
| 23. | 90001 | 10.9% | 10.5%(+0.390)#681 | 10.9%(+0.038)#14,208 |
| 24. | 90033 | 10.6% | 10.5%(+0.109)#742 | 10.9%(-0.243)#15,088 |
| 25. | 90042 | 10.6% | 10.5%(+0.105)#744 | 10.9%(-0.247)#15,102 |
| 26. | 90014 | 10.5% | 10.5%(+0.039)#752 | 10.9%(-0.313)#15,315 |
| 27. | 90036 | 10.5% | 10.5%(-0.042)#766 | 10.9%(-0.395)#15,624 |
| 28. | 90003 | 10.4% | 10.5%(-0.065)#772 | 10.9%(-0.417)#15,696 |
| 29. | 90041 | 10.2% | 10.5%(-0.326)#817 | 10.9%(-0.679)#16,541 |
| 30. | 90037 | 10.1% | 10.5%(-0.367)#825 | 10.9%(-0.719)#16,685 |
| 31. | 90027 | 10.1% | 10.5%(-0.412)#834 | 10.9%(-0.765)#16,828 |
| 32. | 90028 | 9.8% | 10.5%(-0.675)#887 | 10.9%(-1.03)#17,672 |
| 33. | 90046 | 9.7% | 10.5%(-0.771)#897 | 10.9%(-1.12)#17,960 |
| 34. | 90034 | 9.6% | 10.5%(-0.948)#930 | 10.9%(-1.30)#18,565 |
| 35. | 90065 | 9.5% | 10.5%(-0.975)#934 | 10.9%(-1.33)#18,647 |
| 36. | 90004 | 9.5% | 10.5%(-1.05)#948 | 10.9%(-1.40)#18,915 |
| 37. | 90056 | 9.2% | 10.5%(-1.29)#981 | 10.9%(-1.65)#19,645 |
| 38. | 90029 | 9.1% | 10.5%(-1.42)#1,010 | 10.9%(-1.77)#20,013 |
| 39. | 90018 | 9.0% | 10.5%(-1.49)#1,018 | 10.9%(-1.85)#20,230 |
| 40. | 90011 | 9.0% | 10.5%(-1.50)#1,019 | 10.9%(-1.85)#20,238 |
| 41. | 90045 | 8.6% | 10.5%(-1.95)#1,080 | 10.9%(-2.30)#21,541 |
| 42. | 90005 | 8.4% | 10.5%(-2.14)#1,103 | 10.9%(-2.49)#22,049 |
| 43. | 90025 | 8.3% | 10.5%(-2.16)#1,106 | 10.9%(-2.51)#22,105 |
| 44. | 90048 | 8.3% | 10.5%(-2.24)#1,119 | 10.9%(-2.59)#22,312 |
| 45. | 90026 | 8.3% | 10.5%(-2.24)#1,120 | 10.9%(-2.60)#22,335 |
| 46. | 90017 | 8.2% | 10.5%(-2.34)#1,141 | 10.9%(-2.70)#22,635 |
| 47. | 90038 | 7.9% | 10.5%(-2.56)#1,172 | 10.9%(-2.91)#23,139 |
| 48. | 90066 | 7.7% | 10.5%(-2.82)#1,203 | 10.9%(-3.17)#23,739 |
| 49. | 90068 | 7.6% | 10.5%(-2.91)#1,217 | 10.9%(-3.26)#23,928 |
| 50. | 90019 | 7.5% | 10.5%(-2.97)#1,224 | 10.9%(-3.32)#24,076 |
| 51. | 90012 | 7.4% | 10.5%(-3.14)#1,246 | 10.9%(-3.49)#24,489 |
| 52. | 90006 | 7.3% | 10.5%(-3.21)#1,250 | 10.9%(-3.56)#24,627 |
| 53. | 90077 | 7.1% | 10.5%(-3.39)#1,274 | 10.9%(-3.74)#24,993 |
| 54. | 90064 | 6.6% | 10.5%(-3.94)#1,319 | 10.9%(-4.30)#25,999 |
| 55. | 90039 | 6.4% | 10.5%(-4.08)#1,338 | 10.9%(-4.43)#26,230 |
| 56. | 90057 | 6.4% | 10.5%(-4.13)#1,341 | 10.9%(-4.48)#26,303 |
| 57. | 90049 | 6.1% | 10.5%(-4.41)#1,363 | 10.9%(-4.76)#26,706 |
| 58. | 90010 | 5.9% | 10.5%(-4.62)#1,389 | 10.9%(-4.97)#27,015 |
| 59. | 90015 | 5.7% | 10.5%(-4.84)#1,406 | 10.9%(-5.19)#27,315 |
| 60. | 90021 | 5.6% | 10.5%(-4.89)#1,411 | 10.9%(-5.24)#27,391 |
| 61. | 90013 | 4.3% | 10.5%(-6.19)#1,495 | 10.9%(-6.54)#28,743 |
| 62. | 90067 | 2.4% | 10.5%(-8.09)#1,566 | 10.9%(-8.45)#29,930 |
1
Common Questions
What are the Top 10 Zip Codes with the Highest Percentage of Population Employed in Office & Administration in Los Angeles, CA?
Top 10 Zip Codes with the Highest Percentage of Population Employed in Office & Administration in Los Angeles, CA are:
What zip code has the Highest Percentage of Population Employed in Office & Administration in Los Angeles, CA?
90071 has the Highest Percentage of Population Employed in Office & Administration in Los Angeles, CA with 50.6%.
What is the Percentage of Population Employed in Office & Administration in Los Angeles, CA?
Percentage of Population Employed in Office & Administration in Los Angeles is 10.1%.
What is the Percentage of Population Employed in Office & Administration in California?
Percentage of Population Employed in Office & Administration in California is 10.5%.
What is the Percentage of Population Employed in Office & Administration in the United States?
Percentage of Population Employed in Office & Administration in the United States is 10.9%.