Cities with the Highest Percentage of Population Employed in Office & Administration in Ohio
RELATED REPORTS & OPTIONS
Office & Administration
Ohio
Compare Cities
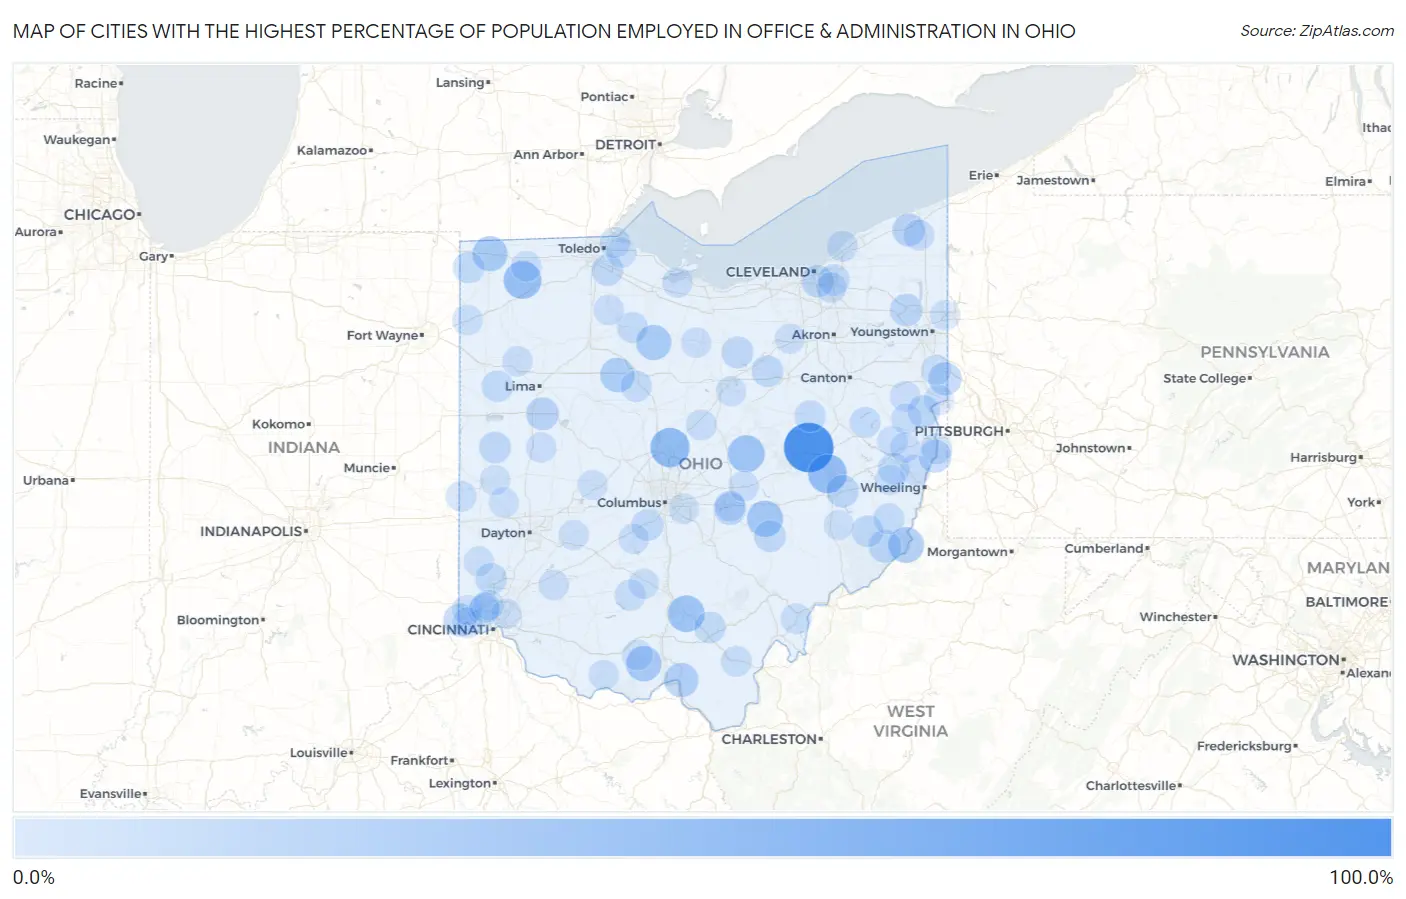
Map of Cities with the Highest Percentage of Population Employed in Office & Administration in Ohio
0.0%
100.0%
Cities with the Highest Percentage of Population Employed in Office & Administration in Ohio
| City | % Employed | vs State | vs National | |
| 1. | Bloomingville | 100.0% | 11.3%(+88.7)#1 | 10.9%(+89.1)#14 |
| 2. | Fresno | 100.0% | 11.3%(+88.7)#2 | 10.9%(+89.1)#25 |
| 3. | Kilbourne | 55.6% | 11.3%(+44.3)#3 | 10.9%(+44.7)#158 |
| 4. | Kimbolton | 53.5% | 11.3%(+42.2)#4 | 10.9%(+42.6)#172 |
| 5. | Ridgeville Corners | 50.0% | 11.3%(+38.7)#5 | 10.9%(+39.1)#203 |
| 6. | Bladensburg | 46.3% | 11.3%(+35.1)#6 | 10.9%(+35.5)#271 |
| 7. | Richmond Dale | 45.2% | 11.3%(+33.9)#7 | 10.9%(+34.3)#287 |
| 8. | South Mount Vernon | 43.6% | 11.3%(+32.4)#8 | 10.9%(+32.8)#321 |
| 9. | East Fultonham | 42.9% | 11.3%(+31.6)#9 | 10.9%(+32.0)#336 |
| 10. | Hannibal | 41.0% | 11.3%(+29.7)#10 | 10.9%(+30.1)#385 |
| 11. | Otway | 40.0% | 11.3%(+28.7)#11 | 10.9%(+29.1)#413 |
| 12. | Melmore | 38.7% | 11.3%(+27.5)#12 | 10.9%(+27.9)#452 |
| 13. | Holiday City | 38.5% | 11.3%(+27.2)#13 | 10.9%(+27.6)#460 |
| 14. | Kirby | 36.7% | 11.3%(+25.4)#14 | 10.9%(+25.8)#507 |
| 15. | Sciotodale | 34.9% | 11.3%(+23.6)#15 | 10.9%(+24.0)#582 |
| 16. | Negley | 30.6% | 11.3%(+19.3)#16 | 10.9%(+19.7)#811 |
| 17. | Elizabethtown | 30.4% | 11.3%(+19.2)#17 | 10.9%(+19.6)#818 |
| 18. | Austinburg | 29.8% | 11.3%(+18.6)#18 | 10.9%(+19.0)#860 |
| 19. | St Johns | 29.1% | 11.3%(+17.8)#19 | 10.9%(+18.2)#908 |
| 20. | Brilliant | 28.8% | 11.3%(+17.6)#20 | 10.9%(+18.0)#929 |
| 21. | Antioch | 28.6% | 11.3%(+17.3)#21 | 10.9%(+17.7)#959 |
| 22. | Leavittsburg | 28.4% | 11.3%(+17.1)#22 | 10.9%(+17.5)#976 |
| 23. | Old Washington | 28.0% | 11.3%(+16.7)#23 | 10.9%(+17.1)#1,009 |
| 24. | Thornport | 27.7% | 11.3%(+16.4)#24 | 10.9%(+16.8)#1,043 |
| 25. | Gomer | 27.6% | 11.3%(+16.4)#25 | 10.9%(+16.8)#1,044 |
| 26. | Cuyahoga Heights | 26.6% | 11.3%(+15.3)#26 | 10.9%(+15.7)#1,147 |
| 27. | Irondale | 26.5% | 11.3%(+15.2)#27 | 10.9%(+15.6)#1,156 |
| 28. | Sharon Center | 26.4% | 11.3%(+15.2)#28 | 10.9%(+15.6)#1,161 |
| 29. | Savannah | 25.5% | 11.3%(+14.2)#29 | 10.9%(+14.6)#1,259 |
| 30. | New Pittsburg | 25.0% | 11.3%(+13.7)#30 | 10.9%(+14.1)#1,306 |
| 31. | Orient | 25.0% | 11.3%(+13.7)#31 | 10.9%(+14.1)#1,308 |
| 32. | Rose Farm | 25.0% | 11.3%(+13.7)#32 | 10.9%(+14.1)#1,316 |
| 33. | Yorkshire | 25.0% | 11.3%(+13.7)#33 | 10.9%(+14.1)#1,320 |
| 34. | Williamsdale | 24.9% | 11.3%(+13.6)#34 | 10.9%(+14.0)#1,343 |
| 35. | Stony Ridge | 24.8% | 11.3%(+13.5)#35 | 10.9%(+13.9)#1,354 |
| 36. | Lewisville | 24.7% | 11.3%(+13.5)#36 | 10.9%(+13.9)#1,360 |
| 37. | Elgin | 24.3% | 11.3%(+13.0)#37 | 10.9%(+13.4)#1,420 |
| 38. | Petersburg | 24.2% | 11.3%(+12.9)#38 | 10.9%(+13.3)#1,437 |
| 39. | Blakeslee | 24.0% | 11.3%(+12.7)#39 | 10.9%(+13.1)#1,460 |
| 40. | Walnut Creek | 23.9% | 11.3%(+12.7)#40 | 10.9%(+13.1)#1,463 |
| 41. | Coalton | 23.9% | 11.3%(+12.7)#41 | 10.9%(+13.1)#1,469 |
| 42. | Groesbeck | 23.9% | 11.3%(+12.7)#42 | 10.9%(+13.1)#1,471 |
| 43. | Warrensville Heights | 23.7% | 11.3%(+12.5)#43 | 10.9%(+12.9)#1,499 |
| 44. | Maria Stein | 23.7% | 11.3%(+12.4)#44 | 10.9%(+12.8)#1,513 |
| 45. | New Athens | 23.5% | 11.3%(+12.3)#45 | 10.9%(+12.7)#1,549 |
| 46. | Harpster | 23.2% | 11.3%(+11.9)#46 | 10.9%(+12.3)#1,607 |
| 47. | Beallsville | 23.0% | 11.3%(+11.7)#47 | 10.9%(+12.1)#1,634 |
| 48. | Mingo Junction | 22.8% | 11.3%(+11.5)#48 | 10.9%(+11.9)#1,679 |
| 49. | Sherrodsville | 22.1% | 11.3%(+10.9)#49 | 10.9%(+11.3)#1,812 |
| 50. | Bascom | 22.1% | 11.3%(+10.9)#50 | 10.9%(+11.3)#1,820 |
| 51. | Lawrenceville | 22.1% | 11.3%(+10.9)#51 | 10.9%(+11.3)#1,821 |
| 52. | Suffield | 22.0% | 11.3%(+10.8)#52 | 10.9%(+11.2)#1,845 |
| 53. | Timberlake | 21.8% | 11.3%(+10.6)#53 | 10.9%(+11.0)#1,885 |
| 54. | South Salem | 21.7% | 11.3%(+10.5)#54 | 10.9%(+10.9)#1,898 |
| 55. | Jefferson | 21.7% | 11.3%(+10.5)#55 | 10.9%(+10.9)#1,908 |
| 56. | Rio Grande | 21.5% | 11.3%(+10.3)#56 | 10.9%(+10.7)#1,957 |
| 57. | Tuppers Plains | 21.2% | 11.3%(+9.93)#57 | 10.9%(+10.3)#2,049 |
| 58. | Chesterville | 20.8% | 11.3%(+9.58)#58 | 10.9%(+9.98)#2,143 |
| 59. | Harbor Hills | 20.8% | 11.3%(+9.54)#59 | 10.9%(+9.94)#2,159 |
| 60. | Mount Pleasant | 20.8% | 11.3%(+9.51)#60 | 10.9%(+9.91)#2,166 |
| 61. | Hollansburg | 20.8% | 11.3%(+9.51)#61 | 10.9%(+9.91)#2,167 |
| 62. | Harbor View | 20.7% | 11.3%(+9.43)#62 | 10.9%(+9.83)#2,192 |
| 63. | Rarden | 20.5% | 11.3%(+9.26)#63 | 10.9%(+9.66)#2,247 |
| 64. | Brandt | 20.4% | 11.3%(+9.11)#64 | 10.9%(+9.51)#2,286 |
| 65. | Bedford | 20.4% | 11.3%(+9.10)#65 | 10.9%(+9.50)#2,295 |
| 66. | Jewett | 20.3% | 11.3%(+9.05)#66 | 10.9%(+9.45)#2,305 |
| 67. | Pettisville | 20.2% | 11.3%(+8.97)#67 | 10.9%(+9.37)#2,327 |
| 68. | Antwerp | 20.1% | 11.3%(+8.86)#68 | 10.9%(+9.26)#2,363 |
| 69. | Mount Sterling | 20.0% | 11.3%(+8.79)#69 | 10.9%(+9.19)#2,388 |
| 70. | Clarksville | 20.0% | 11.3%(+8.74)#70 | 10.9%(+9.14)#2,398 |
| 71. | Fort Jennings | 20.0% | 11.3%(+8.74)#71 | 10.9%(+9.14)#2,403 |
| 72. | Summitville | 20.0% | 11.3%(+8.74)#72 | 10.9%(+9.14)#2,411 |
| 73. | West Millgrove | 20.0% | 11.3%(+8.74)#73 | 10.9%(+9.14)#2,424 |
| 74. | North Bend | 20.0% | 11.3%(+8.70)#74 | 10.9%(+9.10)#2,451 |
| 75. | Marne | 19.9% | 11.3%(+8.65)#75 | 10.9%(+9.05)#2,465 |
| 76. | Bergholz | 19.7% | 11.3%(+8.47)#76 | 10.9%(+8.87)#2,526 |
| 77. | Hopedale | 19.7% | 11.3%(+8.43)#77 | 10.9%(+8.83)#2,539 |
| 78. | Whites Landing | 19.7% | 11.3%(+8.42)#78 | 10.9%(+8.82)#2,540 |
| 79. | New Waterford | 19.6% | 11.3%(+8.38)#79 | 10.9%(+8.78)#2,557 |
| 80. | West Union | 19.6% | 11.3%(+8.32)#80 | 10.9%(+8.72)#2,578 |
| 81. | Celeryville | 19.6% | 11.3%(+8.31)#81 | 10.9%(+8.71)#2,585 |
| 82. | Frankfort | 19.3% | 11.3%(+8.09)#82 | 10.9%(+8.49)#2,665 |
| 83. | Port Jefferson | 19.3% | 11.3%(+8.06)#83 | 10.9%(+8.46)#2,672 |
| 84. | La Croft | 19.2% | 11.3%(+7.99)#84 | 10.9%(+8.39)#2,699 |
| 85. | Lafferty | 19.2% | 11.3%(+7.97)#85 | 10.9%(+8.37)#2,710 |
| 86. | Mutual | 19.2% | 11.3%(+7.97)#86 | 10.9%(+8.37)#2,714 |
| 87. | Brice | 19.1% | 11.3%(+7.89)#87 | 10.9%(+8.29)#2,741 |
| 88. | Cedarville | 19.1% | 11.3%(+7.87)#88 | 10.9%(+8.27)#2,752 |
| 89. | Potsdam | 19.0% | 11.3%(+7.77)#89 | 10.9%(+8.17)#2,798 |
| 90. | Somerville | 19.0% | 11.3%(+7.75)#90 | 10.9%(+8.15)#2,803 |
| 91. | Gloria Glens Park | 19.0% | 11.3%(+7.74)#91 | 10.9%(+8.14)#2,806 |
| 92. | Lucas | 19.0% | 11.3%(+7.74)#92 | 10.9%(+8.14)#2,807 |
| 93. | Curtice | 18.9% | 11.3%(+7.68)#93 | 10.9%(+8.08)#2,834 |
| 94. | New Burlington | 18.9% | 11.3%(+7.61)#94 | 10.9%(+8.01)#2,868 |
| 95. | Gettysburg | 18.8% | 11.3%(+7.58)#95 | 10.9%(+7.98)#2,893 |
| 96. | Deer Park | 18.8% | 11.3%(+7.55)#96 | 10.9%(+7.95)#2,906 |
| 97. | Masury | 18.8% | 11.3%(+7.54)#97 | 10.9%(+7.94)#2,913 |
| 98. | Blue Jay | 18.7% | 11.3%(+7.49)#98 | 10.9%(+7.89)#2,958 |
| 99. | Northbrook | 18.7% | 11.3%(+7.48)#99 | 10.9%(+7.88)#2,960 |
| 100. | Sarahsville | 18.6% | 11.3%(+7.35)#100 | 10.9%(+7.75)#3,018 |
Common Questions
What are the Top 10 Cities with the Highest Percentage of Population Employed in Office & Administration in Ohio?
Top 10 Cities with the Highest Percentage of Population Employed in Office & Administration in Ohio are:
#1
100.0%
#2
55.6%
#3
53.5%
#4
50.0%
#5
46.3%
#6
45.2%
#7
42.9%
#8
41.0%
#9
40.0%
#10
38.7%
What city has the Highest Percentage of Population Employed in Office & Administration in Ohio?
Fresno has the Highest Percentage of Population Employed in Office & Administration in Ohio with 100.0%.
What is the Percentage of Population Employed in Office & Administration in the State of Ohio?
Percentage of Population Employed in Office & Administration in Ohio is 11.3%.
What is the Percentage of Population Employed in Office & Administration in the United States?
Percentage of Population Employed in Office & Administration in the United States is 10.9%.