Cities with the Highest Percentage of Population Employed in Office & Administration in Texas
RELATED REPORTS & OPTIONS
Office & Administration
Texas
Compare Cities
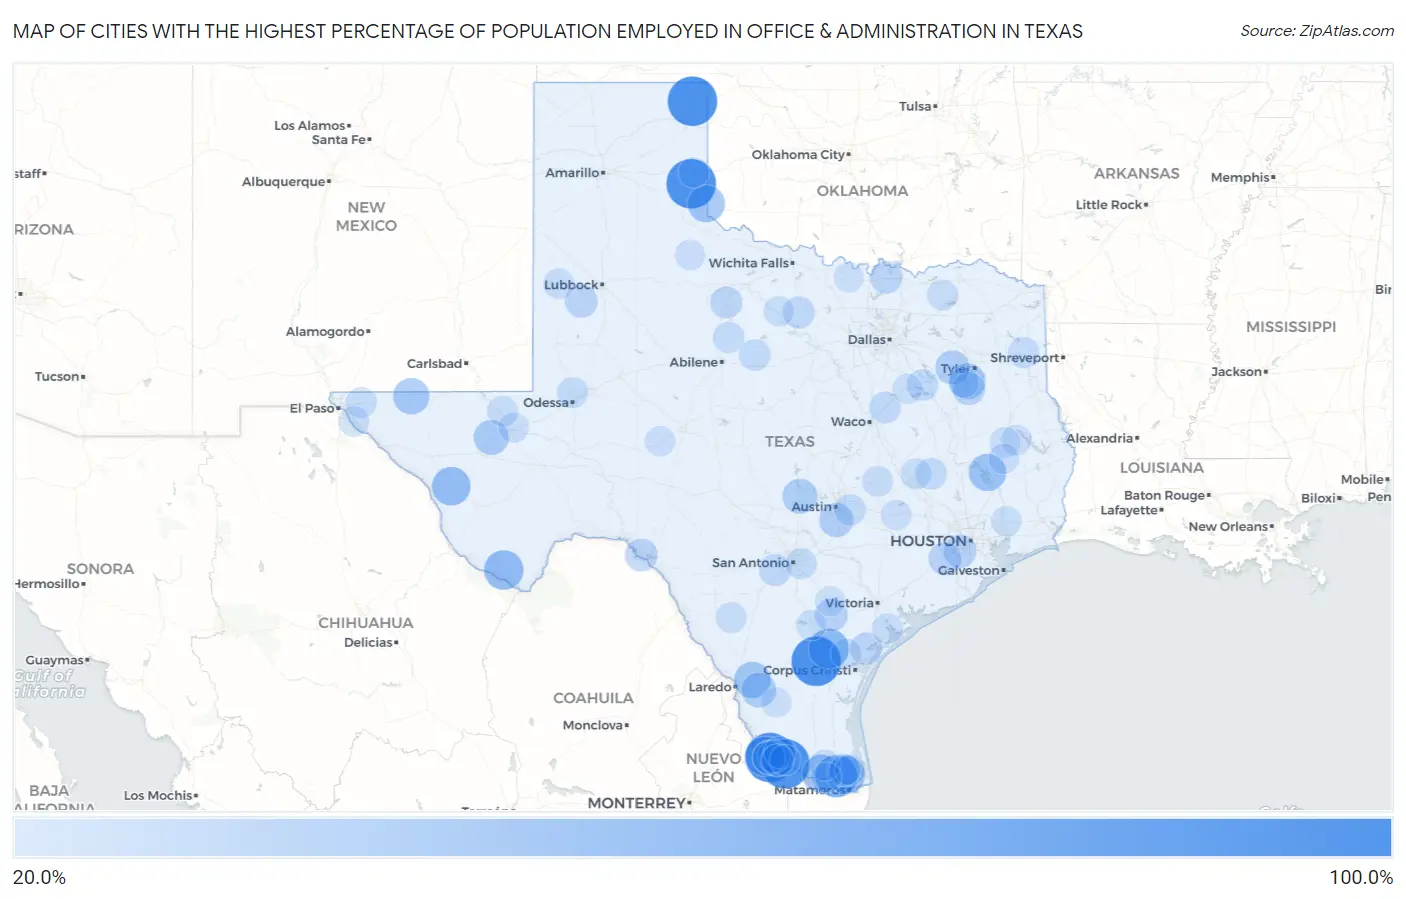
Map of Cities with the Highest Percentage of Population Employed in Office & Administration in Texas
0.0%
100.0%
Cities with the Highest Percentage of Population Employed in Office & Administration in Texas
| City | % Employed | vs State | vs National | |
| 1. | Hilltop Cdp Starr County | 100.0% | 11.0%(+89.0)#1 | 10.9%(+89.1)#3 |
| 2. | Los Alvarez | 100.0% | 11.0%(+89.0)#2 | 10.9%(+89.1)#6 |
| 3. | Owl Ranch | 100.0% | 11.0%(+89.0)#3 | 10.9%(+89.1)#8 |
| 4. | Sunset Cdp Starr County | 100.0% | 11.0%(+89.0)#5 | 10.9%(+89.1)#21 |
| 5. | Longoria | 100.0% | 11.0%(+89.0)#6 | 10.9%(+89.1)#22 |
| 6. | Lipscomb | 100.0% | 11.0%(+89.0)#7 | 10.9%(+89.1)#26 |
| 7. | Samnorwood | 100.0% | 11.0%(+89.0)#8 | 10.9%(+89.1)#35 |
| 8. | Salineno | 79.2% | 11.0%(+68.2)#9 | 10.9%(+68.3)#62 |
| 9. | Rangerville | 69.8% | 11.0%(+58.8)#10 | 10.9%(+59.0)#90 |
| 10. | Edgewater Estates | 61.9% | 11.0%(+50.9)#11 | 10.9%(+51.0)#119 |
| 11. | Mesquite | 59.0% | 11.0%(+48.0)#12 | 10.9%(+48.2)#130 |
| 12. | Terlingua | 58.6% | 11.0%(+47.6)#13 | 10.9%(+47.8)#132 |
| 13. | Valentine | 55.6% | 11.0%(+44.6)#14 | 10.9%(+44.7)#157 |
| 14. | Villa Verde | 53.8% | 11.0%(+42.9)#15 | 10.9%(+43.0)#170 |
| 15. | Proctor | 53.3% | 11.0%(+42.4)#16 | 10.9%(+42.5)#173 |
| 16. | Umbarger | 53.1% | 11.0%(+42.2)#17 | 10.9%(+42.3)#181 |
| 17. | Green Valley Farms | 52.4% | 11.0%(+41.4)#18 | 10.9%(+41.5)#186 |
| 18. | Cedar Point | 50.9% | 11.0%(+39.9)#19 | 10.9%(+40.1)#199 |
| 19. | Dodson | 50.0% | 11.0%(+39.0)#20 | 10.9%(+39.1)#216 |
| 20. | New Ulm | 48.1% | 11.0%(+37.1)#21 | 10.9%(+37.2)#246 |
| 21. | Los Arcos | 47.4% | 11.0%(+36.4)#22 | 10.9%(+36.5)#256 |
| 22. | Dell City | 46.4% | 11.0%(+35.5)#23 | 10.9%(+35.6)#268 |
| 23. | Emerald Bay | 45.2% | 11.0%(+34.2)#24 | 10.9%(+34.3)#288 |
| 24. | Lyons | 42.4% | 11.0%(+31.4)#25 | 10.9%(+31.5)#350 |
| 25. | Toyah | 41.7% | 11.0%(+30.7)#26 | 10.9%(+30.8)#371 |
| 26. | Zephyr | 41.6% | 11.0%(+30.6)#27 | 10.9%(+30.7)#373 |
| 27. | Aguilares | 41.2% | 11.0%(+30.2)#28 | 10.9%(+30.3)#380 |
| 28. | Round Mountain | 41.1% | 11.0%(+30.1)#29 | 10.9%(+30.2)#383 |
| 29. | Barrera | 40.4% | 11.0%(+29.4)#30 | 10.9%(+29.5)#405 |
| 30. | Creedmoor | 38.5% | 11.0%(+27.5)#31 | 10.9%(+27.6)#457 |
| 31. | Callender Lake | 38.1% | 11.0%(+27.1)#32 | 10.9%(+27.2)#471 |
| 32. | Praesel | 37.1% | 11.0%(+26.1)#33 | 10.9%(+26.2)#494 |
| 33. | Red Rock | 35.2% | 11.0%(+24.2)#34 | 10.9%(+24.3)#571 |
| 34. | Pettus | 33.6% | 11.0%(+22.7)#35 | 10.9%(+22.8)#631 |
| 35. | Fifth Street | 33.6% | 11.0%(+22.6)#36 | 10.9%(+22.7)#636 |
| 36. | Santa Cruz | 33.3% | 11.0%(+22.4)#37 | 10.9%(+22.5)#640 |
| 37. | Pleak | 33.2% | 11.0%(+22.2)#38 | 10.9%(+22.3)#687 |
| 38. | Cuney | 32.8% | 11.0%(+21.9)#39 | 10.9%(+22.0)#697 |
| 39. | Meadow | 32.8% | 11.0%(+21.8)#40 | 10.9%(+21.9)#701 |
| 40. | Amistad | 32.4% | 11.0%(+21.5)#41 | 10.9%(+21.6)#715 |
| 41. | Arroyo Colorado Estates | 31.9% | 11.0%(+20.9)#42 | 10.9%(+21.0)#739 |
| 42. | Sadler | 31.2% | 11.0%(+20.3)#43 | 10.9%(+20.4)#773 |
| 43. | Bayside | 31.0% | 11.0%(+20.0)#44 | 10.9%(+20.1)#786 |
| 44. | Pendleton | 30.3% | 11.0%(+19.4)#45 | 10.9%(+19.5)#826 |
| 45. | Airport Heights | 29.9% | 11.0%(+18.9)#46 | 10.9%(+19.1)#853 |
| 46. | Los Barreras | 29.9% | 11.0%(+18.9)#47 | 10.9%(+19.0)#856 |
| 47. | Weinert | 29.7% | 11.0%(+18.8)#48 | 10.9%(+18.9)#864 |
| 48. | Bryson | 29.6% | 11.0%(+18.7)#49 | 10.9%(+18.8)#870 |
| 49. | Lacoste | 29.5% | 11.0%(+18.6)#50 | 10.9%(+18.7)#874 |
| 50. | El Brazil | 29.4% | 11.0%(+18.4)#51 | 10.9%(+18.6)#886 |
| 51. | Mount Calm | 28.9% | 11.0%(+18.0)#52 | 10.9%(+18.1)#922 |
| 52. | Washburn | 28.1% | 11.0%(+17.1)#53 | 10.9%(+17.2)#997 |
| 53. | Iola | 28.0% | 11.0%(+17.0)#54 | 10.9%(+17.1)#1,012 |
| 54. | Moran | 27.9% | 11.0%(+16.9)#55 | 10.9%(+17.0)#1,014 |
| 55. | Webberville | 27.5% | 11.0%(+16.6)#56 | 10.9%(+16.7)#1,057 |
| 56. | Alamo Beach | 27.5% | 11.0%(+16.6)#57 | 10.9%(+16.7)#1,059 |
| 57. | Goodlow | 27.5% | 11.0%(+16.5)#58 | 10.9%(+16.6)#1,063 |
| 58. | Lueders | 27.0% | 11.0%(+16.1)#59 | 10.9%(+16.2)#1,100 |
| 59. | Nesbitt | 26.9% | 11.0%(+16.0)#60 | 10.9%(+16.1)#1,110 |
| 60. | Gardendale | 26.5% | 11.0%(+15.5)#61 | 10.9%(+15.6)#1,154 |
| 61. | China Grove | 26.5% | 11.0%(+15.5)#62 | 10.9%(+15.6)#1,158 |
| 62. | El Chaparral | 25.8% | 11.0%(+14.9)#63 | 10.9%(+15.0)#1,216 |
| 63. | Butterfield | 25.7% | 11.0%(+14.7)#64 | 10.9%(+14.8)#1,230 |
| 64. | Pecan Gap | 25.6% | 11.0%(+14.6)#65 | 10.9%(+14.8)#1,239 |
| 65. | Morning Glory | 25.5% | 11.0%(+14.6)#66 | 10.9%(+14.7)#1,247 |
| 66. | Rockdale | 25.5% | 11.0%(+14.6)#67 | 10.9%(+14.7)#1,248 |
| 67. | Wixon Valley | 25.4% | 11.0%(+14.5)#68 | 10.9%(+14.6)#1,264 |
| 68. | Laguna Seca | 25.4% | 11.0%(+14.4)#69 | 10.9%(+14.6)#1,265 |
| 69. | Big Wells | 25.4% | 11.0%(+14.4)#70 | 10.9%(+14.6)#1,266 |
| 70. | Mentone | 25.0% | 11.0%(+14.0)#71 | 10.9%(+14.1)#1,332 |
| 71. | Neches | 24.7% | 11.0%(+13.8)#72 | 10.9%(+13.9)#1,357 |
| 72. | Morgan Farm | 24.7% | 11.0%(+13.7)#73 | 10.9%(+13.8)#1,365 |
| 73. | Whiteface | 24.7% | 11.0%(+13.7)#74 | 10.9%(+13.8)#1,366 |
| 74. | Austwell | 24.6% | 11.0%(+13.6)#75 | 10.9%(+13.7)#1,383 |
| 75. | Burke | 24.3% | 11.0%(+13.4)#76 | 10.9%(+13.5)#1,411 |
| 76. | Villa Del Sol | 24.3% | 11.0%(+13.4)#77 | 10.9%(+13.5)#1,412 |
| 77. | Wingate | 24.3% | 11.0%(+13.4)#78 | 10.9%(+13.5)#1,417 |
| 78. | Huntington | 24.2% | 11.0%(+13.3)#79 | 10.9%(+13.4)#1,426 |
| 79. | Barksdale | 24.1% | 11.0%(+13.2)#80 | 10.9%(+13.3)#1,445 |
| 80. | Carmine | 23.9% | 11.0%(+13.0)#81 | 10.9%(+13.1)#1,465 |
| 81. | Cade Lakes | 23.9% | 11.0%(+12.9)#82 | 10.9%(+13.0)#1,480 |
| 82. | Pleasant Hill | 23.9% | 11.0%(+12.9)#83 | 10.9%(+13.0)#1,481 |
| 83. | Shamrock | 23.8% | 11.0%(+12.9)#84 | 10.9%(+13.0)#1,485 |
| 84. | Rosanky | 23.7% | 11.0%(+12.8)#85 | 10.9%(+12.9)#1,506 |
| 85. | Three Rivers | 23.6% | 11.0%(+12.6)#86 | 10.9%(+12.7)#1,535 |
| 86. | Mertzon | 23.6% | 11.0%(+12.6)#87 | 10.9%(+12.7)#1,539 |
| 87. | Eugenio Saenz | 23.5% | 11.0%(+12.6)#88 | 10.9%(+12.7)#1,545 |
| 88. | Arroyo Gardens | 23.5% | 11.0%(+12.5)#89 | 10.9%(+12.6)#1,559 |
| 89. | Ames | 23.5% | 11.0%(+12.5)#90 | 10.9%(+12.6)#1,560 |
| 90. | Coffee City | 23.3% | 11.0%(+12.4)#91 | 10.9%(+12.5)#1,576 |
| 91. | Harrold | 23.3% | 11.0%(+12.4)#92 | 10.9%(+12.5)#1,580 |
| 92. | Paducah | 23.3% | 11.0%(+12.3)#93 | 10.9%(+12.4)#1,590 |
| 93. | Newcastle | 23.2% | 11.0%(+12.3)#94 | 10.9%(+12.4)#1,595 |
| 94. | Barstow | 23.2% | 11.0%(+12.2)#95 | 10.9%(+12.4)#1,600 |
| 95. | Thompsonville | 23.1% | 11.0%(+12.2)#96 | 10.9%(+12.3)#1,613 |
| 96. | Relampago | 23.1% | 11.0%(+12.1)#97 | 10.9%(+12.2)#1,617 |
| 97. | Retreat | 22.7% | 11.0%(+11.8)#98 | 10.9%(+11.9)#1,681 |
| 98. | Kenedy | 22.7% | 11.0%(+11.7)#99 | 10.9%(+11.8)#1,693 |
| 99. | Lelia Lake | 22.6% | 11.0%(+11.6)#100 | 10.9%(+11.7)#1,714 |
| 100. | St Jo | 22.6% | 11.0%(+11.6)#101 | 10.9%(+11.7)#1,723 |
Common Questions
What are the Top 10 Cities with the Highest Percentage of Population Employed in Office & Administration in Texas?
Top 10 Cities with the Highest Percentage of Population Employed in Office & Administration in Texas are:
#1
100.0%
#2
100.0%
#3
100.0%
#4
100.0%
#5
100.0%
#6
69.8%
#7
61.9%
#8
59.0%
#9
58.6%
#10
55.6%
What city has the Highest Percentage of Population Employed in Office & Administration in Texas?
Los Alvarez has the Highest Percentage of Population Employed in Office & Administration in Texas with 100.0%.
What is the Percentage of Population Employed in Office & Administration in the State of Texas?
Percentage of Population Employed in Office & Administration in Texas is 11.0%.
What is the Percentage of Population Employed in Office & Administration in the United States?
Percentage of Population Employed in Office & Administration in the United States is 10.9%.