Zip Codes with the Highest Percentage of Population Employed in Office & Administration in San Jose, CA
RELATED REPORTS & OPTIONS
Office & Administration
San Jose
Compare Zip Codes
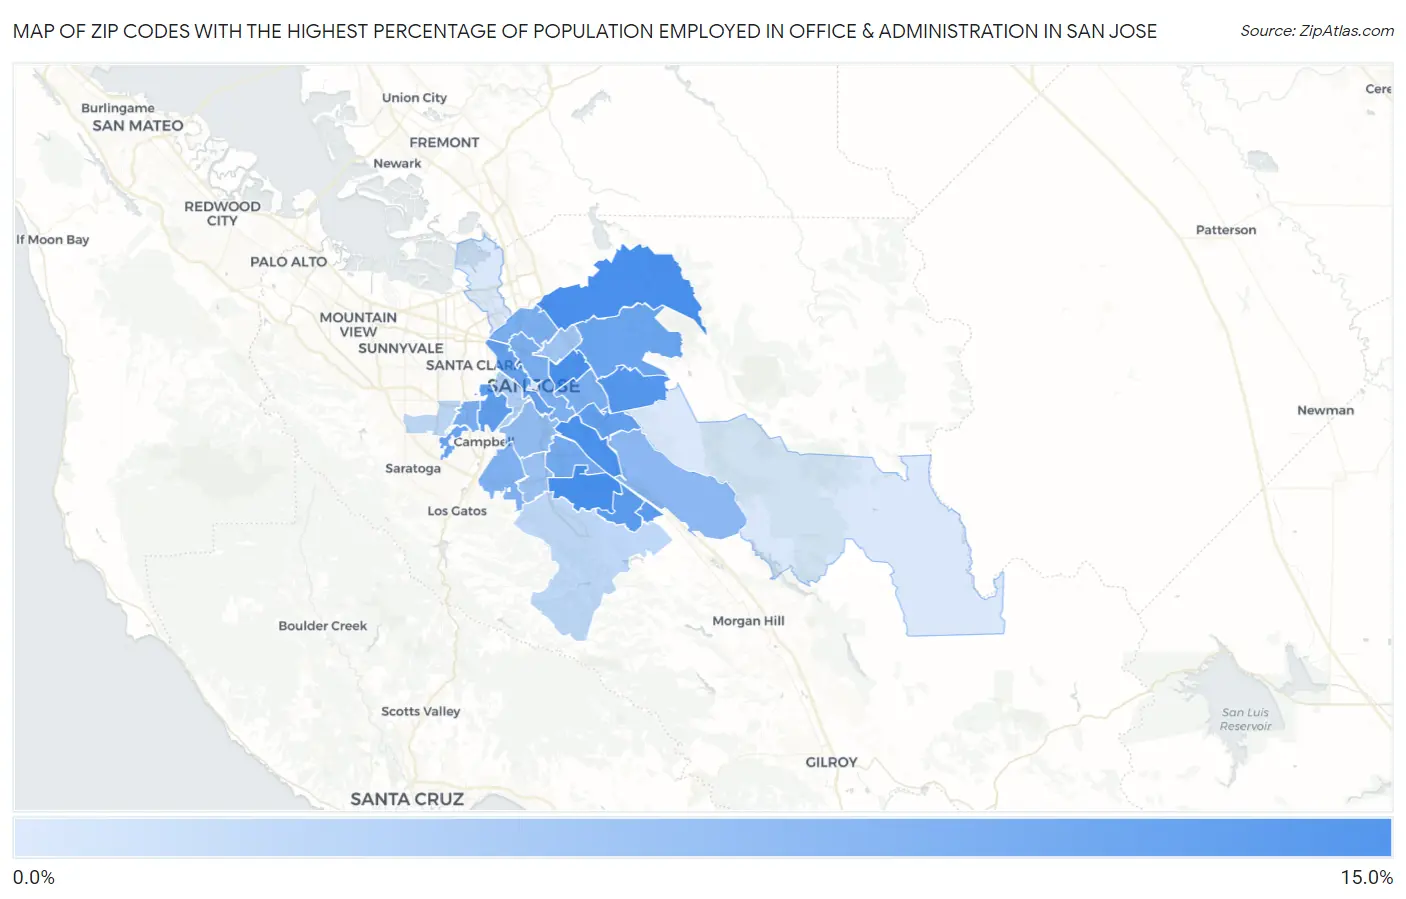
Map of Zip Codes with the Highest Percentage of Population Employed in Office & Administration in San Jose
4.8%
11.0%
Zip Codes with the Highest Percentage of Population Employed in Office & Administration in San Jose, CA
| Zip Code | % Employed | vs State | vs National | |
| 1. | 95123 | 11.0% | 10.5%(+0.539)#644 | 10.9%(+0.187)#13,704 |
| 2. | 95132 | 11.0% | 10.5%(+0.462)#660 | 10.9%(+0.110)#13,943 |
| 3. | 95111 | 10.9% | 10.5%(+0.387)#682 | 10.9%(+0.035)#14,217 |
| 4. | 95116 | 10.8% | 10.5%(+0.341)#694 | 10.9%(-0.012)#14,379 |
| 5. | 95148 | 10.5% | 10.5%(-0.011)#760 | 10.9%(-0.363)#15,509 |
| 6. | 95119 | 10.3% | 10.5%(-0.252)#808 | 10.9%(-0.605)#16,325 |
| 7. | 95139 | 10.0% | 10.5%(-0.475)#851 | 10.9%(-0.827)#17,029 |
| 8. | 95128 | 9.9% | 10.5%(-0.588)#871 | 10.9%(-0.940)#17,387 |
| 9. | 95121 | 9.8% | 10.5%(-0.664)#885 | 10.9%(-1.02)#17,642 |
| 10. | 95110 | 9.6% | 10.5%(-0.869)#919 | 10.9%(-1.22)#18,306 |
| 11. | 95127 | 9.5% | 10.5%(-1.03)#943 | 10.9%(-1.38)#18,854 |
| 12. | 95130 | 9.4% | 10.5%(-1.06)#950 | 10.9%(-1.41)#18,938 |
| 13. | 95136 | 9.1% | 10.5%(-1.41)#1,006 | 10.9%(-1.76)#19,949 |
| 14. | 95122 | 8.8% | 10.5%(-1.70)#1,043 | 10.9%(-2.05)#20,809 |
| 15. | 95131 | 8.8% | 10.5%(-1.71)#1,046 | 10.9%(-2.06)#20,854 |
| 16. | 95112 | 8.8% | 10.5%(-1.72)#1,051 | 10.9%(-2.07)#20,888 |
| 17. | 95117 | 8.7% | 10.5%(-1.85)#1,067 | 10.9%(-2.20)#21,280 |
| 18. | 95124 | 8.6% | 10.5%(-1.88)#1,070 | 10.9%(-2.23)#21,355 |
| 19. | 95138 | 8.1% | 10.5%(-2.43)#1,153 | 10.9%(-2.79)#22,851 |
| 20. | 95125 | 7.8% | 10.5%(-2.71)#1,192 | 10.9%(-3.06)#23,486 |
| 21. | 95118 | 7.4% | 10.5%(-3.08)#1,240 | 10.9%(-3.44)#24,353 |
| 22. | 95133 | 7.2% | 10.5%(-3.27)#1,255 | 10.9%(-3.62)#24,742 |
| 23. | 95126 | 6.6% | 10.5%(-3.92)#1,316 | 10.9%(-4.27)#25,947 |
| 24. | 95120 | 6.0% | 10.5%(-4.47)#1,370 | 10.9%(-4.82)#26,803 |
| 25. | 95129 | 6.0% | 10.5%(-4.51)#1,376 | 10.9%(-4.87)#26,856 |
| 26. | 95134 | 4.9% | 10.5%(-5.59)#1,455 | 10.9%(-5.94)#28,184 |
| 27. | 95135 | 4.9% | 10.5%(-5.60)#1,457 | 10.9%(-5.95)#28,193 |
| 28. | 95113 | 4.8% | 10.5%(-5.71)#1,460 | 10.9%(-6.06)#28,267 |
1
Common Questions
What are the Top 10 Zip Codes with the Highest Percentage of Population Employed in Office & Administration in San Jose, CA?
Top 10 Zip Codes with the Highest Percentage of Population Employed in Office & Administration in San Jose, CA are:
What zip code has the Highest Percentage of Population Employed in Office & Administration in San Jose, CA?
95123 has the Highest Percentage of Population Employed in Office & Administration in San Jose, CA with 11.0%.
What is the Percentage of Population Employed in Office & Administration in San Jose, CA?
Percentage of Population Employed in Office & Administration in San Jose is 8.9%.
What is the Percentage of Population Employed in Office & Administration in California?
Percentage of Population Employed in Office & Administration in California is 10.5%.
What is the Percentage of Population Employed in Office & Administration in the United States?
Percentage of Population Employed in Office & Administration in the United States is 10.9%.