Zip Codes with the Highest Percentage of Population Employed in Office & Administration in Porterville, CA
RELATED REPORTS & OPTIONS
Office & Administration
Porterville
Compare Zip Codes
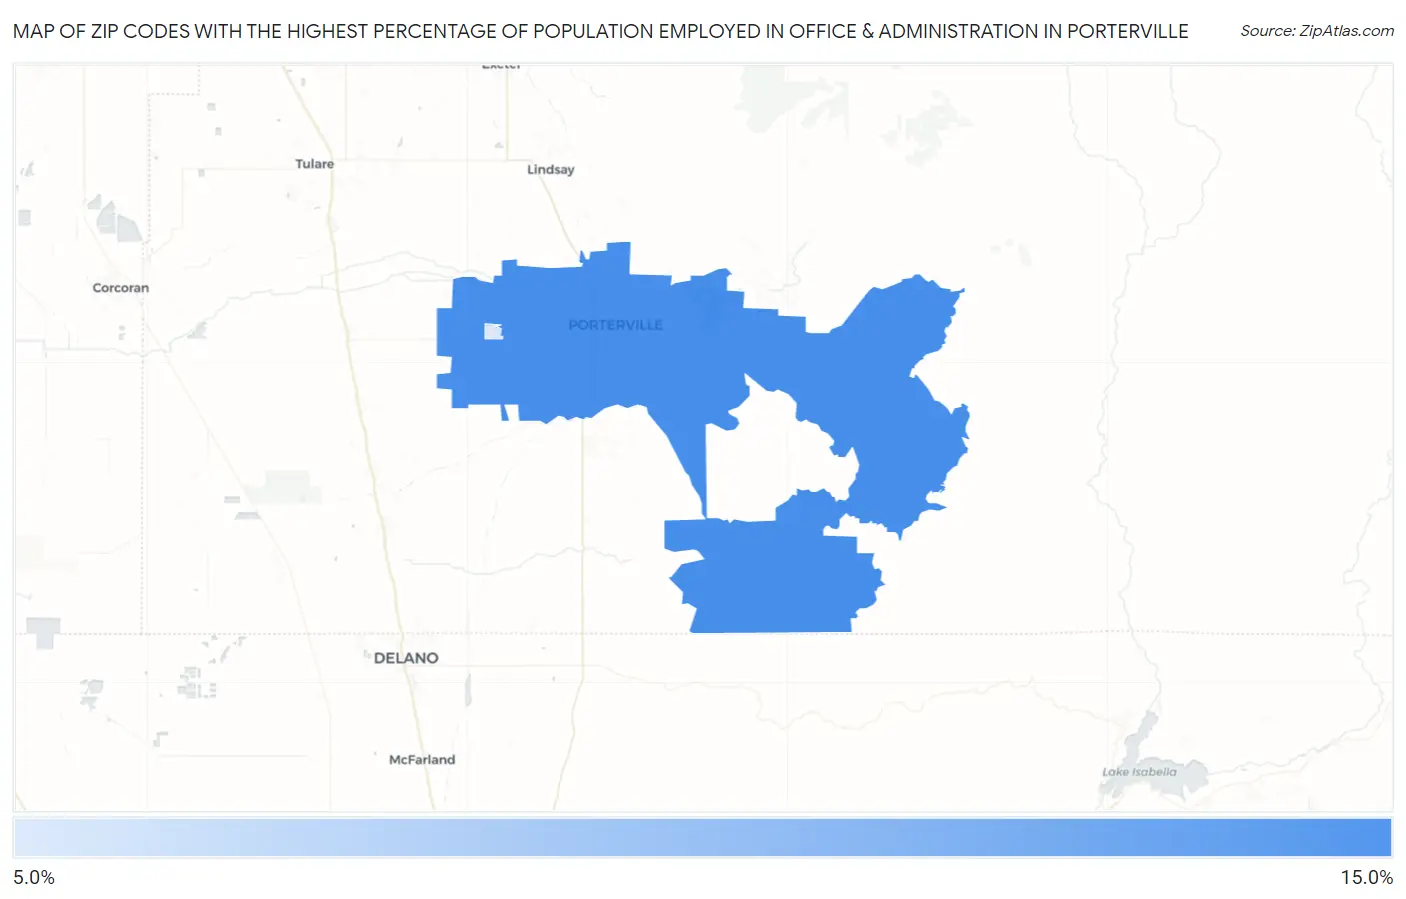
Map of Zip Codes with the Highest Percentage of Population Employed in Office & Administration in Porterville
9.9%
10.4%
Zip Codes with the Highest Percentage of Population Employed in Office & Administration in Porterville, CA
| Zip Code | % Employed | vs State | vs National | |
| 1. | 93257 | 10.4% | 10.5%(-0.148)#789 | 10.9%(-0.501)#15,972 |
| 2. | 93258 | 9.9% | 10.5%(-0.638)#883 | 10.9%(-0.991)#17,566 |
1
Common Questions
What are the Top Zip Codes with the Highest Percentage of Population Employed in Office & Administration in Porterville, CA?
Top Zip Codes with the Highest Percentage of Population Employed in Office & Administration in Porterville, CA are:
What zip code has the Highest Percentage of Population Employed in Office & Administration in Porterville, CA?
93257 has the Highest Percentage of Population Employed in Office & Administration in Porterville, CA with 10.4%.
What is the Percentage of Population Employed in Office & Administration in Porterville, CA?
Percentage of Population Employed in Office & Administration in Porterville is 11.3%.
What is the Percentage of Population Employed in Office & Administration in California?
Percentage of Population Employed in Office & Administration in California is 10.5%.
What is the Percentage of Population Employed in Office & Administration in the United States?
Percentage of Population Employed in Office & Administration in the United States is 10.9%.