Zip Codes with the Highest Percentage of Population Employed in Office & Administration in San Diego, CA
RELATED REPORTS & OPTIONS
Office & Administration
San Diego
Compare Zip Codes
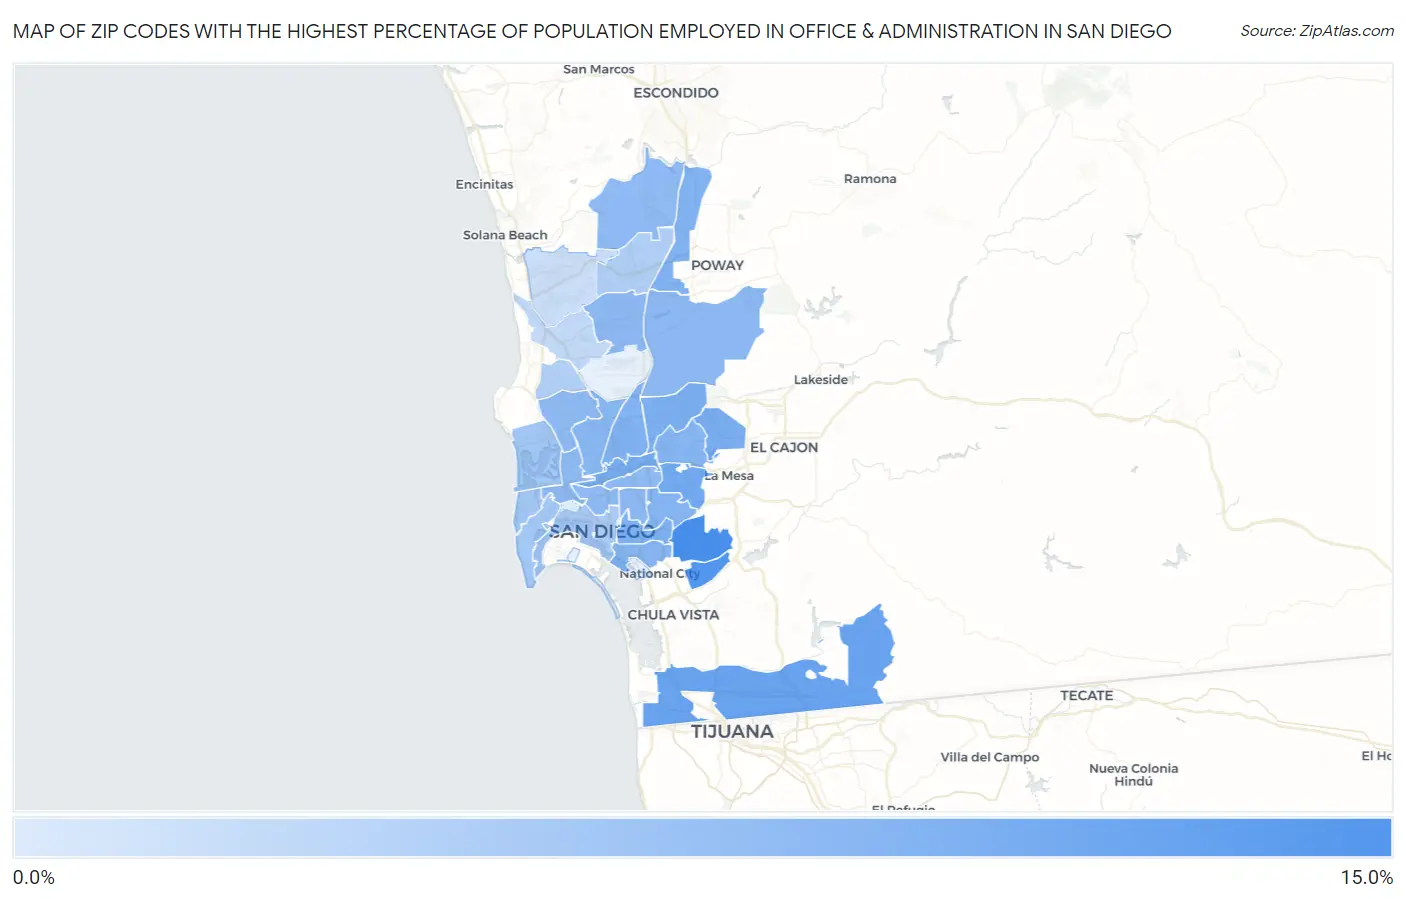
Map of Zip Codes with the Highest Percentage of Population Employed in Office & Administration in San Diego
3.3%
13.0%
Zip Codes with the Highest Percentage of Population Employed in Office & Administration in San Diego, CA
| Zip Code | % Employed | vs State | vs National | |
| 1. | 92114 | 13.0% | 10.5%(+2.53)#309 | 10.9%(+2.18)#7,985 |
| 2. | 92139 | 12.2% | 10.5%(+1.74)#415 | 10.9%(+1.39)#9,996 |
| 3. | 92154 | 10.9% | 10.5%(+0.398)#678 | 10.9%(+0.045)#14,175 |
| 4. | 92115 | 10.1% | 10.5%(-0.436)#841 | 10.9%(-0.788)#16,914 |
| 5. | 92108 | 9.7% | 10.5%(-0.791)#902 | 10.9%(-1.14)#18,021 |
| 6. | 92119 | 9.6% | 10.5%(-0.862)#917 | 10.9%(-1.21)#18,277 |
| 7. | 92124 | 9.5% | 10.5%(-0.963)#932 | 10.9%(-1.32)#18,603 |
| 8. | 92102 | 9.3% | 10.5%(-1.21)#977 | 10.9%(-1.56)#19,389 |
| 9. | 92123 | 9.1% | 10.5%(-1.40)#1,002 | 10.9%(-1.75)#19,929 |
| 10. | 92128 | 9.1% | 10.5%(-1.41)#1,007 | 10.9%(-1.76)#19,958 |
| 11. | 92113 | 8.9% | 10.5%(-1.59)#1,030 | 10.9%(-1.94)#20,497 |
| 12. | 92120 | 8.9% | 10.5%(-1.60)#1,031 | 10.9%(-1.95)#20,541 |
| 13. | 92105 | 8.8% | 10.5%(-1.69)#1,042 | 10.9%(-2.04)#20,784 |
| 14. | 92111 | 8.8% | 10.5%(-1.73)#1,052 | 10.9%(-2.08)#20,921 |
| 15. | 92131 | 8.5% | 10.5%(-2.03)#1,091 | 10.9%(-2.38)#21,773 |
| 16. | 92104 | 8.4% | 10.5%(-2.08)#1,098 | 10.9%(-2.43)#21,894 |
| 17. | 92126 | 8.4% | 10.5%(-2.14)#1,104 | 10.9%(-2.50)#22,064 |
| 18. | 92127 | 8.3% | 10.5%(-2.19)#1,113 | 10.9%(-2.55)#22,195 |
| 19. | 92116 | 8.3% | 10.5%(-2.25)#1,121 | 10.9%(-2.60)#22,356 |
| 20. | 92117 | 8.2% | 10.5%(-2.26)#1,130 | 10.9%(-2.61)#22,399 |
| 21. | 92110 | 8.2% | 10.5%(-2.27)#1,133 | 10.9%(-2.63)#22,433 |
| 22. | 92103 | 8.2% | 10.5%(-2.30)#1,138 | 10.9%(-2.65)#22,509 |
| 23. | 92106 | 6.9% | 10.5%(-3.57)#1,288 | 10.9%(-3.92)#25,331 |
| 24. | 92109 | 6.9% | 10.5%(-3.61)#1,295 | 10.9%(-3.96)#25,421 |
| 25. | 92107 | 6.9% | 10.5%(-3.61)#1,296 | 10.9%(-3.97)#25,425 |
| 26. | 92101 | 6.5% | 10.5%(-4.00)#1,330 | 10.9%(-4.35)#26,092 |
| 27. | 92129 | 6.1% | 10.5%(-4.42)#1,365 | 10.9%(-4.77)#26,719 |
| 28. | 92122 | 5.9% | 10.5%(-4.62)#1,388 | 10.9%(-4.97)#27,013 |
| 29. | 92121 | 5.0% | 10.5%(-5.46)#1,451 | 10.9%(-5.81)#28,064 |
| 30. | 92130 | 4.5% | 10.5%(-6.03)#1,482 | 10.9%(-6.38)#28,605 |
| 31. | 92140 | 3.3% | 10.5%(-7.24)#1,538 | 10.9%(-7.60)#29,513 |
1
Common Questions
What are the Top 10 Zip Codes with the Highest Percentage of Population Employed in Office & Administration in San Diego, CA?
Top 10 Zip Codes with the Highest Percentage of Population Employed in Office & Administration in San Diego, CA are:
What zip code has the Highest Percentage of Population Employed in Office & Administration in San Diego, CA?
92114 has the Highest Percentage of Population Employed in Office & Administration in San Diego, CA with 13.0%.
What is the Percentage of Population Employed in Office & Administration in San Diego, CA?
Percentage of Population Employed in Office & Administration in San Diego is 8.5%.
What is the Percentage of Population Employed in Office & Administration in California?
Percentage of Population Employed in Office & Administration in California is 10.5%.
What is the Percentage of Population Employed in Office & Administration in the United States?
Percentage of Population Employed in Office & Administration in the United States is 10.9%.