Cities with the Highest Percentage of Population Employed in Office & Administration in Delaware
RELATED REPORTS & OPTIONS
Office & Administration
Delaware
Compare Cities
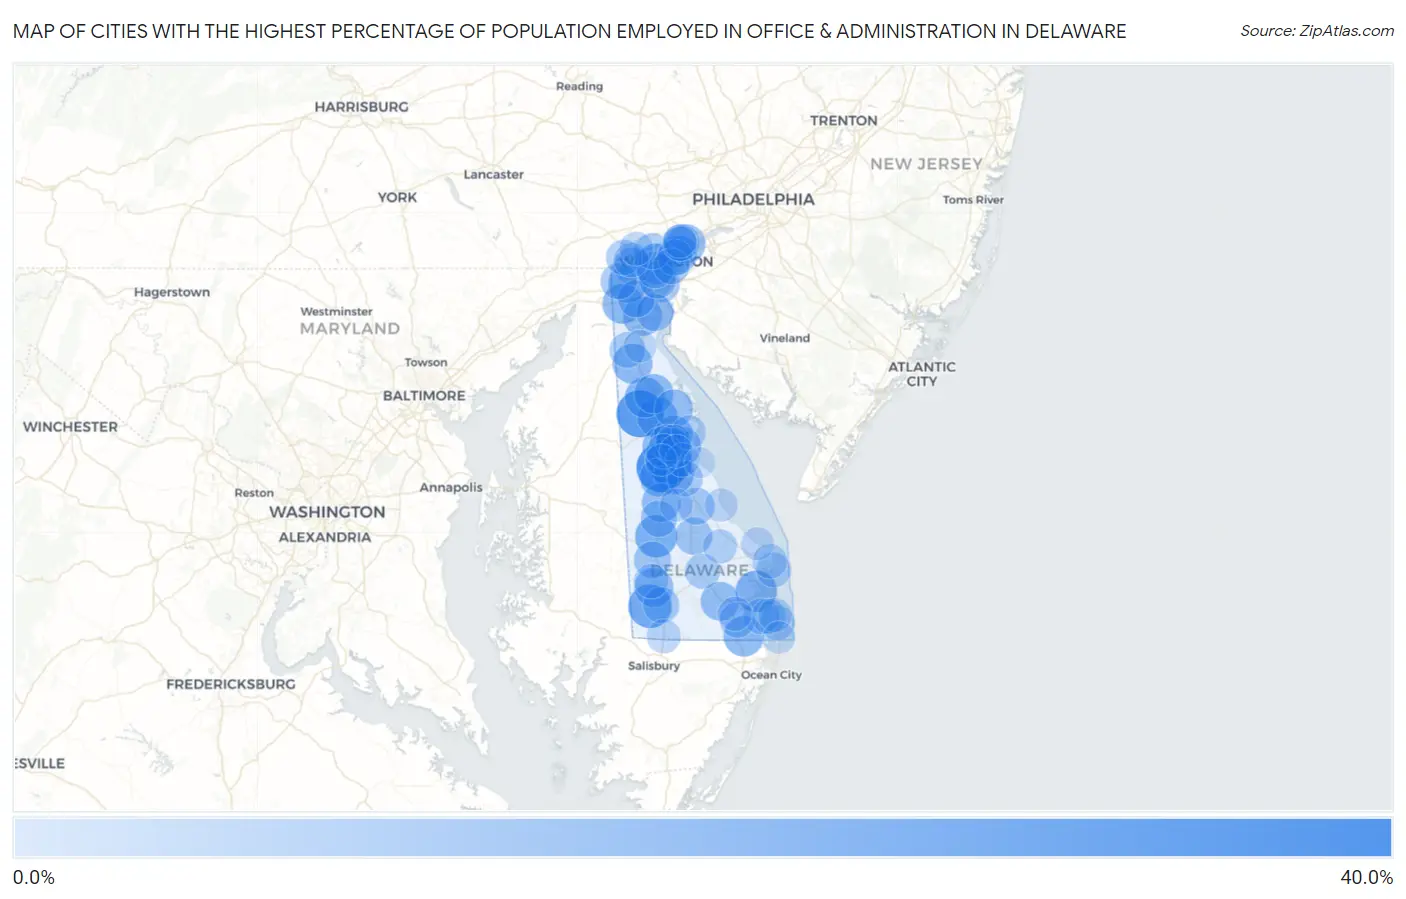
Map of Cities with the Highest Percentage of Population Employed in Office & Administration in Delaware
0.0%
40.0%
Cities with the Highest Percentage of Population Employed in Office & Administration in Delaware
| City | % Employed | vs State | vs National | |
| 1. | Viola | 31.7% | 11.4%(+20.3)#1 | 10.9%(+20.9)#747 |
| 2. | Kenton | 27.7% | 11.4%(+16.3)#2 | 10.9%(+16.9)#1,035 |
| 3. | Woodside East | 25.9% | 11.4%(+14.5)#3 | 10.9%(+15.0)#1,214 |
| 4. | Bethel | 21.8% | 11.4%(+10.5)#4 | 10.9%(+11.0)#1,875 |
| 5. | Greenwood | 19.6% | 11.4%(+8.23)#5 | 10.9%(+8.76)#2,566 |
| 6. | Long Neck | 18.6% | 11.4%(+7.20)#6 | 10.9%(+7.72)#3,035 |
| 7. | Elsmere | 17.0% | 11.4%(+5.66)#7 | 10.9%(+6.18)#3,945 |
| 8. | Cheswold | 16.6% | 11.4%(+5.22)#8 | 10.9%(+5.74)#4,269 |
| 9. | Clayton | 16.5% | 11.4%(+5.15)#9 | 10.9%(+5.68)#4,320 |
| 10. | Riverview | 16.5% | 11.4%(+5.13)#10 | 10.9%(+5.66)#4,333 |
| 11. | Selbyville | 16.4% | 11.4%(+5.05)#11 | 10.9%(+5.57)#4,396 |
| 12. | Glasgow | 15.9% | 11.4%(+4.52)#12 | 10.9%(+5.05)#4,888 |
| 13. | Wyoming | 15.7% | 11.4%(+4.31)#13 | 10.9%(+4.84)#5,092 |
| 14. | Townsend | 15.6% | 11.4%(+4.19)#14 | 10.9%(+4.71)#5,225 |
| 15. | Dover Base Housing | 15.3% | 11.4%(+3.91)#15 | 10.9%(+4.44)#5,555 |
| 16. | St Georges | 14.8% | 11.4%(+3.44)#16 | 10.9%(+3.97)#6,067 |
| 17. | Smyrna | 14.7% | 11.4%(+3.35)#17 | 10.9%(+3.88)#6,184 |
| 18. | Blades | 14.5% | 11.4%(+3.09)#18 | 10.9%(+3.62)#6,544 |
| 19. | Harrington | 14.0% | 11.4%(+2.63)#19 | 10.9%(+3.16)#7,196 |
| 20. | Bellefonte | 13.9% | 11.4%(+2.56)#20 | 10.9%(+3.08)#7,311 |
| 21. | Felton | 13.8% | 11.4%(+2.46)#21 | 10.9%(+2.99)#7,456 |
| 22. | Claymont | 13.7% | 11.4%(+2.37)#22 | 10.9%(+2.89)#7,600 |
| 23. | Dover | 13.7% | 11.4%(+2.36)#23 | 10.9%(+2.89)#7,603 |
| 24. | Millsboro | 13.7% | 11.4%(+2.31)#24 | 10.9%(+2.84)#7,691 |
| 25. | Leipsic | 13.5% | 11.4%(+2.10)#25 | 10.9%(+2.63)#8,047 |
| 26. | Brookside | 13.4% | 11.4%(+2.04)#26 | 10.9%(+2.56)#8,161 |
| 27. | New Castle | 11.8% | 11.4%(+0.400)#27 | 10.9%(+0.925)#11,409 |
| 28. | Pike Creek Valley | 11.8% | 11.4%(+0.386)#28 | 10.9%(+0.911)#11,428 |
| 29. | Delaware City | 11.6% | 11.4%(+0.187)#29 | 10.9%(+0.712)#11,907 |
| 30. | Bear | 11.4% | 11.4%(+0.031)#30 | 10.9%(+0.556)#12,250 |
| 31. | Ellendale | 11.2% | 11.4%(-0.211)#31 | 10.9%(+0.314)#12,767 |
| 32. | Bridgeville | 11.2% | 11.4%(-0.215)#32 | 10.9%(+0.310)#12,777 |
| 33. | Wilmington Manor | 11.0% | 11.4%(-0.341)#33 | 10.9%(+0.185)#13,104 |
| 34. | Ardentown | 11.0% | 11.4%(-0.381)#34 | 10.9%(+0.144)#13,205 |
| 35. | Milford | 10.9% | 11.4%(-0.483)#35 | 10.9%(+0.042)#13,431 |
| 36. | Highland Acres | 10.7% | 11.4%(-0.680)#36 | 10.9%(-0.155)#13,907 |
| 37. | Newport | 10.5% | 11.4%(-0.845)#37 | 10.9%(-0.320)#14,246 |
| 38. | Farmington | 10.2% | 11.4%(-1.15)#38 | 10.9%(-0.629)#15,051 |
| 39. | Newark | 10.1% | 11.4%(-1.29)#39 | 10.9%(-0.768)#15,363 |
| 40. | Greenville | 9.8% | 11.4%(-1.60)#40 | 10.9%(-1.08)#16,116 |
| 41. | Rodney Village | 9.5% | 11.4%(-1.88)#41 | 10.9%(-1.35)#16,763 |
| 42. | Edgemoor | 9.5% | 11.4%(-1.90)#42 | 10.9%(-1.37)#16,823 |
| 43. | Laurel | 9.5% | 11.4%(-1.91)#43 | 10.9%(-1.38)#16,842 |
| 44. | Wilmington | 9.2% | 11.4%(-2.16)#44 | 10.9%(-1.64)#17,439 |
| 45. | Millville | 8.9% | 11.4%(-2.51)#45 | 10.9%(-1.98)#18,242 |
| 46. | Middletown | 8.9% | 11.4%(-2.52)#46 | 10.9%(-1.99)#18,260 |
| 47. | Kent Acres | 8.8% | 11.4%(-2.56)#47 | 10.9%(-2.04)#18,362 |
| 48. | Frankford | 8.7% | 11.4%(-2.71)#48 | 10.9%(-2.19)#18,685 |
| 49. | North Star | 8.6% | 11.4%(-2.79)#49 | 10.9%(-2.27)#18,858 |
| 50. | Frederica | 8.5% | 11.4%(-2.91)#50 | 10.9%(-2.39)#19,125 |
| 51. | Georgetown | 8.0% | 11.4%(-3.42)#51 | 10.9%(-2.90)#20,172 |
| 52. | South Bethany | 7.6% | 11.4%(-3.74)#52 | 10.9%(-3.22)#20,834 |
| 53. | Camden | 7.5% | 11.4%(-3.86)#53 | 10.9%(-3.34)#21,046 |
| 54. | Dewey Beach | 7.5% | 11.4%(-3.87)#54 | 10.9%(-3.34)#21,055 |
| 55. | Ocean View | 7.5% | 11.4%(-3.90)#55 | 10.9%(-3.38)#21,115 |
| 56. | Pike Creek | 7.3% | 11.4%(-4.06)#56 | 10.9%(-3.54)#21,399 |
| 57. | Rehoboth Beach | 7.2% | 11.4%(-4.16)#57 | 10.9%(-3.63)#21,611 |
| 58. | Seaford | 7.1% | 11.4%(-4.33)#58 | 10.9%(-3.80)#21,889 |
| 59. | Ardencroft | 7.0% | 11.4%(-4.36)#59 | 10.9%(-3.84)#21,946 |
| 60. | Little Creek | 6.6% | 11.4%(-4.76)#60 | 10.9%(-4.24)#22,656 |
| 61. | Dagsboro | 6.5% | 11.4%(-4.87)#61 | 10.9%(-4.35)#22,840 |
| 62. | Milton | 6.4% | 11.4%(-4.99)#62 | 10.9%(-4.47)#23,029 |
| 63. | Delmar | 6.2% | 11.4%(-5.22)#63 | 10.9%(-4.69)#23,338 |
| 64. | Bethany Beach | 6.1% | 11.4%(-5.24)#64 | 10.9%(-4.72)#23,371 |
| 65. | Hockessin | 5.9% | 11.4%(-5.47)#65 | 10.9%(-4.94)#23,711 |
| 66. | Magnolia | 5.7% | 11.4%(-5.63)#66 | 10.9%(-5.11)#23,959 |
| 67. | Rising Sun Lebanon | 4.9% | 11.4%(-6.50)#67 | 10.9%(-5.98)#25,075 |
| 68. | Arden | 4.7% | 11.4%(-6.70)#68 | 10.9%(-6.17)#25,283 |
| 69. | Slaughter Beach | 4.6% | 11.4%(-6.78)#69 | 10.9%(-6.26)#25,364 |
| 70. | Lewes | 4.5% | 11.4%(-6.83)#70 | 10.9%(-6.31)#25,415 |
| 71. | Houston | 4.4% | 11.4%(-7.02)#71 | 10.9%(-6.49)#25,596 |
| 72. | Fenwick Island | 3.7% | 11.4%(-7.64)#72 | 10.9%(-7.12)#26,210 |
| 73. | Odessa | 3.6% | 11.4%(-7.77)#73 | 10.9%(-7.24)#26,304 |
| 74. | Woodside | 2.7% | 11.4%(-8.70)#74 | 10.9%(-8.18)#26,961 |
| 75. | Bowers | 0.98% | 11.4%(-10.4)#75 | 10.9%(-9.88)#27,687 |
| 76. | Lincoln | 0.18% | 11.4%(-11.2)#76 | 10.9%(-10.7)#27,782 |
1
Common Questions
What are the Top 10 Cities with the Highest Percentage of Population Employed in Office & Administration in Delaware?
Top 10 Cities with the Highest Percentage of Population Employed in Office & Administration in Delaware are:
What city has the Highest Percentage of Population Employed in Office & Administration in Delaware?
Viola has the Highest Percentage of Population Employed in Office & Administration in Delaware with 31.7%.
What is the Percentage of Population Employed in Office & Administration in the State of Delaware?
Percentage of Population Employed in Office & Administration in Delaware is 11.4%.
What is the Percentage of Population Employed in Office & Administration in the United States?
Percentage of Population Employed in Office & Administration in the United States is 10.9%.