Cities with the Highest Percentage of Population Employed in Office & Administration in Kansas
RELATED REPORTS & OPTIONS
Office & Administration
Kansas
Compare Cities
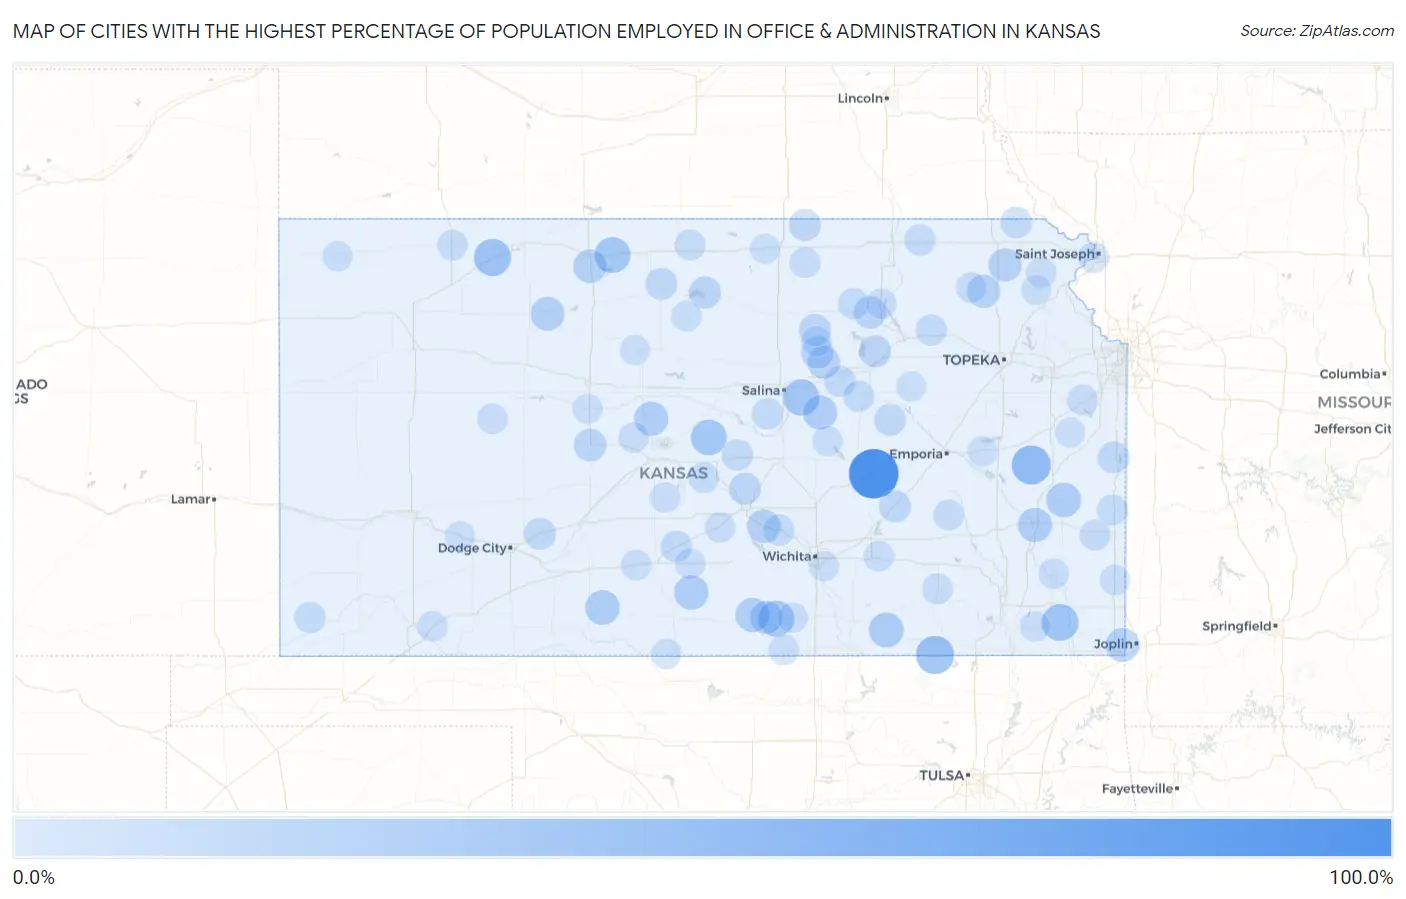
Map of Cities with the Highest Percentage of Population Employed in Office & Administration in Kansas
0.0%
100.0%
Cities with the Highest Percentage of Population Employed in Office & Administration in Kansas
| City | % Employed | vs State | vs National | |
| 1. | Cedar Point | 100.0% | 10.6%(+89.4)#1 | 10.9%(+89.1)#56 |
| 2. | Lafontaine | 75.0% | 10.6%(+64.4)#2 | 10.9%(+64.1)#74 |
| 3. | Murdock | 68.8% | 10.6%(+58.1)#3 | 10.9%(+57.9)#96 |
| 4. | Niles | 67.7% | 10.6%(+57.1)#4 | 10.9%(+56.9)#99 |
| 5. | Norway | 55.6% | 10.6%(+44.9)#5 | 10.9%(+44.7)#159 |
| 6. | Harris | 54.5% | 10.6%(+43.9)#6 | 10.9%(+43.7)#167 |
| 7. | Elgin | 50.0% | 10.6%(+39.4)#7 | 10.9%(+39.1)#214 |
| 8. | Pilsen | 46.9% | 10.6%(+36.2)#8 | 10.9%(+36.0)#261 |
| 9. | Clayton | 45.5% | 10.6%(+34.8)#9 | 10.9%(+34.6)#280 |
| 10. | Labette | 44.4% | 10.6%(+33.8)#10 | 10.9%(+33.6)#307 |
| 11. | Kipp | 42.0% | 10.6%(+31.4)#11 | 10.9%(+31.2)#359 |
| 12. | Milan | 40.9% | 10.6%(+30.3)#12 | 10.9%(+30.1)#390 |
| 13. | Agra | 40.0% | 10.6%(+29.4)#13 | 10.9%(+29.1)#412 |
| 14. | Frederick | 40.0% | 10.6%(+29.4)#14 | 10.9%(+29.1)#416 |
| 15. | South Mound | 39.3% | 10.6%(+28.7)#15 | 10.9%(+28.4)#436 |
| 16. | St. Benedict | 37.5% | 10.6%(+26.9)#16 | 10.9%(+26.6)#486 |
| 17. | Dexter | 35.8% | 10.6%(+25.2)#17 | 10.9%(+25.0)#542 |
| 18. | Kincaid | 35.5% | 10.6%(+24.9)#18 | 10.9%(+24.6)#554 |
| 19. | Wilmore | 35.3% | 10.6%(+24.7)#19 | 10.9%(+24.4)#566 |
| 20. | Nashville | 34.5% | 10.6%(+23.8)#20 | 10.9%(+23.6)#598 |
| 21. | Codell | 34.0% | 10.6%(+23.4)#21 | 10.9%(+23.1)#615 |
| 22. | Susank | 33.3% | 10.6%(+22.7)#22 | 10.9%(+22.5)#665 |
| 23. | Danville | 33.3% | 10.6%(+22.7)#23 | 10.9%(+22.5)#670 |
| 24. | Bassett | 33.3% | 10.6%(+22.7)#24 | 10.9%(+22.5)#671 |
| 25. | Carlton | 33.3% | 10.6%(+22.7)#25 | 10.9%(+22.5)#675 |
| 26. | Galena | 31.9% | 10.6%(+21.3)#26 | 10.9%(+21.1)#736 |
| 27. | Bogue | 31.6% | 10.6%(+20.9)#27 | 10.9%(+20.7)#757 |
| 28. | Glade | 31.2% | 10.6%(+20.6)#28 | 10.9%(+20.4)#777 |
| 29. | Haven | 30.4% | 10.6%(+19.8)#29 | 10.9%(+19.6)#820 |
| 30. | Circleville | 29.9% | 10.6%(+19.2)#30 | 10.9%(+19.0)#858 |
| 31. | Kickapoo Site 7 | 29.4% | 10.6%(+18.8)#31 | 10.9%(+18.6)#885 |
| 32. | Argonia | 29.2% | 10.6%(+18.6)#32 | 10.9%(+18.4)#896 |
| 33. | Talmage | 27.6% | 10.6%(+17.0)#33 | 10.9%(+16.7)#1,047 |
| 34. | Rush Center | 27.1% | 10.6%(+16.5)#34 | 10.9%(+16.3)#1,089 |
| 35. | Manchester | 27.0% | 10.6%(+16.4)#35 | 10.9%(+16.2)#1,105 |
| 36. | Leonardville | 26.7% | 10.6%(+16.0)#36 | 10.9%(+15.8)#1,137 |
| 37. | Glen Elder | 25.5% | 10.6%(+14.9)#37 | 10.9%(+14.7)#1,246 |
| 38. | Fort Riley | 25.1% | 10.6%(+14.4)#38 | 10.9%(+14.2)#1,296 |
| 39. | Oak Hill | 25.0% | 10.6%(+14.4)#39 | 10.9%(+14.1)#1,331 |
| 40. | The Highlands | 24.7% | 10.6%(+14.1)#40 | 10.9%(+13.8)#1,364 |
| 41. | Spearville | 24.6% | 10.6%(+13.9)#41 | 10.9%(+13.7)#1,379 |
| 42. | Portis | 24.6% | 10.6%(+13.9)#42 | 10.9%(+13.7)#1,384 |
| 43. | Cassoday | 24.4% | 10.6%(+13.8)#43 | 10.9%(+13.6)#1,399 |
| 44. | Narka | 24.4% | 10.6%(+13.8)#44 | 10.9%(+13.5)#1,403 |
| 45. | Linn Valley | 24.4% | 10.6%(+13.7)#45 | 10.9%(+13.5)#1,408 |
| 46. | Wilsey | 23.8% | 10.6%(+13.2)#46 | 10.9%(+13.0)#1,489 |
| 47. | Preston | 22.7% | 10.6%(+12.1)#47 | 10.9%(+11.9)#1,685 |
| 48. | Reserve | 22.6% | 10.6%(+11.9)#48 | 10.9%(+11.7)#1,718 |
| 49. | Williamstown | 22.5% | 10.6%(+11.9)#49 | 10.9%(+11.7)#1,728 |
| 50. | Ringo | 22.5% | 10.6%(+11.9)#50 | 10.9%(+11.6)#1,743 |
| 51. | Falun | 22.2% | 10.6%(+11.6)#51 | 10.9%(+11.4)#1,796 |
| 52. | Little River | 22.0% | 10.6%(+11.3)#52 | 10.9%(+11.1)#1,855 |
| 53. | Enterprise | 21.7% | 10.6%(+11.1)#53 | 10.9%(+10.8)#1,913 |
| 54. | Mount Hope | 21.6% | 10.6%(+11.0)#54 | 10.9%(+10.8)#1,935 |
| 55. | Louisville | 21.4% | 10.6%(+10.8)#55 | 10.9%(+10.6)#1,982 |
| 56. | Richfield | 21.4% | 10.6%(+10.8)#56 | 10.9%(+10.6)#1,995 |
| 57. | Woodbine | 21.3% | 10.6%(+10.7)#57 | 10.9%(+10.5)#2,015 |
| 58. | Fulton | 21.2% | 10.6%(+10.6)#58 | 10.9%(+10.4)#2,039 |
| 59. | Green | 21.1% | 10.6%(+10.4)#59 | 10.9%(+10.2)#2,090 |
| 60. | Beattie | 20.9% | 10.6%(+10.3)#60 | 10.9%(+10.0)#2,128 |
| 61. | Peck | 20.9% | 10.6%(+10.3)#61 | 10.9%(+10.0)#2,129 |
| 62. | Alden | 20.4% | 10.6%(+9.77)#62 | 10.9%(+9.55)#2,277 |
| 63. | Howard | 20.1% | 10.6%(+9.46)#63 | 10.9%(+9.23)#2,376 |
| 64. | Hamilton | 20.0% | 10.6%(+9.37)#64 | 10.9%(+9.14)#2,412 |
| 65. | Esbon | 20.0% | 10.6%(+9.37)#65 | 10.9%(+9.14)#2,431 |
| 66. | Agenda | 20.0% | 10.6%(+9.37)#66 | 10.9%(+9.14)#2,432 |
| 67. | Soldier | 20.0% | 10.6%(+9.37)#67 | 10.9%(+9.14)#2,436 |
| 68. | Elwood | 19.8% | 10.6%(+9.17)#68 | 10.9%(+8.95)#2,499 |
| 69. | Edgerton | 19.5% | 10.6%(+8.88)#69 | 10.9%(+8.65)#2,611 |
| 70. | Redfield | 19.4% | 10.6%(+8.81)#70 | 10.9%(+8.59)#2,633 |
| 71. | Oberlin | 19.3% | 10.6%(+8.69)#71 | 10.9%(+8.47)#2,671 |
| 72. | Arlington | 19.1% | 10.6%(+8.48)#72 | 10.9%(+8.25)#2,759 |
| 73. | Kismet | 19.1% | 10.6%(+8.45)#73 | 10.9%(+8.22)#2,765 |
| 74. | Leon | 19.1% | 10.6%(+8.44)#74 | 10.9%(+8.22)#2,769 |
| 75. | Cullison | 18.8% | 10.6%(+8.12)#75 | 10.9%(+7.89)#2,946 |
| 76. | Olmitz | 18.8% | 10.6%(+8.12)#76 | 10.9%(+7.89)#2,947 |
| 77. | Huron | 18.8% | 10.6%(+8.12)#77 | 10.9%(+7.89)#2,952 |
| 78. | Mound Valley | 18.7% | 10.6%(+8.07)#78 | 10.9%(+7.85)#2,972 |
| 79. | Utica | 18.5% | 10.6%(+7.83)#79 | 10.9%(+7.61)#3,107 |
| 80. | Caldwell | 18.4% | 10.6%(+7.72)#80 | 10.9%(+7.50)#3,152 |
| 81. | Erie | 18.2% | 10.6%(+7.58)#81 | 10.9%(+7.36)#3,208 |
| 82. | Randolph | 18.2% | 10.6%(+7.55)#82 | 10.9%(+7.33)#3,239 |
| 83. | Hudson | 18.2% | 10.6%(+7.55)#83 | 10.9%(+7.33)#3,246 |
| 84. | Durham | 18.2% | 10.6%(+7.55)#84 | 10.9%(+7.33)#3,251 |
| 85. | Longford | 18.2% | 10.6%(+7.55)#85 | 10.9%(+7.33)#3,252 |
| 86. | Tipton | 18.1% | 10.6%(+7.48)#86 | 10.9%(+7.26)#3,285 |
| 87. | Hardtner | 18.1% | 10.6%(+7.42)#87 | 10.9%(+7.20)#3,309 |
| 88. | Cunningham | 18.0% | 10.6%(+7.40)#88 | 10.9%(+7.18)#3,320 |
| 89. | Franklin | 18.0% | 10.6%(+7.38)#89 | 10.9%(+7.16)#3,333 |
| 90. | Bird City | 18.0% | 10.6%(+7.38)#90 | 10.9%(+7.16)#3,334 |
| 91. | Mayfield | 17.9% | 10.6%(+7.31)#91 | 10.9%(+7.09)#3,370 |
| 92. | Alta Vista | 17.7% | 10.6%(+7.05)#92 | 10.9%(+6.82)#3,518 |
| 93. | Scandia | 17.7% | 10.6%(+7.05)#93 | 10.9%(+6.82)#3,519 |
| 94. | Lebo | 17.6% | 10.6%(+6.96)#94 | 10.9%(+6.74)#3,575 |
| 95. | Mcconnell Afb | 17.3% | 10.6%(+6.70)#95 | 10.9%(+6.48)#3,744 |
| 96. | Rantoul | 17.3% | 10.6%(+6.67)#96 | 10.9%(+6.45)#3,763 |
| 97. | Ingalls | 17.3% | 10.6%(+6.63)#97 | 10.9%(+6.41)#3,792 |
| 98. | Effingham | 17.3% | 10.6%(+6.63)#98 | 10.9%(+6.41)#3,796 |
| 99. | Paradise | 17.2% | 10.6%(+6.61)#99 | 10.9%(+6.38)#3,815 |
| 100. | Schoenchen | 17.1% | 10.6%(+6.42)#100 | 10.9%(+6.20)#3,935 |
Common Questions
What are the Top 10 Cities with the Highest Percentage of Population Employed in Office & Administration in Kansas?
Top 10 Cities with the Highest Percentage of Population Employed in Office & Administration in Kansas are:
What city has the Highest Percentage of Population Employed in Office & Administration in Kansas?
Cedar Point has the Highest Percentage of Population Employed in Office & Administration in Kansas with 100.0%.
What is the Percentage of Population Employed in Office & Administration in the State of Kansas?
Percentage of Population Employed in Office & Administration in Kansas is 10.6%.
What is the Percentage of Population Employed in Office & Administration in the United States?
Percentage of Population Employed in Office & Administration in the United States is 10.9%.