Zip Codes with the Highest Percentage of Population Employed in Office & Administration in San Francisco, CA
RELATED REPORTS & OPTIONS
Office & Administration
San Francisco
Compare Zip Codes
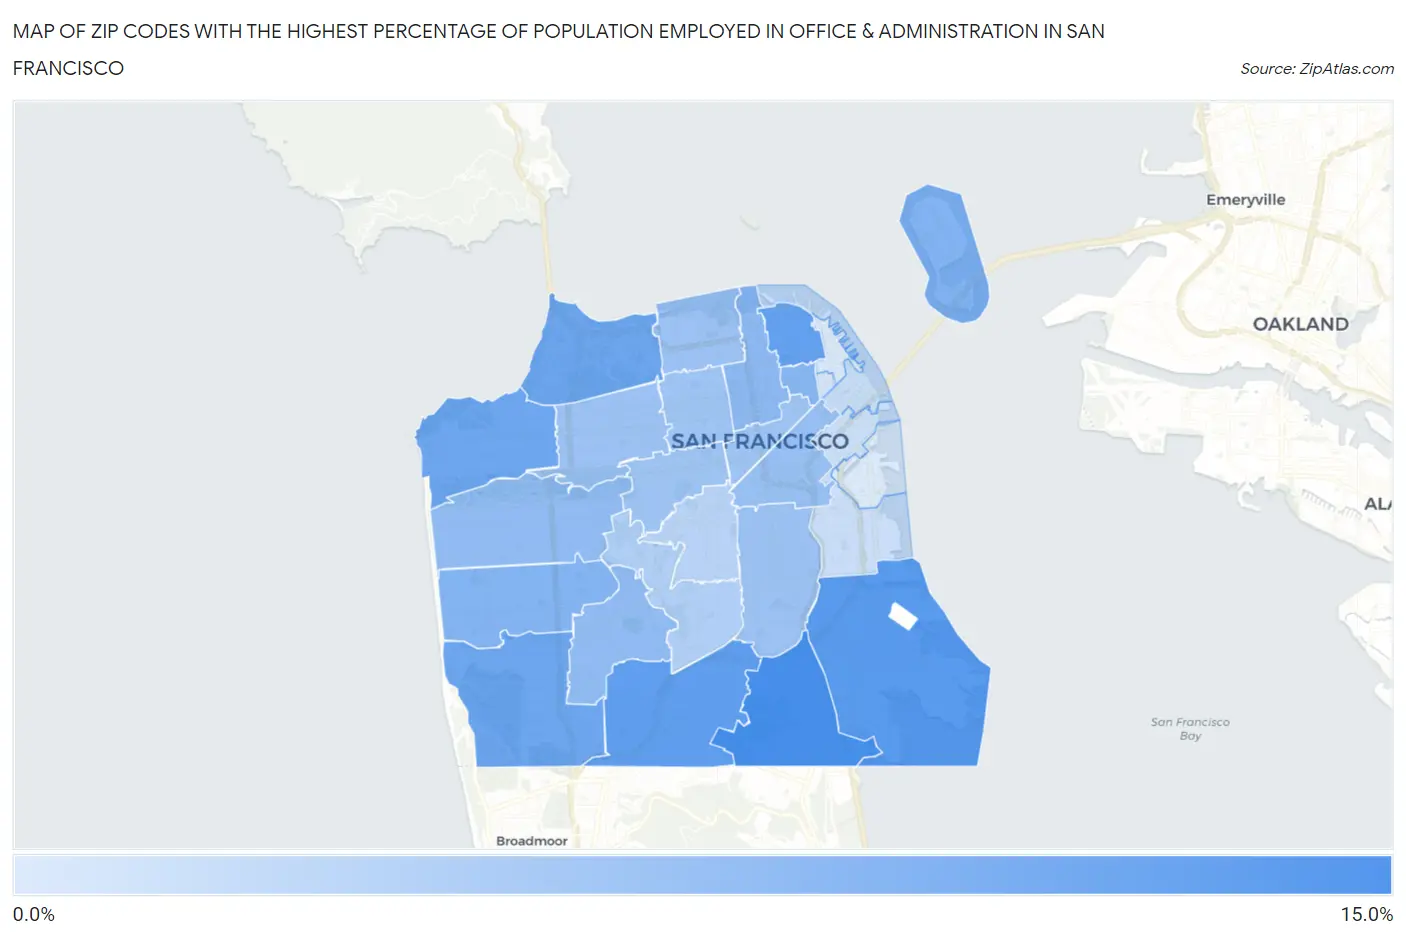
Map of Zip Codes with the Highest Percentage of Population Employed in Office & Administration in San Francisco
1.9%
13.2%
Zip Codes with the Highest Percentage of Population Employed in Office & Administration in San Francisco, CA
| Zip Code | % Employed | vs State | vs National | |
| 1. | 94134 | 13.2% | 10.5%(+2.67)#287 | 10.9%(+2.31)#7,646 |
| 2. | 94124 | 11.8% | 10.5%(+1.33)#499 | 10.9%(+0.979)#11,235 |
| 3. | 94112 | 11.2% | 10.5%(+0.703)#618 | 10.9%(+0.351)#13,184 |
| 4. | 94133 | 11.0% | 10.5%(+0.497)#652 | 10.9%(+0.144)#13,834 |
| 5. | 94129 | 10.1% | 10.5%(-0.385)#827 | 10.9%(-0.737)#16,730 |
| 6. | 94132 | 10.1% | 10.5%(-0.400)#832 | 10.9%(-0.752)#16,782 |
| 7. | 94121 | 10.1% | 10.5%(-0.415)#836 | 10.9%(-0.768)#16,836 |
| 8. | 94130 | 8.7% | 10.5%(-1.78)#1,060 | 10.9%(-2.14)#21,095 |
| 9. | 94116 | 8.5% | 10.5%(-1.99)#1,087 | 10.9%(-2.34)#21,657 |
| 10. | 94108 | 8.3% | 10.5%(-2.25)#1,122 | 10.9%(-2.60)#22,359 |
| 11. | 94109 | 7.8% | 10.5%(-2.69)#1,190 | 10.9%(-3.04)#23,446 |
| 12. | 94127 | 7.4% | 10.5%(-3.06)#1,236 | 10.9%(-3.42)#24,314 |
| 13. | 94122 | 7.4% | 10.5%(-3.07)#1,237 | 10.9%(-3.42)#24,316 |
| 14. | 94103 | 7.0% | 10.5%(-3.48)#1,280 | 10.9%(-3.83)#25,170 |
| 15. | 94123 | 6.6% | 10.5%(-3.94)#1,318 | 10.9%(-4.29)#25,995 |
| 16. | 94110 | 6.6% | 10.5%(-3.95)#1,320 | 10.9%(-4.30)#26,001 |
| 17. | 94118 | 6.6% | 10.5%(-3.95)#1,321 | 10.9%(-4.30)#26,005 |
| 18. | 94102 | 6.6% | 10.5%(-3.95)#1,322 | 10.9%(-4.30)#26,009 |
| 19. | 94117 | 6.4% | 10.5%(-4.07)#1,337 | 10.9%(-4.42)#26,207 |
| 20. | 94115 | 6.4% | 10.5%(-4.09)#1,339 | 10.9%(-4.44)#26,238 |
| 21. | 94131 | 5.0% | 10.5%(-5.47)#1,452 | 10.9%(-5.82)#28,071 |
| 22. | 94114 | 4.6% | 10.5%(-5.89)#1,474 | 10.9%(-6.25)#28,463 |
| 23. | 94105 | 3.6% | 10.5%(-6.92)#1,523 | 10.9%(-7.27)#29,303 |
| 24. | 94107 | 3.2% | 10.5%(-7.28)#1,542 | 10.9%(-7.64)#29,543 |
| 25. | 94104 | 2.6% | 10.5%(-7.86)#1,555 | 10.9%(-8.21)#29,823 |
| 26. | 94111 | 2.3% | 10.5%(-8.20)#1,569 | 10.9%(-8.56)#29,974 |
| 27. | 94158 | 1.9% | 10.5%(-8.55)#1,579 | 10.9%(-8.91)#30,119 |
1
Common Questions
What are the Top 10 Zip Codes with the Highest Percentage of Population Employed in Office & Administration in San Francisco, CA?
Top 10 Zip Codes with the Highest Percentage of Population Employed in Office & Administration in San Francisco, CA are:
What zip code has the Highest Percentage of Population Employed in Office & Administration in San Francisco, CA?
94134 has the Highest Percentage of Population Employed in Office & Administration in San Francisco, CA with 13.2%.
What is the Percentage of Population Employed in Office & Administration in San Francisco, CA?
Percentage of Population Employed in Office & Administration in San Francisco is 7.7%.
What is the Percentage of Population Employed in Office & Administration in California?
Percentage of Population Employed in Office & Administration in California is 10.5%.
What is the Percentage of Population Employed in Office & Administration in the United States?
Percentage of Population Employed in Office & Administration in the United States is 10.9%.