Zip Codes with the Highest Percentage of Population Employed in Office & Administration in Sacramento, CA
RELATED REPORTS & OPTIONS
Office & Administration
Sacramento
Compare Zip Codes
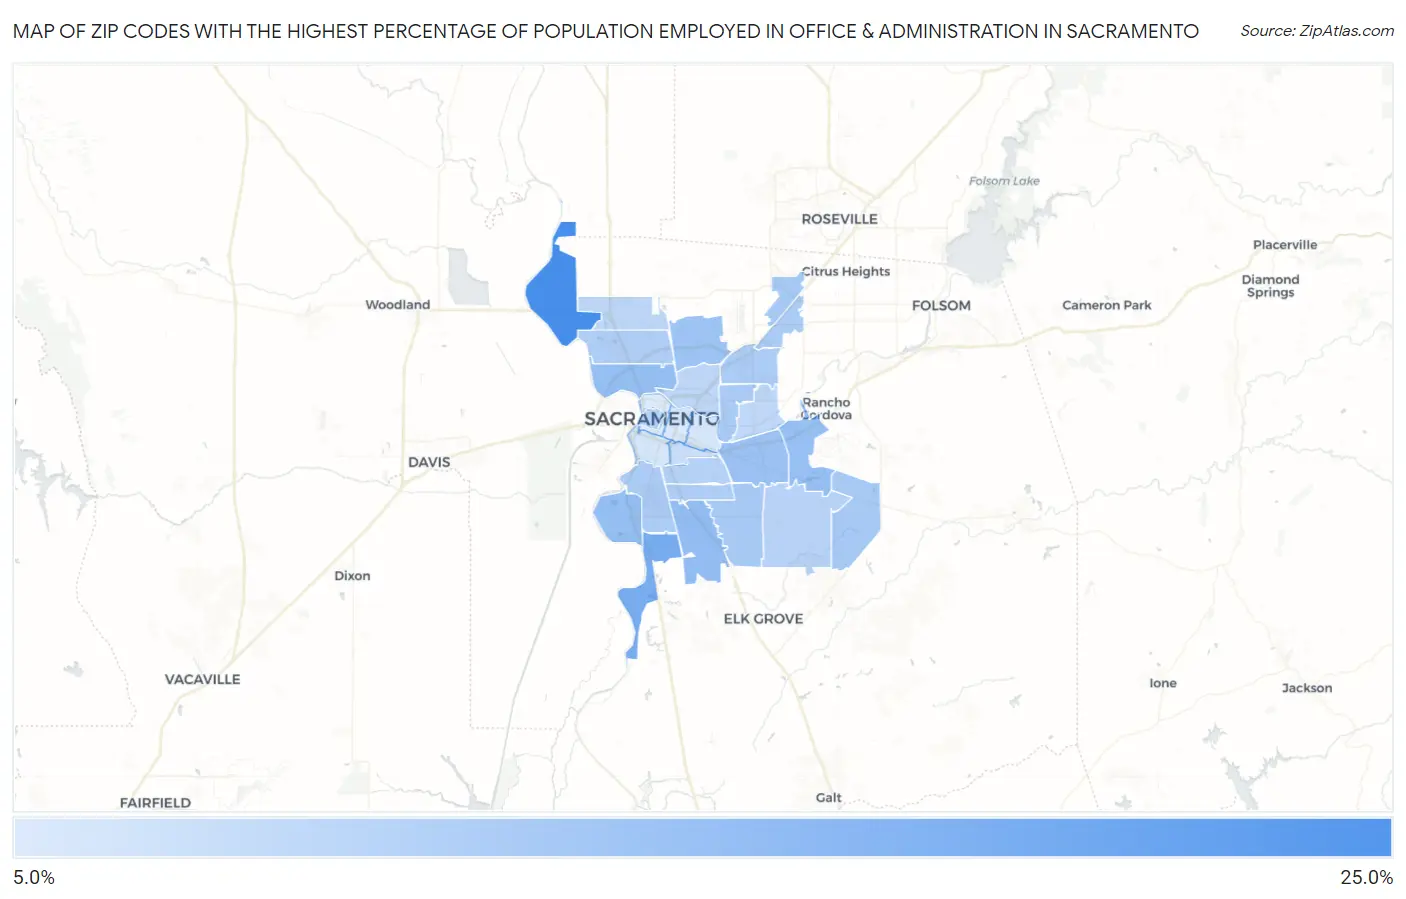
Map of Zip Codes with the Highest Percentage of Population Employed in Office & Administration in Sacramento
7.1%
24.8%
Zip Codes with the Highest Percentage of Population Employed in Office & Administration in Sacramento, CA
| Zip Code | % Employed | vs State | vs National | |
| 1. | 95837 | 24.8% | 10.5%(+14.3)#34 | 10.9%(+14.0)#940 |
| 2. | 95832 | 18.7% | 10.5%(+8.18)#64 | 10.9%(+7.82)#2,087 |
| 3. | 95823 | 15.4% | 10.5%(+4.86)#129 | 10.9%(+4.51)#4,132 |
| 4. | 95833 | 15.2% | 10.5%(+4.70)#134 | 10.9%(+4.35)#4,312 |
| 5. | 95831 | 15.1% | 10.5%(+4.64)#142 | 10.9%(+4.29)#4,394 |
| 6. | 95827 | 15.1% | 10.5%(+4.55)#149 | 10.9%(+4.20)#4,494 |
| 7. | 95826 | 14.6% | 10.5%(+4.07)#176 | 10.9%(+3.71)#5,162 |
| 8. | 95838 | 14.2% | 10.5%(+3.71)#198 | 10.9%(+3.35)#5,693 |
| 9. | 95830 | 13.2% | 10.5%(+2.66)#288 | 10.9%(+2.31)#7,657 |
| 10. | 95842 | 13.1% | 10.5%(+2.64)#294 | 10.9%(+2.28)#7,720 |
| 11. | 95828 | 12.9% | 10.5%(+2.42)#324 | 10.9%(+2.07)#8,242 |
| 12. | 95825 | 12.8% | 10.5%(+2.29)#341 | 10.9%(+1.94)#8,550 |
| 13. | 95841 | 12.6% | 10.5%(+2.14)#368 | 10.9%(+1.79)#8,928 |
| 14. | 95821 | 12.6% | 10.5%(+2.08)#372 | 10.9%(+1.73)#9,068 |
| 15. | 95822 | 12.4% | 10.5%(+1.92)#392 | 10.9%(+1.57)#9,516 |
| 16. | 95834 | 12.3% | 10.5%(+1.83)#403 | 10.9%(+1.48)#9,763 |
| 17. | 95824 | 12.2% | 10.5%(+1.68)#433 | 10.9%(+1.32)#10,210 |
| 18. | 95820 | 11.5% | 10.5%(+0.963)#570 | 10.9%(+0.610)#12,340 |
| 19. | 95814 | 11.3% | 10.5%(+0.788)#600 | 10.9%(+0.436)#12,906 |
| 20. | 95829 | 11.1% | 10.5%(+0.599)#638 | 10.9%(+0.247)#13,528 |
| 21. | 95815 | 10.8% | 10.5%(+0.291)#703 | 10.9%(-0.062)#14,522 |
| 22. | 95835 | 10.8% | 10.5%(+0.253)#709 | 10.9%(-0.100)#14,631 |
| 23. | 95864 | 10.3% | 10.5%(-0.183)#793 | 10.9%(-0.535)#16,089 |
| 24. | 95817 | 9.4% | 10.5%(-1.10)#958 | 10.9%(-1.46)#19,082 |
| 25. | 95818 | 7.9% | 10.5%(-2.63)#1,181 | 10.9%(-2.99)#23,337 |
| 26. | 95819 | 7.8% | 10.5%(-2.68)#1,188 | 10.9%(-3.04)#23,435 |
| 27. | 95816 | 7.4% | 10.5%(-3.12)#1,242 | 10.9%(-3.47)#24,427 |
| 28. | 95811 | 7.1% | 10.5%(-3.43)#1,276 | 10.9%(-3.78)#25,063 |
1
Common Questions
What are the Top 10 Zip Codes with the Highest Percentage of Population Employed in Office & Administration in Sacramento, CA?
Top 10 Zip Codes with the Highest Percentage of Population Employed in Office & Administration in Sacramento, CA are:
What zip code has the Highest Percentage of Population Employed in Office & Administration in Sacramento, CA?
95837 has the Highest Percentage of Population Employed in Office & Administration in Sacramento, CA with 24.8%.
What is the Percentage of Population Employed in Office & Administration in Sacramento, CA?
Percentage of Population Employed in Office & Administration in Sacramento is 12.3%.
What is the Percentage of Population Employed in Office & Administration in California?
Percentage of Population Employed in Office & Administration in California is 10.5%.
What is the Percentage of Population Employed in Office & Administration in the United States?
Percentage of Population Employed in Office & Administration in the United States is 10.9%.