Cities with the Highest Percentage of Population Employed in Office & Administration in South Dakota
RELATED REPORTS & OPTIONS
Office & Administration
South Dakota
Compare Cities
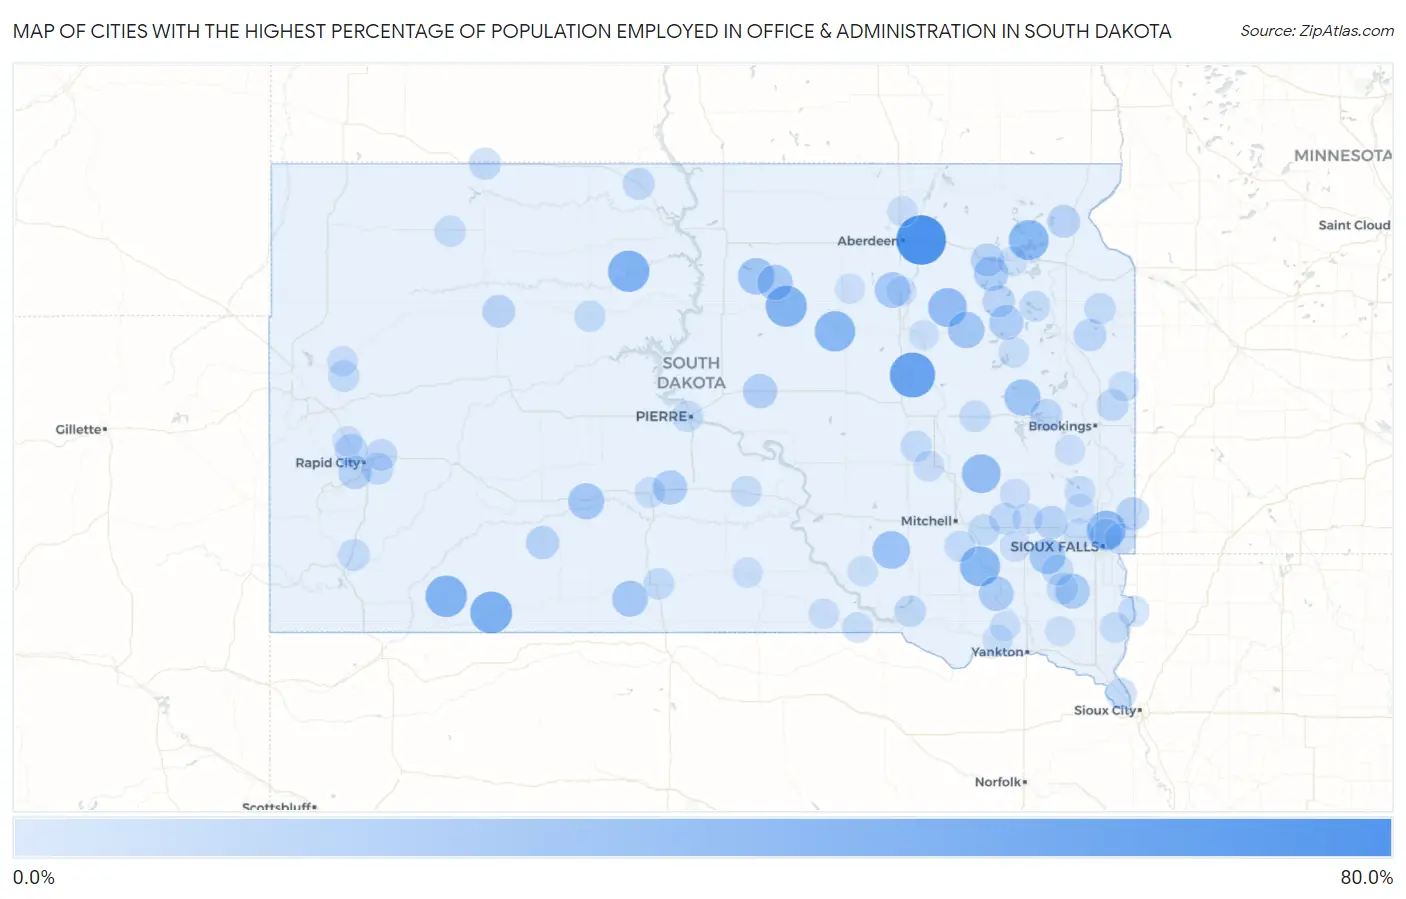
Map of Cities with the Highest Percentage of Population Employed in Office & Administration in South Dakota
0.0%
80.0%
Cities with the Highest Percentage of Population Employed in Office & Administration in South Dakota
| City | % Employed | vs State | vs National | |
| 1. | Bath | 66.0% | 10.9%(+55.1)#1 | 10.9%(+55.1)#104 |
| 2. | Cherry Creek | 55.6% | 10.9%(+44.7)#2 | 10.9%(+44.7)#155 |
| 3. | Hitchcock | 54.1% | 10.9%(+43.1)#3 | 10.9%(+43.2)#169 |
| 4. | Lantry | 47.6% | 10.9%(+36.7)#4 | 10.9%(+36.8)#254 |
| 5. | Batesland | 45.0% | 10.9%(+34.1)#5 | 10.9%(+34.1)#291 |
| 6. | Manderson White Horse Creek | 43.6% | 10.9%(+32.7)#6 | 10.9%(+32.8)#319 |
| 7. | Whitehorse | 43.5% | 10.9%(+32.6)#7 | 10.9%(+32.7)#323 |
| 8. | Seneca | 42.9% | 10.9%(+32.0)#8 | 10.9%(+32.0)#339 |
| 9. | Smithwick | 42.9% | 10.9%(+32.0)#9 | 10.9%(+32.0)#340 |
| 10. | Orient | 40.9% | 10.9%(+30.0)#10 | 10.9%(+30.1)#393 |
| 11. | Milltown | 40.0% | 10.9%(+29.1)#11 | 10.9%(+29.1)#422 |
| 12. | Grenville | 39.5% | 10.9%(+28.6)#12 | 10.9%(+28.7)#431 |
| 13. | Renner Corner | 36.9% | 10.9%(+26.0)#13 | 10.9%(+26.0)#500 |
| 14. | Turton | 36.4% | 10.9%(+25.5)#14 | 10.9%(+25.5)#524 |
| 15. | Fedora | 36.4% | 10.9%(+25.5)#15 | 10.9%(+25.5)#526 |
| 16. | Peever Flats | 35.5% | 10.9%(+24.6)#16 | 10.9%(+24.6)#553 |
| 17. | Orland Colony | 33.3% | 10.9%(+22.4)#17 | 10.9%(+22.5)#664 |
| 18. | Aurora Center | 33.3% | 10.9%(+22.4)#18 | 10.9%(+22.5)#667 |
| 19. | Hoven | 30.4% | 10.9%(+19.5)#19 | 10.9%(+19.5)#822 |
| 20. | Raymond | 30.0% | 10.9%(+19.1)#20 | 10.9%(+19.1)#847 |
| 21. | Erwin | 30.0% | 10.9%(+19.1)#21 | 10.9%(+19.1)#849 |
| 22. | Belvidere | 29.4% | 10.9%(+18.5)#22 | 10.9%(+18.6)#884 |
| 23. | Two Strike | 28.8% | 10.9%(+17.9)#23 | 10.9%(+18.0)#928 |
| 24. | Monroe | 28.2% | 10.9%(+17.3)#24 | 10.9%(+17.3)#990 |
| 25. | Northville | 27.8% | 10.9%(+16.9)#25 | 10.9%(+17.0)#1,018 |
| 26. | Tolstoy | 27.6% | 10.9%(+16.7)#26 | 10.9%(+16.7)#1,050 |
| 27. | Olivet | 25.7% | 10.9%(+14.8)#27 | 10.9%(+14.9)#1,226 |
| 28. | Davis | 25.6% | 10.9%(+14.7)#28 | 10.9%(+14.7)#1,241 |
| 29. | Garden City | 25.0% | 10.9%(+14.1)#29 | 10.9%(+14.1)#1,315 |
| 30. | Draper | 25.0% | 10.9%(+14.1)#30 | 10.9%(+14.1)#1,333 |
| 31. | Butler | 25.0% | 10.9%(+14.1)#31 | 10.9%(+14.1)#1,336 |
| 32. | Harrold | 24.5% | 10.9%(+13.6)#32 | 10.9%(+13.7)#1,393 |
| 33. | Lyons | 23.8% | 10.9%(+12.9)#33 | 10.9%(+13.0)#1,491 |
| 34. | Enemy Swim | 22.4% | 10.9%(+11.5)#34 | 10.9%(+11.6)#1,757 |
| 35. | Colonial Pine Hills | 22.0% | 10.9%(+11.1)#35 | 10.9%(+11.2)#1,842 |
| 36. | Wanblee | 22.0% | 10.9%(+11.1)#36 | 10.9%(+11.1)#1,846 |
| 37. | Montrose | 21.9% | 10.9%(+11.0)#37 | 10.9%(+11.0)#1,868 |
| 38. | Bristol | 21.5% | 10.9%(+10.6)#38 | 10.9%(+10.6)#1,970 |
| 39. | Sherman | 21.4% | 10.9%(+10.5)#39 | 10.9%(+10.6)#1,990 |
| 40. | Faith | 20.6% | 10.9%(+9.74)#40 | 10.9%(+9.79)#2,205 |
| 41. | Agency Village | 20.6% | 10.9%(+9.69)#41 | 10.9%(+9.74)#2,223 |
| 42. | Blackhawk | 20.1% | 10.9%(+9.21)#42 | 10.9%(+9.26)#2,367 |
| 43. | Bradley | 20.0% | 10.9%(+9.10)#43 | 10.9%(+9.14)#2,426 |
| 44. | Goodwin | 20.0% | 10.9%(+9.10)#44 | 10.9%(+9.14)#2,428 |
| 45. | Meadow View Addition | 19.9% | 10.9%(+8.95)#45 | 10.9%(+8.99)#2,480 |
| 46. | Hetland | 18.8% | 10.9%(+7.85)#46 | 10.9%(+7.89)#2,956 |
| 47. | Lemmon | 18.6% | 10.9%(+7.67)#47 | 10.9%(+7.72)#3,038 |
| 48. | Green Valley | 18.4% | 10.9%(+7.47)#48 | 10.9%(+7.52)#3,145 |
| 49. | White | 18.3% | 10.9%(+7.40)#49 | 10.9%(+7.45)#3,174 |
| 50. | Mclaughlin | 18.3% | 10.9%(+7.39)#50 | 10.9%(+7.44)#3,181 |
| 51. | Ravinia | 18.2% | 10.9%(+7.28)#51 | 10.9%(+7.33)#3,250 |
| 52. | Spencer | 17.9% | 10.9%(+7.04)#52 | 10.9%(+7.09)#3,368 |
| 53. | Box Elder | 17.9% | 10.9%(+7.03)#53 | 10.9%(+7.08)#3,383 |
| 54. | Buffalo Gap | 17.6% | 10.9%(+6.74)#54 | 10.9%(+6.79)#3,543 |
| 55. | Alexandria | 17.5% | 10.9%(+6.59)#55 | 10.9%(+6.64)#3,640 |
| 56. | Hurley | 17.3% | 10.9%(+6.36)#56 | 10.9%(+6.41)#3,797 |
| 57. | Strandburg | 17.1% | 10.9%(+6.24)#57 | 10.9%(+6.29)#3,888 |
| 58. | Alpena | 17.0% | 10.9%(+6.12)#58 | 10.9%(+6.16)#3,962 |
| 59. | Vale | 17.0% | 10.9%(+6.12)#59 | 10.9%(+6.16)#3,964 |
| 60. | Iroquois | 17.0% | 10.9%(+6.08)#60 | 10.9%(+6.12)#3,986 |
| 61. | Eagle Butte | 17.0% | 10.9%(+6.07)#61 | 10.9%(+6.12)#3,990 |
| 62. | Antelope | 17.0% | 10.9%(+6.06)#62 | 10.9%(+6.11)#3,997 |
| 63. | Fort Pierre | 16.9% | 10.9%(+6.03)#63 | 10.9%(+6.08)#4,019 |
| 64. | Parker | 16.9% | 10.9%(+6.02)#64 | 10.9%(+6.07)#4,027 |
| 65. | Hudson | 16.7% | 10.9%(+5.76)#65 | 10.9%(+5.81)#4,187 |
| 66. | Mountain Plains | 16.6% | 10.9%(+5.71)#66 | 10.9%(+5.76)#4,259 |
| 67. | Bison | 16.6% | 10.9%(+5.69)#67 | 10.9%(+5.74)#4,274 |
| 68. | Ethan | 16.5% | 10.9%(+5.56)#68 | 10.9%(+5.61)#4,364 |
| 69. | Florence | 16.1% | 10.9%(+5.20)#69 | 10.9%(+5.25)#4,673 |
| 70. | Jefferson | 16.0% | 10.9%(+5.11)#70 | 10.9%(+5.16)#4,761 |
| 71. | Chester | 15.9% | 10.9%(+4.97)#71 | 10.9%(+5.02)#4,915 |
| 72. | Kennebec | 15.8% | 10.9%(+4.92)#72 | 10.9%(+4.97)#4,957 |
| 73. | West Brule | 15.8% | 10.9%(+4.89)#73 | 10.9%(+4.93)#4,983 |
| 74. | Salem | 15.7% | 10.9%(+4.76)#74 | 10.9%(+4.81)#5,119 |
| 75. | Hartford | 15.6% | 10.9%(+4.70)#75 | 10.9%(+4.75)#5,181 |
| 76. | Alcester | 15.5% | 10.9%(+4.62)#76 | 10.9%(+4.67)#5,264 |
| 77. | Murdo | 15.5% | 10.9%(+4.55)#77 | 10.9%(+4.60)#5,351 |
| 78. | Woonsocket | 15.4% | 10.9%(+4.50)#78 | 10.9%(+4.55)#5,397 |
| 79. | Naples | 15.4% | 10.9%(+4.48)#79 | 10.9%(+4.53)#5,449 |
| 80. | Wonderland Homes | 15.4% | 10.9%(+4.46)#80 | 10.9%(+4.51)#5,470 |
| 81. | Brandon | 15.3% | 10.9%(+4.44)#81 | 10.9%(+4.49)#5,495 |
| 82. | Fairfax | 15.2% | 10.9%(+4.25)#82 | 10.9%(+4.30)#5,699 |
| 83. | Bridgewater | 15.1% | 10.9%(+4.15)#83 | 10.9%(+4.20)#5,803 |
| 84. | Newell | 15.0% | 10.9%(+4.11)#84 | 10.9%(+4.16)#5,850 |
| 85. | Herrick | 14.8% | 10.9%(+3.91)#85 | 10.9%(+3.96)#6,088 |
| 86. | Westport | 14.7% | 10.9%(+3.80)#86 | 10.9%(+3.85)#6,228 |
| 87. | Winner | 14.5% | 10.9%(+3.59)#87 | 10.9%(+3.64)#6,512 |
| 88. | Astoria | 14.4% | 10.9%(+3.54)#88 | 10.9%(+3.59)#6,597 |
| 89. | Platte | 14.4% | 10.9%(+3.48)#89 | 10.9%(+3.53)#6,651 |
| 90. | Tabor | 14.4% | 10.9%(+3.45)#90 | 10.9%(+3.50)#6,696 |
| 91. | Canova | 14.3% | 10.9%(+3.38)#91 | 10.9%(+3.43)#6,818 |
| 92. | Lesterville | 14.3% | 10.9%(+3.38)#92 | 10.9%(+3.43)#6,822 |
| 93. | Nunda | 14.3% | 10.9%(+3.38)#93 | 10.9%(+3.43)#6,836 |
| 94. | Colton | 14.0% | 10.9%(+3.13)#94 | 10.9%(+3.18)#7,148 |
| 95. | Frankfort | 14.0% | 10.9%(+3.13)#95 | 10.9%(+3.18)#7,157 |
| 96. | Webster | 14.0% | 10.9%(+3.06)#96 | 10.9%(+3.11)#7,273 |
| 97. | Piedmont | 14.0% | 10.9%(+3.05)#97 | 10.9%(+3.10)#7,283 |
| 98. | Cresbard | 14.0% | 10.9%(+3.05)#98 | 10.9%(+3.10)#7,292 |
| 99. | Mellette | 13.9% | 10.9%(+3.02)#99 | 10.9%(+3.07)#7,338 |
| 100. | Wakonda | 13.8% | 10.9%(+2.92)#100 | 10.9%(+2.96)#7,478 |
Common Questions
What are the Top 10 Cities with the Highest Percentage of Population Employed in Office & Administration in South Dakota?
Top 10 Cities with the Highest Percentage of Population Employed in Office & Administration in South Dakota are:
#1
66.0%
#2
54.1%
#3
45.0%
#4
43.6%
#5
43.5%
#6
42.9%
#7
40.9%
#8
40.0%
#9
39.5%
#10
36.9%
What city has the Highest Percentage of Population Employed in Office & Administration in South Dakota?
Bath has the Highest Percentage of Population Employed in Office & Administration in South Dakota with 66.0%.
What is the Percentage of Population Employed in Office & Administration in the State of South Dakota?
Percentage of Population Employed in Office & Administration in South Dakota is 10.9%.
What is the Percentage of Population Employed in Office & Administration in the United States?
Percentage of Population Employed in Office & Administration in the United States is 10.9%.