Cities with the Highest Percentage of Population Employed in Office & Administration in Utah
RELATED REPORTS & OPTIONS
Office & Administration
Utah
Compare Cities
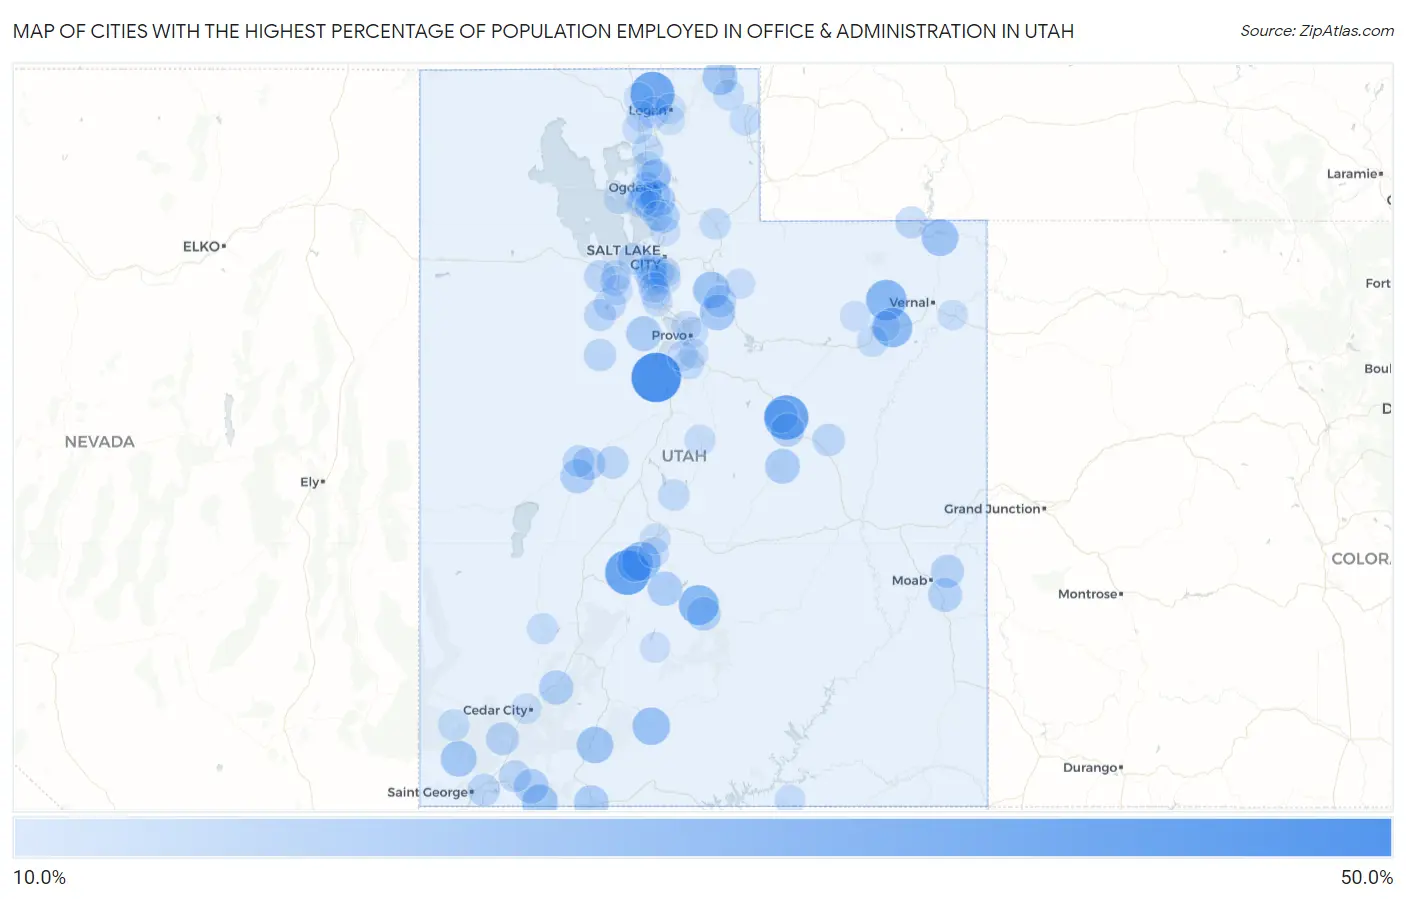
Map of Cities with the Highest Percentage of Population Employed in Office & Administration in Utah
0.0%
50.0%
Cities with the Highest Percentage of Population Employed in Office & Administration in Utah
| City | % Employed | vs State | vs National | |
| 1. | Elberta | 46.9% | 12.7%(+34.2)#1 | 10.9%(+36.0)#260 |
| 2. | Joseph | 38.2% | 12.7%(+25.5)#2 | 10.9%(+27.3)#464 |
| 3. | Kenilworth | 37.7% | 12.7%(+25.0)#3 | 10.9%(+26.8)#477 |
| 4. | Cache | 37.0% | 12.7%(+24.3)#4 | 10.9%(+26.1)#498 |
| 5. | Whiterocks | 30.8% | 12.7%(+18.1)#5 | 10.9%(+19.9)#797 |
| 6. | Lyman | 29.7% | 12.7%(+17.0)#6 | 10.9%(+18.8)#866 |
| 7. | Fort Duchesne | 28.9% | 12.7%(+16.2)#7 | 10.9%(+18.0)#925 |
| 8. | Central Valley | 27.9% | 12.7%(+15.2)#8 | 10.9%(+17.0)#1,015 |
| 9. | Henrieville | 25.5% | 12.7%(+12.8)#9 | 10.9%(+14.7)#1,254 |
| 10. | Flaming Gorge | 24.2% | 12.7%(+11.6)#10 | 10.9%(+13.4)#1,429 |
| 11. | Alton | 23.9% | 12.7%(+11.3)#11 | 10.9%(+13.1)#1,464 |
| 12. | Interlaken | 23.6% | 12.7%(+11.0)#12 | 10.9%(+12.8)#1,524 |
| 13. | Elsinore | 23.3% | 12.7%(+10.6)#13 | 10.9%(+12.4)#1,592 |
| 14. | Hildale | 22.8% | 12.7%(+10.1)#14 | 10.9%(+11.9)#1,671 |
| 15. | Veyo | 22.7% | 12.7%(+10.0)#15 | 10.9%(+11.8)#1,695 |
| 16. | Wallsburg | 22.1% | 12.7%(+9.46)#16 | 10.9%(+11.3)#1,814 |
| 17. | Brighton | 21.7% | 12.7%(+9.01)#17 | 10.9%(+10.8)#1,916 |
| 18. | South Weber | 21.7% | 12.7%(+8.97)#18 | 10.9%(+10.8)#1,924 |
| 19. | Garden City | 21.2% | 12.7%(+8.55)#19 | 10.9%(+10.4)#2,034 |
| 20. | Fairfield | 21.2% | 12.7%(+8.47)#20 | 10.9%(+10.3)#2,062 |
| 21. | Cleveland | 21.0% | 12.7%(+8.32)#21 | 10.9%(+10.1)#2,102 |
| 22. | Kanab | 20.6% | 12.7%(+7.92)#22 | 10.9%(+9.75)#2,222 |
| 23. | Rockville | 20.6% | 12.7%(+7.91)#23 | 10.9%(+9.73)#2,229 |
| 24. | Koosharem | 20.3% | 12.7%(+7.59)#24 | 10.9%(+9.41)#2,318 |
| 25. | Parowan | 19.9% | 12.7%(+7.23)#25 | 10.9%(+9.06)#2,462 |
| 26. | Harrisville | 19.7% | 12.7%(+6.97)#26 | 10.9%(+8.80)#2,548 |
| 27. | Deseret | 19.6% | 12.7%(+6.91)#27 | 10.9%(+8.73)#2,574 |
| 28. | Fruit Heights | 19.4% | 12.7%(+6.68)#28 | 10.9%(+8.51)#2,654 |
| 29. | Spanish Valley | 19.3% | 12.7%(+6.60)#29 | 10.9%(+8.43)#2,686 |
| 30. | Bicknell | 19.2% | 12.7%(+6.57)#30 | 10.9%(+8.39)#2,697 |
| 31. | Helper | 18.9% | 12.7%(+6.24)#31 | 10.9%(+8.06)#2,842 |
| 32. | Price | 18.6% | 12.7%(+5.93)#32 | 10.9%(+7.75)#3,014 |
| 33. | West Haven | 18.2% | 12.7%(+5.54)#33 | 10.9%(+7.36)#3,207 |
| 34. | Castle Valley | 18.2% | 12.7%(+5.50)#34 | 10.9%(+7.33)#3,228 |
| 35. | New Harmony | 17.8% | 12.7%(+5.13)#35 | 10.9%(+6.95)#3,448 |
| 36. | Kearns | 17.5% | 12.7%(+4.83)#36 | 10.9%(+6.65)#3,627 |
| 37. | Delta | 17.4% | 12.7%(+4.70)#37 | 10.9%(+6.53)#3,720 |
| 38. | Oak City | 17.2% | 12.7%(+4.49)#38 | 10.9%(+6.32)#3,856 |
| 39. | Washington | 17.1% | 12.7%(+4.47)#39 | 10.9%(+6.29)#3,878 |
| 40. | Daniel | 17.0% | 12.7%(+4.34)#40 | 10.9%(+6.16)#3,969 |
| 41. | East Carbon | 17.0% | 12.7%(+4.27)#41 | 10.9%(+6.10)#4,005 |
| 42. | Vernon | 16.9% | 12.7%(+4.19)#42 | 10.9%(+6.01)#4,061 |
| 43. | Stockton | 16.6% | 12.7%(+3.91)#43 | 10.9%(+5.74)#4,273 |
| 44. | Rush Valley | 16.5% | 12.7%(+3.80)#44 | 10.9%(+5.63)#4,351 |
| 45. | White | 16.4% | 12.7%(+3.74)#45 | 10.9%(+5.56)#4,411 |
| 46. | Manila | 16.3% | 12.7%(+3.63)#46 | 10.9%(+5.46)#4,493 |
| 47. | Sutherland | 16.3% | 12.7%(+3.57)#47 | 10.9%(+5.39)#4,553 |
| 48. | Virgin | 16.2% | 12.7%(+3.55)#48 | 10.9%(+5.37)#4,571 |
| 49. | Taylorsville | 16.1% | 12.7%(+3.46)#49 | 10.9%(+5.28)#4,646 |
| 50. | Grantsville | 16.1% | 12.7%(+3.42)#50 | 10.9%(+5.25)#4,674 |
| 51. | Magna | 16.0% | 12.7%(+3.31)#51 | 10.9%(+5.13)#4,796 |
| 52. | West Valley City | 15.8% | 12.7%(+3.12)#52 | 10.9%(+4.95)#4,971 |
| 53. | Enterprise | 15.5% | 12.7%(+2.79)#53 | 10.9%(+4.62)#5,332 |
| 54. | Echo | 15.4% | 12.7%(+2.70)#54 | 10.9%(+4.53)#5,448 |
| 55. | Gunnison | 15.4% | 12.7%(+2.68)#55 | 10.9%(+4.50)#5,480 |
| 56. | Myton | 15.2% | 12.7%(+2.56)#56 | 10.9%(+4.38)#5,608 |
| 57. | Mendon | 15.1% | 12.7%(+2.43)#57 | 10.9%(+4.25)#5,735 |
| 58. | Perry | 15.1% | 12.7%(+2.38)#58 | 10.9%(+4.20)#5,796 |
| 59. | Midvale | 15.0% | 12.7%(+2.34)#59 | 10.9%(+4.17)#5,837 |
| 60. | West Jordan | 15.0% | 12.7%(+2.33)#60 | 10.9%(+4.15)#5,858 |
| 61. | Randolph | 14.9% | 12.7%(+2.25)#61 | 10.9%(+4.07)#5,946 |
| 62. | Washington Terrace | 14.9% | 12.7%(+2.22)#62 | 10.9%(+4.04)#5,979 |
| 63. | Minersville | 14.8% | 12.7%(+2.13)#63 | 10.9%(+3.96)#6,076 |
| 64. | Laketown | 14.7% | 12.7%(+2.06)#64 | 10.9%(+3.89)#6,170 |
| 65. | Salem | 14.7% | 12.7%(+2.04)#65 | 10.9%(+3.86)#6,207 |
| 66. | Clinton | 14.7% | 12.7%(+2.03)#66 | 10.9%(+3.86)#6,211 |
| 67. | Roy | 14.5% | 12.7%(+1.81)#67 | 10.9%(+3.64)#6,513 |
| 68. | Moroni | 14.4% | 12.7%(+1.70)#68 | 10.9%(+3.52)#6,665 |
| 69. | West Point | 14.3% | 12.7%(+1.66)#69 | 10.9%(+3.48)#6,717 |
| 70. | Provo | 14.2% | 12.7%(+1.52)#70 | 10.9%(+3.34)#6,941 |
| 71. | Navajo Mountain | 14.2% | 12.7%(+1.52)#71 | 10.9%(+3.34)#6,948 |
| 72. | Riverton | 14.2% | 12.7%(+1.48)#72 | 10.9%(+3.31)#6,990 |
| 73. | Sigurd | 14.0% | 12.7%(+1.35)#73 | 10.9%(+3.18)#7,153 |
| 74. | North Ogden | 14.0% | 12.7%(+1.34)#74 | 10.9%(+3.16)#7,189 |
| 75. | Murray | 14.0% | 12.7%(+1.30)#75 | 10.9%(+3.13)#7,234 |
| 76. | South Jordan | 13.8% | 12.7%(+1.14)#76 | 10.9%(+2.96)#7,479 |
| 77. | Logan | 13.8% | 12.7%(+1.13)#77 | 10.9%(+2.95)#7,494 |
| 78. | Stansbury Park | 13.8% | 12.7%(+1.12)#78 | 10.9%(+2.94)#7,510 |
| 79. | Glenwood | 13.8% | 12.7%(+1.11)#79 | 10.9%(+2.94)#7,516 |
| 80. | Deweyville | 13.8% | 12.7%(+1.11)#80 | 10.9%(+2.94)#7,517 |
| 81. | Antimony | 13.8% | 12.7%(+1.11)#81 | 10.9%(+2.94)#7,526 |
| 82. | Bluffdale | 13.8% | 12.7%(+1.07)#82 | 10.9%(+2.90)#7,590 |
| 83. | Bear River City | 13.7% | 12.7%(+1.07)#83 | 10.9%(+2.89)#7,601 |
| 84. | Clearfield | 13.7% | 12.7%(+1.04)#84 | 10.9%(+2.86)#7,643 |
| 85. | Orem | 13.7% | 12.7%(+1.03)#85 | 10.9%(+2.86)#7,647 |
| 86. | Hooper | 13.7% | 12.7%(+1.01)#86 | 10.9%(+2.83)#7,700 |
| 87. | Bluebell | 13.6% | 12.7%(+0.955)#87 | 10.9%(+2.78)#7,778 |
| 88. | Centerville | 13.6% | 12.7%(+0.946)#88 | 10.9%(+2.77)#7,804 |
| 89. | Jensen | 13.6% | 12.7%(+0.924)#89 | 10.9%(+2.75)#7,831 |
| 90. | Tooele | 13.6% | 12.7%(+0.912)#90 | 10.9%(+2.74)#7,852 |
| 91. | Cedar City | 13.5% | 12.7%(+0.855)#91 | 10.9%(+2.68)#7,956 |
| 92. | Erda | 13.5% | 12.7%(+0.846)#92 | 10.9%(+2.67)#7,969 |
| 93. | Woodland | 13.5% | 12.7%(+0.811)#93 | 10.9%(+2.64)#8,030 |
| 94. | Benjamin | 13.4% | 12.7%(+0.689)#94 | 10.9%(+2.51)#8,251 |
| 95. | Ballard | 13.4% | 12.7%(+0.680)#95 | 10.9%(+2.51)#8,265 |
| 96. | Nibley | 13.3% | 12.7%(+0.579)#96 | 10.9%(+2.40)#8,454 |
| 97. | Fielding | 13.2% | 12.7%(+0.497)#97 | 10.9%(+2.32)#8,580 |
| 98. | South Willard | 13.2% | 12.7%(+0.495)#98 | 10.9%(+2.32)#8,586 |
| 99. | Kaysville | 13.0% | 12.7%(+0.332)#99 | 10.9%(+2.16)#8,899 |
| 100. | Spanish Fork | 13.0% | 12.7%(+0.307)#100 | 10.9%(+2.13)#8,948 |
Common Questions
What are the Top 10 Cities with the Highest Percentage of Population Employed in Office & Administration in Utah?
Top 10 Cities with the Highest Percentage of Population Employed in Office & Administration in Utah are:
#1
46.9%
#2
38.2%
#3
37.7%
#4
37.0%
#5
30.8%
#6
29.7%
#7
28.9%
#8
27.9%
#9
25.5%
#10
24.2%
What city has the Highest Percentage of Population Employed in Office & Administration in Utah?
Elberta has the Highest Percentage of Population Employed in Office & Administration in Utah with 46.9%.
What is the Percentage of Population Employed in Office & Administration in the State of Utah?
Percentage of Population Employed in Office & Administration in Utah is 12.7%.
What is the Percentage of Population Employed in Office & Administration in the United States?
Percentage of Population Employed in Office & Administration in the United States is 10.9%.