States with the Highest Percentage of Population Employed in Office & Administration
RELATED REPORTS & OPTIONS
Office & Administration
United States
Compare States
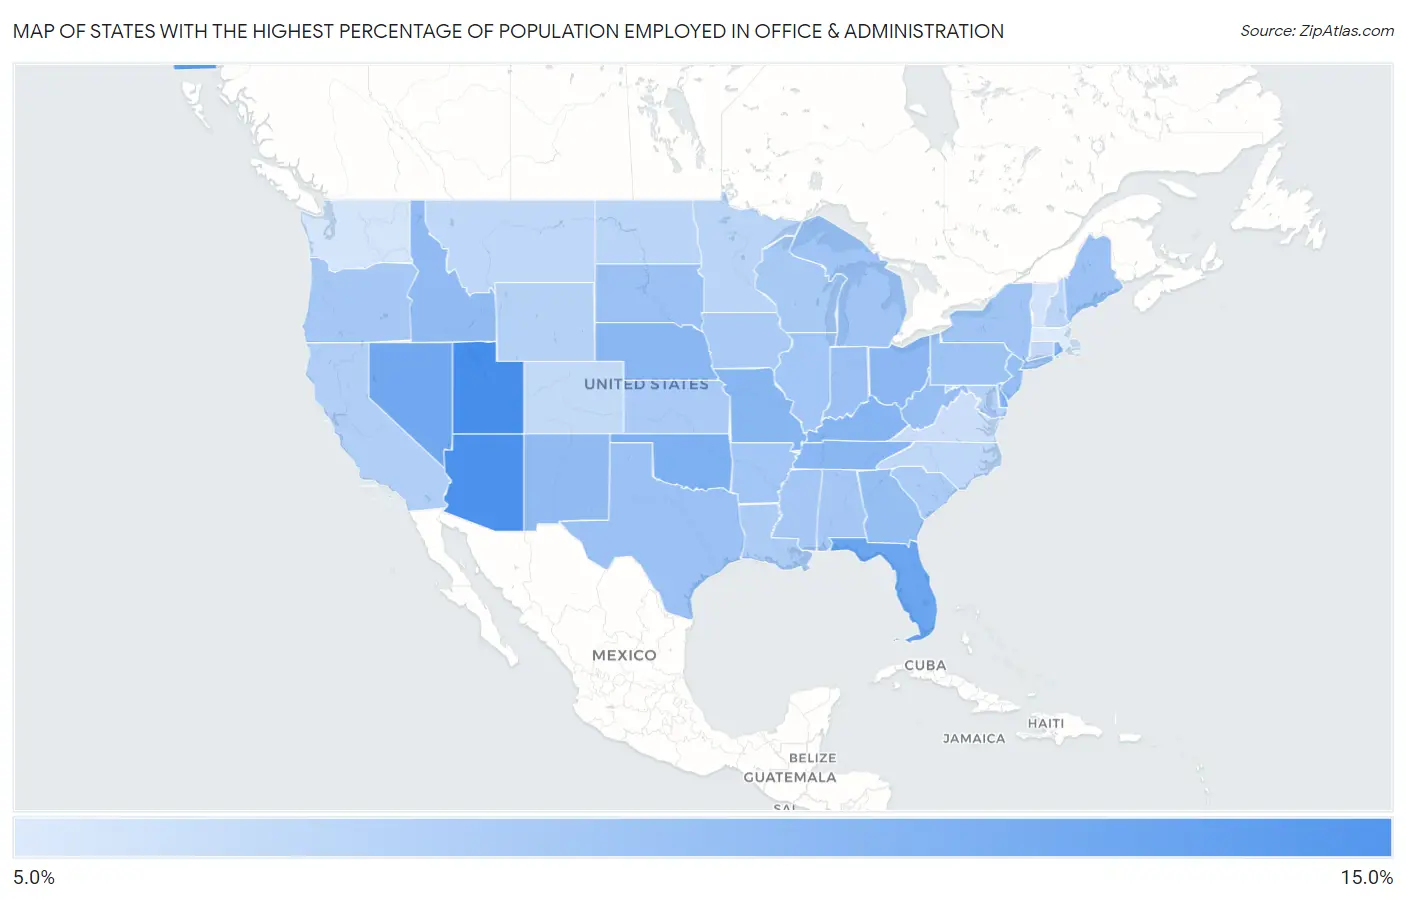
Map of States with the Highest Percentage of Population Employed in Office & Administration
5.0%
15.0%
States with the Highest Percentage of Population Employed in Office & Administration in the United States
| State | % Employed | vs State Median | vs National | |
| 1. | Utah | 12.7% | 10.8% (+1.86) | 10.9%(+1.82) |
| 2. | Arizona | 12.6% | 10.8% (+1.77) | 10.9%(+1.73) |
| 3. | Alaska | 12.0% | 10.8% (+1.22) | 10.9%(+1.19) |
| 4. | Florida | 11.9% | 10.8% (+1.09) | 10.9%(+1.06) |
| 5. | Nevada | 11.8% | 10.8% (+1.01) | 10.9%(+0.977) |
| 6. | Hawaii | 11.7% | 10.8% (+0.896) | 10.9%(+0.864) |
| 7. | Oklahoma | 11.5% | 10.8% (+0.717) | 10.9%(+0.685) |
| 8. | Delaware | 11.4% | 10.8% (+0.557) | 10.9%(+0.525) |
| 9. | Kentucky | 11.4% | 10.8% (+0.552) | 10.9%(+0.520) |
| 10. | Missouri | 11.3% | 10.8% (+0.524) | 10.9%(+0.492) |
| 11. | Rhode Island | 11.3% | 10.8% (+0.494) | 10.9%(+0.462) |
| 12. | Tennessee | 11.3% | 10.8% (+0.493) | 10.9%(+0.461) |
| 13. | Nebraska | 11.3% | 10.8% (+0.474) | 10.9%(+0.442) |
| 14. | Ohio | 11.3% | 10.8% (+0.432) | 10.9%(+0.400) |
| 15. | New Mexico | 11.2% | 10.8% (+0.341) | 10.9%(+0.308) |
| 16. | Idaho | 11.2% | 10.8% (+0.337) | 10.9%(+0.305) |
| 17. | Georgia | 11.1% | 10.8% (+0.255) | 10.9%(+0.223) |
| 18. | New Jersey | 11.1% | 10.8% (+0.242) | 10.9%(+0.210) |
| 19. | West Virginia | 11.0% | 10.8% (+0.174) | 10.9%(+0.142) |
| 20. | Indiana | 11.0% | 10.8% (+0.164) | 10.9%(+0.132) |
| 21. | Texas | 11.0% | 10.8% (+0.147) | 10.9%(+0.115) |
| 22. | Maine | 10.9% | 10.8% (+0.104) | 10.9%(+0.072) |
| 23. | South Dakota | 10.9% | 10.8% (+0.080) | 10.9%(+0.048) |
| 24. | Pennsylvania | 10.9% | 10.8% (+0.064) | 10.9%(+0.031) |
| 25. | New York | 10.8% | 10.8% (+0.017) | 10.9%(-0.015) |
| 26. | Michigan | 10.8% | 10.8% (-0.017) | 10.9%(-0.049) |
| 27. | Arkansas | 10.8% | 10.8% (-0.037) | 10.9%(-0.069) |
| 28. | Illinois | 10.8% | 10.8% (-0.060) | 10.9%(-0.092) |
| 29. | Mississippi | 10.8% | 10.8% (-0.071) | 10.9%(-0.103) |
| 30. | Oregon | 10.7% | 10.8% (-0.091) | 10.9%(-0.123) |
| 31. | Alabama | 10.7% | 10.8% (-0.107) | 10.9%(-0.139) |
| 32. | Wisconsin | 10.7% | 10.8% (-0.131) | 10.9%(-0.164) |
| 33. | South Carolina | 10.7% | 10.8% (-0.171) | 10.9%(-0.204) |
| 34. | Iowa | 10.6% | 10.8% (-0.188) | 10.9%(-0.220) |
| 35. | Kansas | 10.6% | 10.8% (-0.190) | 10.9%(-0.223) |
| 36. | Louisiana | 10.6% | 10.8% (-0.223) | 10.9%(-0.255) |
| 37. | California | 10.5% | 10.8% (-0.320) | 10.9%(-0.353) |
| 38. | Wyoming | 10.4% | 10.8% (-0.415) | 10.9%(-0.447) |
| 39. | Maryland | 10.4% | 10.8% (-0.434) | 10.9%(-0.467) |
| 40. | New Hampshire | 10.3% | 10.8% (-0.516) | 10.9%(-0.549) |
| 41. | North Dakota | 10.3% | 10.8% (-0.520) | 10.9%(-0.553) |
| 42. | Minnesota | 10.3% | 10.8% (-0.521) | 10.9%(-0.553) |
| 43. | Montana | 10.2% | 10.8% (-0.620) | 10.9%(-0.652) |
| 44. | North Carolina | 10.2% | 10.8% (-0.626) | 10.9%(-0.658) |
| 45. | Connecticut | 10.2% | 10.8% (-0.662) | 10.9%(-0.694) |
| 46. | Colorado | 10.1% | 10.8% (-0.694) | 10.9%(-0.726) |
| 47. | Virginia | 10.0% | 10.8% (-0.839) | 10.9%(-0.871) |
| 48. | Vermont | 9.8% | 10.8% (-0.976) | 10.9%(-1.01) |
| 49. | Washington | 9.8% | 10.8% (-1.03) | 10.9%(-1.06) |
| 50. | Massachusetts | 9.6% | 10.8% (-1.22) | 10.9%(-1.25) |
1
Common Questions
What are the Top 10 States with the Highest Percentage of Population Employed in Office & Administration in the United States?
Top 10 States with the Highest Percentage of Population Employed in Office & Administration in the United States are:
What state has the Highest Percentage of Population Employed in Office & Administration in the United States?
Utah has the Highest Percentage of Population Employed in Office & Administration in the United States with 12.7%.
What is the Percentage of Population Employed in Office & Administration in the United States?
Percentage of Population Employed in Office & Administration in the United States is 10.9%.