Cities with the Highest Percentage of Population Employed in Office & Administration in Tennessee
RELATED REPORTS & OPTIONS
Office & Administration
Tennessee
Compare Cities
Map of Cities with the Highest Percentage of Population Employed in Office & Administration in Tennessee
0.0%
100.0%
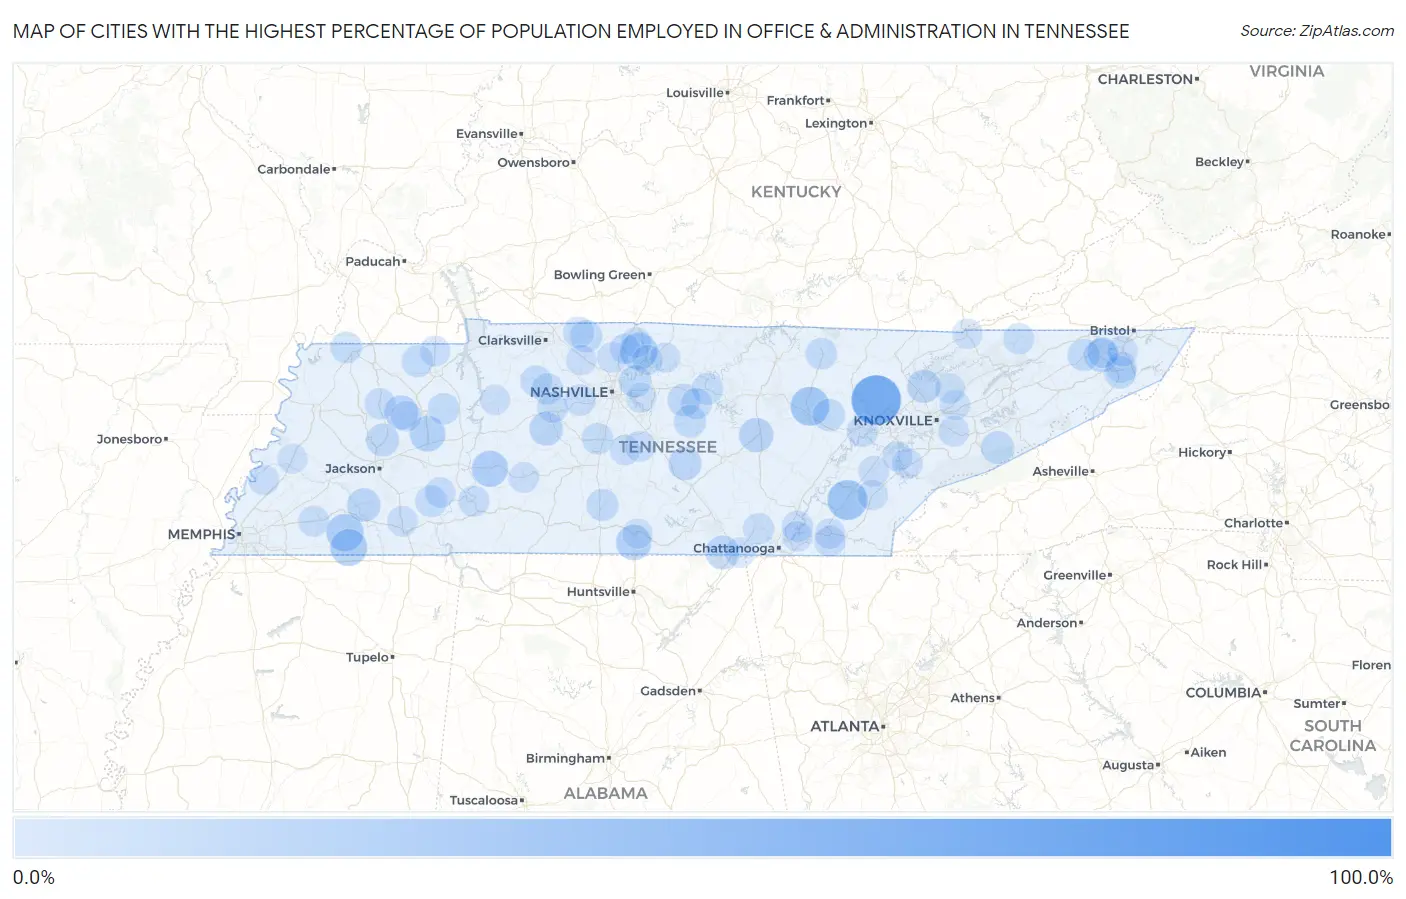
Cities with the Highest Percentage of Population Employed in Office & Administration in Tennessee
| City | % Employed | vs State | vs National | |
| 1. | Whitlock | 100.0% | 11.3%(+88.7)#1 | 10.9%(+89.1)#41 |
| 2. | Wynnburg | 100.0% | 11.3%(+88.7)#2 | 10.9%(+89.1)#48 |
| 3. | Petros | 69.8% | 11.3%(+58.5)#3 | 10.9%(+59.0)#89 |
| 4. | Griffith Creek | 55.2% | 11.3%(+43.9)#4 | 10.9%(+44.4)#162 |
| 5. | Riceville | 41.6% | 11.3%(+30.3)#5 | 10.9%(+30.7)#372 |
| 6. | Bowman | 38.8% | 11.3%(+27.5)#6 | 10.9%(+27.9)#449 |
| 7. | Shiloh | 38.7% | 11.3%(+27.4)#7 | 10.9%(+27.8)#454 |
| 8. | Cottontown | 34.2% | 11.3%(+22.9)#8 | 10.9%(+23.3)#610 |
| 9. | Hickory Valley | 33.8% | 11.3%(+22.5)#9 | 10.9%(+22.9)#624 |
| 10. | Saulsbury | 33.3% | 11.3%(+22.0)#10 | 10.9%(+22.5)#644 |
| 11. | Linden | 31.0% | 11.3%(+19.6)#11 | 10.9%(+20.1)#787 |
| 12. | Clarksburg | 30.0% | 11.3%(+18.7)#12 | 10.9%(+19.1)#839 |
| 13. | Palmersville | 30.0% | 11.3%(+18.7)#13 | 10.9%(+19.1)#844 |
| 14. | Park City | 28.9% | 11.3%(+17.6)#14 | 10.9%(+18.1)#923 |
| 15. | Rarity Bay | 28.8% | 11.3%(+17.5)#15 | 10.9%(+18.0)#932 |
| 16. | Doyle | 25.6% | 11.3%(+14.3)#16 | 10.9%(+14.8)#1,237 |
| 17. | Trezevant | 25.5% | 11.3%(+14.2)#17 | 10.9%(+14.7)#1,253 |
| 18. | Orme | 25.0% | 11.3%(+13.7)#18 | 10.9%(+14.1)#1,324 |
| 19. | Gray | 24.3% | 11.3%(+13.0)#19 | 10.9%(+13.5)#1,410 |
| 20. | Wrigley | 23.9% | 11.3%(+12.6)#20 | 10.9%(+13.0)#1,479 |
| 21. | Toone | 23.7% | 11.3%(+12.4)#21 | 10.9%(+12.9)#1,501 |
| 22. | Andersonville | 23.5% | 11.3%(+12.2)#22 | 10.9%(+12.7)#1,547 |
| 23. | John Sevier | 22.9% | 11.3%(+11.5)#23 | 10.9%(+12.0)#1,657 |
| 24. | Walnut Grove Cdp Sumner County | 22.5% | 11.3%(+11.2)#24 | 10.9%(+11.6)#1,738 |
| 25. | Chewalla | 22.4% | 11.3%(+11.1)#25 | 10.9%(+11.6)#1,758 |
| 26. | Lakewood Park | 22.3% | 11.3%(+11.0)#26 | 10.9%(+11.5)#1,772 |
| 27. | Medina | 22.1% | 11.3%(+10.8)#27 | 10.9%(+11.2)#1,829 |
| 28. | Watertown | 21.8% | 11.3%(+10.4)#28 | 10.9%(+10.9)#1,894 |
| 29. | Pittman Center | 21.6% | 11.3%(+10.2)#29 | 10.9%(+10.7)#1,952 |
| 30. | Prospect | 20.8% | 11.3%(+9.52)#30 | 10.9%(+9.98)#2,149 |
| 31. | Auburntown | 20.8% | 11.3%(+9.47)#31 | 10.9%(+9.93)#2,164 |
| 32. | Fairfield Glade | 20.5% | 11.3%(+9.19)#32 | 10.9%(+9.65)#2,251 |
| 33. | Pine Crest | 20.4% | 11.3%(+9.04)#33 | 10.9%(+9.51)#2,292 |
| 34. | Fall Branch | 20.3% | 11.3%(+9.03)#34 | 10.9%(+9.49)#2,296 |
| 35. | Cedar Hill | 20.2% | 11.3%(+8.89)#35 | 10.9%(+9.35)#2,338 |
| 36. | Green Hill | 20.1% | 11.3%(+8.79)#36 | 10.9%(+9.25)#2,369 |
| 37. | Cornersville | 20.0% | 11.3%(+8.68)#37 | 10.9%(+9.14)#2,394 |
| 38. | Walnut Grove Cdp Hardin County | 20.0% | 11.3%(+8.68)#38 | 10.9%(+9.14)#2,406 |
| 39. | Milledgeville | 19.2% | 11.3%(+7.91)#39 | 10.9%(+8.37)#2,703 |
| 40. | Dellrose | 18.9% | 11.3%(+7.60)#40 | 10.9%(+8.06)#2,849 |
| 41. | Vanleer | 18.9% | 11.3%(+7.59)#41 | 10.9%(+8.05)#2,851 |
| 42. | Gordonsville | 18.9% | 11.3%(+7.58)#42 | 10.9%(+8.04)#2,855 |
| 43. | Wildersville | 18.8% | 11.3%(+7.52)#43 | 10.9%(+7.98)#2,889 |
| 44. | Butler | 18.8% | 11.3%(+7.49)#44 | 10.9%(+7.96)#2,905 |
| 45. | Cottage Grove | 18.8% | 11.3%(+7.43)#45 | 10.9%(+7.89)#2,950 |
| 46. | Greenvale | 18.6% | 11.3%(+7.25)#46 | 10.9%(+7.72)#3,043 |
| 47. | Woodland Mills | 18.4% | 11.3%(+7.09)#47 | 10.9%(+7.55)#3,131 |
| 48. | Jamestown | 18.2% | 11.3%(+6.91)#48 | 10.9%(+7.38)#3,202 |
| 49. | Bruceton | 18.0% | 11.3%(+6.68)#49 | 10.9%(+7.14)#3,345 |
| 50. | Thompson S Station | 18.0% | 11.3%(+6.65)#50 | 10.9%(+7.11)#3,356 |
| 51. | Pegram | 17.9% | 11.3%(+6.55)#51 | 10.9%(+7.01)#3,415 |
| 52. | Karns | 17.8% | 11.3%(+6.50)#52 | 10.9%(+6.96)#3,440 |
| 53. | Alexandria | 17.8% | 11.3%(+6.46)#53 | 10.9%(+6.92)#3,473 |
| 54. | Midtown | 17.6% | 11.3%(+6.31)#54 | 10.9%(+6.78)#3,559 |
| 55. | Charlotte | 17.6% | 11.3%(+6.31)#55 | 10.9%(+6.77)#3,560 |
| 56. | Powells Crossroads | 17.5% | 11.3%(+6.17)#56 | 10.9%(+6.63)#3,646 |
| 57. | Adams | 17.4% | 11.3%(+6.11)#57 | 10.9%(+6.57)#3,689 |
| 58. | Bradford | 17.3% | 11.3%(+5.97)#58 | 10.9%(+6.43)#3,779 |
| 59. | Westpoint | 17.0% | 11.3%(+5.73)#59 | 10.9%(+6.19)#3,940 |
| 60. | Lakesite | 16.9% | 11.3%(+5.61)#60 | 10.9%(+6.07)#4,021 |
| 61. | Sneedville | 16.9% | 11.3%(+5.54)#61 | 10.9%(+6.00)#4,064 |
| 62. | Central | 16.8% | 11.3%(+5.51)#62 | 10.9%(+5.97)#4,088 |
| 63. | Wildwood Lake | 16.8% | 11.3%(+5.50)#63 | 10.9%(+5.96)#4,094 |
| 64. | Burns | 16.8% | 11.3%(+5.50)#64 | 10.9%(+5.96)#4,095 |
| 65. | Clifton | 16.7% | 11.3%(+5.39)#65 | 10.9%(+5.86)#4,158 |
| 66. | Somerville | 16.5% | 11.3%(+5.23)#66 | 10.9%(+5.69)#4,314 |
| 67. | Bethel Springs | 16.3% | 11.3%(+4.96)#67 | 10.9%(+5.42)#4,537 |
| 68. | Rockvale | 16.3% | 11.3%(+4.95)#68 | 10.9%(+5.41)#4,540 |
| 69. | Sweetwater | 16.2% | 11.3%(+4.85)#69 | 10.9%(+5.31)#4,629 |
| 70. | East Cleveland | 16.0% | 11.3%(+4.71)#70 | 10.9%(+5.17)#4,752 |
| 71. | Ridgetop | 16.0% | 11.3%(+4.66)#71 | 10.9%(+5.12)#4,808 |
| 72. | Sardis | 15.9% | 11.3%(+4.59)#72 | 10.9%(+5.05)#4,872 |
| 73. | Mclemoresville | 15.9% | 11.3%(+4.54)#73 | 10.9%(+5.01)#4,925 |
| 74. | Seymour | 15.9% | 11.3%(+4.54)#74 | 10.9%(+5.00)#4,930 |
| 75. | New Deal | 15.7% | 11.3%(+4.42)#75 | 10.9%(+4.88)#5,053 |
| 76. | Englewood | 15.6% | 11.3%(+4.26)#76 | 10.9%(+4.73)#5,214 |
| 77. | Gilt Edge | 15.5% | 11.3%(+4.21)#77 | 10.9%(+4.67)#5,261 |
| 78. | Spurgeon | 15.5% | 11.3%(+4.20)#78 | 10.9%(+4.66)#5,268 |
| 79. | Puryear | 15.5% | 11.3%(+4.19)#79 | 10.9%(+4.66)#5,284 |
| 80. | Rocky Top | 15.4% | 11.3%(+4.09)#80 | 10.9%(+4.55)#5,399 |
| 81. | Hohenwald | 15.3% | 11.3%(+4.02)#81 | 10.9%(+4.48)#5,500 |
| 82. | Bluff City | 15.3% | 11.3%(+3.99)#82 | 10.9%(+4.45)#5,535 |
| 83. | Eagleville | 15.3% | 11.3%(+3.99)#83 | 10.9%(+4.45)#5,541 |
| 84. | Greenback | 15.3% | 11.3%(+3.96)#84 | 10.9%(+4.42)#5,573 |
| 85. | Tellico Village | 15.2% | 11.3%(+3.90)#85 | 10.9%(+4.36)#5,621 |
| 86. | Fowlkes | 15.2% | 11.3%(+3.89)#86 | 10.9%(+4.35)#5,634 |
| 87. | White House | 15.2% | 11.3%(+3.87)#87 | 10.9%(+4.33)#5,657 |
| 88. | Pleasant View | 15.2% | 11.3%(+3.84)#88 | 10.9%(+4.30)#5,675 |
| 89. | Harrison | 15.1% | 11.3%(+3.83)#89 | 10.9%(+4.29)#5,709 |
| 90. | Mascot | 15.1% | 11.3%(+3.75)#90 | 10.9%(+4.21)#5,787 |
| 91. | Plainview | 15.0% | 11.3%(+3.70)#91 | 10.9%(+4.17)#5,844 |
| 92. | Gallatin | 15.0% | 11.3%(+3.65)#92 | 10.9%(+4.12)#5,898 |
| 93. | Fayetteville | 14.8% | 11.3%(+3.44)#93 | 10.9%(+3.90)#6,144 |
| 94. | Castalian Springs | 14.7% | 11.3%(+3.42)#94 | 10.9%(+3.88)#6,176 |
| 95. | Powell | 14.7% | 11.3%(+3.41)#95 | 10.9%(+3.87)#6,192 |
| 96. | Harrogate | 14.7% | 11.3%(+3.39)#96 | 10.9%(+3.85)#6,238 |
| 97. | Waverly | 14.7% | 11.3%(+3.33)#97 | 10.9%(+3.79)#6,302 |
| 98. | New Hope | 14.6% | 11.3%(+3.27)#98 | 10.9%(+3.73)#6,392 |
| 99. | Henning | 14.6% | 11.3%(+3.27)#99 | 10.9%(+3.73)#6,397 |
| 100. | Rural Hill | 14.4% | 11.3%(+3.06)#100 | 10.9%(+3.52)#6,660 |
Common Questions
What are the Top 10 Cities with the Highest Percentage of Population Employed in Office & Administration in Tennessee?
Top 10 Cities with the Highest Percentage of Population Employed in Office & Administration in Tennessee are:
#1
69.8%
#2
41.6%
#3
38.8%
#4
34.2%
#5
33.8%
#6
33.3%
#7
31.0%
#8
30.0%
#9
28.9%
#10
25.6%
What city has the Highest Percentage of Population Employed in Office & Administration in Tennessee?
Petros has the Highest Percentage of Population Employed in Office & Administration in Tennessee with 69.8%.
What is the Percentage of Population Employed in Office & Administration in the State of Tennessee?
Percentage of Population Employed in Office & Administration in Tennessee is 11.3%.
What is the Percentage of Population Employed in Office & Administration in the United States?
Percentage of Population Employed in Office & Administration in the United States is 10.9%.