Zip Codes with the Highest Percentage of Population Employed in Office & Administration in Lompoc, CA
RELATED REPORTS & OPTIONS
Office & Administration
Lompoc
Compare Zip Codes
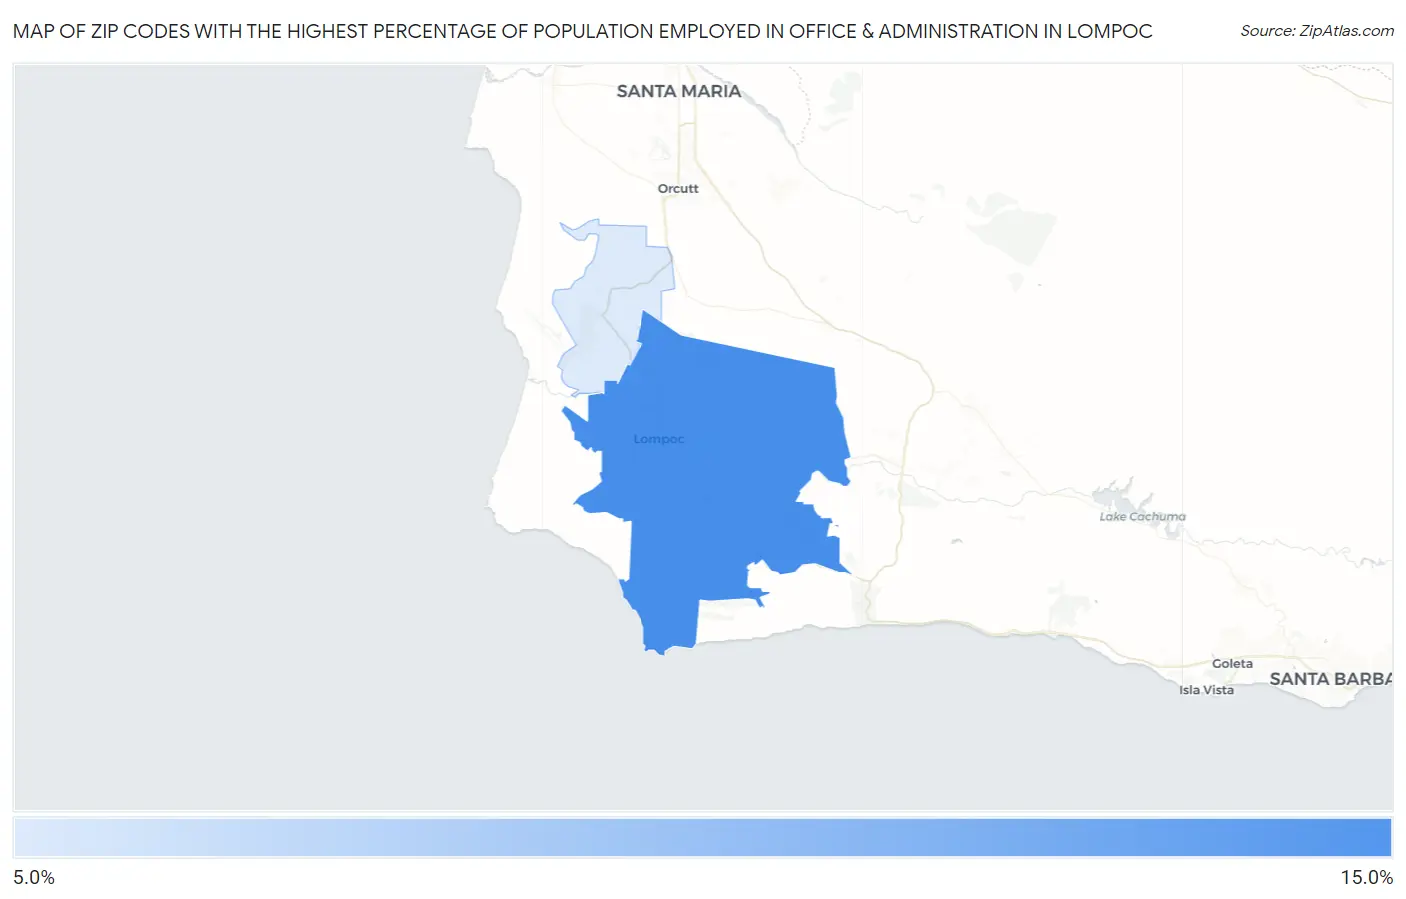
Map of Zip Codes with the Highest Percentage of Population Employed in Office & Administration in Lompoc
8.7%
12.6%
Zip Codes with the Highest Percentage of Population Employed in Office & Administration in Lompoc, CA
| Zip Code | % Employed | vs State | vs National | |
| 1. | 93436 | 12.6% | 10.5%(+2.12)#369 | 10.9%(+1.76)#8,988 |
| 2. | 93437 | 8.7% | 10.5%(-1.76)#1,057 | 10.9%(-2.11)#21,008 |
1
Common Questions
What are the Top Zip Codes with the Highest Percentage of Population Employed in Office & Administration in Lompoc, CA?
Top Zip Codes with the Highest Percentage of Population Employed in Office & Administration in Lompoc, CA are:
What zip code has the Highest Percentage of Population Employed in Office & Administration in Lompoc, CA?
93436 has the Highest Percentage of Population Employed in Office & Administration in Lompoc, CA with 12.6%.
What is the Percentage of Population Employed in Office & Administration in Lompoc, CA?
Percentage of Population Employed in Office & Administration in Lompoc is 12.6%.
What is the Percentage of Population Employed in Office & Administration in California?
Percentage of Population Employed in Office & Administration in California is 10.5%.
What is the Percentage of Population Employed in Office & Administration in the United States?
Percentage of Population Employed in Office & Administration in the United States is 10.9%.