Cities with the Highest Percentage of Population Employed in Office & Administration in Illinois
RELATED REPORTS & OPTIONS
Office & Administration
Illinois
Compare Cities
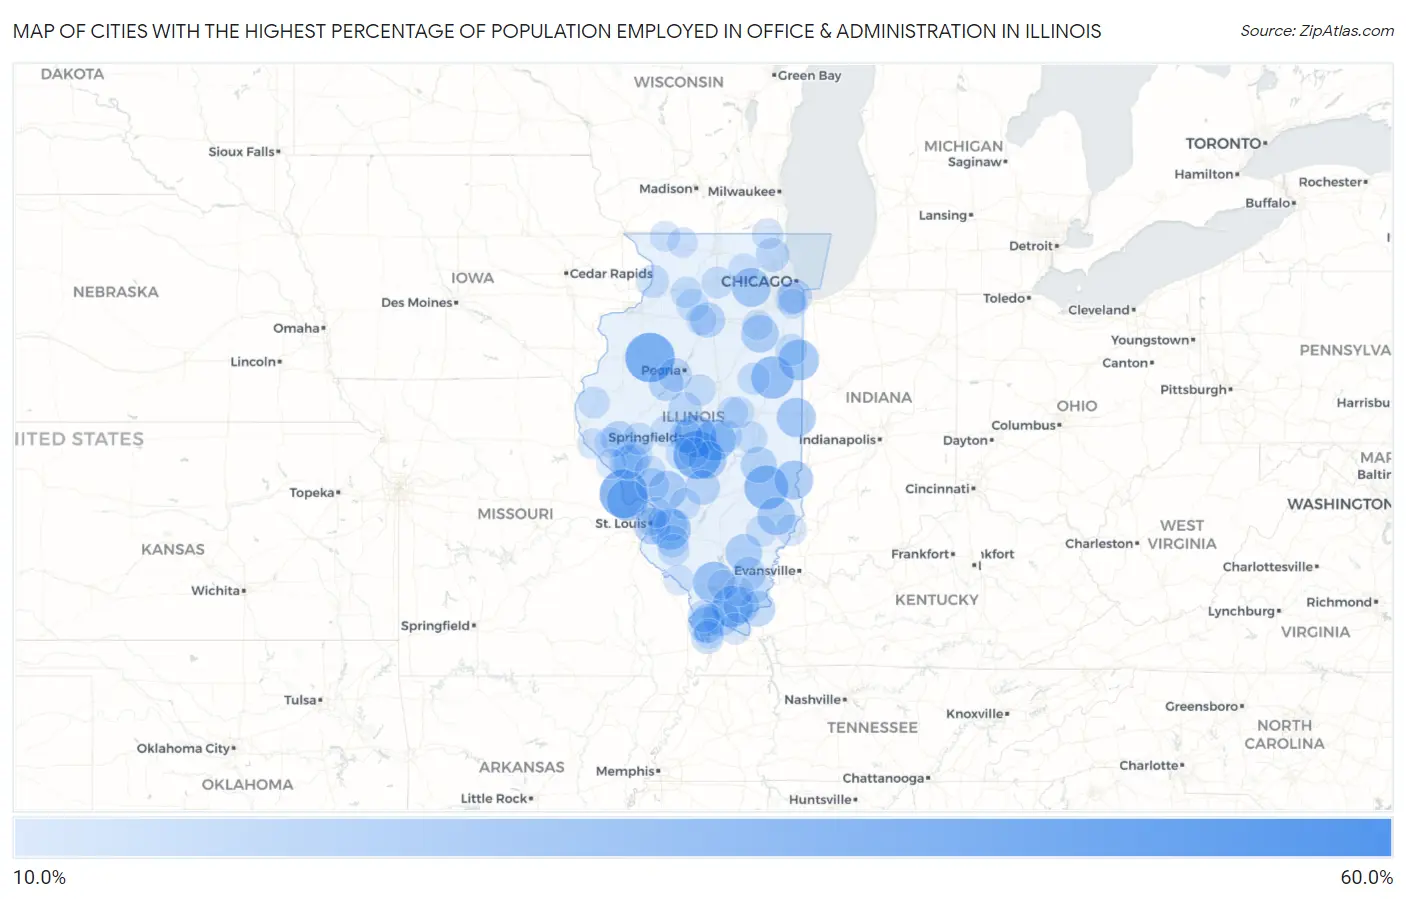
Map of Cities with the Highest Percentage of Population Employed in Office & Administration in Illinois
0.0%
60.0%
Cities with the Highest Percentage of Population Employed in Office & Administration in Illinois
| City | % Employed | vs State | vs National | |
| 1. | East Lynn | 55.8% | 10.8%(+45.0)#1 | 10.9%(+44.9)#153 |
| 2. | Moro | 55.2% | 10.8%(+44.5)#2 | 10.9%(+44.4)#161 |
| 3. | Harding | 47.6% | 10.8%(+36.9)#3 | 10.9%(+36.8)#253 |
| 4. | Smithville | 46.3% | 10.8%(+35.5)#4 | 10.9%(+35.4)#272 |
| 5. | Elwin | 44.4% | 10.8%(+33.7)#5 | 10.9%(+33.6)#305 |
| 6. | Serena | 43.9% | 10.8%(+33.1)#6 | 10.9%(+33.0)#315 |
| 7. | Gilson | 42.0% | 10.8%(+31.3)#7 | 10.9%(+31.2)#360 |
| 8. | Batchtown | 40.5% | 10.8%(+29.7)#8 | 10.9%(+29.6)#400 |
| 9. | Langleyville | 40.2% | 10.8%(+29.4)#9 | 10.9%(+29.3)#408 |
| 10. | Marcelline | 37.0% | 10.8%(+26.3)#10 | 10.9%(+26.2)#495 |
| 11. | Rose Hill | 35.3% | 10.8%(+24.5)#11 | 10.9%(+24.4)#565 |
| 12. | Cameron | 34.4% | 10.8%(+23.7)#12 | 10.9%(+23.6)#601 |
| 13. | Trilla | 34.2% | 10.8%(+23.4)#13 | 10.9%(+23.4)#607 |
| 14. | Buckley | 33.7% | 10.8%(+22.9)#14 | 10.9%(+22.8)#630 |
| 15. | Mechanicsburg | 33.6% | 10.8%(+22.8)#15 | 10.9%(+22.7)#634 |
| 16. | Scott Afb | 32.6% | 10.8%(+21.9)#16 | 10.9%(+21.8)#704 |
| 17. | Colp | 32.5% | 10.8%(+21.7)#17 | 10.9%(+21.6)#714 |
| 18. | Boody | 32.3% | 10.8%(+21.6)#18 | 10.9%(+21.5)#722 |
| 19. | Brussels | 32.3% | 10.8%(+21.5)#19 | 10.9%(+21.4)#725 |
| 20. | Simpson | 32.1% | 10.8%(+21.4)#20 | 10.9%(+21.3)#733 |
| 21. | Iroquois | 31.5% | 10.8%(+20.7)#21 | 10.9%(+20.7)#763 |
| 22. | Belgium | 29.6% | 10.8%(+18.9)#22 | 10.9%(+18.8)#871 |
| 23. | West Union | 29.4% | 10.8%(+18.6)#23 | 10.9%(+18.6)#883 |
| 24. | Prestbury | 29.3% | 10.8%(+18.6)#24 | 10.9%(+18.5)#890 |
| 25. | Dorchester | 28.4% | 10.8%(+17.6)#25 | 10.9%(+17.5)#977 |
| 26. | Claremont | 28.2% | 10.8%(+17.4)#26 | 10.9%(+17.3)#987 |
| 27. | Adams | 28.2% | 10.8%(+17.4)#27 | 10.9%(+17.3)#988 |
| 28. | Owaneco | 28.0% | 10.8%(+17.3)#28 | 10.9%(+17.2)#1,000 |
| 29. | East Brooklyn | 28.0% | 10.8%(+17.2)#29 | 10.9%(+17.1)#1,004 |
| 30. | Trivoli | 27.1% | 10.8%(+16.3)#30 | 10.9%(+16.2)#1,098 |
| 31. | Belle Prairie City | 26.9% | 10.8%(+16.2)#31 | 10.9%(+16.1)#1,115 |
| 32. | Alexander | 26.8% | 10.8%(+16.0)#32 | 10.9%(+15.9)#1,126 |
| 33. | Sauget | 26.8% | 10.8%(+16.0)#33 | 10.9%(+15.9)#1,127 |
| 34. | Belknap | 26.5% | 10.8%(+15.7)#34 | 10.9%(+15.6)#1,157 |
| 35. | Pulaski | 26.3% | 10.8%(+15.5)#35 | 10.9%(+15.4)#1,184 |
| 36. | Lerna | 26.1% | 10.8%(+15.4)#36 | 10.9%(+15.3)#1,191 |
| 37. | Eddyville | 26.1% | 10.8%(+15.3)#37 | 10.9%(+15.2)#1,198 |
| 38. | Hillview | 25.9% | 10.8%(+15.1)#38 | 10.9%(+15.0)#1,213 |
| 39. | Elizabethtown | 25.5% | 10.8%(+14.7)#39 | 10.9%(+14.6)#1,256 |
| 40. | Dalzell | 25.1% | 10.8%(+14.3)#40 | 10.9%(+14.2)#1,295 |
| 41. | Perry | 25.0% | 10.8%(+14.2)#41 | 10.9%(+14.1)#1,307 |
| 42. | Fillmore | 24.6% | 10.8%(+13.8)#42 | 10.9%(+13.7)#1,375 |
| 43. | Banner | 24.6% | 10.8%(+13.8)#43 | 10.9%(+13.7)#1,382 |
| 44. | Calumet Park | 23.7% | 10.8%(+13.0)#44 | 10.9%(+12.9)#1,500 |
| 45. | Broughton | 23.5% | 10.8%(+12.8)#45 | 10.9%(+12.7)#1,550 |
| 46. | Pearl | 23.5% | 10.8%(+12.8)#46 | 10.9%(+12.7)#1,551 |
| 47. | Forest Lake | 23.4% | 10.8%(+12.6)#47 | 10.9%(+12.5)#1,569 |
| 48. | Lake Camelot | 23.3% | 10.8%(+12.5)#48 | 10.9%(+12.4)#1,591 |
| 49. | Fidelity | 23.1% | 10.8%(+12.3)#49 | 10.9%(+12.2)#1,622 |
| 50. | Clear Lake | 23.0% | 10.8%(+12.3)#50 | 10.9%(+12.2)#1,626 |
| 51. | New Holland | 22.9% | 10.8%(+12.1)#51 | 10.9%(+12.0)#1,654 |
| 52. | Fulton | 22.5% | 10.8%(+11.7)#52 | 10.9%(+11.6)#1,744 |
| 53. | Lebanon | 22.1% | 10.8%(+11.4)#53 | 10.9%(+11.3)#1,813 |
| 54. | Ullin | 22.1% | 10.8%(+11.4)#54 | 10.9%(+11.3)#1,817 |
| 55. | Cairo | 22.1% | 10.8%(+11.4)#55 | 10.9%(+11.3)#1,818 |
| 56. | Alsey | 21.9% | 10.8%(+11.1)#56 | 10.9%(+11.0)#1,872 |
| 57. | Ohio | 21.8% | 10.8%(+11.1)#57 | 10.9%(+11.0)#1,877 |
| 58. | Garrett | 21.7% | 10.8%(+11.0)#58 | 10.9%(+10.9)#1,901 |
| 59. | Sibley | 21.7% | 10.8%(+10.9)#59 | 10.9%(+10.8)#1,920 |
| 60. | Chapin | 21.6% | 10.8%(+10.8)#60 | 10.9%(+10.7)#1,942 |
| 61. | Fayetteville | 21.5% | 10.8%(+10.7)#61 | 10.9%(+10.7)#1,961 |
| 62. | Long Creek | 21.5% | 10.8%(+10.7)#62 | 10.9%(+10.6)#1,964 |
| 63. | Papineau | 21.4% | 10.8%(+10.7)#63 | 10.9%(+10.6)#1,985 |
| 64. | Mill Creek | 21.4% | 10.8%(+10.7)#64 | 10.9%(+10.6)#1,991 |
| 65. | Steward | 21.3% | 10.8%(+10.6)#65 | 10.9%(+10.5)#2,008 |
| 66. | Robbins | 21.3% | 10.8%(+10.5)#66 | 10.9%(+10.5)#2,019 |
| 67. | Marissa | 21.2% | 10.8%(+10.4)#67 | 10.9%(+10.3)#2,046 |
| 68. | De Land | 21.2% | 10.8%(+10.4)#68 | 10.9%(+10.3)#2,053 |
| 69. | West Point | 21.1% | 10.8%(+10.3)#69 | 10.9%(+10.3)#2,073 |
| 70. | Weldon | 21.1% | 10.8%(+10.3)#70 | 10.9%(+10.2)#2,084 |
| 71. | Wilton Center | 20.8% | 10.8%(+10.1)#71 | 10.9%(+9.98)#2,144 |
| 72. | Pleasant Plains | 20.8% | 10.8%(+10.0)#72 | 10.9%(+9.96)#2,156 |
| 73. | Divernon | 20.7% | 10.8%(+9.98)#73 | 10.9%(+9.89)#2,173 |
| 74. | Minier | 20.7% | 10.8%(+9.96)#74 | 10.9%(+9.87)#2,181 |
| 75. | Old Ripley | 20.7% | 10.8%(+9.93)#75 | 10.9%(+9.83)#2,193 |
| 76. | Harmon | 20.7% | 10.8%(+9.93)#76 | 10.9%(+9.83)#2,194 |
| 77. | Metropolis | 20.7% | 10.8%(+9.90)#77 | 10.9%(+9.81)#2,199 |
| 78. | Venice | 20.6% | 10.8%(+9.87)#78 | 10.9%(+9.78)#2,211 |
| 79. | Equality | 20.6% | 10.8%(+9.82)#79 | 10.9%(+9.73)#2,226 |
| 80. | Greenfield | 20.4% | 10.8%(+9.65)#80 | 10.9%(+9.56)#2,272 |
| 81. | Allendale | 20.4% | 10.8%(+9.60)#81 | 10.9%(+9.51)#2,291 |
| 82. | Lake Catherine | 20.3% | 10.8%(+9.55)#82 | 10.9%(+9.46)#2,301 |
| 83. | Mount Erie | 20.3% | 10.8%(+9.55)#83 | 10.9%(+9.46)#2,304 |
| 84. | Mitchell | 20.0% | 10.8%(+9.28)#84 | 10.9%(+9.19)#2,389 |
| 85. | Holcomb | 20.0% | 10.8%(+9.24)#85 | 10.9%(+9.14)#2,420 |
| 86. | Baylis | 20.0% | 10.8%(+9.24)#86 | 10.9%(+9.14)#2,422 |
| 87. | Hollowayville | 20.0% | 10.8%(+9.24)#87 | 10.9%(+9.14)#2,438 |
| 88. | Rockwood | 20.0% | 10.8%(+9.24)#88 | 10.9%(+9.14)#2,440 |
| 89. | Burlington | 19.8% | 10.8%(+9.06)#89 | 10.9%(+8.96)#2,488 |
| 90. | Carbon Hill | 19.8% | 10.8%(+9.04)#90 | 10.9%(+8.95)#2,500 |
| 91. | Nora | 19.7% | 10.8%(+8.89)#91 | 10.9%(+8.80)#2,547 |
| 92. | Cedarville | 19.6% | 10.8%(+8.85)#92 | 10.9%(+8.76)#2,565 |
| 93. | Hull | 19.6% | 10.8%(+8.84)#93 | 10.9%(+8.75)#2,568 |
| 94. | Pleasant Hill | 19.6% | 10.8%(+8.79)#94 | 10.9%(+8.70)#2,593 |
| 95. | Alvan | 19.5% | 10.8%(+8.78)#95 | 10.9%(+8.68)#2,597 |
| 96. | Bulpitt | 19.5% | 10.8%(+8.75)#96 | 10.9%(+8.66)#2,608 |
| 97. | Spillertown | 19.5% | 10.8%(+8.73)#97 | 10.9%(+8.64)#2,614 |
| 98. | Mound City | 19.3% | 10.8%(+8.57)#98 | 10.9%(+8.48)#2,668 |
| 99. | Carrier Mills | 19.2% | 10.8%(+8.44)#99 | 10.9%(+8.35)#2,720 |
| 100. | Hazel Crest | 19.1% | 10.8%(+8.38)#100 | 10.9%(+8.29)#2,744 |
Common Questions
What are the Top 10 Cities with the Highest Percentage of Population Employed in Office & Administration in Illinois?
Top 10 Cities with the Highest Percentage of Population Employed in Office & Administration in Illinois are:
#1
42.0%
#2
40.5%
#3
40.2%
#4
35.3%
#5
33.7%
#6
33.6%
#7
32.6%
#8
32.5%
#9
32.3%
#10
32.3%
What city has the Highest Percentage of Population Employed in Office & Administration in Illinois?
Gilson has the Highest Percentage of Population Employed in Office & Administration in Illinois with 42.0%.
What is the Percentage of Population Employed in Office & Administration in the State of Illinois?
Percentage of Population Employed in Office & Administration in Illinois is 10.8%.
What is the Percentage of Population Employed in Office & Administration in the United States?
Percentage of Population Employed in Office & Administration in the United States is 10.9%.