Cities with the Highest Percentage of Population Employed in Office & Administration in Maryland
RELATED REPORTS & OPTIONS
Office & Administration
Maryland
Compare Cities
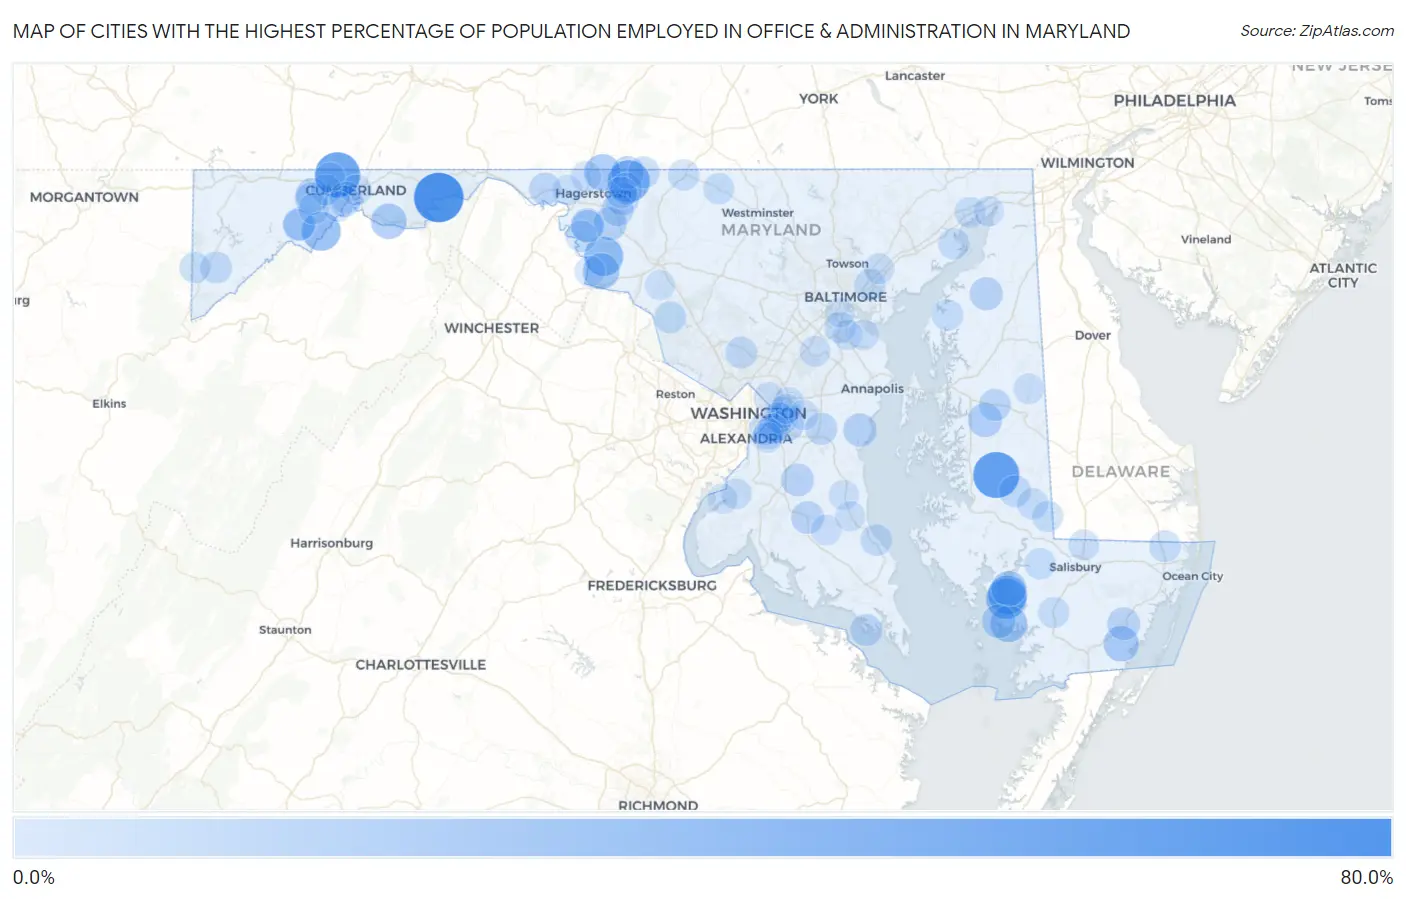
Map of Cities with the Highest Percentage of Population Employed in Office & Administration in Maryland
0.0%
80.0%
Cities with the Highest Percentage of Population Employed in Office & Administration in Maryland
| City | % Employed | vs State | vs National | |
| 1. | Little Orleans | 73.3% | 10.4%(+62.9)#1 | 10.9%(+62.5)#77 |
| 2. | Choptank | 62.3% | 10.4%(+51.9)#2 | 10.9%(+51.5)#117 |
| 3. | Barrelville | 60.0% | 10.4%(+49.6)#3 | 10.9%(+49.1)#127 |
| 4. | Greensburg | 50.0% | 10.4%(+39.6)#4 | 10.9%(+39.1)#206 |
| 5. | Nanticoke Acres | 44.4% | 10.4%(+34.1)#5 | 10.9%(+33.6)#302 |
| 6. | Nanticoke | 40.9% | 10.4%(+30.5)#6 | 10.9%(+30.1)#387 |
| 7. | Trego Rohrersville Station | 40.8% | 10.4%(+30.4)#7 | 10.9%(+30.0)#396 |
| 8. | Danville | 40.3% | 10.4%(+29.9)#8 | 10.9%(+29.4)#406 |
| 9. | Dames Quarter | 34.0% | 10.4%(+23.6)#9 | 10.9%(+23.1)#616 |
| 10. | Reid | 33.3% | 10.4%(+22.9)#10 | 10.9%(+22.5)#652 |
| 11. | Yarrowsburg | 32.2% | 10.4%(+21.8)#11 | 10.9%(+21.3)#732 |
| 12. | Girdletree | 29.9% | 10.4%(+19.5)#12 | 10.9%(+19.0)#859 |
| 13. | Oldtown | 29.7% | 10.4%(+19.3)#13 | 10.9%(+18.9)#865 |
| 14. | Graceham | 29.7% | 10.4%(+19.3)#14 | 10.9%(+18.8)#867 |
| 15. | Jesterville | 29.2% | 10.4%(+18.8)#15 | 10.9%(+18.3)#904 |
| 16. | Maryland Park | 26.5% | 10.4%(+16.1)#16 | 10.9%(+15.7)#1,151 |
| 17. | Cordova | 25.7% | 10.4%(+15.3)#17 | 10.9%(+14.8)#1,232 |
| 18. | Chance | 24.8% | 10.4%(+14.4)#18 | 10.9%(+13.9)#1,350 |
| 19. | Midlothian | 24.5% | 10.4%(+14.2)#19 | 10.9%(+13.7)#1,389 |
| 20. | Fairplay | 24.0% | 10.4%(+13.7)#20 | 10.9%(+13.2)#1,454 |
| 21. | Mapleville | 23.8% | 10.4%(+13.4)#21 | 10.9%(+13.0)#1,488 |
| 22. | Galesville | 23.6% | 10.4%(+13.2)#22 | 10.9%(+12.7)#1,540 |
| 23. | Kennedyville | 22.7% | 10.4%(+12.3)#23 | 10.9%(+11.8)#1,697 |
| 24. | Snow Hill | 22.3% | 10.4%(+11.9)#24 | 10.9%(+11.4)#1,778 |
| 25. | Cedarville | 22.2% | 10.4%(+11.9)#25 | 10.9%(+11.4)#1,784 |
| 26. | Pondsville | 22.2% | 10.4%(+11.8)#26 | 10.9%(+11.4)#1,794 |
| 27. | Moscow | 22.1% | 10.4%(+11.7)#27 | 10.9%(+11.2)#1,831 |
| 28. | Ringgold | 22.0% | 10.4%(+11.6)#28 | 10.9%(+11.1)#1,859 |
| 29. | Hughesville | 21.8% | 10.4%(+11.4)#29 | 10.9%(+11.0)#1,880 |
| 30. | Carlos | 21.6% | 10.4%(+11.2)#30 | 10.9%(+10.8)#1,932 |
| 31. | Forestville | 21.2% | 10.4%(+10.8)#31 | 10.9%(+10.3)#2,050 |
| 32. | Bagtown | 21.0% | 10.4%(+10.6)#32 | 10.9%(+10.1)#2,107 |
| 33. | Tilghmanton | 20.7% | 10.4%(+10.3)#33 | 10.9%(+9.86)#2,185 |
| 34. | Hillcrest Heights | 20.2% | 10.4%(+9.81)#34 | 10.9%(+9.34)#2,342 |
| 35. | Romancoke | 20.1% | 10.4%(+9.68)#35 | 10.9%(+9.22)#2,382 |
| 36. | Clear Spring | 19.9% | 10.4%(+9.52)#36 | 10.9%(+9.05)#2,464 |
| 37. | Piney Point | 19.8% | 10.4%(+9.37)#37 | 10.9%(+8.90)#2,516 |
| 38. | Barton | 19.7% | 10.4%(+9.27)#38 | 10.9%(+8.81)#2,545 |
| 39. | Marlboro Meadows | 19.7% | 10.4%(+9.26)#39 | 10.9%(+8.79)#2,549 |
| 40. | Queen Anne | 19.6% | 10.4%(+9.22)#40 | 10.9%(+8.75)#2,570 |
| 41. | Smithsburg | 19.6% | 10.4%(+9.20)#41 | 10.9%(+8.73)#2,577 |
| 42. | Hurlock | 19.3% | 10.4%(+8.96)#42 | 10.9%(+8.49)#2,664 |
| 43. | Leisure World | 19.3% | 10.4%(+8.93)#43 | 10.9%(+8.46)#2,673 |
| 44. | Highfield Cascade | 19.2% | 10.4%(+8.78)#44 | 10.9%(+8.31)#2,731 |
| 45. | Bowling Green | 18.9% | 10.4%(+8.56)#45 | 10.9%(+8.09)#2,825 |
| 46. | Barnesville | 18.9% | 10.4%(+8.53)#46 | 10.9%(+8.06)#2,846 |
| 47. | Cavetown | 18.9% | 10.4%(+8.50)#47 | 10.9%(+8.03)#2,862 |
| 48. | Loch Lynn Heights | 18.9% | 10.4%(+8.46)#48 | 10.9%(+8.00)#2,881 |
| 49. | Bishopville | 18.2% | 10.4%(+7.86)#49 | 10.9%(+7.39)#3,200 |
| 50. | Long Beach | 18.2% | 10.4%(+7.81)#50 | 10.9%(+7.34)#3,216 |
| 51. | Mercersville | 18.2% | 10.4%(+7.79)#51 | 10.9%(+7.33)#3,231 |
| 52. | Ten Mile Creek | 18.0% | 10.4%(+7.58)#52 | 10.9%(+7.11)#3,357 |
| 53. | Rosedale | 18.0% | 10.4%(+7.57)#53 | 10.9%(+7.10)#3,363 |
| 54. | Ferndale | 17.9% | 10.4%(+7.50)#54 | 10.9%(+7.03)#3,408 |
| 55. | Suitland | 17.5% | 10.4%(+7.12)#55 | 10.9%(+6.65)#3,632 |
| 56. | Fairlee | 17.5% | 10.4%(+7.09)#56 | 10.9%(+6.63)#3,651 |
| 57. | Eldorado | 17.4% | 10.4%(+7.00)#57 | 10.9%(+6.53)#3,718 |
| 58. | Potomac Park | 17.3% | 10.4%(+6.92)#58 | 10.9%(+6.46)#3,756 |
| 59. | Emmitsburg | 17.3% | 10.4%(+6.91)#59 | 10.9%(+6.44)#3,774 |
| 60. | Quantico | 17.3% | 10.4%(+6.88)#60 | 10.9%(+6.42)#3,788 |
| 61. | Midland | 17.2% | 10.4%(+6.85)#61 | 10.9%(+6.38)#3,805 |
| 62. | Aberdeen Proving Ground | 17.2% | 10.4%(+6.81)#62 | 10.9%(+6.35)#3,838 |
| 63. | Walker Mill | 17.2% | 10.4%(+6.80)#63 | 10.9%(+6.33)#3,843 |
| 64. | Sharptown | 17.0% | 10.4%(+6.64)#64 | 10.9%(+6.17)#3,958 |
| 65. | Taneytown | 16.8% | 10.4%(+6.43)#65 | 10.9%(+5.96)#4,093 |
| 66. | Crellin | 16.8% | 10.4%(+6.42)#66 | 10.9%(+5.96)#4,097 |
| 67. | Princess Anne | 16.8% | 10.4%(+6.39)#67 | 10.9%(+5.92)#4,120 |
| 68. | Peppermill Village | 16.8% | 10.4%(+6.39)#68 | 10.9%(+5.92)#4,121 |
| 69. | Glenarden | 16.5% | 10.4%(+6.12)#69 | 10.9%(+5.65)#4,335 |
| 70. | Eckhart Mines | 16.3% | 10.4%(+5.94)#70 | 10.9%(+5.47)#4,484 |
| 71. | Brown Station | 16.2% | 10.4%(+5.83)#71 | 10.9%(+5.37)#4,576 |
| 72. | Perryville | 16.1% | 10.4%(+5.75)#72 | 10.9%(+5.29)#4,644 |
| 73. | Cumberland | 16.0% | 10.4%(+5.61)#73 | 10.9%(+5.14)#4,788 |
| 74. | Capitol Heights | 15.9% | 10.4%(+5.52)#74 | 10.9%(+5.05)#4,868 |
| 75. | Cresaptown | 15.9% | 10.4%(+5.46)#75 | 10.9%(+5.00)#4,931 |
| 76. | Delmar | 15.8% | 10.4%(+5.38)#76 | 10.9%(+4.91)#5,017 |
| 77. | Bryans Road | 15.7% | 10.4%(+5.33)#77 | 10.9%(+4.87)#5,069 |
| 78. | Marlow Heights | 15.7% | 10.4%(+5.33)#78 | 10.9%(+4.86)#5,075 |
| 79. | Fort Meade | 15.7% | 10.4%(+5.30)#79 | 10.9%(+4.83)#5,096 |
| 80. | Maugansville | 15.6% | 10.4%(+5.25)#80 | 10.9%(+4.79)#5,139 |
| 81. | Golden Beach | 15.6% | 10.4%(+5.25)#81 | 10.9%(+4.78)#5,148 |
| 82. | Greensboro | 15.6% | 10.4%(+5.25)#82 | 10.9%(+4.78)#5,149 |
| 83. | Dargan | 15.6% | 10.4%(+5.19)#83 | 10.9%(+4.73)#5,208 |
| 84. | White Marsh | 15.4% | 10.4%(+5.05)#84 | 10.9%(+4.59)#5,366 |
| 85. | Silver Hill | 15.3% | 10.4%(+4.93)#85 | 10.9%(+4.47)#5,514 |
| 86. | North Brentwood | 15.2% | 10.4%(+4.81)#86 | 10.9%(+4.34)#5,644 |
| 87. | Temple Hills | 15.2% | 10.4%(+4.77)#87 | 10.9%(+4.30)#5,677 |
| 88. | Riviera Beach | 15.1% | 10.4%(+4.67)#88 | 10.9%(+4.20)#5,798 |
| 89. | Callaway | 14.9% | 10.4%(+4.56)#89 | 10.9%(+4.09)#5,924 |
| 90. | Wilson Conococheague | 14.8% | 10.4%(+4.40)#90 | 10.9%(+3.94)#6,117 |
| 91. | Charlestown | 14.6% | 10.4%(+4.25)#91 | 10.9%(+3.78)#6,319 |
| 92. | Mount Savage | 14.6% | 10.4%(+4.18)#92 | 10.9%(+3.71)#6,423 |
| 93. | Huntingtown | 14.5% | 10.4%(+4.14)#93 | 10.9%(+3.67)#6,470 |
| 94. | Buckeystown | 14.5% | 10.4%(+4.12)#94 | 10.9%(+3.65)#6,502 |
| 95. | Prince Frederick | 14.4% | 10.4%(+4.05)#95 | 10.9%(+3.58)#6,601 |
| 96. | Indian Head | 14.4% | 10.4%(+3.98)#96 | 10.9%(+3.51)#6,671 |
| 97. | Glen Burnie | 14.4% | 10.4%(+3.97)#97 | 10.9%(+3.50)#6,682 |
| 98. | Summerfield | 14.3% | 10.4%(+3.90)#98 | 10.9%(+3.43)#6,757 |
| 99. | Kettering | 14.2% | 10.4%(+3.81)#99 | 10.9%(+3.34)#6,947 |
| 100. | Baltimore Highlands | 14.2% | 10.4%(+3.79)#100 | 10.9%(+3.32)#6,973 |
Common Questions
What are the Top 10 Cities with the Highest Percentage of Population Employed in Office & Administration in Maryland?
Top 10 Cities with the Highest Percentage of Population Employed in Office & Administration in Maryland are:
#1
73.3%
#2
62.3%
#3
60.0%
#4
50.0%
#5
44.4%
#6
40.9%
#7
40.8%
#8
40.3%
#9
34.0%
#10
33.3%
What city has the Highest Percentage of Population Employed in Office & Administration in Maryland?
Little Orleans has the Highest Percentage of Population Employed in Office & Administration in Maryland with 73.3%.
What is the Percentage of Population Employed in Office & Administration in the State of Maryland?
Percentage of Population Employed in Office & Administration in Maryland is 10.4%.
What is the Percentage of Population Employed in Office & Administration in the United States?
Percentage of Population Employed in Office & Administration in the United States is 10.9%.