Cities with the Highest Percentage of Population Employed in Office & Administration in South Carolina
RELATED REPORTS & OPTIONS
Office & Administration
South Carolina
Compare Cities
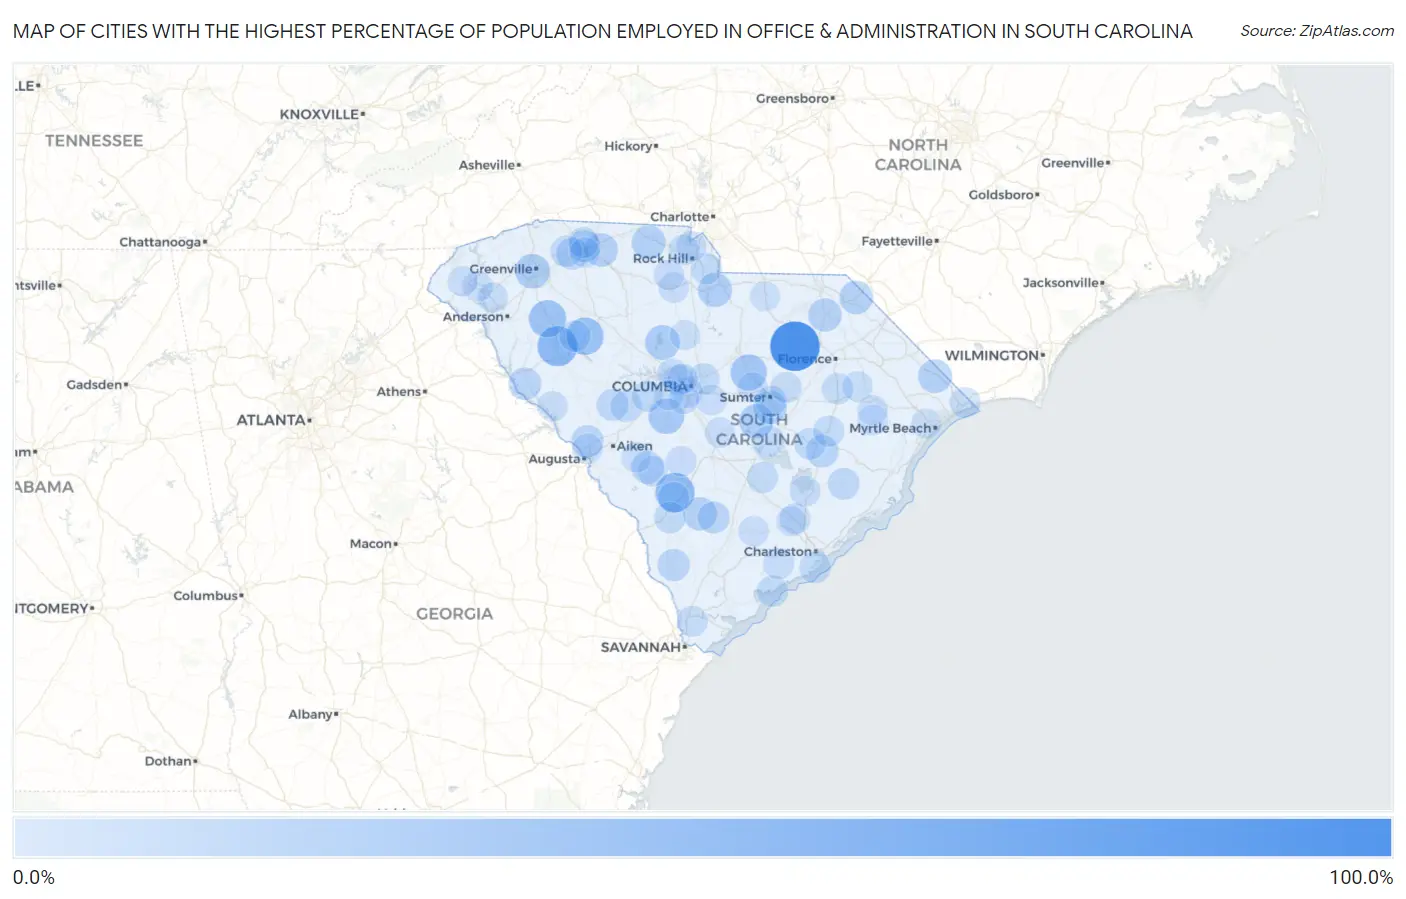
Map of Cities with the Highest Percentage of Population Employed in Office & Administration in South Carolina
0.0%
100.0%
Cities with the Highest Percentage of Population Employed in Office & Administration in South Carolina
| City | % Employed | vs State | vs National | |
| 1. | Lydia | 100.0% | 10.7%(+89.3)#1 | 10.9%(+89.1)#4 |
| 2. | Cokesbury | 56.1% | 10.7%(+45.5)#2 | 10.9%(+45.3)#151 |
| 3. | Govan | 53.3% | 10.7%(+42.7)#3 | 10.9%(+42.5)#175 |
| 4. | Daufuskie Island | 52.4% | 10.7%(+41.7)#4 | 10.9%(+41.5)#188 |
| 5. | Mountville | 45.4% | 10.7%(+34.7)#5 | 10.9%(+34.5)#283 |
| 6. | Princeton | 44.4% | 10.7%(+33.8)#6 | 10.9%(+33.6)#303 |
| 7. | Rembert | 40.6% | 10.7%(+29.9)#7 | 10.9%(+29.7)#399 |
| 8. | Cateechee | 40.1% | 10.7%(+29.5)#8 | 10.9%(+29.3)#410 |
| 9. | Helena | 39.0% | 10.7%(+28.4)#9 | 10.9%(+28.2)#442 |
| 10. | St. Charles | 38.9% | 10.7%(+28.2)#10 | 10.9%(+28.0)#445 |
| 11. | Pelion | 37.0% | 10.7%(+26.4)#11 | 10.9%(+26.2)#496 |
| 12. | Judson | 33.6% | 10.7%(+22.9)#12 | 10.9%(+22.7)#635 |
| 13. | Jenkinsville | 33.3% | 10.7%(+22.7)#13 | 10.9%(+22.5)#661 |
| 14. | Drayton | 32.2% | 10.7%(+21.5)#14 | 10.9%(+21.3)#729 |
| 15. | Pinewood | 31.4% | 10.7%(+20.7)#15 | 10.9%(+20.5)#771 |
| 16. | Irwin | 30.9% | 10.7%(+20.2)#16 | 10.9%(+20.0)#792 |
| 17. | Smyrna | 30.0% | 10.7%(+19.3)#17 | 10.9%(+19.1)#850 |
| 18. | Loris | 29.2% | 10.7%(+18.5)#18 | 10.9%(+18.3)#898 |
| 19. | Clifton | 28.6% | 10.7%(+18.0)#19 | 10.9%(+17.8)#944 |
| 20. | Lodge | 28.6% | 10.7%(+17.9)#20 | 10.9%(+17.7)#948 |
| 21. | Tatum | 28.6% | 10.7%(+17.9)#21 | 10.9%(+17.7)#957 |
| 22. | Lakewood | 28.0% | 10.7%(+17.3)#22 | 10.9%(+17.1)#1,008 |
| 23. | Society Hill | 27.5% | 10.7%(+16.9)#23 | 10.9%(+16.7)#1,056 |
| 24. | Cash | 26.3% | 10.7%(+15.7)#24 | 10.9%(+15.5)#1,171 |
| 25. | Mount Carmel | 24.5% | 10.7%(+13.9)#25 | 10.9%(+13.7)#1,391 |
| 26. | Williston | 24.5% | 10.7%(+13.8)#26 | 10.9%(+13.6)#1,398 |
| 27. | Dunbar | 24.2% | 10.7%(+13.6)#27 | 10.9%(+13.4)#1,432 |
| 28. | Abney Crossroads | 23.8% | 10.7%(+13.2)#28 | 10.9%(+13.0)#1,495 |
| 29. | Lane | 23.7% | 10.7%(+13.0)#29 | 10.9%(+12.8)#1,515 |
| 30. | Capitol View | 23.6% | 10.7%(+13.0)#30 | 10.9%(+12.8)#1,525 |
| 31. | Murphys Estates | 23.6% | 10.7%(+13.0)#31 | 10.9%(+12.8)#1,528 |
| 32. | Edmund | 23.5% | 10.7%(+12.9)#32 | 10.9%(+12.7)#1,544 |
| 33. | Furman | 23.5% | 10.7%(+12.8)#33 | 10.9%(+12.6)#1,557 |
| 34. | Wyboo | 22.6% | 10.7%(+12.0)#34 | 10.9%(+11.8)#1,705 |
| 35. | Grover | 22.5% | 10.7%(+11.9)#35 | 10.9%(+11.7)#1,730 |
| 36. | Wellford | 22.3% | 10.7%(+11.7)#36 | 10.9%(+11.5)#1,774 |
| 37. | Williams | 22.2% | 10.7%(+11.6)#37 | 10.9%(+11.4)#1,792 |
| 38. | Valley Falls | 21.9% | 10.7%(+11.3)#38 | 10.9%(+11.1)#1,860 |
| 39. | Ward | 21.8% | 10.7%(+11.2)#39 | 10.9%(+11.0)#1,882 |
| 40. | Jamestown | 21.3% | 10.7%(+10.6)#40 | 10.9%(+10.4)#2,027 |
| 41. | Greeleyville | 20.7% | 10.7%(+10.0)#41 | 10.9%(+9.83)#2,189 |
| 42. | Folly Beach | 20.6% | 10.7%(+9.96)#42 | 10.9%(+9.76)#2,219 |
| 43. | Monetta | 20.5% | 10.7%(+9.80)#43 | 10.9%(+9.60)#2,261 |
| 44. | Lyman | 20.4% | 10.7%(+9.71)#44 | 10.9%(+9.51)#2,290 |
| 45. | Centenary | 20.0% | 10.7%(+9.35)#45 | 10.9%(+9.14)#2,397 |
| 46. | Waterloo | 20.0% | 10.7%(+9.35)#46 | 10.9%(+9.14)#2,408 |
| 47. | Sycamore | 19.6% | 10.7%(+8.91)#47 | 10.9%(+8.71)#2,586 |
| 48. | Edisto Beach | 19.5% | 10.7%(+8.87)#48 | 10.9%(+8.66)#2,606 |
| 49. | Summit | 19.4% | 10.7%(+8.70)#49 | 10.9%(+8.50)#2,657 |
| 50. | Catawba | 19.3% | 10.7%(+8.65)#50 | 10.9%(+8.45)#2,679 |
| 51. | Coward | 19.2% | 10.7%(+8.59)#51 | 10.9%(+8.39)#2,696 |
| 52. | Woodfield | 19.0% | 10.7%(+8.33)#52 | 10.9%(+8.13)#2,810 |
| 53. | Summerton | 18.8% | 10.7%(+8.12)#53 | 10.9%(+7.92)#2,922 |
| 54. | Olar | 18.5% | 10.7%(+7.87)#54 | 10.9%(+7.66)#3,069 |
| 55. | South Sumter | 18.5% | 10.7%(+7.80)#55 | 10.9%(+7.60)#3,108 |
| 56. | Holly Hill | 18.3% | 10.7%(+7.67)#56 | 10.9%(+7.46)#3,168 |
| 57. | Kingstree | 18.1% | 10.7%(+7.48)#57 | 10.9%(+7.28)#3,275 |
| 58. | Ben Avon | 18.0% | 10.7%(+7.35)#58 | 10.9%(+7.14)#3,339 |
| 59. | Boiling Springs | 17.9% | 10.7%(+7.21)#59 | 10.9%(+7.01)#3,417 |
| 60. | Meggett | 17.8% | 10.7%(+7.11)#60 | 10.9%(+6.91)#3,478 |
| 61. | Mayesville | 17.4% | 10.7%(+6.78)#61 | 10.9%(+6.58)#3,680 |
| 62. | Sangaree | 17.3% | 10.7%(+6.66)#62 | 10.9%(+6.46)#3,755 |
| 63. | Cayce | 17.1% | 10.7%(+6.44)#63 | 10.9%(+6.23)#3,908 |
| 64. | Pinopolis | 17.1% | 10.7%(+6.41)#64 | 10.9%(+6.21)#3,927 |
| 65. | Little River | 16.9% | 10.7%(+6.28)#65 | 10.9%(+6.07)#4,022 |
| 66. | Seven Oaks | 16.8% | 10.7%(+6.18)#66 | 10.9%(+5.98)#4,081 |
| 67. | Hardeeville | 16.8% | 10.7%(+6.10)#67 | 10.9%(+5.90)#4,132 |
| 68. | Newport | 16.7% | 10.7%(+6.05)#68 | 10.9%(+5.85)#4,162 |
| 69. | Elko | 16.7% | 10.7%(+6.01)#69 | 10.9%(+5.81)#4,203 |
| 70. | Hopkins | 16.5% | 10.7%(+5.81)#70 | 10.9%(+5.61)#4,362 |
| 71. | Eureka Mill | 16.1% | 10.7%(+5.42)#71 | 10.9%(+5.22)#4,709 |
| 72. | Irmo | 16.1% | 10.7%(+5.42)#72 | 10.9%(+5.21)#4,715 |
| 73. | Norway | 16.0% | 10.7%(+5.38)#73 | 10.9%(+5.17)#4,744 |
| 74. | Belvedere | 16.0% | 10.7%(+5.38)#74 | 10.9%(+5.17)#4,746 |
| 75. | St Matthews | 15.8% | 10.7%(+5.11)#75 | 10.9%(+4.91)#5,018 |
| 76. | Lowrys | 15.7% | 10.7%(+5.09)#76 | 10.9%(+4.88)#5,052 |
| 77. | Sheldon | 15.7% | 10.7%(+5.00)#77 | 10.9%(+4.80)#5,134 |
| 78. | Newry | 15.6% | 10.7%(+4.97)#78 | 10.9%(+4.77)#5,165 |
| 79. | Newtown | 15.6% | 10.7%(+4.96)#79 | 10.9%(+4.76)#5,178 |
| 80. | Cottageville | 15.6% | 10.7%(+4.96)#80 | 10.9%(+4.75)#5,182 |
| 81. | Plum Branch | 15.6% | 10.7%(+4.90)#81 | 10.9%(+4.70)#5,244 |
| 82. | Fripp Island | 15.5% | 10.7%(+4.84)#82 | 10.9%(+4.64)#5,304 |
| 83. | Pamplico | 15.4% | 10.7%(+4.71)#83 | 10.9%(+4.51)#5,469 |
| 84. | India Hook | 15.3% | 10.7%(+4.69)#84 | 10.9%(+4.48)#5,498 |
| 85. | Pendleton | 15.3% | 10.7%(+4.68)#85 | 10.9%(+4.47)#5,507 |
| 86. | Pine Ridge | 15.3% | 10.7%(+4.67)#86 | 10.9%(+4.46)#5,517 |
| 87. | St Andrews | 15.3% | 10.7%(+4.67)#87 | 10.9%(+4.46)#5,518 |
| 88. | Lobeco | 15.0% | 10.7%(+4.39)#88 | 10.9%(+4.19)#5,819 |
| 89. | North Santee | 15.0% | 10.7%(+4.31)#89 | 10.9%(+4.11)#5,904 |
| 90. | Hemingway | 14.9% | 10.7%(+4.28)#90 | 10.9%(+4.08)#5,942 |
| 91. | Windsor | 14.9% | 10.7%(+4.26)#91 | 10.9%(+4.06)#5,969 |
| 92. | Oakland | 14.9% | 10.7%(+4.21)#92 | 10.9%(+4.01)#6,031 |
| 93. | Johnsonville | 14.8% | 10.7%(+4.13)#93 | 10.9%(+3.92)#6,129 |
| 94. | West Union | 14.7% | 10.7%(+4.07)#94 | 10.9%(+3.87)#6,195 |
| 95. | Red Bank | 14.6% | 10.7%(+3.92)#95 | 10.9%(+3.72)#6,415 |
| 96. | Saxon | 14.4% | 10.7%(+3.78)#96 | 10.9%(+3.57)#6,613 |
| 97. | Lincolnville | 14.4% | 10.7%(+3.76)#97 | 10.9%(+3.56)#6,628 |
| 98. | Jefferson | 14.4% | 10.7%(+3.71)#98 | 10.9%(+3.51)#6,675 |
| 99. | Forestbrook | 14.4% | 10.7%(+3.71)#99 | 10.9%(+3.50)#6,685 |
| 100. | Winnsboro | 14.3% | 10.7%(+3.69)#100 | 10.9%(+3.48)#6,716 |
Common Questions
What are the Top 10 Cities with the Highest Percentage of Population Employed in Office & Administration in South Carolina?
Top 10 Cities with the Highest Percentage of Population Employed in Office & Administration in South Carolina are:
#1
100.0%
#2
56.1%
#3
53.3%
#4
45.4%
#5
44.4%
#6
40.6%
#7
37.0%
#8
33.6%
#9
33.3%
#10
31.4%
What city has the Highest Percentage of Population Employed in Office & Administration in South Carolina?
Lydia has the Highest Percentage of Population Employed in Office & Administration in South Carolina with 100.0%.
What is the Percentage of Population Employed in Office & Administration in the State of South Carolina?
Percentage of Population Employed in Office & Administration in South Carolina is 10.7%.
What is the Percentage of Population Employed in Office & Administration in the United States?
Percentage of Population Employed in Office & Administration in the United States is 10.9%.