Cities with the Highest Percentage of Population Employed in Office & Administration in Massachusetts
RELATED REPORTS & OPTIONS
Office & Administration
Massachusetts
Compare Cities
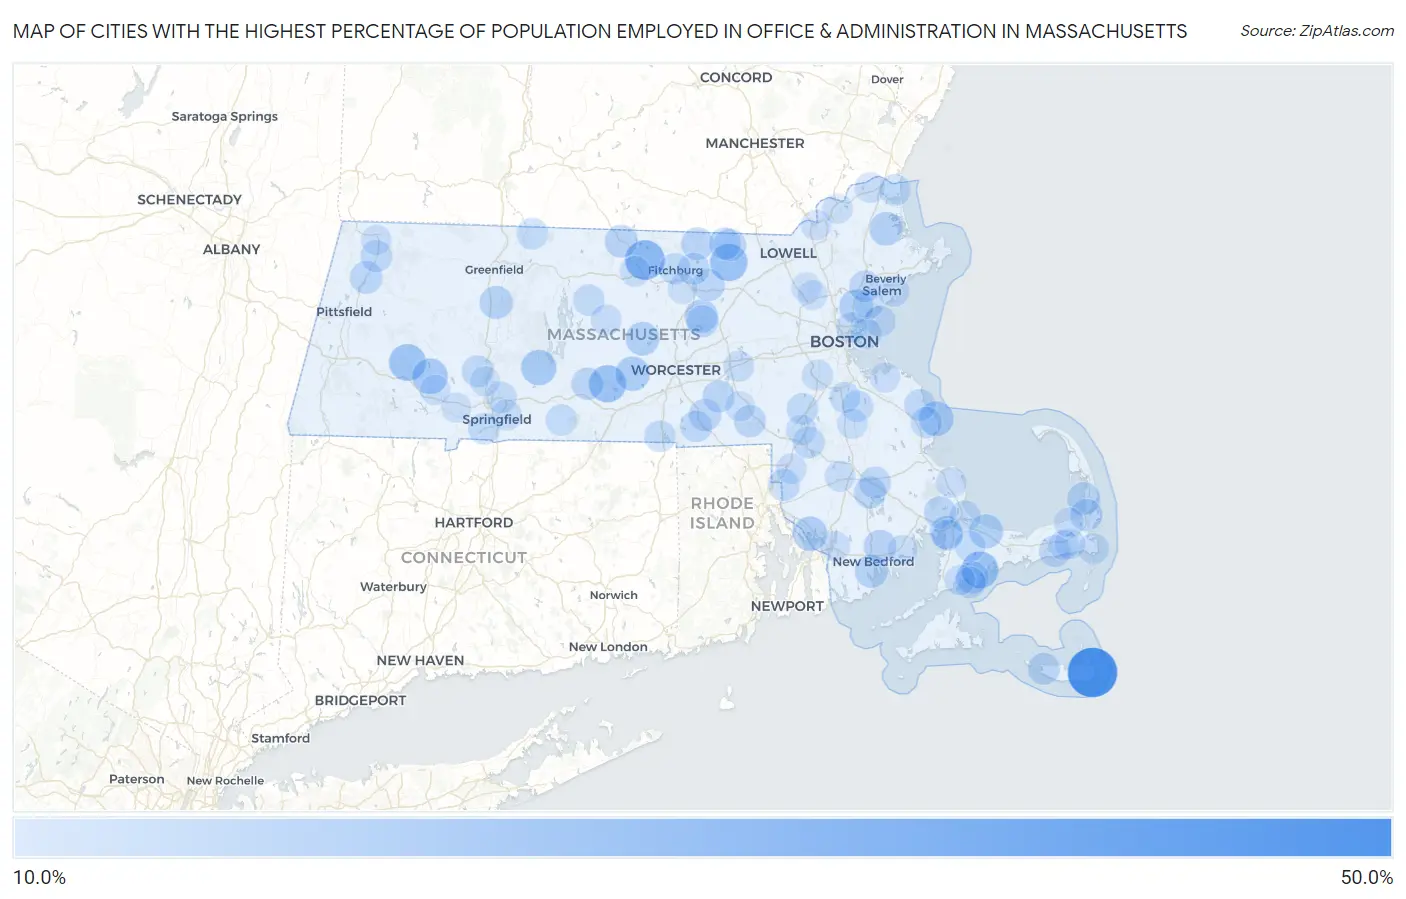
Map of Cities with the Highest Percentage of Population Employed in Office & Administration in Massachusetts
0.0%
50.0%
Cities with the Highest Percentage of Population Employed in Office & Administration in Massachusetts
| City | % Employed | vs State | vs National | |
| 1. | Siasconset | 42.3% | 9.6%(+32.7)#1 | 10.9%(+31.5)#355 |
| 2. | South Ashburnham | 26.1% | 9.6%(+16.5)#2 | 10.9%(+15.2)#1,199 |
| 3. | Groton | 22.4% | 9.6%(+12.8)#3 | 10.9%(+11.5)#1,767 |
| 4. | Brookfield | 22.0% | 9.6%(+12.4)#4 | 10.9%(+11.2)#1,835 |
| 5. | Mashpee Neck | 21.7% | 9.6%(+12.1)#5 | 10.9%(+10.8)#1,918 |
| 6. | Chester | 21.5% | 9.6%(+11.9)#6 | 10.9%(+10.7)#1,963 |
| 7. | Lenox Dale | 20.2% | 9.6%(+10.6)#7 | 10.9%(+9.33)#2,346 |
| 8. | Huntington | 19.5% | 9.6%(+9.85)#8 | 10.9%(+8.60)#2,625 |
| 9. | Belchertown | 19.0% | 9.6%(+9.41)#9 | 10.9%(+8.16)#2,799 |
| 10. | Ocean Bluff Brant Rock | 18.2% | 9.6%(+8.58)#10 | 10.9%(+7.33)#3,219 |
| 11. | Spencer | 17.7% | 9.6%(+8.08)#11 | 10.9%(+6.83)#3,511 |
| 12. | Ocean Grove | 17.7% | 9.6%(+8.07)#12 | 10.9%(+6.82)#3,524 |
| 13. | East Sandwich | 16.9% | 9.6%(+7.31)#13 | 10.9%(+6.06)#4,037 |
| 14. | Saugus | 16.8% | 9.6%(+7.21)#14 | 10.9%(+5.96)#4,092 |
| 15. | Rutland | 16.5% | 9.6%(+6.88)#15 | 10.9%(+5.63)#4,349 |
| 16. | Rowley | 16.4% | 9.6%(+6.80)#16 | 10.9%(+5.55)#4,417 |
| 17. | South Lancaster | 15.9% | 9.6%(+6.31)#17 | 10.9%(+5.06)#4,865 |
| 18. | South Deerfield | 15.7% | 9.6%(+6.08)#18 | 10.9%(+4.83)#5,093 |
| 19. | Bliss Corner | 15.5% | 9.6%(+5.93)#19 | 10.9%(+4.68)#5,254 |
| 20. | North Eastham | 15.2% | 9.6%(+5.61)#20 | 10.9%(+4.36)#5,629 |
| 21. | Acushnet Center | 15.1% | 9.6%(+5.47)#21 | 10.9%(+4.22)#5,765 |
| 22. | Bourne | 15.0% | 9.6%(+5.44)#22 | 10.9%(+4.19)#5,813 |
| 23. | Winchendon | 15.0% | 9.6%(+5.39)#23 | 10.9%(+4.14)#5,886 |
| 24. | Cheshire | 14.8% | 9.6%(+5.22)#24 | 10.9%(+3.97)#6,062 |
| 25. | Townsend | 14.8% | 9.6%(+5.16)#25 | 10.9%(+3.91)#6,136 |
| 26. | Seabrook | 14.5% | 9.6%(+4.87)#26 | 10.9%(+3.62)#6,535 |
| 27. | East Pepperell | 14.3% | 9.6%(+4.70)#27 | 10.9%(+3.46)#6,743 |
| 28. | Warren | 14.3% | 9.6%(+4.68)#28 | 10.9%(+3.43)#6,772 |
| 29. | Whitinsville | 14.3% | 9.6%(+4.65)#29 | 10.9%(+3.40)#6,867 |
| 30. | North Lakeville | 14.2% | 9.6%(+4.60)#30 | 10.9%(+3.35)#6,921 |
| 31. | Upton | 14.2% | 9.6%(+4.56)#31 | 10.9%(+3.31)#6,986 |
| 32. | White Island Shores | 14.1% | 9.6%(+4.51)#32 | 10.9%(+3.26)#7,043 |
| 33. | Pepperell | 14.1% | 9.6%(+4.51)#33 | 10.9%(+3.26)#7,046 |
| 34. | Shirley | 14.1% | 9.6%(+4.47)#34 | 10.9%(+3.22)#7,097 |
| 35. | Madaket | 14.1% | 9.6%(+4.45)#35 | 10.9%(+3.21)#7,113 |
| 36. | Orleans | 14.0% | 9.6%(+4.34)#36 | 10.9%(+3.09)#7,296 |
| 37. | Bellingham | 13.9% | 9.6%(+4.34)#37 | 10.9%(+3.09)#7,300 |
| 38. | Clinton | 13.9% | 9.6%(+4.33)#38 | 10.9%(+3.09)#7,304 |
| 39. | North Seekonk | 13.7% | 9.6%(+4.13)#39 | 10.9%(+2.89)#7,607 |
| 40. | Mansfield Center | 13.7% | 9.6%(+4.10)#40 | 10.9%(+2.85)#7,668 |
| 41. | Dennis Port | 13.7% | 9.6%(+4.05)#41 | 10.9%(+2.80)#7,752 |
| 42. | Middleborough Center | 13.6% | 9.6%(+3.99)#42 | 10.9%(+2.74)#7,838 |
| 43. | Lunenburg | 13.6% | 9.6%(+3.99)#43 | 10.9%(+2.74)#7,840 |
| 44. | Adams | 13.6% | 9.6%(+3.98)#44 | 10.9%(+2.73)#7,856 |
| 45. | Easthampton Town | 13.5% | 9.6%(+3.85)#45 | 10.9%(+2.61)#8,080 |
| 46. | Peabody | 13.4% | 9.6%(+3.82)#46 | 10.9%(+2.57)#8,147 |
| 47. | East Douglas | 13.4% | 9.6%(+3.78)#47 | 10.9%(+2.53)#8,213 |
| 48. | Marshfield Hills | 13.4% | 9.6%(+3.76)#48 | 10.9%(+2.52)#8,244 |
| 49. | Seconsett Island | 13.3% | 9.6%(+3.72)#49 | 10.9%(+2.48)#8,333 |
| 50. | Sagamore | 13.3% | 9.6%(+3.66)#50 | 10.9%(+2.41)#8,428 |
| 51. | Salisbury | 13.3% | 9.6%(+3.66)#51 | 10.9%(+2.41)#8,432 |
| 52. | Fitchburg | 13.1% | 9.6%(+3.52)#52 | 10.9%(+2.27)#8,678 |
| 53. | Greenfield | 13.1% | 9.6%(+3.51)#53 | 10.9%(+2.27)#8,681 |
| 54. | Walpole | 13.1% | 9.6%(+3.50)#54 | 10.9%(+2.25)#8,714 |
| 55. | Petersham | 13.1% | 9.6%(+3.49)#55 | 10.9%(+2.25)#8,721 |
| 56. | Northfield | 13.1% | 9.6%(+3.49)#56 | 10.9%(+2.24)#8,727 |
| 57. | Agawam Town | 13.1% | 9.6%(+3.49)#57 | 10.9%(+2.24)#8,729 |
| 58. | Holbrook | 13.1% | 9.6%(+3.47)#58 | 10.9%(+2.22)#8,773 |
| 59. | Marshfield | 13.0% | 9.6%(+3.42)#59 | 10.9%(+2.17)#8,883 |
| 60. | Webster | 12.9% | 9.6%(+3.33)#60 | 10.9%(+2.08)#9,039 |
| 61. | Monson Center | 12.7% | 9.6%(+3.11)#61 | 10.9%(+1.87)#9,432 |
| 62. | Chicopee | 12.6% | 9.6%(+3.03)#62 | 10.9%(+1.79)#9,609 |
| 63. | Nahant | 12.6% | 9.6%(+3.00)#63 | 10.9%(+1.76)#9,668 |
| 64. | Forestdale | 12.6% | 9.6%(+2.97)#64 | 10.9%(+1.73)#9,722 |
| 65. | Winthrop Town | 12.4% | 9.6%(+2.83)#65 | 10.9%(+1.58)#10,069 |
| 66. | Monument Beach | 12.4% | 9.6%(+2.79)#66 | 10.9%(+1.54)#10,146 |
| 67. | Randolph Town | 12.3% | 9.6%(+2.67)#67 | 10.9%(+1.42)#10,391 |
| 68. | Springfield | 12.2% | 9.6%(+2.61)#68 | 10.9%(+1.36)#10,508 |
| 69. | Chelsea | 12.2% | 9.6%(+2.54)#69 | 10.9%(+1.29)#10,663 |
| 70. | Chatham | 12.1% | 9.6%(+2.53)#70 | 10.9%(+1.28)#10,688 |
| 71. | Cordaville | 12.1% | 9.6%(+2.49)#71 | 10.9%(+1.24)#10,771 |
| 72. | Dedham | 12.1% | 9.6%(+2.47)#72 | 10.9%(+1.23)#10,812 |
| 73. | Barre | 12.1% | 9.6%(+2.46)#73 | 10.9%(+1.21)#10,847 |
| 74. | Salem | 12.0% | 9.6%(+2.41)#74 | 10.9%(+1.17)#10,925 |
| 75. | North Attleborough | 11.9% | 9.6%(+2.25)#75 | 10.9%(+1.01)#11,258 |
| 76. | Gardner | 11.8% | 9.6%(+2.15)#76 | 10.9%(+0.901)#11,469 |
| 77. | Taunton | 11.7% | 9.6%(+2.13)#77 | 10.9%(+0.885)#11,497 |
| 78. | Foxborough | 11.7% | 9.6%(+2.10)#78 | 10.9%(+0.857)#11,565 |
| 79. | Attleboro | 11.7% | 9.6%(+2.10)#79 | 10.9%(+0.857)#11,566 |
| 80. | East Falmouth | 11.7% | 9.6%(+2.09)#80 | 10.9%(+0.840)#11,600 |
| 81. | Methuen Town | 11.7% | 9.6%(+2.05)#81 | 10.9%(+0.807)#11,685 |
| 82. | Amesbury Town | 11.6% | 9.6%(+2.04)#82 | 10.9%(+0.788)#11,726 |
| 83. | Harwich Center | 11.6% | 9.6%(+1.96)#83 | 10.9%(+0.708)#11,916 |
| 84. | The Pinehills | 11.5% | 9.6%(+1.93)#84 | 10.9%(+0.684)#11,960 |
| 85. | North Adams | 11.5% | 9.6%(+1.88)#85 | 10.9%(+0.627)#12,104 |
| 86. | Lynn | 11.5% | 9.6%(+1.85)#86 | 10.9%(+0.597)#12,163 |
| 87. | Russell | 11.3% | 9.6%(+1.70)#87 | 10.9%(+0.451)#12,480 |
| 88. | Hingham | 11.3% | 9.6%(+1.66)#88 | 10.9%(+0.417)#12,549 |
| 89. | Brockton | 11.2% | 9.6%(+1.64)#89 | 10.9%(+0.391)#12,613 |
| 90. | Northwest Harwich | 11.2% | 9.6%(+1.63)#90 | 10.9%(+0.380)#12,632 |
| 91. | Fall River | 11.2% | 9.6%(+1.62)#91 | 10.9%(+0.373)#12,648 |
| 92. | Westfield | 11.1% | 9.6%(+1.50)#92 | 10.9%(+0.256)#12,877 |
| 93. | Brewster | 11.1% | 9.6%(+1.49)#93 | 10.9%(+0.238)#12,997 |
| 94. | Milford | 11.1% | 9.6%(+1.48)#94 | 10.9%(+0.227)#13,009 |
| 95. | Haverhill | 11.1% | 9.6%(+1.47)#95 | 10.9%(+0.227)#13,010 |
| 96. | Pinehurst | 11.0% | 9.6%(+1.44)#96 | 10.9%(+0.193)#13,085 |
| 97. | Burlington | 11.0% | 9.6%(+1.42)#97 | 10.9%(+0.169)#13,141 |
| 98. | Holyoke | 11.0% | 9.6%(+1.39)#98 | 10.9%(+0.146)#13,196 |
| 99. | Mattapoisett Center | 11.0% | 9.6%(+1.35)#99 | 10.9%(+0.100)#13,300 |
| 100. | Leominster | 10.9% | 9.6%(+1.33)#100 | 10.9%(+0.080)#13,346 |
Common Questions
What are the Top 10 Cities with the Highest Percentage of Population Employed in Office & Administration in Massachusetts?
Top 10 Cities with the Highest Percentage of Population Employed in Office & Administration in Massachusetts are:
#1
42.3%
#2
26.1%
#3
22.4%
#4
22.0%
#5
21.7%
#6
21.5%
#7
19.5%
#8
19.0%
#9
18.2%
#10
17.7%
What city has the Highest Percentage of Population Employed in Office & Administration in Massachusetts?
Siasconset has the Highest Percentage of Population Employed in Office & Administration in Massachusetts with 42.3%.
What is the Percentage of Population Employed in Office & Administration in the State of Massachusetts?
Percentage of Population Employed in Office & Administration in Massachusetts is 9.6%.
What is the Percentage of Population Employed in Office & Administration in the United States?
Percentage of Population Employed in Office & Administration in the United States is 10.9%.