Cities with the Highest Percentage of Population Employed in Office & Administration in Connecticut
RELATED REPORTS & OPTIONS
Office & Administration
Connecticut
Compare Cities
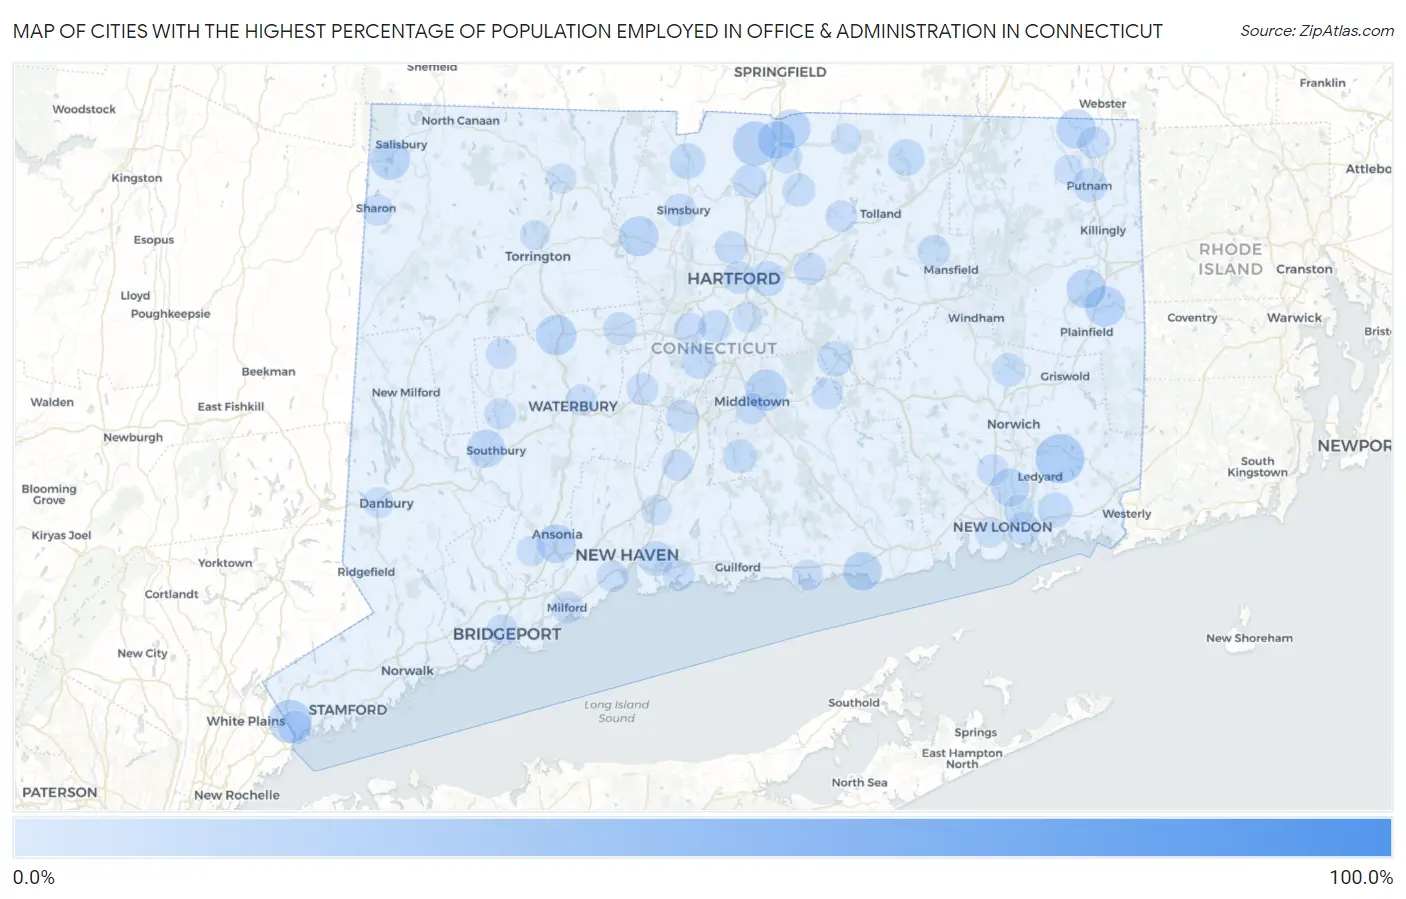
Map of Cities with the Highest Percentage of Population Employed in Office & Administration in Connecticut
0.0%
100.0%
Cities with the Highest Percentage of Population Employed in Office & Administration in Connecticut
| City | % Employed | vs State | vs National | |
| 1. | Dodgingtown | 100.0% | 10.2%(+89.8)#1 | 10.9%(+89.1)#13 |
| 2. | Sherman | 52.2% | 10.2%(+42.0)#2 | 10.9%(+41.3)#189 |
| 3. | Brookfield Center | 33.3% | 10.2%(+23.2)#3 | 10.9%(+22.5)#648 |
| 4. | Lake Bungee | 29.1% | 10.2%(+18.9)#4 | 10.9%(+18.3)#906 |
| 5. | Mashantucket | 28.6% | 10.2%(+18.4)#5 | 10.9%(+17.7)#953 |
| 6. | Dayville | 27.8% | 10.2%(+17.7)#6 | 10.9%(+17.0)#1,017 |
| 7. | Fairfield University | 26.8% | 10.2%(+16.7)#7 | 10.9%(+16.0)#1,122 |
| 8. | Quinnipiac University | 25.1% | 10.2%(+14.9)#8 | 10.9%(+14.2)#1,293 |
| 9. | Candlewood Shores | 24.7% | 10.2%(+14.6)#9 | 10.9%(+13.9)#1,358 |
| 10. | Suffield Depot | 23.8% | 10.2%(+13.7)#10 | 10.9%(+13.0)#1,486 |
| 11. | Witches Woods | 23.3% | 10.2%(+13.2)#11 | 10.9%(+12.5)#1,575 |
| 12. | Glenville | 22.6% | 10.2%(+12.4)#12 | 10.9%(+11.7)#1,720 |
| 13. | Portland | 20.6% | 10.2%(+10.4)#13 | 10.9%(+9.73)#2,224 |
| 14. | Moosup | 20.1% | 10.2%(+9.98)#14 | 10.9%(+9.28)#2,357 |
| 15. | Thomaston | 19.9% | 10.2%(+9.71)#15 | 10.9%(+9.02)#2,473 |
| 16. | Canton Valley | 19.4% | 10.2%(+9.27)#16 | 10.9%(+8.58)#2,634 |
| 17. | Lakeville | 18.9% | 10.2%(+8.76)#17 | 10.9%(+8.07)#2,840 |
| 18. | Wauregan | 18.8% | 10.2%(+8.68)#18 | 10.9%(+7.98)#2,887 |
| 19. | Quinebaug | 18.8% | 10.2%(+8.67)#19 | 10.9%(+7.97)#2,894 |
| 20. | Derby | 18.2% | 10.2%(+8.02)#20 | 10.9%(+7.32)#3,262 |
| 21. | Sherwood Manor | 18.1% | 10.2%(+7.92)#21 | 10.9%(+7.23)#3,296 |
| 22. | Saybrook Manor | 18.0% | 10.2%(+7.89)#22 | 10.9%(+7.19)#3,310 |
| 23. | Danielson Borough | 18.0% | 10.2%(+7.83)#23 | 10.9%(+7.14)#3,346 |
| 24. | Gales Ferry | 17.5% | 10.2%(+7.29)#24 | 10.9%(+6.60)#3,668 |
| 25. | Heritage Village | 17.4% | 10.2%(+7.26)#25 | 10.9%(+6.57)#3,687 |
| 26. | Thompsonville | 17.2% | 10.2%(+7.02)#26 | 10.9%(+6.33)#3,849 |
| 27. | Stratford Downtown | 16.8% | 10.2%(+6.63)#27 | 10.9%(+5.93)#4,111 |
| 28. | West Cornwall | 16.7% | 10.2%(+6.50)#28 | 10.9%(+5.81)#4,231 |
| 29. | Stafford Springs | 16.3% | 10.2%(+6.17)#29 | 10.9%(+5.48)#4,478 |
| 30. | Mill Plain | 16.3% | 10.2%(+6.14)#30 | 10.9%(+5.44)#4,504 |
| 31. | Groton Long Point Borough | 16.0% | 10.2%(+5.85)#31 | 10.9%(+5.16)#4,757 |
| 32. | Salmon Brook | 15.4% | 10.2%(+5.28)#32 | 10.9%(+4.58)#5,369 |
| 33. | Daniels Farm | 15.3% | 10.2%(+5.14)#33 | 10.9%(+4.44)#5,547 |
| 34. | Bigelow Corners | 15.2% | 10.2%(+5.05)#34 | 10.9%(+4.35)#5,631 |
| 35. | Terramuggus | 15.0% | 10.2%(+4.87)#35 | 10.9%(+4.18)#5,826 |
| 36. | East Hartford | 14.7% | 10.2%(+4.58)#36 | 10.9%(+3.89)#6,174 |
| 37. | East Haven | 14.7% | 10.2%(+4.54)#37 | 10.9%(+3.85)#6,237 |
| 38. | Old Mystic | 14.6% | 10.2%(+4.48)#38 | 10.9%(+3.79)#6,311 |
| 39. | Oronoque | 14.6% | 10.2%(+4.42)#39 | 10.9%(+3.73)#6,394 |
| 40. | Kensington | 14.5% | 10.2%(+4.31)#40 | 10.9%(+3.62)#6,550 |
| 41. | Lordship | 14.3% | 10.2%(+4.09)#41 | 10.9%(+3.40)#6,871 |
| 42. | Lakes West | 14.2% | 10.2%(+4.08)#42 | 10.9%(+3.39)#6,880 |
| 43. | Jewett City Borough | 14.1% | 10.2%(+3.94)#43 | 10.9%(+3.24)#7,069 |
| 44. | Candlewood Orchards | 14.0% | 10.2%(+3.79)#44 | 10.9%(+3.10)#7,286 |
| 45. | Putnam | 13.9% | 10.2%(+3.75)#45 | 10.9%(+3.06)#7,349 |
| 46. | Durham | 13.7% | 10.2%(+3.56)#46 | 10.9%(+2.87)#7,642 |
| 47. | Darien Downtown | 13.7% | 10.2%(+3.50)#47 | 10.9%(+2.81)#7,743 |
| 48. | Windsor Locks | 13.6% | 10.2%(+3.43)#48 | 10.9%(+2.74)#7,850 |
| 49. | Baltic | 13.3% | 10.2%(+3.16)#49 | 10.9%(+2.47)#8,359 |
| 50. | Pemberwick | 13.2% | 10.2%(+3.01)#50 | 10.9%(+2.32)#8,594 |
| 51. | Bristol | 13.0% | 10.2%(+2.87)#51 | 10.9%(+2.18)#8,863 |
| 52. | Long Hill | 13.0% | 10.2%(+2.80)#52 | 10.9%(+2.11)#9,003 |
| 53. | Broad Brook | 12.9% | 10.2%(+2.73)#53 | 10.9%(+2.03)#9,126 |
| 54. | Meriden | 12.7% | 10.2%(+2.53)#54 | 10.9%(+1.84)#9,489 |
| 55. | Storrs | 12.6% | 10.2%(+2.40)#55 | 10.9%(+1.71)#9,760 |
| 56. | Blue Hills | 12.5% | 10.2%(+2.38)#56 | 10.9%(+1.68)#9,818 |
| 57. | Hartford | 12.4% | 10.2%(+2.26)#57 | 10.9%(+1.56)#10,098 |
| 58. | Simsbury Center | 12.3% | 10.2%(+2.10)#58 | 10.9%(+1.41)#10,412 |
| 59. | Coleytown | 12.2% | 10.2%(+2.07)#59 | 10.9%(+1.38)#10,475 |
| 60. | Newington | 12.2% | 10.2%(+2.03)#60 | 10.9%(+1.33)#10,577 |
| 61. | Manchester | 12.0% | 10.2%(+1.89)#61 | 10.9%(+1.19)#10,887 |
| 62. | Lake Chaffee | 11.9% | 10.2%(+1.78)#62 | 10.9%(+1.08)#11,097 |
| 63. | New Britain | 11.9% | 10.2%(+1.73)#63 | 10.9%(+1.04)#11,186 |
| 64. | Plantsville | 11.8% | 10.2%(+1.68)#64 | 10.9%(+0.985)#11,298 |
| 65. | Inglenook | 11.8% | 10.2%(+1.66)#65 | 10.9%(+0.965)#11,331 |
| 66. | North Grosvenor Dale | 11.7% | 10.2%(+1.51)#66 | 10.9%(+0.816)#11,663 |
| 67. | Branford Center | 11.7% | 10.2%(+1.49)#67 | 10.9%(+0.797)#11,702 |
| 68. | Milford City Balance | 11.6% | 10.2%(+1.42)#68 | 10.9%(+0.726)#11,878 |
| 69. | Bogus Hill | 11.6% | 10.2%(+1.42)#69 | 10.9%(+0.723)#11,883 |
| 70. | Oxoboxo River | 11.5% | 10.2%(+1.29)#70 | 10.9%(+0.598)#12,160 |
| 71. | Southwood Acres | 11.4% | 10.2%(+1.28)#71 | 10.9%(+0.591)#12,176 |
| 72. | West Haven | 11.4% | 10.2%(+1.20)#72 | 10.9%(+0.510)#12,333 |
| 73. | Wallingford Center | 11.4% | 10.2%(+1.20)#73 | 10.9%(+0.507)#12,340 |
| 74. | Rockville | 11.4% | 10.2%(+1.20)#74 | 10.9%(+0.503)#12,363 |
| 75. | Bridgeport | 11.3% | 10.2%(+1.18)#75 | 10.9%(+0.482)#12,398 |
| 76. | East Hampton | 11.2% | 10.2%(+1.07)#76 | 10.9%(+0.376)#12,641 |
| 77. | Sacred Heart University | 11.2% | 10.2%(+1.06)#77 | 10.9%(+0.366)#12,671 |
| 78. | Murray | 11.2% | 10.2%(+1.06)#78 | 10.9%(+0.365)#12,674 |
| 79. | Woodbury Center | 11.1% | 10.2%(+0.898)#79 | 10.9%(+0.204)#13,062 |
| 80. | Sharon | 11.1% | 10.2%(+0.893)#80 | 10.9%(+0.199)#13,074 |
| 81. | Tashua | 11.0% | 10.2%(+0.881)#81 | 10.9%(+0.187)#13,098 |
| 82. | Middletown | 11.0% | 10.2%(+0.830)#82 | 10.9%(+0.135)#13,223 |
| 83. | Branchville | 10.9% | 10.2%(+0.707)#83 | 10.9%(+0.013)#13,508 |
| 84. | Waterbury | 10.8% | 10.2%(+0.632)#84 | 10.9%(-0.062)#13,682 |
| 85. | Naugatuck Borough | 10.8% | 10.2%(+0.618)#85 | 10.9%(-0.076)#13,717 |
| 86. | Topstone | 10.8% | 10.2%(+0.607)#86 | 10.9%(-0.087)#13,744 |
| 87. | Clinton | 10.6% | 10.2%(+0.482)#87 | 10.9%(-0.212)#14,027 |
| 88. | Bethlehem Village | 10.6% | 10.2%(+0.395)#88 | 10.9%(-0.299)#14,218 |
| 89. | North Haven | 10.5% | 10.2%(+0.310)#89 | 10.9%(-0.384)#14,419 |
| 90. | Danbury | 10.5% | 10.2%(+0.306)#90 | 10.9%(-0.388)#14,425 |
| 91. | Trumbull Center | 10.5% | 10.2%(+0.289)#91 | 10.9%(-0.405)#14,465 |
| 92. | Somers | 10.3% | 10.2%(+0.176)#92 | 10.9%(-0.518)#14,786 |
| 93. | Winsted | 10.3% | 10.2%(+0.149)#93 | 10.9%(-0.545)#14,854 |
| 94. | Waterford | 10.2% | 10.2%(+0.035)#94 | 10.9%(-0.659)#15,121 |
| 95. | Conning Towers Nautilus Park | 10.1% | 10.2%(-0.039)#95 | 10.9%(-0.733)#15,279 |
| 96. | Riverton | 9.9% | 10.2%(-0.294)#96 | 10.9%(-0.988)#15,892 |
| 97. | Torrington | 9.8% | 10.2%(-0.321)#97 | 10.9%(-1.01)#15,962 |
| 98. | Wethersfield | 9.8% | 10.2%(-0.337)#98 | 10.9%(-1.03)#16,005 |
| 99. | South Woodstock | 9.8% | 10.2%(-0.357)#99 | 10.9%(-1.05)#16,043 |
| 100. | Shelton | 9.8% | 10.2%(-0.388)#100 | 10.9%(-1.08)#16,129 |
Common Questions
What are the Top 10 Cities with the Highest Percentage of Population Employed in Office & Administration in Connecticut?
Top 10 Cities with the Highest Percentage of Population Employed in Office & Administration in Connecticut are:
#1
28.6%
#2
23.8%
#3
22.6%
#4
20.6%
#5
20.1%
#6
19.9%
#7
19.4%
#8
18.9%
#9
18.8%
#10
18.8%
What city has the Highest Percentage of Population Employed in Office & Administration in Connecticut?
Mashantucket has the Highest Percentage of Population Employed in Office & Administration in Connecticut with 28.6%.
What is the Percentage of Population Employed in Office & Administration in the State of Connecticut?
Percentage of Population Employed in Office & Administration in Connecticut is 10.2%.
What is the Percentage of Population Employed in Office & Administration in the United States?
Percentage of Population Employed in Office & Administration in the United States is 10.9%.