Cities with the Highest Percentage of Population Employed in Office & Administration in Iowa
RELATED REPORTS & OPTIONS
Office & Administration
Iowa
Compare Cities
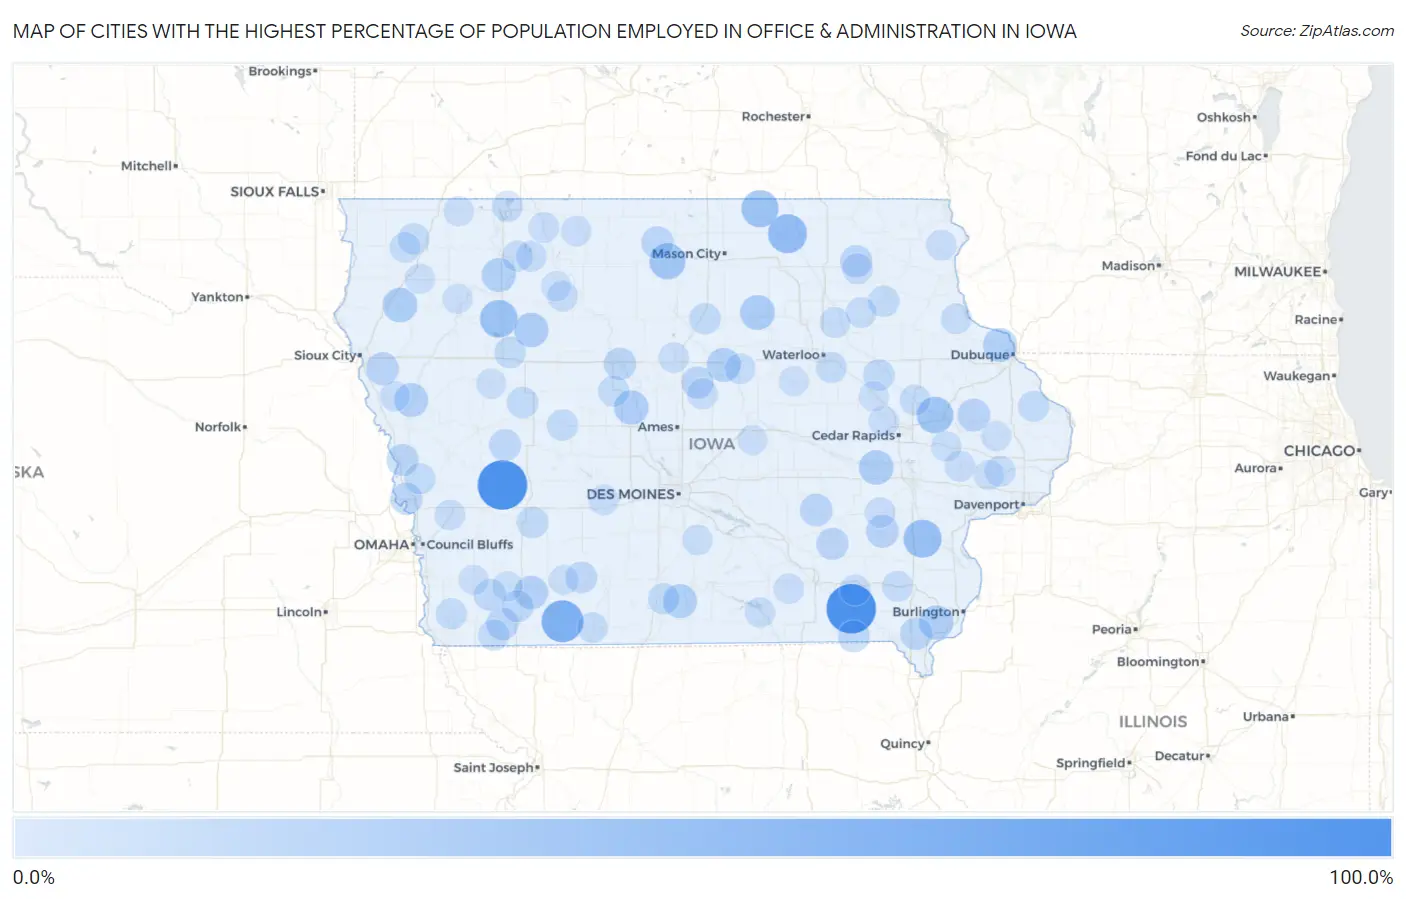
Map of Cities with the Highest Percentage of Population Employed in Office & Administration in Iowa
0.0%
100.0%
Cities with the Highest Percentage of Population Employed in Office & Administration in Iowa
| City | % Employed | vs State | vs National | |
| 1. | Leando | 100.0% | 10.6%(+89.4)#1 | 10.9%(+89.1)#36 |
| 2. | Jacksonville | 100.0% | 10.6%(+89.4)#2 | 10.9%(+89.1)#55 |
| 3. | Conway | 66.7% | 10.6%(+56.0)#3 | 10.9%(+55.8)#102 |
| 4. | Downey | 65.4% | 10.6%(+54.7)#4 | 10.9%(+54.5)#107 |
| 5. | New Haven | 53.3% | 10.6%(+42.7)#5 | 10.9%(+42.5)#174 |
| 6. | Cotter | 50.0% | 10.6%(+39.4)#6 | 10.9%(+39.1)#223 |
| 7. | Truesdale | 48.3% | 10.6%(+37.6)#7 | 10.9%(+37.4)#245 |
| 8. | Toeterville | 46.7% | 10.6%(+36.0)#8 | 10.9%(+35.8)#265 |
| 9. | Stone City | 43.6% | 10.6%(+33.0)#9 | 10.9%(+32.8)#320 |
| 10. | Duncan | 42.9% | 10.6%(+32.2)#10 | 10.9%(+32.0)#338 |
| 11. | Bristow | 36.8% | 10.6%(+26.2)#11 | 10.9%(+26.0)#502 |
| 12. | Oyens | 36.2% | 10.6%(+25.6)#12 | 10.9%(+25.4)#529 |
| 13. | Homestead | 35.7% | 10.6%(+25.1)#13 | 10.9%(+24.9)#545 |
| 14. | Varina | 35.3% | 10.6%(+24.7)#14 | 10.9%(+24.4)#567 |
| 15. | Sperry | 35.2% | 10.6%(+24.5)#15 | 10.9%(+24.3)#570 |
| 16. | Pilot Mound | 34.4% | 10.6%(+23.8)#16 | 10.9%(+23.6)#599 |
| 17. | Denmark | 34.4% | 10.6%(+23.8)#17 | 10.9%(+23.6)#602 |
| 18. | Rossie | 33.3% | 10.6%(+22.7)#18 | 10.9%(+22.5)#655 |
| 19. | Rodney | 33.3% | 10.6%(+22.7)#19 | 10.9%(+22.5)#658 |
| 20. | Owasa | 33.3% | 10.6%(+22.7)#20 | 10.9%(+22.5)#674 |
| 21. | Durango | 33.3% | 10.6%(+22.7)#21 | 10.9%(+22.5)#678 |
| 22. | Le Roy | 33.3% | 10.6%(+22.7)#22 | 10.9%(+22.5)#683 |
| 23. | Nodaway | 31.8% | 10.6%(+21.2)#23 | 10.9%(+21.0)#742 |
| 24. | Bronson | 29.1% | 10.6%(+18.4)#24 | 10.9%(+18.2)#914 |
| 25. | West Chester | 28.8% | 10.6%(+18.1)#25 | 10.9%(+17.9)#940 |
| 26. | Onslow | 28.3% | 10.6%(+17.7)#26 | 10.9%(+17.5)#978 |
| 27. | Gibson | 27.8% | 10.6%(+17.1)#27 | 10.9%(+16.9)#1,030 |
| 28. | Yorktown | 27.3% | 10.6%(+16.6)#28 | 10.9%(+16.4)#1,084 |
| 29. | Crystal Lake | 27.2% | 10.6%(+16.6)#29 | 10.9%(+16.3)#1,086 |
| 30. | Franklin | 26.9% | 10.6%(+16.3)#30 | 10.9%(+16.1)#1,113 |
| 31. | Coalville | 26.7% | 10.6%(+16.1)#31 | 10.9%(+15.8)#1,133 |
| 32. | Jackson Junction | 26.3% | 10.6%(+15.7)#32 | 10.9%(+15.5)#1,178 |
| 33. | California Junction | 26.1% | 10.6%(+15.5)#33 | 10.9%(+15.2)#1,197 |
| 34. | Hayesville | 25.9% | 10.6%(+15.3)#34 | 10.9%(+15.1)#1,207 |
| 35. | Little Sioux | 25.5% | 10.6%(+14.9)#35 | 10.9%(+14.6)#1,257 |
| 36. | Radcliffe | 25.5% | 10.6%(+14.8)#36 | 10.9%(+14.6)#1,262 |
| 37. | Coburg | 25.0% | 10.6%(+14.4)#37 | 10.9%(+14.1)#1,323 |
| 38. | Aspinwall | 25.0% | 10.6%(+14.4)#38 | 10.9%(+14.1)#1,328 |
| 39. | Hepburn | 25.0% | 10.6%(+14.4)#39 | 10.9%(+14.1)#1,334 |
| 40. | Cantril | 24.3% | 10.6%(+13.7)#40 | 10.9%(+13.4)#1,418 |
| 41. | Cromwell | 24.1% | 10.6%(+13.5)#41 | 10.9%(+13.3)#1,443 |
| 42. | Wiota | 23.5% | 10.6%(+12.9)#42 | 10.9%(+12.7)#1,552 |
| 43. | Coulter | 23.2% | 10.6%(+12.5)#43 | 10.9%(+12.3)#1,608 |
| 44. | Nemaha | 22.9% | 10.6%(+12.2)#44 | 10.9%(+12.0)#1,662 |
| 45. | Weldon | 22.9% | 10.6%(+12.2)#45 | 10.9%(+12.0)#1,663 |
| 46. | Rowley | 22.8% | 10.6%(+12.1)#46 | 10.9%(+11.9)#1,676 |
| 47. | Breda | 22.7% | 10.6%(+12.1)#47 | 10.9%(+11.8)#1,694 |
| 48. | Ralston | 22.6% | 10.6%(+11.9)#48 | 10.9%(+11.7)#1,717 |
| 49. | Harcourt | 22.5% | 10.6%(+11.9)#49 | 10.9%(+11.7)#1,726 |
| 50. | Fayette | 22.4% | 10.6%(+11.8)#50 | 10.9%(+11.6)#1,756 |
| 51. | Springbrook | 22.0% | 10.6%(+11.4)#51 | 10.9%(+11.2)#1,837 |
| 52. | Matlock | 22.0% | 10.6%(+11.3)#52 | 10.9%(+11.1)#1,852 |
| 53. | Coin | 21.8% | 10.6%(+11.2)#53 | 10.9%(+10.9)#1,888 |
| 54. | Anderson | 21.7% | 10.6%(+11.1)#54 | 10.9%(+10.9)#1,905 |
| 55. | Washburn | 21.7% | 10.6%(+11.0)#55 | 10.9%(+10.8)#1,922 |
| 56. | Magnolia | 21.6% | 10.6%(+11.0)#56 | 10.9%(+10.8)#1,931 |
| 57. | Dixon | 21.3% | 10.6%(+10.6)#57 | 10.9%(+10.4)#2,025 |
| 58. | Rome | 21.3% | 10.6%(+10.6)#58 | 10.9%(+10.4)#2,028 |
| 59. | Libertyville | 21.1% | 10.6%(+10.4)#59 | 10.9%(+10.2)#2,079 |
| 60. | Garden City | 21.1% | 10.6%(+10.4)#60 | 10.9%(+10.2)#2,087 |
| 61. | Tipton | 21.0% | 10.6%(+10.3)#61 | 10.9%(+10.1)#2,111 |
| 62. | Steamboat Rock | 20.9% | 10.6%(+10.2)#62 | 10.9%(+10.0)#2,134 |
| 63. | Dickens | 20.8% | 10.6%(+10.2)#63 | 10.9%(+9.98)#2,145 |
| 64. | Waucoma | 20.7% | 10.6%(+10.1)#64 | 10.9%(+9.87)#2,182 |
| 65. | Orleans | 20.6% | 10.6%(+10.00)#65 | 10.9%(+9.78)#2,208 |
| 66. | Westgate | 20.6% | 10.6%(+9.95)#66 | 10.9%(+9.73)#2,228 |
| 67. | Central City | 20.6% | 10.6%(+9.93)#67 | 10.9%(+9.71)#2,232 |
| 68. | Ruthven | 20.5% | 10.6%(+9.91)#68 | 10.9%(+9.69)#2,238 |
| 69. | Boyden | 20.5% | 10.6%(+9.90)#69 | 10.9%(+9.68)#2,239 |
| 70. | Lowell | 20.5% | 10.6%(+9.82)#70 | 10.9%(+9.60)#2,265 |
| 71. | Readlyn | 20.1% | 10.6%(+9.41)#71 | 10.9%(+9.19)#2,386 |
| 72. | Osterdock | 20.0% | 10.6%(+9.36)#72 | 10.9%(+9.14)#2,421 |
| 73. | Plover | 20.0% | 10.6%(+9.36)#73 | 10.9%(+9.14)#2,429 |
| 74. | Benton | 20.0% | 10.6%(+9.36)#74 | 10.9%(+9.14)#2,439 |
| 75. | Ringsted | 19.9% | 10.6%(+9.28)#75 | 10.9%(+9.06)#2,461 |
| 76. | Diamondhead Lake | 19.9% | 10.6%(+9.25)#76 | 10.9%(+9.03)#2,470 |
| 77. | Wallingford | 19.8% | 10.6%(+9.12)#77 | 10.9%(+8.90)#2,519 |
| 78. | Waterville | 19.7% | 10.6%(+9.08)#78 | 10.9%(+8.86)#2,530 |
| 79. | Neola | 19.6% | 10.6%(+9.01)#79 | 10.9%(+8.79)#2,553 |
| 80. | Palo | 19.6% | 10.6%(+9.00)#80 | 10.9%(+8.78)#2,555 |
| 81. | Wellman | 19.2% | 10.6%(+8.60)#81 | 10.9%(+8.38)#2,700 |
| 82. | Blakesburg | 19.1% | 10.6%(+8.46)#82 | 10.9%(+8.24)#2,764 |
| 83. | Milo | 19.1% | 10.6%(+8.44)#83 | 10.9%(+8.22)#2,767 |
| 84. | Blairsburg | 19.0% | 10.6%(+8.41)#84 | 10.9%(+8.19)#2,782 |
| 85. | Rathbun | 19.0% | 10.6%(+8.41)#85 | 10.9%(+8.19)#2,792 |
| 86. | Mechanicsville | 18.9% | 10.6%(+8.28)#86 | 10.9%(+8.06)#2,843 |
| 87. | Hornick | 18.8% | 10.6%(+8.16)#87 | 10.9%(+7.94)#2,917 |
| 88. | Granville | 18.6% | 10.6%(+7.93)#88 | 10.9%(+7.72)#3,040 |
| 89. | Haverhill | 18.5% | 10.6%(+7.84)#89 | 10.9%(+7.62)#3,091 |
| 90. | New Liberty | 18.5% | 10.6%(+7.84)#90 | 10.9%(+7.62)#3,092 |
| 91. | Stanton | 18.4% | 10.6%(+7.76)#91 | 10.9%(+7.54)#3,134 |
| 92. | Ocheyedan | 18.4% | 10.6%(+7.75)#92 | 10.9%(+7.53)#3,138 |
| 93. | Reinbeck | 18.3% | 10.6%(+7.68)#93 | 10.9%(+7.46)#3,169 |
| 94. | Emerson | 18.2% | 10.6%(+7.55)#94 | 10.9%(+7.33)#3,226 |
| 95. | Prescott | 18.2% | 10.6%(+7.55)#95 | 10.9%(+7.33)#3,232 |
| 96. | Mallard | 18.1% | 10.6%(+7.46)#96 | 10.9%(+7.24)#3,291 |
| 97. | Larrabee | 18.1% | 10.6%(+7.44)#97 | 10.9%(+7.22)#3,301 |
| 98. | Odebolt | 18.0% | 10.6%(+7.35)#98 | 10.9%(+7.13)#3,349 |
| 99. | Urbana | 17.9% | 10.6%(+7.28)#99 | 10.9%(+7.06)#3,391 |
| 100. | Lost Nation | 17.9% | 10.6%(+7.26)#100 | 10.9%(+7.04)#3,402 |
Common Questions
What are the Top 10 Cities with the Highest Percentage of Population Employed in Office & Administration in Iowa?
Top 10 Cities with the Highest Percentage of Population Employed in Office & Administration in Iowa are:
#1
100.0%
#2
100.0%
#3
66.7%
#4
53.3%
#5
50.0%
#6
48.3%
#7
46.7%
#8
43.6%
#9
42.9%
#10
36.8%
What city has the Highest Percentage of Population Employed in Office & Administration in Iowa?
Leando has the Highest Percentage of Population Employed in Office & Administration in Iowa with 100.0%.
What is the Percentage of Population Employed in Office & Administration in the State of Iowa?
Percentage of Population Employed in Office & Administration in Iowa is 10.6%.
What is the Percentage of Population Employed in Office & Administration in the United States?
Percentage of Population Employed in Office & Administration in the United States is 10.9%.