Cities with the Highest Percentage of Population Employed in Office & Administration in Michigan
RELATED REPORTS & OPTIONS
Office & Administration
Michigan
Compare Cities
Map of Cities with the Highest Percentage of Population Employed in Office & Administration in Michigan
0.0%
80.0%
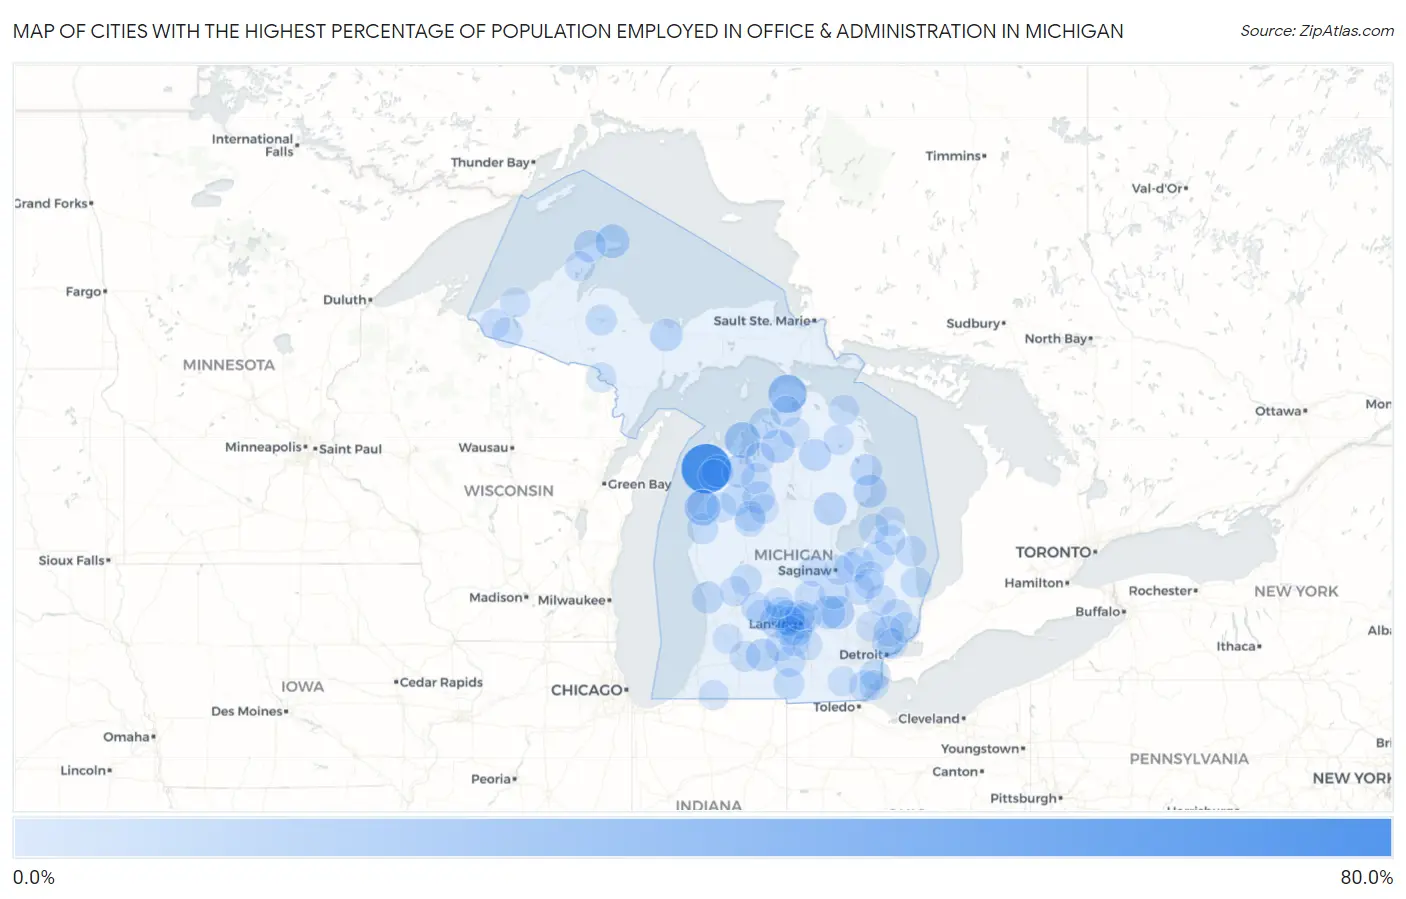
Cities with the Highest Percentage of Population Employed in Office & Administration in Michigan
| City | % Employed | vs State | vs National | |
| 1. | Crystal Downs Country Club | 70.0% | 10.8%(+59.2)#1 | 10.9%(+59.1)#88 |
| 2. | Trufant | 50.2% | 10.8%(+39.4)#2 | 10.9%(+39.3)#201 |
| 3. | Pelkie | 42.1% | 10.8%(+31.3)#3 | 10.9%(+31.2)#357 |
| 4. | Naubinway | 38.1% | 10.8%(+27.3)#4 | 10.9%(+27.2)#470 |
| 5. | Levering | 37.5% | 10.8%(+26.7)#5 | 10.9%(+26.6)#485 |
| 6. | Filer City | 31.2% | 10.8%(+20.4)#6 | 10.9%(+20.3)#779 |
| 7. | Omena | 30.8% | 10.8%(+20.0)#7 | 10.9%(+19.9)#796 |
| 8. | Grand Marais | 26.0% | 10.8%(+15.2)#8 | 10.9%(+15.2)#1,200 |
| 9. | Copper Harbor | 25.9% | 10.8%(+15.1)#9 | 10.9%(+15.1)#1,206 |
| 10. | Eagle | 25.8% | 10.8%(+15.0)#10 | 10.9%(+15.0)#1,218 |
| 11. | Gaines | 25.0% | 10.8%(+14.2)#11 | 10.9%(+14.1)#1,302 |
| 12. | Alba | 24.7% | 10.8%(+13.9)#12 | 10.9%(+13.8)#1,361 |
| 13. | Eureka | 24.6% | 10.8%(+13.8)#13 | 10.9%(+13.7)#1,378 |
| 14. | Bancroft | 24.4% | 10.8%(+13.6)#14 | 10.9%(+13.5)#1,400 |
| 15. | Oscoda | 24.0% | 10.8%(+13.2)#15 | 10.9%(+13.2)#1,455 |
| 16. | Sunfield | 23.3% | 10.8%(+12.5)#16 | 10.9%(+12.4)#1,588 |
| 17. | Edgemont Park | 23.1% | 10.8%(+12.3)#17 | 10.9%(+12.2)#1,616 |
| 18. | Springfield | 22.7% | 10.8%(+11.9)#18 | 10.9%(+11.9)#1,691 |
| 19. | Skidway Lake | 22.7% | 10.8%(+11.9)#19 | 10.9%(+11.8)#1,692 |
| 20. | Rock | 22.5% | 10.8%(+11.7)#20 | 10.9%(+11.6)#1,750 |
| 21. | Chums Corner | 22.2% | 10.8%(+11.4)#21 | 10.9%(+11.4)#1,786 |
| 22. | Chatham | 22.2% | 10.8%(+11.4)#22 | 10.9%(+11.4)#1,798 |
| 23. | Dimondale | 22.1% | 10.8%(+11.3)#23 | 10.9%(+11.2)#1,827 |
| 24. | Eagle River | 21.4% | 10.8%(+10.6)#24 | 10.9%(+10.6)#1,988 |
| 25. | Crystal | 21.3% | 10.8%(+10.5)#25 | 10.9%(+10.4)#2,023 |
| 26. | Jennings | 21.2% | 10.8%(+10.4)#26 | 10.9%(+10.3)#2,051 |
| 27. | Lewiston | 20.9% | 10.8%(+10.1)#27 | 10.9%(+10.1)#2,124 |
| 28. | Spring Lake | 20.8% | 10.8%(+10.00)#28 | 10.9%(+9.95)#2,158 |
| 29. | Lincoln | 20.7% | 10.8%(+9.92)#29 | 10.9%(+9.88)#2,179 |
| 30. | Honor | 20.7% | 10.8%(+9.88)#30 | 10.9%(+9.83)#2,191 |
| 31. | Brimley | 20.5% | 10.8%(+9.74)#31 | 10.9%(+9.69)#2,237 |
| 32. | West Monroe | 19.7% | 10.8%(+8.90)#32 | 10.9%(+8.85)#2,531 |
| 33. | Armada | 19.6% | 10.8%(+8.79)#33 | 10.9%(+8.74)#2,572 |
| 34. | Harrietta | 19.4% | 10.8%(+8.55)#34 | 10.9%(+8.50)#2,659 |
| 35. | Portland | 19.3% | 10.8%(+8.47)#35 | 10.9%(+8.42)#2,688 |
| 36. | Ironton | 19.2% | 10.8%(+8.42)#36 | 10.9%(+8.37)#2,705 |
| 37. | Sand Lake | 19.0% | 10.8%(+8.17)#37 | 10.9%(+8.12)#2,811 |
| 38. | Hartland | 19.0% | 10.8%(+8.16)#38 | 10.9%(+8.11)#2,816 |
| 39. | Albion | 18.7% | 10.8%(+7.90)#39 | 10.9%(+7.86)#2,969 |
| 40. | Lexington | 18.7% | 10.8%(+7.89)#40 | 10.9%(+7.84)#2,976 |
| 41. | Benzonia | 18.6% | 10.8%(+7.79)#41 | 10.9%(+7.74)#3,026 |
| 42. | Allen | 18.6% | 10.8%(+7.76)#42 | 10.9%(+7.72)#3,041 |
| 43. | Scottville | 18.6% | 10.8%(+7.74)#43 | 10.9%(+7.69)#3,050 |
| 44. | Center Line | 18.5% | 10.8%(+7.65)#44 | 10.9%(+7.60)#3,109 |
| 45. | Rockwood | 18.3% | 10.8%(+7.51)#45 | 10.9%(+7.46)#3,170 |
| 46. | Michigamme | 18.3% | 10.8%(+7.50)#46 | 10.9%(+7.45)#3,171 |
| 47. | Rockland | 18.2% | 10.8%(+7.37)#47 | 10.9%(+7.33)#3,238 |
| 48. | Forestville | 18.2% | 10.8%(+7.37)#48 | 10.9%(+7.33)#3,242 |
| 49. | Reese | 18.2% | 10.8%(+7.35)#49 | 10.9%(+7.30)#3,268 |
| 50. | Cass City | 18.2% | 10.8%(+7.34)#50 | 10.9%(+7.29)#3,269 |
| 51. | Fife Lake | 18.1% | 10.8%(+7.27)#51 | 10.9%(+7.22)#3,298 |
| 52. | Painesdale | 18.0% | 10.8%(+7.24)#52 | 10.9%(+7.19)#3,311 |
| 53. | Eastwood | 18.0% | 10.8%(+7.21)#53 | 10.9%(+7.16)#3,335 |
| 54. | Clarksville | 18.0% | 10.8%(+7.18)#54 | 10.9%(+7.13)#3,350 |
| 55. | Elsie | 17.8% | 10.8%(+7.04)#55 | 10.9%(+6.99)#3,427 |
| 56. | New Lothrop | 17.8% | 10.8%(+7.00)#56 | 10.9%(+6.95)#3,447 |
| 57. | Le Roy | 17.8% | 10.8%(+6.97)#57 | 10.9%(+6.92)#3,468 |
| 58. | Tustin | 17.8% | 10.8%(+6.95)#58 | 10.9%(+6.90)#3,480 |
| 59. | Ponshewaing | 17.6% | 10.8%(+6.84)#59 | 10.9%(+6.79)#3,544 |
| 60. | Bad Axe | 17.4% | 10.8%(+6.58)#60 | 10.9%(+6.53)#3,721 |
| 61. | Rogers City | 17.3% | 10.8%(+6.51)#61 | 10.9%(+6.47)#3,752 |
| 62. | Utica | 17.3% | 10.8%(+6.48)#62 | 10.9%(+6.43)#3,777 |
| 63. | Merrill | 17.2% | 10.8%(+6.35)#63 | 10.9%(+6.30)#3,869 |
| 64. | Bath | 17.1% | 10.8%(+6.27)#64 | 10.9%(+6.22)#3,918 |
| 65. | Attica | 17.1% | 10.8%(+6.25)#65 | 10.9%(+6.20)#3,933 |
| 66. | Lake Angelus | 17.0% | 10.8%(+6.23)#66 | 10.9%(+6.18)#3,949 |
| 67. | Hillman | 17.0% | 10.8%(+6.22)#67 | 10.9%(+6.17)#3,954 |
| 68. | Eastpointe | 17.0% | 10.8%(+6.21)#68 | 10.9%(+6.16)#3,965 |
| 69. | Caseville | 16.9% | 10.8%(+6.12)#69 | 10.9%(+6.07)#4,030 |
| 70. | Marenisco | 16.9% | 10.8%(+6.08)#70 | 10.9%(+6.03)#4,056 |
| 71. | Lowell | 16.8% | 10.8%(+5.98)#71 | 10.9%(+5.93)#4,115 |
| 72. | Rapid City | 16.7% | 10.8%(+5.93)#72 | 10.9%(+5.88)#4,147 |
| 73. | New Baltimore | 16.7% | 10.8%(+5.91)#73 | 10.9%(+5.86)#4,154 |
| 74. | Fairgrove | 16.7% | 10.8%(+5.86)#74 | 10.9%(+5.81)#4,186 |
| 75. | Millers Lake | 16.7% | 10.8%(+5.86)#75 | 10.9%(+5.81)#4,188 |
| 76. | Eastlake | 16.7% | 10.8%(+5.86)#76 | 10.9%(+5.81)#4,195 |
| 77. | Otisville | 16.6% | 10.8%(+5.82)#77 | 10.9%(+5.77)#4,254 |
| 78. | Sparta | 16.6% | 10.8%(+5.78)#78 | 10.9%(+5.73)#4,275 |
| 79. | Buena Vista | 16.6% | 10.8%(+5.76)#79 | 10.9%(+5.71)#4,290 |
| 80. | Hubbell | 16.4% | 10.8%(+5.58)#80 | 10.9%(+5.53)#4,433 |
| 81. | Olivet | 16.4% | 10.8%(+5.56)#81 | 10.9%(+5.51)#4,444 |
| 82. | Wakefield | 16.3% | 10.8%(+5.53)#82 | 10.9%(+5.48)#4,475 |
| 83. | Port Austin | 16.3% | 10.8%(+5.47)#83 | 10.9%(+5.42)#4,523 |
| 84. | Mayville | 16.3% | 10.8%(+5.46)#84 | 10.9%(+5.41)#4,543 |
| 85. | Fostoria | 16.2% | 10.8%(+5.42)#85 | 10.9%(+5.37)#4,574 |
| 86. | Eaton Rapids | 16.2% | 10.8%(+5.39)#86 | 10.9%(+5.34)#4,599 |
| 87. | Grand Ledge | 16.2% | 10.8%(+5.36)#87 | 10.9%(+5.31)#4,628 |
| 88. | Mcbain | 16.2% | 10.8%(+5.35)#88 | 10.9%(+5.30)#4,634 |
| 89. | Iron Mountain | 16.2% | 10.8%(+5.35)#89 | 10.9%(+5.30)#4,636 |
| 90. | White Pine | 16.1% | 10.8%(+5.29)#90 | 10.9%(+5.25)#4,682 |
| 91. | Edwardsburg | 16.1% | 10.8%(+5.29)#91 | 10.9%(+5.24)#4,684 |
| 92. | Potterville | 16.1% | 10.8%(+5.26)#92 | 10.9%(+5.21)#4,716 |
| 93. | Leslie | 16.1% | 10.8%(+5.24)#93 | 10.9%(+5.19)#4,731 |
| 94. | Britton | 16.0% | 10.8%(+5.23)#94 | 10.9%(+5.18)#4,738 |
| 95. | Wellston | 16.0% | 10.8%(+5.19)#95 | 10.9%(+5.14)#4,776 |
| 96. | Stony Point | 15.9% | 10.8%(+5.13)#96 | 10.9%(+5.09)#4,843 |
| 97. | Dewitt | 15.9% | 10.8%(+5.13)#97 | 10.9%(+5.08)#4,852 |
| 98. | Vanderbilt | 15.9% | 10.8%(+5.09)#98 | 10.9%(+5.04)#4,890 |
| 99. | Allegan | 15.9% | 10.8%(+5.06)#99 | 10.9%(+5.01)#4,919 |
| 100. | Muir | 15.8% | 10.8%(+5.04)#100 | 10.9%(+4.99)#4,940 |
Common Questions
What are the Top 10 Cities with the Highest Percentage of Population Employed in Office & Administration in Michigan?
Top 10 Cities with the Highest Percentage of Population Employed in Office & Administration in Michigan are:
#1
70.0%
#2
37.5%
#3
31.2%
#4
30.8%
#5
25.9%
#6
25.8%
#7
25.0%
#8
24.7%
#9
24.4%
#10
24.0%
What city has the Highest Percentage of Population Employed in Office & Administration in Michigan?
Crystal Downs Country Club has the Highest Percentage of Population Employed in Office & Administration in Michigan with 70.0%.
What is the Percentage of Population Employed in Office & Administration in the State of Michigan?
Percentage of Population Employed in Office & Administration in Michigan is 10.8%.
What is the Percentage of Population Employed in Office & Administration in the United States?
Percentage of Population Employed in Office & Administration in the United States is 10.9%.